Article

Incentive-Compatible Mechanism Design for Medium- and Long-Term/Spot Market Coordination in High-Penetration Renewable Energy Systems

by
Sicong Wang
,
Weiqing Wang
*,
Sizhe Yan
and
Qiuying Li
Engineering Research Center of Ministry of Education for Renewable Energy Generation and Grid Connection Technology, Xinjiang University, Urumqi 830047, China
*
Author to whom correspondence should be addressed.
Processes 2025, 13(8), 2478; https://doi.org/10.3390/pr13082478
Submission received: 7 July 2025 / Revised: 29 July 2025 / Accepted: 31 July 2025 / Published: 6 August 2025
(This article belongs to the Section Energy Systems)

Abstract

In line with the goals of “peak carbon emissions and carbon neutrality”, this study aims to develop a market-coordinated operation mechanism to promote renewable energy adoption and consumption, addressing the challenges of integrating medium- and long-term trading with spot markets in power systems with high renewable energy penetration. A three-stage joint operation framework is proposed. First, a medium- and long-term trading game model is established, considering multiple energy types to optimize the benefits of market participants. Second, machine learning algorithms are employed to predict renewable energy output, and a contract decomposition mechanism is developed to ensure a smooth transition from medium- and long-term contracts to real-time market operations. Finally, a day-ahead market-clearing strategy and an incentive-compatible settlement mechanism, incorporating the constraints from contract decomposition, are proposed to link the two markets effectively. Simulation results demonstrate that the proposed mechanism effectively enhances resource allocation and stabilizes market operations, leading to significant revenue improvements across various generation units and increased renewable energy utilization. Specifically, thermal power units achieve a 19.12% increase in revenue, while wind and photovoltaic units show more substantial gains of 38.76% and 47.52%, respectively. Concurrently, the mechanism drives a 10.61% increase in renewable energy absorption capacity and yields a 13.47% improvement in Tradable Green Certificate (TGC) utilization efficiency, confirming its overall effectiveness. This research shows that coordinated optimization between medium- and long-term/spot markets, combined with a well-designed settlement mechanism, significantly strengthens the market competitiveness of renewable energy, providing theoretical support for the market-based operation of the new power system.

1. Introduction

Under the strategic framework of “Carbon Peaking and Carbon Neutrality”, developing new power systems with high renewable energy penetration has become an inevitable direction for future energy systems [1,2,3]. However, the inherent variability and uncertainty of renewable energy, combined with the demands for large-scale interprovincial transmission and optimized cross-regional resource allocation, pose significant challenges to provincial electricity medium- and long-term transactions and overall power system security. To ensure supply security and enhance the integration of renewable energy, it is essential to unlock the optimization potential of regional resource allocation and strengthen coordination among market participants through advanced trading platforms. This requires two key advancements. First, it is necessary to move beyond traditional medium- and long-term electricity trading paradigms to fundamentally improve the spatiotemporal optimization of renewable energy allocation. This will enable the more flexible and efficient operation of power systems with high renewable penetration. Second, as emphasized in the March 2015 directive from the Central Committee of the Communist Party of China and the State Council, Several Opinions on Further Deepening Power System Reform (Document No. 9 [2015]) [4], cross-provincial electricity trading must be promoted. Currently, China’s electricity market transactions are predominantly focused on the medium and long term, yet there is no hierarchical relationship between medium- and long-term markets and spot markets. Effectively integrating transaction constraints on renewable energy volumes from medium- and long-term contracts into short-term dispatch models, and aligning contracted energy with day-ahead market clearing, will facilitate renewable energy accommodation over extended time horizons.
China’s current interprovincial medium- and long-term electricity transactions primarily rely on bilateral negotiations and centralized trading mechanisms, enabling wholesale energy trading across multi-year, multi-month, and intra-month timescales. Within this framework, achieving seamless coordination between medium-term or long-term markets and spot markets remains a critical challenge in the ongoing development of power markets [5,6]. To ensure a smooth transition between contracted energy volumes and spot market dispatch schedules, it is essential to systematically decompose medium- and long-term contract energy across multiple temporal resolutions. This highlights the urgent need to develop renewable-adaptive contract energy decomposition methodologies that effectively address the interface challenges between medium-term or long-term commitments and day-ahead market clearing processes. Such research is crucial for advancing China’s electricity market reforms, particularly by improving the operational alignment between financial contracts and physical power delivery systems.
Existing research on medium- and long-term contract energy decomposition can be broadly categorized into two approaches—rolling correction methods and optimization-based frameworks [7]. For example, Xing Y et al. [8] developed a rolling correction model that minimizes start-up costs and energy schedule deviations to break down annual contracts into daily allocations. In another study, He L et al. [9] introduced differentiated decomposition strategies for thermal and renewable energy contracts based on renewable penetration levels, applying rolling corrections to reduce contract fulfillment deviations and curtailment rates. As the field has progressed, optimization models have become increasingly popular for use in decomposition tasks. Miao S et al. [10] proposed a quadratic programming model to align unit-level contract fulfillment progress, embedding it as an operational constraint to ensure fairness in short-term dispatch. However, these approaches mainly focus on conventional generation units and become less effective when applied to systems with high renewable penetration. At elevated levels of renewable integration, such methods are ineffective in capturing the variability-induced impacts on power balance, leading to the weakened coordination of decomposition outcomes. To better address renewable volatility, Xu Y et al. [11] proposed a decomposition methodology for renewable energy contracts that incorporates time-series production simulations alongside comprehensive day-ahead physical constraints. In another study, Zhao S et al. [12] established renewable energy decomposition models utilizing both energy forecasting and production simulation techniques.
Fan W et al. [13] proposed a two-level trading model with medium- and long-term power markets and a day-ahead market to optimize the profit on the generation side, and Xu Y et al. [14] studied the impacts with and without medium- and long-term trading restrictions on the decisions of electricity sales companies in the spot context. Do Prado J C et al. [15] developed a multi-stage stochastic optimal power purchase decision model for electricity sales companies to participate in the day-ahead and real-time markets, which explored the impacts of market price and demand differences on the power purchase strategies of electricity sales companies. However, forecasting methods often overlook coordination with short-term operational strategies, while production simulations can suffer from excessive computational complexity.
The literature review identifies critical research gaps: current medium- and long-term contract decomposition methods insufficiently address the stochastic nature of renewable energy generation, and overlook operational risks caused by renewable volatility and their low marginal cost characteristics within multi-tiered market coordination. This gap undermines the secure transition between medium- and long-term commitments and spot market dispatch schedules. To overcome these limitations, this study systematically categorizes existing trading mechanisms and proposes an integrated framework for coordinated multi-energy participation in dual-market operations, explicitly incorporating renewable-specific operational constraints.

2. Three-Phase Integrated Framework for Coordinated Medium- and Long-Term/Spot Market Operations

To promote the comprehensive market integration of renewable energy, this paper develops an operational strategy for provincial medium- and long-term electricity markets that includes both renewable and conventional generation units while explicitly accounting for renewable energy uncertainties. The proposed three-phase coordinated market simulation framework (illustrated in Figure 1) enables the dynamic coupling of financial–physical markets through rigorous variable chaining [16].
The proposed three-phase coordinated market simulation framework (illustrated in Figure 1) facilitates the market participation of renewable energy through the systematic integration of financial and physical markets. This is done in three phases.
Phase I—The provincial trading center forms a generation alliance by uniting various energy generation units within the province to participate in the medium- and long-term market. The provincial trading center performs the following functions:
(1)
Aggregating information on different types of generation units within the Alliance, the load of quota-bearing entities, and TGC demand;
(2)
Monitoring quota policy compliance and TGC settlement.
A Stackelberg game-theoretic decision model is established between the generation alliance and quota-bound entities. The model optimizes participant benefits via bilevel programming to obtain contracted energy volumes, TGC quantities, and clearing prices.
Phase II—This study employs the machine learning Random Forest Regression (RFR) algorithm to forecast renewable energy output. The model comprehensively integrates multidimensional meteorological features—including temperature, wind speed, and solar irradiance—along with historical operational data to accurately capture the temporal volatility characteristics of renewable energy. Using the medium- and long-term contracted energy volumes and TGC quantities generated from the first-phase game-theoretic optimization as key inputs, a convex optimization model decomposes these into daily executable schedules that satisfy unit operational constraints. This ensures both the physical executability of medium- and long-term contracts under renewable energy output uncertainty and their coordinated execution across multiple timescales.
Phase III. The decomposed medium- and long-term contract results from Phase II are incorporated as binding constraints into the day-ahead market clearing process. With the objective of minimizing day-ahead procurement costs, this phase formulates unit dispatch schedules that rigorously enforce the physical delivery requirements of forward contracts, thereby effectively linking the two market tiers. Concurrently, a Vickrey–Clarke–Groves (VCG) mechanism-based settlement system is implemented to reveal the true marginal value contributions of heterogeneous generation assets within the system [17].

3. Three-Phase Coordinated Operational Decision-Making Model for Medium- and Long-Term/Spot Markets

3.1. Phase I: Stackelberg Game-Based Medium- and Long-Term Market Transaction Model

This section examines the medium- and long-term trading strategies between the provincial generation alliance and quota-bound entities. Market participants develop trading plans based on self-interest optimization while complying with renewable quota requirements. The interactive structure of the Stackelberg game-theoretic model for medium- and long-term transactions is presented in Figure 2.

3.1.1. Generation Alliance Objective Function

The upper-level generation alliance determines electricity and TGC pricing strategies based on the technical parameters provided by diverse generation units. These strategies consider the operational characteristics of generation units and the demand profiles of quota-bound entities. This hierarchical pricing mechanism strategically influences energy consumption and TGC procurement behaviors across market participants. The optimization objective is to maximize the trading center’s net revenue, and can be expressed as
f p = max ( U month C G , month C new , month )
In Equation (1), f p denotes the net profit of the generation alliance during the medium- to long-term contract phase; U month represents revenue in the medium- and long-term contract phase; C G , month is the cost of the thermal unit under medium- and long-term contracts; and C new , month corresponds to the costs of renewable energy units in the medium- and long-term contract framework.
U month = t = 1 T 1 k = 1 K ( P k , t Q k , t + P k , t , TGC Q k , t , TGC )
In Equation (2), T 1 denotes the market-clearing period during the medium- and long-term phase; k represents the number of quota-bound entities, where k = 1 , , K ; P k , t / P k , t , TGC is the electricity or TGC purchase price for a quota-bound entity k during period t in the medium- and long-term phase; and Q k , t / Q k , t , TGC is the transacted electricity or TGC volume for a quota-bound entity k in period t under medium- and long-term contracts.
The specific model details are as follows:
C G , month = C H , month + C T , month + C RPS , month + C punish , month
C H , month = t = 1 T 1 i = 1 I ( c G i , month Q G i , t ) C T , month = K c [ E c t = 1 T 1 i = 1 I ( δ c Q G i , t ) ] C RPS , month = t = 1 T 1 i = 1 I ( K TGC Q Gi , t , TGC ) C punish , month = c punish max δ RPS t = 1 T 1 Q Gi , t t = 1 T 1 Q Gi , t , TGC , 0
In Equation (4), i denotes the number of thermal units, i = 1 , , I ; C H , month is the monthly generation cost of the thermal unit under medium- and long-term contracts; c G i , month represents the average monthly generation cost of thermal units; Q G i , t is the total power output of the thermal unit i during period t ; C T , month denotes the carbon trading cost; K c is the carbon price in emissions trading markets; E c represents the actual carbon emissions of thermal units; δ c is the carbon allowance allocation co-effect; C RPS , month denotes the Renewable Portfolio Standard (RPS) compliance cost; K TGC represents the TGC price; Q Gi , t , TGC is the TGC purchase volume of the unit i during period t ; C punish , month represents the quota penalty coefficient; c punish denotes the thermal units’ penalty coefficient; and δ RPS represents the renewable energy accommodation obligation weight.
C new , month = C R , month + C R , month , TGC
C R , month = t = 1 T 1 j = 1 J ( c R j Q R j , t ) C R , month , TGC = t = 1 T 1 j = 1 J ( K TGC Q R j , t , TGC )
In Equation (6), j is the number of renewable energy units employed, j = 1 , , J ; C R , month represents the monthly generation cost of renewable units under medium- and long-term contracts; c R j is the benchmark monthly generation cost for renewable units; Q R j , t is the total power output of the renewable unit j during period t ; C R , month , TGC denotes the monthly TGC cost for renewable units in the medium- and long-term phase; and Q R j , t , TGC represents the TGC trading volume of different renewable units during the period t .

3.1.2. Quota-Bound Entity Objective Function

At the lower-level decision layer, quota-bound entities formulate their respective objective functions to maximize individual net benefits, f k . This incorporates four key operational components— U k , t is the electricity utility function, C k , t , cos t represents the electricity procurement costs and TGC payments; and P k , TGC represents the quota penalty costs. The integrated optimization objective is formulated as
f k = max ( U k , t C k , t , cos t P k , TGC )
U k , t = t = 1 T 1 [ v k Q k , t u k 2 ( Q k , t ) 2 ] C k , t , cos t = t = 1 T 1 ( P k , t Q k , t + P k , t , TGC Q k , t , TGC ) P k , TGC = c k , punish max δ RPS t = 1 T 1 Q k , t t = 1 T 1 Q k , t , TGC , 0
In Equation (8), v k and u k denote the electricity utility coefficients for the quota-bound entity; Q k , t and Q k , t , TGC are the respective electricity and TGC transaction volumes of quota-bound entity k during period t .

3.1.3. Stackelberg Game Model Constraints

(1)
Operational constraints governing medium- and long-term transactions—
P e , min P k , t P e , max
P T G C , min P k , t , TGC P T G C , max
In Equations (9) and (10), P e , min / P e , max and P T G C , min / P T G C , max denote the minimum/maximum prices for the medium- and long-term trading of electricity and TGC.
(2)
Medium- and long-term traded electricity/TGC volume constraints—
0 Q k , t Q k , max
0 Q k , t , TGC Q k , t , TGC , max
In Equations (11) and (12), Q k , max and Q k , t , TGC , max represent the respective maximum amounts of power and TGC that quota-bound entities may purchase during period t in the medium- and long-term trading phase.
(3)
Thermal units’ output constraints—
0 Q G i , t Q G i , t , max
In Equation (13), Q G i , t , max denotes the maximum output capacity of thermal power units during the medium- and long-term trading periods.
(4)
TGC trading volume constraints for thermal units—
Q Gi , t , TGC 0
(5)
Renewable energy unit capacity constraints—
0 Q R j , t Q R j , t , max
In Equation (15), Q R j , t , max represents the maximum output capacity of renewable energy units during the medium- and long-term trading periods.
(6)
TGC trading volume constraints for renewable energy units—
0 Q R j , t , TGC Q R j , t
(7)
Power balance constraints—
k = 1 K Q k , t = i = 1 I Q G i , t + j = 1 J Q R j , t
(8)
TGC volume balance constraints—
k = 1 K Q k , t , TGC = j = 1 J Q R j , t , TGC

3.1.4. Proof of Stackelberg Game Equilibrium Existence

According to the definition of the Stackelberg game, if there exists a strategy profile P k , t , P k , t , TGC , Q k , t , Q k , t , TGC that simultaneously satisfies Equations (19) and (20)—where P k , t / P k , t , TGC and Q k , t / Q k , t , TGC denote the strategies of the generation alliance excluding quota-bound entity k and other quota-bound entities, respectively—then P k , t , P k , t , TGC , Q k , t , Q k , t , TGC constitutes a Nash equilibrium solution for the Stackelberg game model. At this equilibrium, both the generation alliance and quota-bound entities achieve optimal benefits, and no participant can gain additional profits by unilaterally adjusting their own strategy.
f p P k , t , P k , t , TGC , Q k , t , Q k , t , TGC f p P k , t , P k , t , P k , t , TGC , P k , t , TGC , Q k , t , Q k , t , TGC
f k P k , t , P k , t , TGC , Q k , t , Q k , t , TGC f k P k , t , P k , t , TGC , Q k , t , Q k , t , Q k , t , TGC , Q k , t , TGC
The existence of a Nash equilibrium can be established by demonstrating that each participant’s payoff function is continuous or quasiconcave within their respective strategy spaces, as per the following theorems:
Theorem 1 (Pure-Strategy Nash Equilibrium).
For a strategic-form game  G = N ; S 1 , S i , , S n ; u 1 , u i , , u n , if the strategy set  S i  is a nonempty, compact, and convex subset of a Euclidean space, and the payoff function  u i  is continuous in the strategy profile  S  and quasiconcave in  S i , then a pure-strategy Nash equilibrium exists.
Theorem 2 (Mixed-Strategy Nash Equilibrium).
For a strategic-form game  G = N ; S 1 , S i , , S n ; u 1 , u i , , u n , if the strategy set  S i  is a nonempty, compact, and convex subset of a Euclidean space, and the payoff function  u i  is continuous in the strategy profile  S , then a mixed-strategy Nash equilibrium exists.
In the proposed game-theoretic framework of this chapter, the strategy spaces for all agents Ω = Ω p , Ω 1 , , Ω k are nonempty, compact, and convex sets, defined by linear constraints. For quota-bound entities, the payoff function is quasiconcave if its Hessian matrix is negative semidefinite, ensuring an equilibrium solution exists. Similarly, the generation alliance’s payoff function at the upper level becomes quasiconcave given fixed electricity and TGC procurement volumes. Thus, the proposed model guarantees the existence of a Nash equilibrium solution.

3.2. Phase II: Medium- and Long-Term Contract Volume Decomposition Mechanism Integrated with RFR

3.2.1. RFR-Based Predictive Model

RFR is a relatively recent machine learning method [18]. This study employs the Classification and Regression Trees (CART) algorithm, which uses recursive partitioning to divide training data into homogeneous subsets and constructs multivariate regression trees through deterministic rules [19]. The procedure begins by selecting Bootstrap samples containing approximately two-thirds of the training data. Then, at each node, a random subset of input variables is chosen to recursively partition the input space via binary splits, facilitating the growth of regression trees. For regression trees, split points are determined by minimizing the regression error, defined as the weighted sum of the error within each subset. By introducing randomness across individual regression trees and averaging the predictions of a large ensemble of decorrelated trees, the final RFR prediction is expressed as [20]
φ ( X ) = 1 B b = 1 B T b ( X )
In Equation (21), X denotes the input variables; φ is the final output of the RFR model; T b is the output of the regression tree in the ensemble; and B is the total number of regression trees in the forest. Figure 3 illustrates the workflow of the RFR construction.
Empirical studies show that renewable generation output strongly depends on multiple environmental drivers, including temperature T , wind speed S , solar irradiance I S O R , atmospheric pressure A T M , and temporal factors. Accordingly, the two machine learning-based medium- and long-term contract decomposition models developed in this study incorporate these critical factors along with historical operational data of renewable energy output Q R , load or thermal power unit output Q G , load as independent variables, and the predicted value Q d a y , p r e as the dependent variable. Using machine learning, the relationship between the independent variables and the dependent variable can be represented by
Q d a y , p r e = φ ( T , S , I S O R , A T M , d o y , Q load )
In Equation (22), φ · denotes the machine learning model; d o y is the yearly cumulative date; and Q load is the background data, which may be Q R , load or Q G , load .

3.2.2. Medium- and Long-Term Contract Decomposition Objective Function

The predicted energy and TGC quantities generated by the RFR model serve as the basis for optimizing the medium- and long-term contract decomposition. To ensure that the daily forecasted energy and certificate volumes precisely sum to the monthly contractual totals, a robust decomposition mechanism with integrated energy-certificate coordination is developed, as formalized in Equation (21). The optimization objective minimizes prediction errors while strictly constraining the adjusted daily electricity volumes to equal the monthly contractual amounts and maintaining non-negative daily allocations. This step effectively resolves inconsistencies caused by cumulative prediction errors over the month, ensuring accuracy and consistency in the decomposed results.
min d a y = 1 T 2 Q d a y Q d a y , p r e 2
In Equation (23), T 2 denotes the decomposition period of the medium- and long-term contract, and Q d a y is the optimized daily allocation after adjustment.
The proportional binding of medium- and long-term contract decomposition volumes for TGCs to renewable energy generation decomposition volumes is fundamentally grounded in the physical coupling between the intrinsic attributes of the TGC and renewable energy generation behavior. According to internationally recognized standards (e.g., the I-REC Standard) and China’s Renewable Energy Quota System policy, TGCs serve as the exclusive statutory vehicle for the environmental attributes of renewable energy generation. Their creation is strictly contingent upon actual grid-injected renewable electricity volumes. Consequently, during the contract decomposition phase, TGC allocation must adhere to the principle of “attribute-energy matching”, ensuring that each unit of certificate corresponds to verifiable physical renewable energy output, expressed as
Q R j , d a y , TGC = Q R j , d a y Q R j , t Q R j , t , TGC
In Equation (24), Q R j , d a y , TGC is the daily decomposed volume of TGC within the medium- and long-term contract framework.

3.2.3. Constraints for Contract Decomposition

(1)
Aggregate contractual balance constraints—
d a y = 1 T 2 Q G i , d a y = Q G i , t
d a y = 1 T 2 Q R j , d a y = Q R j , t
(2)
Generation unit output constraints—
Q G i , d a y 0
Q R j , d a y 0
In Equations (25) and (26), Q G i , d a y and Q R j , d a y denote the decomposed daily energy quantities from medium- and long-term contracts for thermal power units and renewable energy units, respectively.

3.3. Phase III: Provincial Day-Ahead Market Clearing Strategy Incorporating Contract Decomposition

3.3.1. Objective Function

Considering the characteristics of renewable energy market integration and the renewable energy quota system, this section seamlessly combines medium- and long-term trading with the day-ahead market clearing plan. It integrates the physical execution constraints of both medium- and long-term/spot markets to ensure a smooth transition. In this study, the trading center is designed to optimize the day-ahead market clearing by minimizing the total clearing cost. The optimization leverages the second-stage RFR prediction model combined with convex optimization applied to the decomposition results of medium- and long-term contracts, along with unit-specific information provided by various power generators. The mathematical formulation is expressed as follows:
C = min ( C G + C new )
In Equation (29), C represents the total procurement cost of the day-ahead market clearing; C G denotes the total procurement cost of thermal power units; and C new signifies the total procurement cost of renewable energy units.
C G = C H + C k + C T + C G , RPS + C punish
C H = h o u r = 1 T 3 i = 1 I φ G i , h o u r ( a i Q G i , h o u r 2 + b i Q Gi , h o u r + c i ) C k = h o u r = 1 T 3 i = 1 I φ G i , h o u r 1 φ G i , h o u r 1 + φ G i , h o u r 1 1 φ G i , h o u r C i C T = K c [ E c h o u r = 1 T 3 i = 1 I ( δ c Q Gi , h o u r ) ] C RPS = h o u r = 1 T 3 i = 1 I ( K TGC Q Gi , h o u r , TGC ) C punish , month = c punish max h o u r = 1 T 3 ( δ RPS Q Gi , h o u r ) h o u r = 1 T 3 Q Gi , t , TGC , 0
In Equation (31): T 3 is the day-ahead market clearing period; C H is the coal consumption cost of the thermal units; φ G i , h o u r represents the commitment status of unit i during time slot t ; Q Gi , h o u r is the total output of unit i during time slot h o u r ; a i , b i , and c i are the coal consumption cost coefficients for thermal unit i ; C k is the startup/shutdown cost of the thermal units; and C i is the startup/shutdown cost of the thermal unit i .
C new = C R + C R , TGC
C R = h o u r = 1 T 3 j = 1 J c R Q R j , h o u r C R , TGC = h o u r = 1 T 3 j = 1 J ( K TGC Q R j , h o u r , TGC )
In Equation (33), Q R j , h o u r is the total output of renewable energy unit j at time h o u r , and Q R j , h o u r , TGC denotes the cleared TGC quantity for renewable energy unit j at time h o u r .

3.3.2. Day-Ahead Market Clearing Constraints

(1)
Power balance constraints—
Q load , h o u r = i = 1 I Q Gi , h o u r + j = 1 J Q R j , h o u r
In Equation (34), Q load , h o u r represents the system load demand at time h o u r .
(2)
Renewable generation output constraints—
0 Q R j , h o u r Q R j , h o u r , pre
In Equation (35), Q R j , h o u r , pre is the projected power of renewable energy unit j at time h o u r .
(3)
Thermal unit output constraints—
Q Gi , min Q Gi , h o u r Q Gi , max φ G i , h o u r = 1 Q Gi , h o u r = 0 φ G i , h o u r = 0
In Equation (36), Q Gi , min and Q Gi , max denote the minimum and maximum technical outputs of thermal power units, respectively.
(4)
Thermal unit ramp rate constraints—
Q Gi , h o u r Q Gi , h o u r 1 φ G i , h o u r r Gi , up Q Gi , h o u r 1 Q Gi , h o u r φ G i , h o u r 1 r Gi , down
In Equation (37), r Gi , up and r Gi , down represent the uphill and downhill climb rates of thermal power units.
(5)
Thermal unit commitment constraints—
( T i , h o u r 1 on T i , min on ) ( φ G i , h o u r 1 φ G i , h o u r ) 0 ( T i , h o u r 1 off T i , min off ) ( φ G i , h o u r φ G i , h o u r 1 ) 0
In Equation (38), T i , min on and T i , min off are the respective minimum shutdown and start-up times of the thermal power unit i ; T i , h o u r 1 on and T i , h o u r 1 off denote the continuous operation and shutdown durations of thermal power unit i up to time slot h o u r 1 , respectively.
(6)
System standby constraints—
i = 1 I φ G i , h o u r Q Gi , max Q Gi , h o u r R h o u r Urep i = 1 I Q Gi , h o u r φ G i , h o u r Q Gi , min R h o u r Drep
In Equation (39), R h o u r Urep and R h o u r Drep denote the system’s positive and negative standby requirements at time h o u r .
(7)
TGC trading constraints—
Q Gi , h o u r , TGC 0 Q R j , h o u r , TGC 0
(8)
Medium- and long-term contractual constraints—
h o u r = 1 T 3 Q Gi , h o u r Q G i , d a y h o u r = 1 T 3 Q R j , h o u r Q R j , d a y h o u r = 1 T 3 Q R j , h o u r , TGC Q R j , d a y , TGC

3.4. Trade Settlement Model Based on VCG Mechanism

The Vickrey–Clarke–Groves (VCG) mechanism balances efficiency, fairness, and incentive compatibility in economic transactions. By internalizing the external costs and benefits that each bidder imposes on others through their bids, it encourages truthful cost reporting, and mitigates the strategic bidding that arises from information asymmetry. This mechanism promotes efficient, equitable market outcomes and rational resource allocation [21]. In this study, the systemic impact of generation units is quantified via the social welfare differential, specifically, the variation in clearing costs caused by the participation of individual units’, capturing their dual value streams—energy and environmental benefits.

3.4.1. Payment Rules

The VCG incentive payment formula is given by
E n = f c ( ω n ) [ f c ( ω n ) f c ( n ) ]
In Equation (42), E n represents the revenue received by unit n ; ω n and ω n denote the price quantity pairs in the day-ahead market clearing when a unit participates or does not participate in the market, respectively; f c ( ω n ) and f c ( ω n ) denote the respective total system procurement costs under these two scenarios, corresponding to system payment obligations; f c ( n ) is the procurement cost of unit n (the system’s payment to unit n ); [ f c ( ω n ) f c ( n ) ] indicates the capacity procurement cost of other units when unit n participates in market clearing. It can be equivalently rewritten as
E n = [ f c ( ω n ) f c ( ω n ) ] + f c ( n )
In Equation (43), [ f c ( ω n ) f c ( ω n ) ] is the system’s total procurement cost between scenarios where generation unit n participates and abstains from day-ahead market clearing, which represents the unit’s economic value.

3.4.2. Validation of Model Properties

(1)
Incentive compatibility
Assuming each unit declares a cost p n based on its true price p and true cost function c ( p ) , independent of other information reported to the trading center, the unit’s generic utility function is
u n = p n p Q n
As rational agents, units aim to maximize their utility and might have incentives to misrepresent their costs. However, the VCG settlement mechanism eliminates this incentive. The detailed proof is provided in the references.
When a unit truthfully declares its cost, the system achieves an optimal clearing plan, minimizing the total procurement cost. The unit’s net profit can be derived as
E = E n c ( p )       = ( f c ( ω n ) f c ( ω n ) ) + ( f c ( n ) c ( p ) )       = f c ( ω n ) m n , m N f c ( m , p m ) f c ( n , p n )       + ( f c ( n , p n ) c ( p ) )       = f c ( ω n ) m n , m N f c ( m , p m ) + c ( p )
If the unit declares an inflated cost p ¯ n , its net profit becomes E ¯ ,
E ¯ = E ¯ n c ( p )       = ( f c ( ω n ) f c ( ω ¯ n ) ) + ( f c ( n , p ¯ n ) c ( p ) )       = f c ( ω n ) m n , m N f c ( m , p ¯ m ) f c ( n , p ¯ n )       + ( f c ( n , p ¯ n ) c ( p ) )       = f c ( ω n ) m n , m N f c ( m , p ¯ m ) + c ( p )
Note: To indicate different price levels, f c ( n ) is used here with the same meaning as the declared cost f c ( n , p n ) .
In Equation (44), f c ( ω n ) is the system purchase cost without the unit’s participation, unaffected by the unit’s offer price p n .
c ( p ) in the term m n , m N f c ( m , p ¯ m ) + c ( p ) is the true cost function of the unit, which is independent of the offer price. Additionally, f c ( n ) is directly affected by the unit’s offer and is canceled out, while the indirectly affected portion is the total purchase cost of the other units, represented by m n , m N f c ( m , p m ) . When a unit declares a higher cost to the trading center, it changes the optimal day-ahead clearances, raising the total procurement cost of the system and potentially increasing its revenue from other units.
m n , m N f c ( m , p ¯ m ) m n , m N f c ( m , p m )
Therefore, the unit declaring inflated prices leads to a lower net profit.
E ¯ E
In summary, formal cost declaration is the unit’s optimal strategy, satisfying incentive compatibility.
(2)
Individual rationality
When units declare their true costs, the system produces an optimal dispatch plan minimizing total procurement costs. In a case wherein any unit withdraws, the optimal combination becomes suboptimal, increasing the procurement cost of the system as follows:
f c ( ω n ) f c ( ω n ) > 0
The condition is numerically satisfied by
f c n c ( p ) > 0
Also, the unit net profit E satisfies
E = E n c ( p )       = [ f c ( ω n ) f c ( ω n ) ] + [ f c ( n ) c ( p ) ]       > 0
This ensures the unit’s net profit is non-negative, meeting the unit’s rationality condition.
(3)
Maximizing social welfare
The optimal clearing strategy obtained by the trading center through optimization minimizes power system operational costs, thereby maximizing social welfare [22].

4. Model Solving

The proposed three-stage computational framework is implemented as follows.
Phase I—The Stackelberg game model in the first stage is solved by employing an Adaptive Differential Evolution (ADE) algorithm combined with the Gurobi solver. During the initial iterations, the adaptive mutation operator maintains a relatively higher mutation factor to preserve population diversity. As the algorithm converges, this mutation factor is gradually reduced to improve solution accuracy and enhance convergence efficiency [23].
Phase II—In the second stage, the RFR model is trained on the MATLAB R2022a platform. The medium- and long-term contract decomposition is formulated as a convex optimization problem and solved using the CVX toolkit solver.
Phase III—The third phase can be described as the Day-Ahead Market Clearing Linearization stage. The day-ahead clearing model is originally a Mixed-Integer Nonlinear Programming (MINLP) problem due to the nonconvex unit commitment constraints. Following the linearization approach described in the references [24], impulse functions are applied to reformulate the nonlinear constraints into equivalent Mixed-Integer Linear Programming (MILP) formulations. The resulting linearized model is efficiently solved using the CPLEX solver. The full computational workflow is illustrated in Figure 4.

5. Example Analysis

5.1. Analysis of Monthly Medium- and Long-Term Trading Results

This section presents a numerical analysis based on actual electricity market data from a northwestern province in China. The case study involves three quota-bound entities (Entities A, B, and C) that participate in trading with generation alliance through the provincial trading center. These entities represent regions with high electricity demand but limited generation resources, whereas the generation alliance operates in a generation-rich area. For computational simplicity, the generation alliance coordinates one thermal unit, one wind farm, and one photovoltaic plant. The study focuses on monthly medium- and long-term transactions, with the monthly transaction volume accounting for 70% of the total monthly demand. Figure 5 depicts the total social electricity consumption and renewable power forecasts for each quota-bound entity [25]. Detailed parameter settings for medium- and long-term transactions and benefit function coefficients of quota-bound entities may be referred to in Table A1 of Appendix A [26,27]. The RPS weighting coefficients for Quota-Bound Entities A, B, and C have been set to 0.2, as stipulated in the 2023 Renewable Energy Consumption Responsibility Targets for Provinces (Autonomous Regions, Municipalities).
To validate the efficacy of the proposed monthly medium- and long-term multi-energy Stackelberg game-theoretic model, two comparative scenarios were introduced. In both scenarios, the medium- and long-term transaction parameters, benefit function coefficients for all quota-bound entities, and RPS coefficients were maintained identically.
Scenario 1: A Nash game among the internal units of the generation alliance and quota-bound entities, coupled with a Stackelberg game between these two groups.
Scenario 2: Cooperative alliance formation among the generation alliance’s internal units competing against quota-bound entities in a Stackelberg game proposed in this study.
As shown in Table 1, in Scenario 2, thermal power units achieved a 19.12% increase in revenue, while wind and photovoltaic units showed more significant gains of 38.76% and 47.52%, respectively. The total revenue of the generation alliance increased by 32.76%. For the quota-bound entities, Entity A experienced an 18.52% revenue increase, whereas Entities B and C saw revenue reductions of 3.7% and 2.44%, respectively. Despite this, the combined revenue of all quota-bound entities grew by 3.48%.
Furthermore, Scenario 2 enhances support for renewable energy units with limited generation capacity during electricity dispatch. This allows these units to achieve more balanced revenue streams. At the same time, the cooperative alliance formed among thermal, wind, and photovoltaic units in this scenario leads to simultaneous revenue growth for all participants, satisfying individual rationality and ensuring coalition stability. Although the earnings of Entities B and C experience modest decreases, the aggregate earnings of all quota-bound entities show an overall increase. These systemic characteristics demonstrate the superior practical applicability of the Scenario 2 model in real market operations.
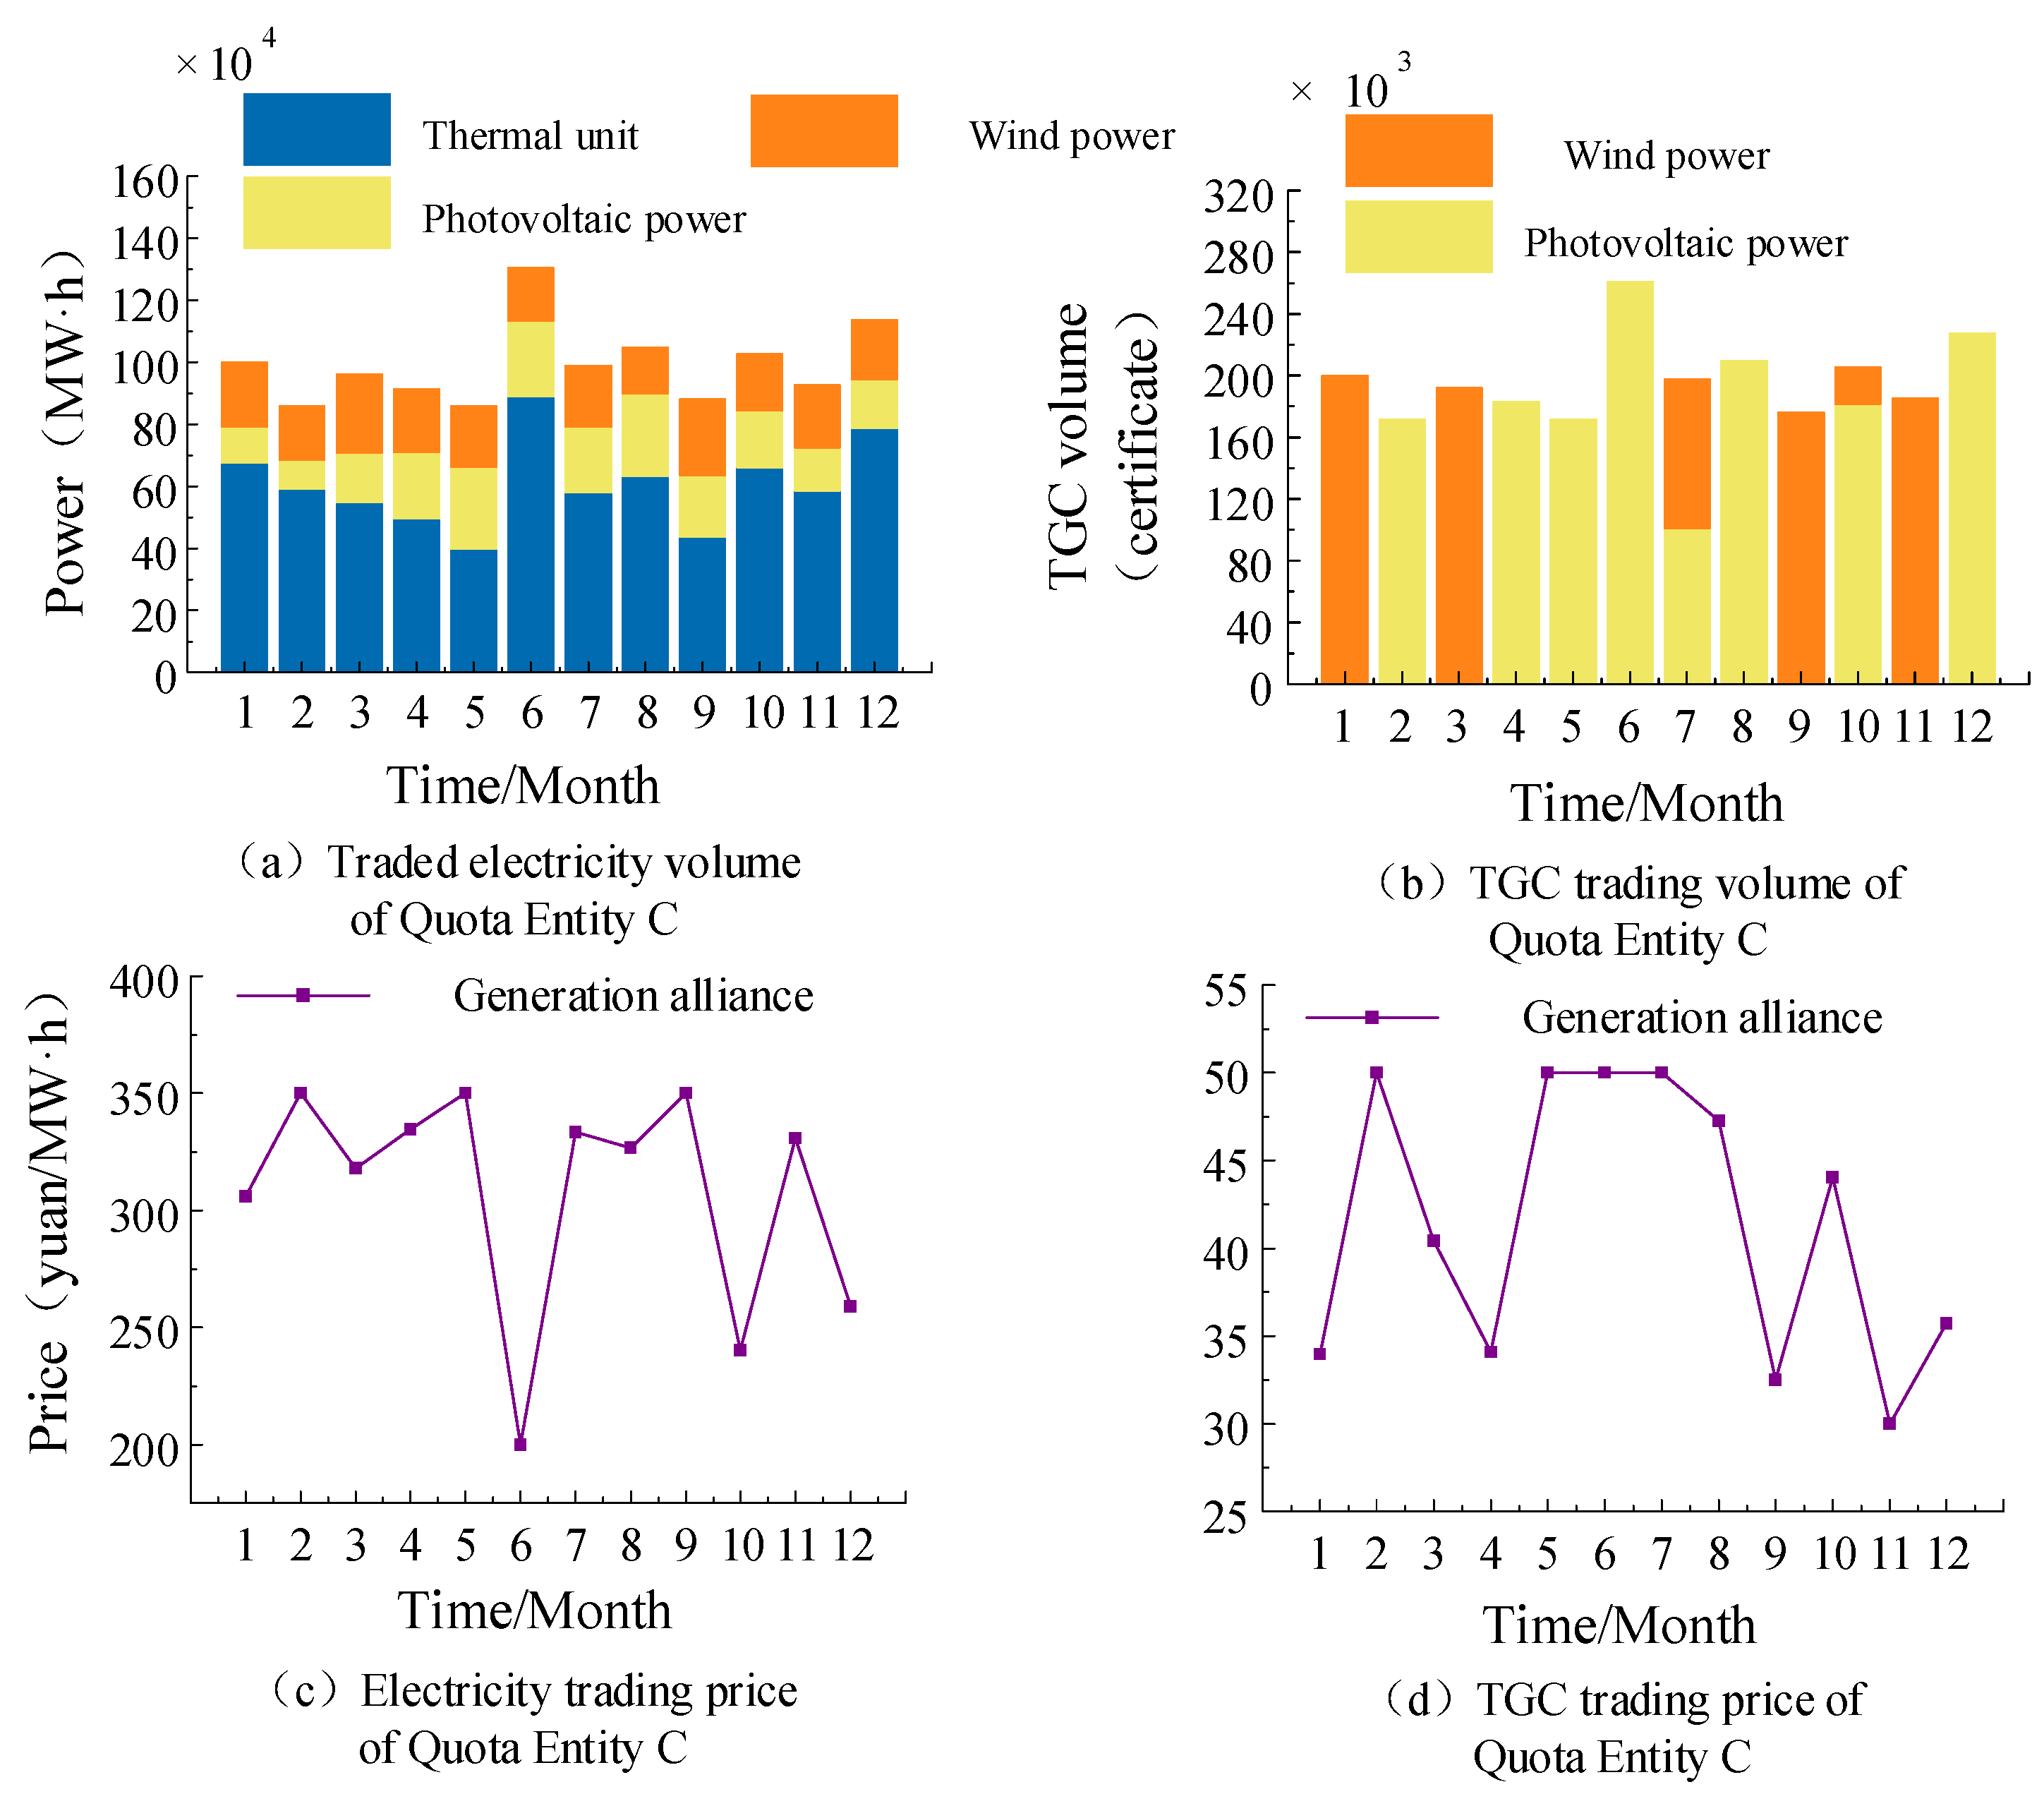
In addition, Figure 6, Figure 7 and Figure 8 depict the transaction strategies of quota-bound Entities A, B, and C under Scenario 1. This scenario features a two-tiered game-theoretic framework—Nash equilibrium governs interactions within homogeneous groups (generation units and quota-bound entities), while Stackelberg dynamics characterize interactions between these distinct stakeholder groups. Transaction electricity prices and TGC prices display alternating cyclical patterns, indicating intense market competition.
Specifically, monthly medium- and long-term transaction volumes exhibit price elasticity, with generation units showing the largest fluctuations in monthly transacted energy quantities, highlighting significant price–volume coupling effects. Due to its largest load demand among quota entities, Entity C strategically increases renewable energy procurement by 18.7% to protect its interests. Conversely, Entity A reduces renewable procurement by 12.3%, coupled with a 9.8% increase in power purchase costs, resulting in a 7.2% decline in net revenue. Entity B remains relatively stable, experiencing only a 2.1% operational impact, attributed to its minimal baseline load.
While the decentralized decision-making mechanism under competitive gaming improves individual operational flexibility, it also leads to a 28.4% increase in market volatility compared to the baseline. These intensified fluctuations raise operational risks by 15.6% to 22.3% across various entities, ultimately resulting in an average market-wide revenue decline of 6.8%.
Figure 9, Figure 10 and Figure 11 illustrate the transaction strategies of Quota A, B, and C in Scenario 2, respectively. This scenario implements a hierarchical game-theoretic framework, where heterogeneous generation units form strategic coalitions under the generation alliance’s centralized market participation, while Stackelberg dynamics govern interactions between the generation alliance and quota entities. Moreover, Scenario 2 exhibits improved market equilibrium characteristics, with transaction volumes and TGC allocations showing more balanced distributions. The annual operational profile highlights a 41.7% reduction in volatility of traded electricity quantities and a 38.2% decrease in price fluctuations compared to Scenario 1. Specifically, we can observe the following:
  • Quota-bound Entity A achieved a 6.23% annual increase in transacted energy;
  • Quota-bound Entity B recorded a 3.44% increase;
  • Quota-bound Entity C saw 1.03% growth.
In addition, the generation alliance’s rational resource allocation drives system-wide improvements in Scenario 2, including the following:
  • A 10.61% increase in renewable energy absorption capacity;
  • A 13.47% improvement in TGC utilization efficiency.
This hierarchical Stackelberg model features strategic interactions between generation coalitions and quota entities. On this basis, the model demonstrates superior adaptability and stability for medium- and long-term electricity markets.

5.2. Medium- and Long-Term Contract Decomposition Results

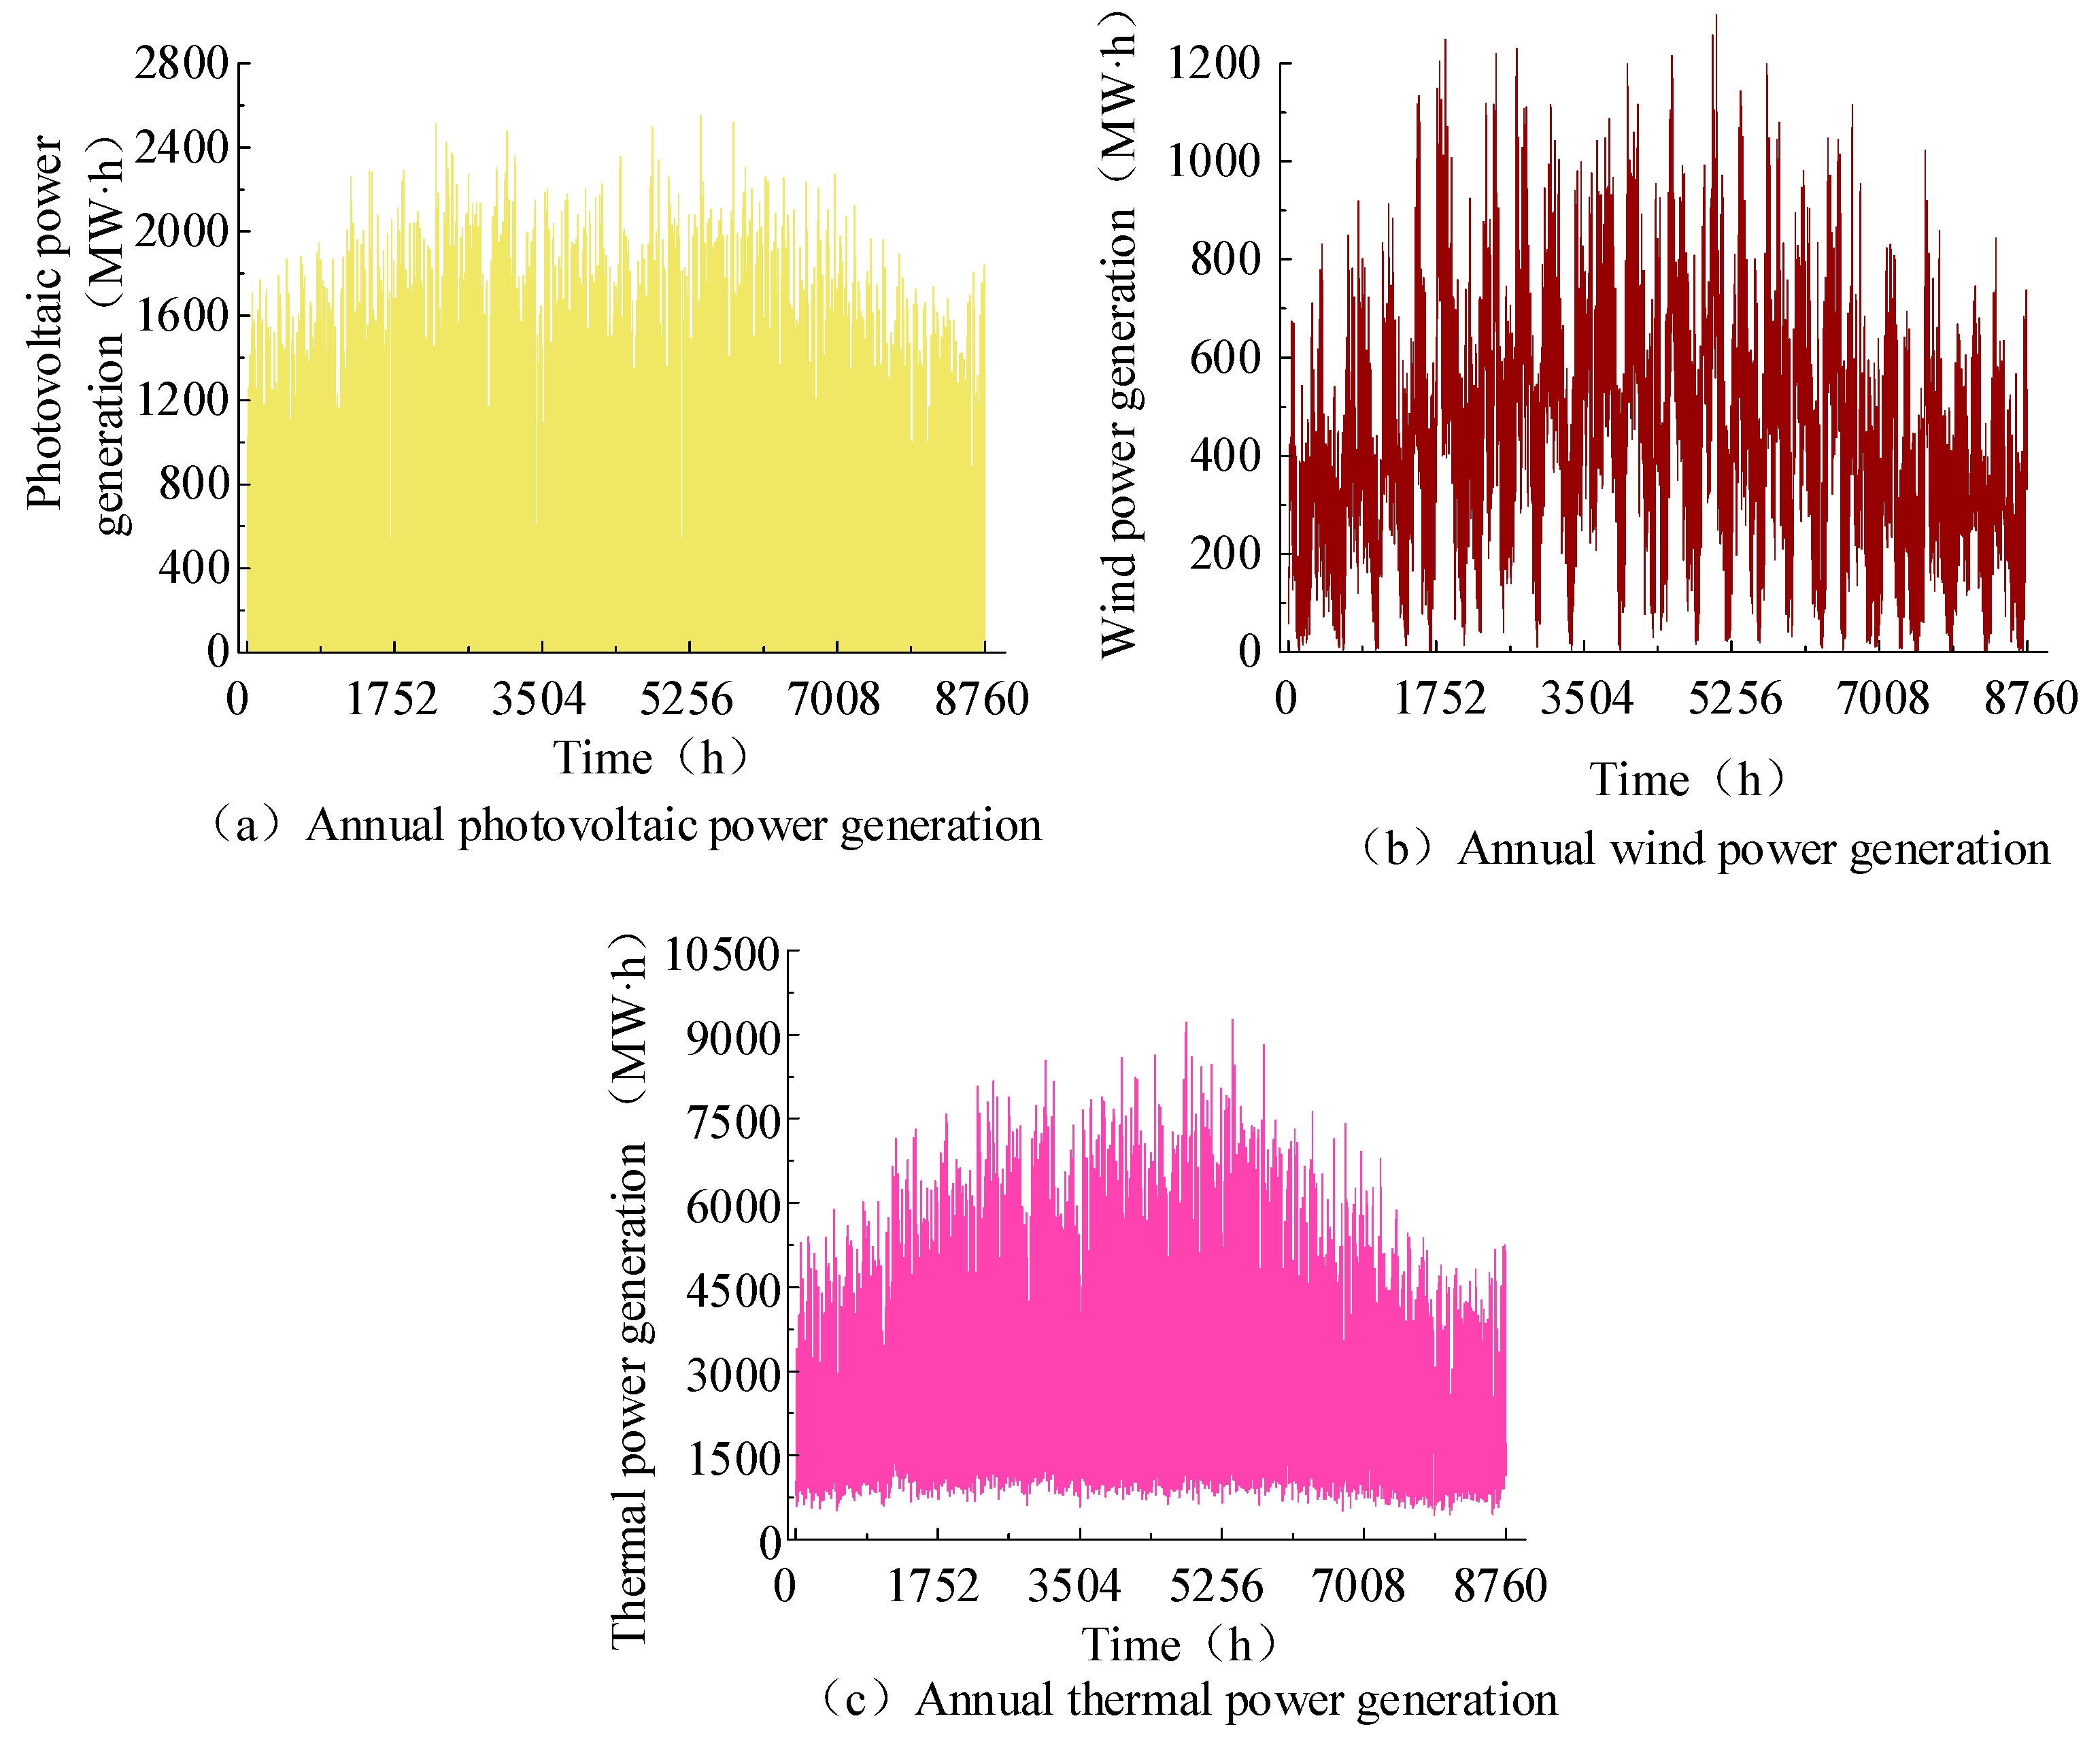
The meteorological data used in this study were obtained from the China Meteorological Data Service Center (http://data.cma.cn/), consisting of 2023 annual observations from a northwestern province in China. The dataset includes ambient temperature (°C), surface barometric pressure (hPa), solar irradiance intensity (W/m2), and wind velocity (m/s). These meteorological variables were utilized to develop the analytical model. Figure 12 presents the inter-annual variation patterns of the meteorological data, while Figure 13 shows the corresponding annual power generation profile.
By integrating the medium- and long-term market transaction results, meteorological data, and historical generation profiles across various generation units, the optimized decomposition model introduced in Section 3.2 is effectively applied to contract allocation. In the context of the July case study, Figure 14 illustrates the decomposed monthly electricity allocations under medium- and long-term contracts, and Figure 15 depicts the corresponding TGC decomposition results.
The decomposition results of medium- and long-term contracts demonstrate that revenue enhancement for generation units is fundamentally driven by innovations in market mechanism design (specifically, the multi-energy joint trading framework based on Stackelberg game theory in Phase I), rather than physical output adjustments during the decomposition phase (Phase II). Phase II employs the Random Forest Regression (RFR) algorithm to integrate multi-dimensional meteorological features—including temperature, wind speed, and solar irradiance—with historical operational data for renewable energy output forecasting. Through a convex optimization model, it decomposes medium- to-long term contracted volumes into day-ahead executable schedules that satisfy unit operational constraints. The core value of this phase lies in adapting to renewable energy volatility characteristics, ensuring the physical feasibility of medium- and long-term contracts across multiple timescales, and providing technical support for the physical delivery interface between medium- and long-term and spot markets. This mechanism design effectively addresses the coordination challenges between medium- and long-term trading and spot markets in high-renewable-penetration power systems, aligning with the intrinsic logic of renewable energy policies that emphasize a dual guarantee of quantity and price.

5.3. Analysis of the Convergence Between Day-Ahead Market Outcomes and Operational Linkages

In this section, the decomposed medium- and long-term contract allocations are integrated into the day-ahead market clearing model for joint optimization. Using actual load demand data from July 1st in the target region, Figure 16 demonstrates the equi-proportional scaling approach. Thermal power units with a combined installed capacity of 5500 MW participate in the clearing process, with their technical parameters detailed in Table A2 of Appendix A [5,28].
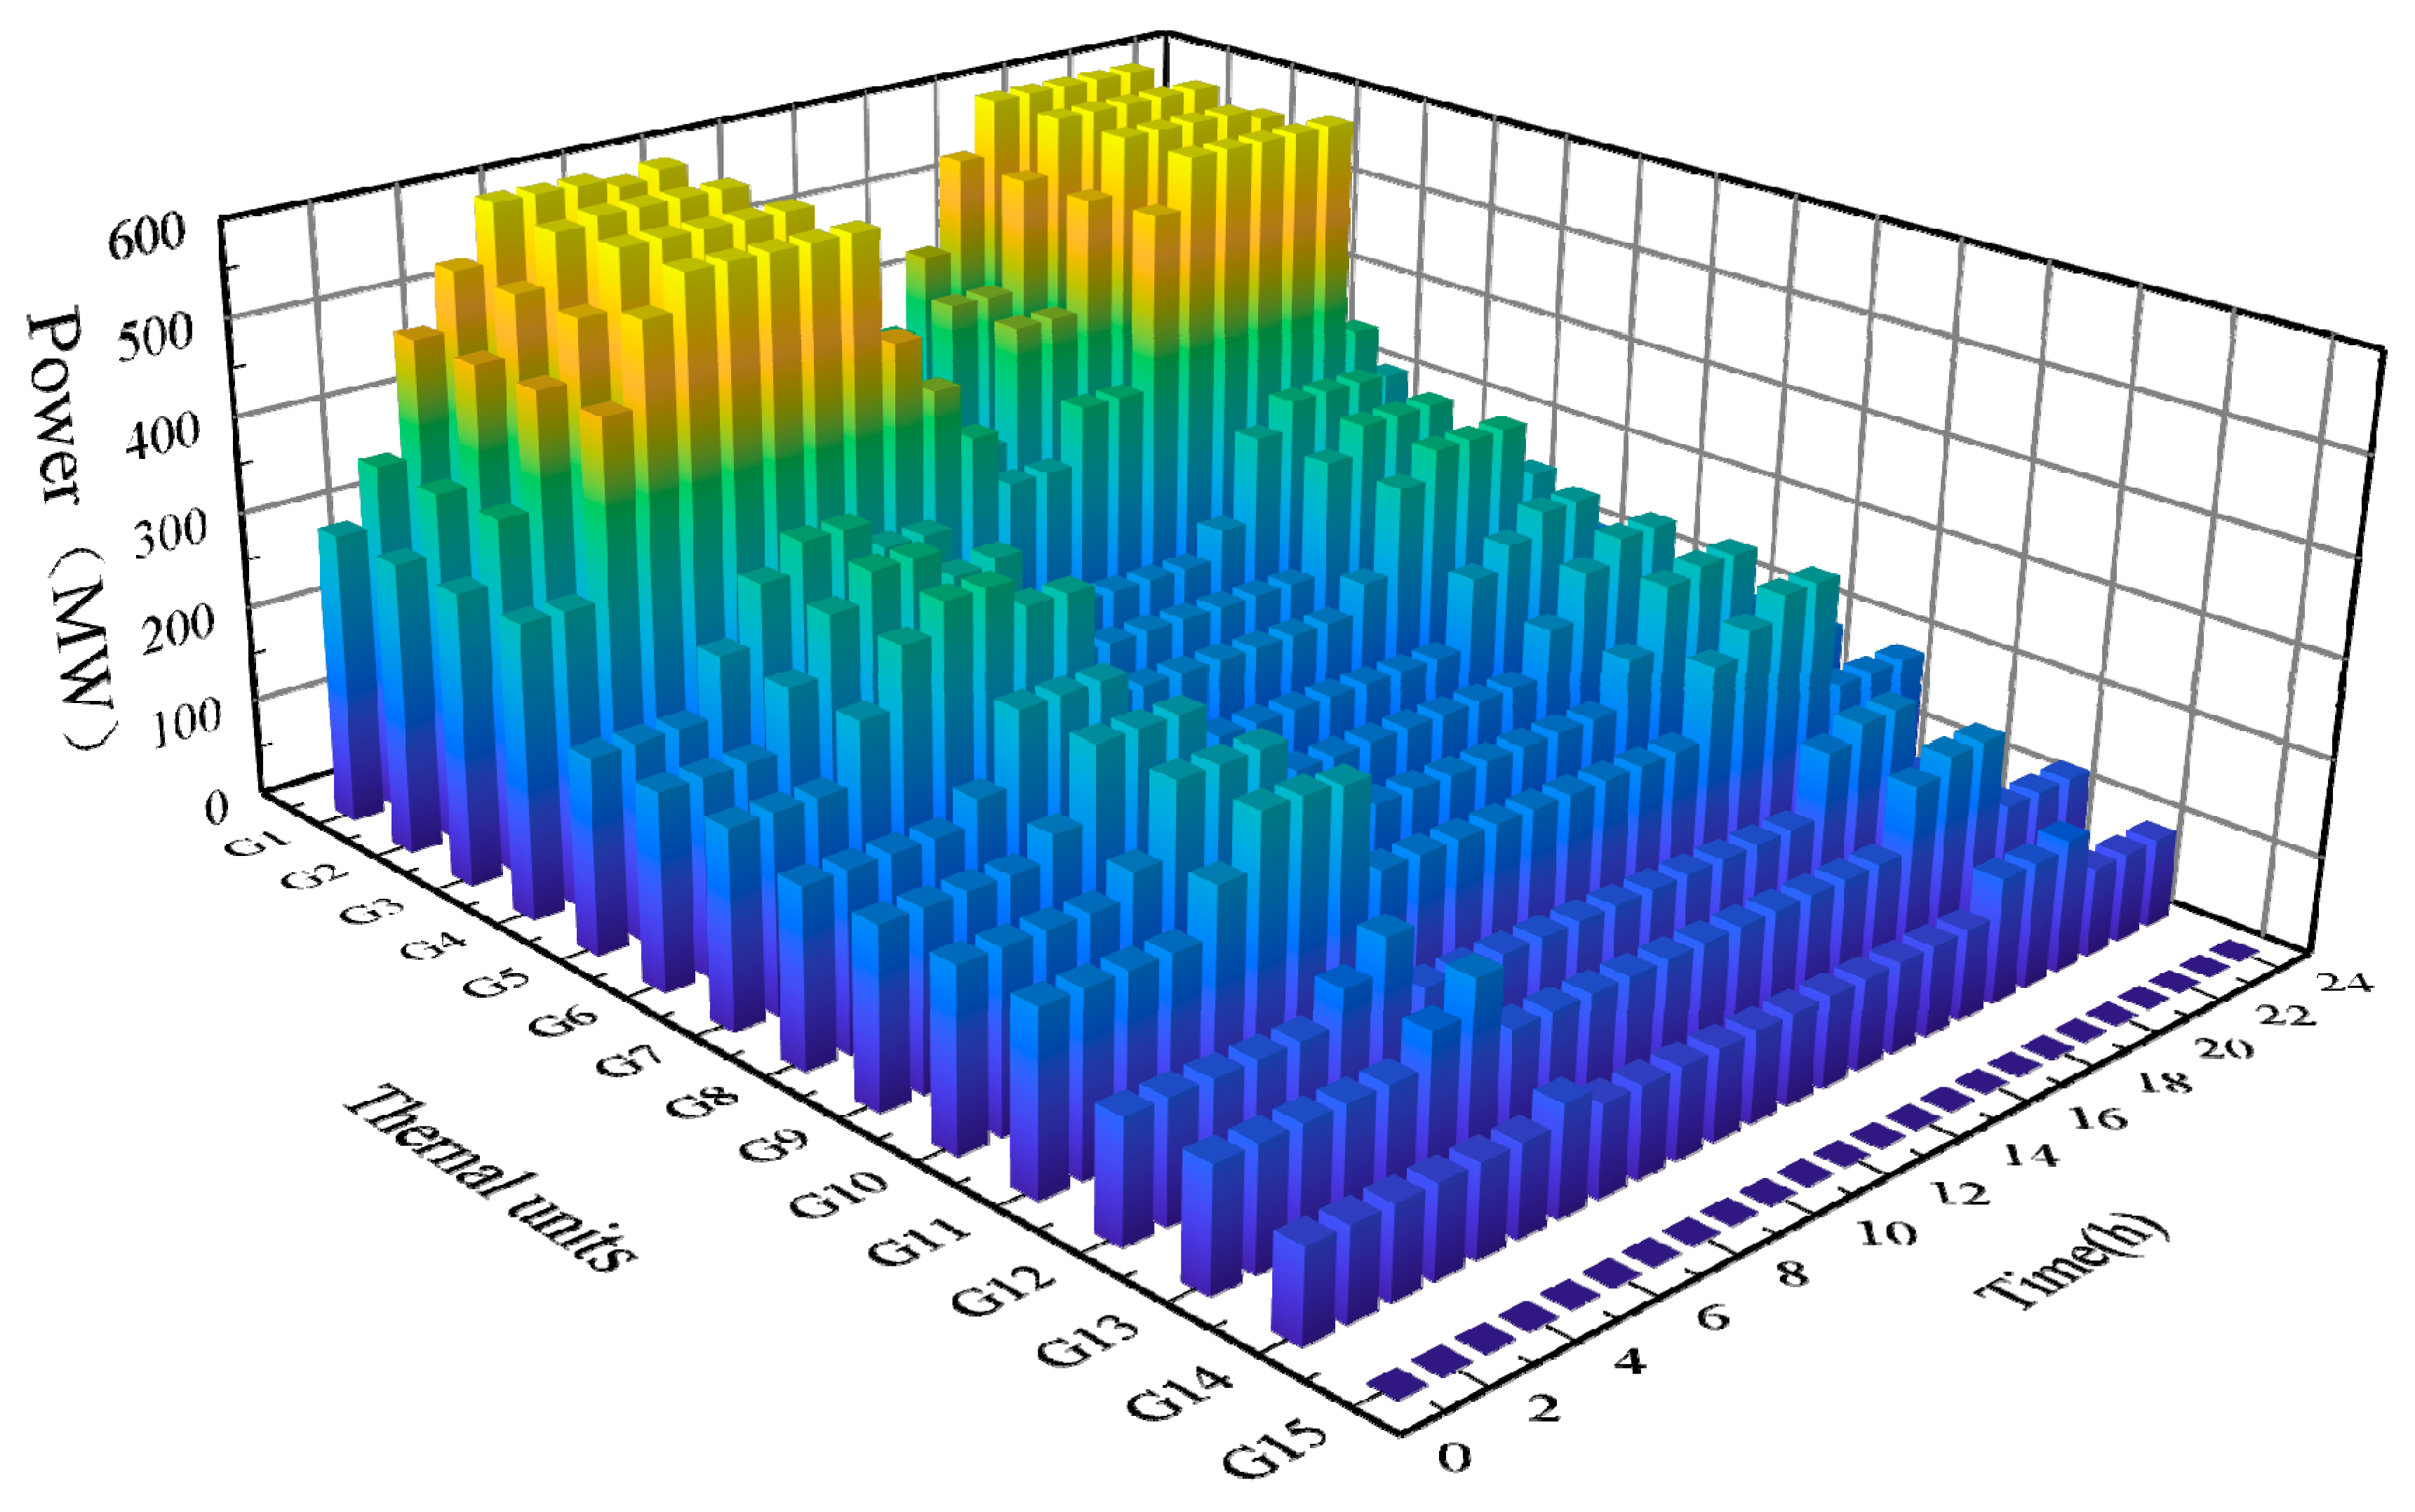
Furthermore, Figure 17 illustrates the day-ahead power dispatch for thermal generation units. During hours 1–8, rising load demand combined with reduced renewable output requires a gradual ramp-on of thermal units. Priority is given to the most economically efficient units (Units G1–G4) due to their lower operational costs.
In contrast, during peak load periods (hours 9–14), higher renewable generation penetration prompts the strategic curtailment of thermal output. This strategy targets the deactivation of high marginal cost and environmentally less favorable units (units G12–G15), enabling greater renewable energy integration while ensuring grid reliability.
Units that negatively impact the system’s economic–environmental performance generally operate at minimum output levels throughout the market cycle, maintaining baseline stability. This dispatch strategy achieves 22.7% cost efficiency improvement during off-peak hours while maintaining 98.3% renewable energy accommodation compliance during peak hours.
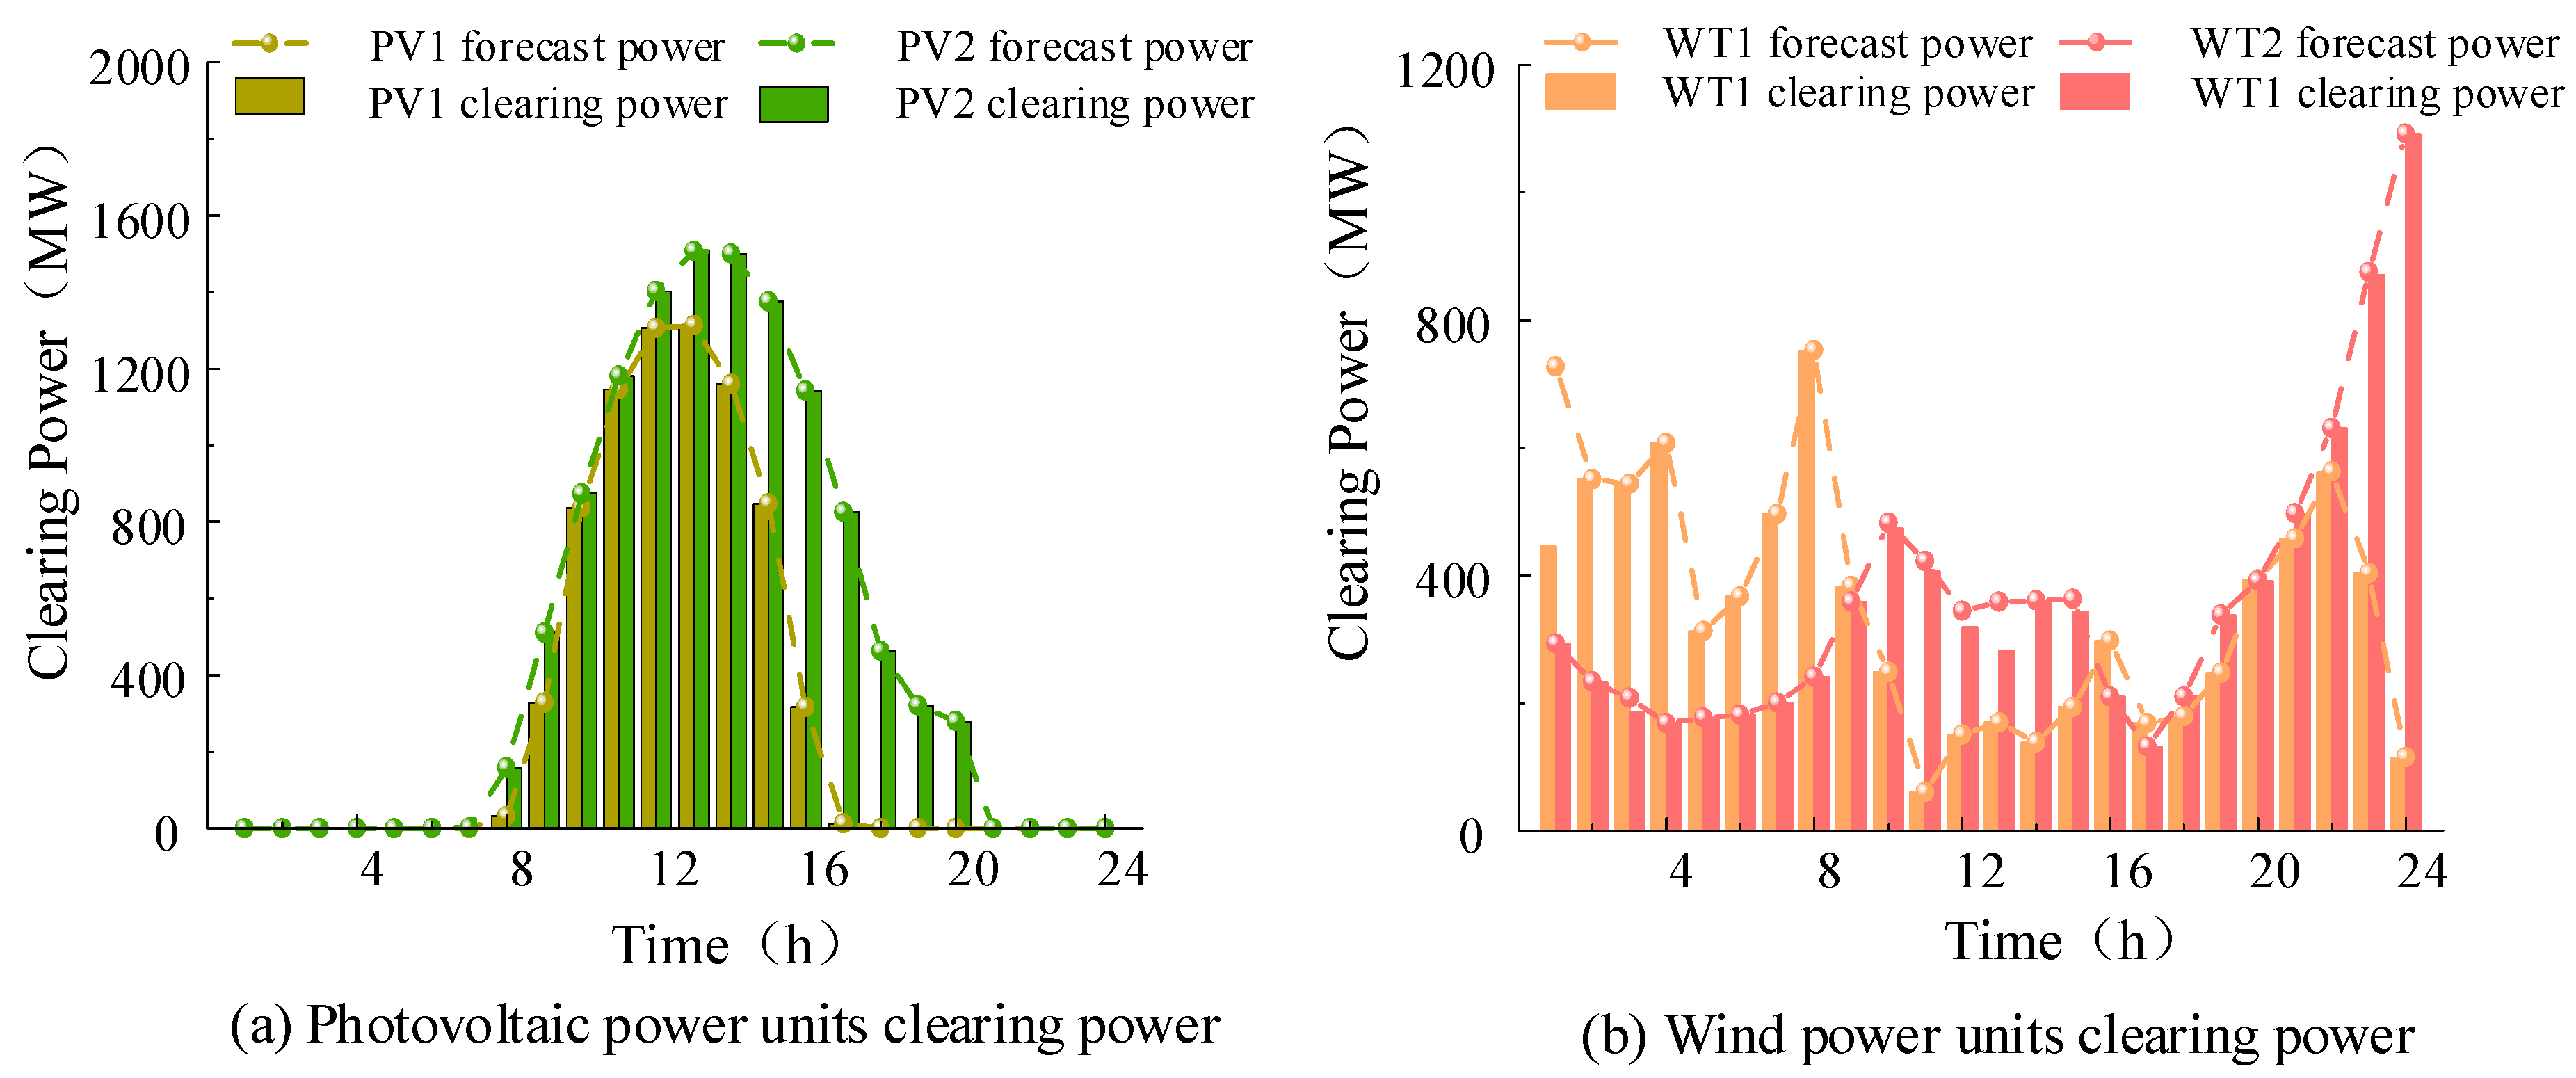
In addition, Figure 18 compares the clearing power outputs with the forecasted generation of renewable energy units. The results confirm that the day-ahead market clearing model, which incorporates environmental costs, enhances renewable energy utilization. By leveraging the economic and environmental benefits of renewables during market competition, this model maximizes feasible renewable integration while ensuring the fulfillment of medium- and long-term thermal unit contracts, thereby promoting the utilization and development of renewable energy resources.
To demonstrate the effectiveness of the proposed interface between medium- and long-term contract decomposition and the day-ahead market, we introduce a comparative analysis between the decomposed contract energy volume and the day-ahead cleared energy volume. Specific results are presented in Table 2 below.
The day-ahead cleared energy of thermal units (94.08 × 10³ MW) significantly exceeds the decomposed medium- and long-term contract volume (44.09 × 10³ MW). This stems from the dynamic optimization in the day-ahead market. During off-peak hours, the system prioritizes low-cost thermal units to meet ramping demands, resulting in the actual output surpassing the decomposed contracts. During peak hours, although high-marginal-cost units are curtailed to prioritize renewable integration, the base-load requirement still leads to higher aggregate thermal output. Wind and photovoltaic cleared energies (17.03 × 10³ MW, 18.84 × 10³ MW) exceed the decomposed medium- and long-term contract volume (16.89 × 10³ MW, 17.76 × 10³ MW), respectively, validating the efficacy of the Phase II RFR predictive model. The slightly higher photovoltaic deviation aligns with Northwest China’s midday irradiation volatility. These results demonstrate that the proposed mechanism—integrating decomposed contracts as flexible boundaries (not rigid constraints) into the environmentally weighted day-ahead clearing—ensures the priority fulfillment of renewable contracts while permitting thermal adjustments within security limits.

5.4. Analysis of Results Based on the VCG Settlement Mechanism

In practical electricity markets, due to issues such as information asymmetry, the marginal pricing (MP) mechanism fundamentally struggles to satisfy incentive compatibility. Consequently, generators always maintain incentives for strategic bidding [29].
To elucidate the characteristics of the proposed VCG-based settlement mechanism and contrast it with the MP mechanism, consider a three-unit system. Let c > 0 and D > 0 be constants. Units 1, 2, and 3 possess true quadratic generation cost functions c P 2 , 1.5 c P 2 and 2 c P 2 , respectively (the distinction between renewable and conventional cost functions does not affect this analysis). All units share identical power output limits— 0 P k 2 D , ( k = 1 , 2 , 3 ) . The system has an inelastic demand of D .
If Unit 3 bids its true cost coefficient 2 c and Unit 1 bids its true cost coefficient c , the day-ahead market clearing model (Section 3.3) dispatches Unit 1 with output P 1 = D . The resulting marginal price, determined by the derivative of the dispatched unit’s cost function at the clearing point, is λ MP = d c P 2 d P = 2 c P .
However, if Units 1 and 2 engage in strategic bidding, reducing their reported cost coefficients from c and 1.5 c to 2 c ε (where ε > 0 is an arbitrarily small constant), the clearing outcome changes. Units 1 and 2 are now dispatched (sharing the total demand D ), and the marginal price becomes λ MP = d 2 c ε P 2 d P = 2 2 c ε P .
This example demonstrates a critical flaw in the MP mechanism, namely, by strategically understating their costs (making their bids lower than Unit 3’s cost coefficient 2 c ), generators can manipulate the dispatch order. This displaces the higher-cost Unit 3 and elevates the marginal price from 2 c D to approximately 2 2 c ε . Consequently, strategic generators gain increased profit margins due to the inflated settlement price while incurring lower actual costs. This creates a direct incentive for misreporting true costs. Therefore, the traditional MP mechanism fundamentally fails to achieve incentive compatibility in market clearing, whereas the VCG mechanism addresses this vulnerability through its intrinsic design.
Under the settlement mechanism proposed in this study, Table 3 presents the revenue, costs, and net profit allocations for generation units when they report their true operational costs. The results indicate that units with superior economic performance and stronger environmental attributes achieve higher profit margins, as their contributions to day-ahead market clearing are directly linked to revenue generation. The average profit margins for thermal power units across different capacity classes are 28.98%, 20.33%, 14.89%, 5.78%, and 0%, respectively. Also, renewable energy units show margins of 28.24%, 29.36%, 25.41%, and 30.25%.
To validate the incentive compatibility of the proposed mechanism, scenarios were analyzed wherein generation units strategically misreport their cost coefficients within defined proportional ranges. Figure 19 depicts the resulting net profit variations for individual units under different cost declaration strategies.
Moreover, the results demonstrate that all generation units achieve maximum net profit only when the declared-to-actual cost coefficient ratio is equal to 1 (i.e., truthful cost declaration). This outcome arises because the payment mechanism is sensitive to substitution effects between units. Specifically, overstating costs increases total day-ahead market clearing costs, which diminishes the misreporting unit’s substitution effect and lowers its payment allocation.
As a result, the unit’s net profit decreases below its maximum achievable levels. This analysis confirms the mechanism’s intrinsic self-regulating property—any deviation from truthful bidding (declaration ratio ≠ 1) inevitably reduces individual profitability, thereby naturally enforcing incentive compatibility.

6. Conclusions

In light of China’s advancing “Dual Carbon” goals and ongoing electricity market reforms, this study proposes a three-phase coordinated operational framework that integrates medium- and long-term/spot markets to enhance renewable energy accommodation. The main conclusions of this paper are as follows:
(1)
A two-layer game-theoretic framework is established between provincial multi-type generation unit coalitions and quota-bound entities, achieving the joint optimization of electricity and TGC transactions. This mechanism ensures balanced revenue distribution among market participants, with thermal power units experiencing a 19.12% revenue increase. Also, wind and photovoltaic units achieve more substantial gains of 38.76% and 47.52%, while the generation alliance attains a 32.76% aggregate revenue increase. Simultaneously, the framework promotes rational resource allocation through systematic optimization, leading to a 10.61% increase in renewable energy accommodation capacity and a 13.47% improvement in TGC utilization efficiency. These results establish a novel paradigm for resource optimization in power systems with high renewable energy penetration;
(2)
A machine learning-optimization integrated methodology is developed for decomposing medium- and long-term contracts. Utilizing RFR for the multivariate correlation analysis of renewable energy output characteristics, this approach applies convex optimization techniques to achieve the cross-temporal smoothing of contractual energy volumes and TGC. The proposed method enhances contract executability amid renewable energy output volatility, providing technical support for physical delivery coordination between dual market tiers;
(3)
Finally, the VCG mechanism is indispensable in high-renewable-penetration electricity markets. Traditional marginal pricing fails to resolve incentive compatibility issues, enabling strategic bidding that manipulates dispatch sequences and prices, thereby causing market inefficiencies. In contrast, VCG enforces truthful cost reporting by quantifying units’ social welfare contributions, establishing honest bidding as the dominant strategy. Crucially, it internalizes environmental externalities—incorporating renewable energy’s carbon reduction benefits into settlements—to ensure equitable profit distribution between thermal and renewable generation, directly advancing China’s “Dual Carbon” goals. Building on this foundation, decomposed medium- and long-term contracts are integrated into a day-ahead market clearing model with environmentally weighted settlement. This mechanism balances energy value and ecological considerations, enhancing operational coherence between contracts and spot schedules while guaranteeing physical delivery. Dispatch prioritizes units based on economic–environmental attributes, and the VCG framework optimally allocates benefits among heterogeneous generators, effectively curbing strategic bidding across participants. Together, these innovations deliver a market-based paradigm for renewable-dominated power systems.
The game-theoretic model and optimization framework constructed in this study are based on key assumptions of full participant rationality and relatively complete/symmetric information. While these assumptions provide the foundation for model tractability and equilibrium analysis, they also constitute limitations. In real-world markets, participants may exhibit complex behaviors such as bounded rationality, risk-averse behavior, significant information asymmetry, and strategic information concealment. With the continuous reform of China’s electricity market, future research will focus on the following areas to develop a more comprehensive electricity market:
  • Introduce behavioral game theory or evolutionary game approaches to characterize the bounded rational learning processes and adaptive behaviors of market participants;
  • Model information asymmetry problems more deeply—for instance, considering private information related to renewable energy forecast errors or cost parameters—and investigate corresponding signaling mechanisms, mechanism design, or information incentive schemes to address them;
  • Investigate how participants’ risk preferences influence their optimal strategies within multi-market coupled environments.

Author Contributions

Methodology, software, data curation, writing—original draft, visualization, S.W.; conceptualization, investigation, W.W.; conceptualization, investigation, S.Y.; investigation, Q.L. All authors have read and agreed to the published version of the manuscript.

Funding

This research was supported by the National Natural Science Foundation of China, grant number 52267005.

Data Availability Statement

The authors confirm that all data supporting the findings of this study are available within the article.

Conflicts of Interest

The authors declare that they have no known competing financial interests or personal relationships that could have appeared to influence the work reported in this paper.

Appendix A

Table A1. Medium- and long-term trading parameters.
ParametersValue of the Parameter
P e , min /(CNY·MWh−1)200
P e , max /(CNY·MWh−1)350
P T G C , min /(CNY·MWh−1)30
P T G C , max /(CNY·MWh−1)50
c G i , month /(CNY·MWh−1)220
K c /(CNY·t−1)9090
δ c /(t·MWh−1)0.79
K TGC /(CNY/count)60
c punish /(CNY·MWh−1)900
δ RPS 0.2
c R j 160/220
v k 570/523/618
u k /(10−4)1.76/1.90/1.60
Table A2. Parameters of thermal power units.
Thermal Units NumberInstalled Capacity/
MW
Minimum Output/
MW
Ramp-Up Rate/(MW·h−1)Start-Up and Shut-Down Cost/(CNY) a i /(10−3yuan·MW−2) b i /(yuan·
MW−1)
c i /(CNY) Carbon Emission Factor/(TCO2·MWh−1)
1~460030030025614.1187.6025.60.8067
5~735020020022331.78190.9622.30.8385
8~1130018018016223.59197.2616.20.8875
12~1320012012012346.62198.4512.30.9363
14~1513590904665.17201.814.60.9363

References

  1. Sun, X.; He, Y.; Ding, T.; Sun, J.; Yuan, B.; Huang, Y. An Elastic Mechanism and Its Practice for Inter-provincial Mid- and Long term Electricity Transactions in the Context of High Renewable Energy Integration. Proc. CSEE 2025, 45, 2472–2485. [Google Scholar] [CrossRef]
  2. Ma, L.; Fan, M.; Qu, H.; Li, J.; Zhao, Z.; Wu, Z.; Chen, K. The construction path of China’s electricity market and the key issues of market operation. Electr. Power 2020, 53, 1–9. [Google Scholar] [CrossRef]
  3. Huang, Y.; Ding, T.; Li, Y.; Li, L.; Chi, F.; Wang, K.; Wang, X.; Wang, X. A review of low-carbon energy technologies in the context of carbon neutrality and its enlightenment for the development of new power systems. Proc. CSEE 2021, 41, 28–51. [Google Scholar] [CrossRef]
  4. Yan, S.; Wang, W.; Wang, H.; Wu, J.; Li, X.; Qi, Y. Research on the operation strategy of cross-regional system with uncertainty at both ends of source and load. Acta Solarica Sin. 2022, 43, 8–16. [Google Scholar] [CrossRef]
  5. Li, X.; Hu, J.; Zhang, Y.; Wang, Q.; Li, F. Multi-time scale market-oriented operation and scheduling strategy of wind-solar-water-storage consortium. Proc. CSEE 2025, 1–17. [Google Scholar]
  6. Zhang, X.; Liu, D.; Wang, X.; Xue, X.; Li, Z.; Han, J.; Liang, J. Research on intra-month integrated trading mode and unified price limit considering the connection between medium and long-term power and spot market. Power Syst. Technol. 2024, 48, 1418–1430. [Google Scholar] [CrossRef]
  7. Wu, G.; Xiang, Y.; Liu, J.; Zhang, X.; Tang, S. Chance-constrained optimal dispatch of integrated electricity and natural gas systems considering medium and long term electricity transactions. CSEE J. Power Energy Syst. 2019, 5, 315–323. [Google Scholar] [CrossRef]
  8. Xing, Y.; Wang, B.; Ding, W.; Zhang, M.; Gong, S.; Zhang, W. Medium and long term electricity contract decomposition method considering cascade water matching constraints. Yunnan Electr. Power Technol. 2020, 48, 21–26. [Google Scholar]
  9. He, L.; Bao, T.; Liu, C.; Liu, L.; Lv, X. Optimization decomposition and rolling correction algorithm of annual contract electricity for renewable energy. J. Electr. Power Syst. Autom. 2021, 33, 56–65. [Google Scholar] [CrossRef]
  10. Miao, S.; Luo, B.; Shen, J.; Cheng, C.; Li, G.; Sun, Y. Short-term multi-objective power generation dispatch of hydrothermal power considering market transition and medium and long term contract power splitting. Power Syst. Technol. 2018, 42, 2221–2231. [Google Scholar] [CrossRef]
  11. Xu, Y.; Huang, Y.; Li, P.; Geng, T.; Li, F. Medium and long term trading power decomposition method of renewable energy considering priority and power balance. Autom. Electr. Power Syst. 2021, 45, 117–125. [Google Scholar] [CrossRef]
  12. Zhao, S.; Hu, L.; Tian, J.; Xu, Z.Y. Contract power decomposition model of multi-energy power system based on medium and long term wind power photovoltaic prediction. Electr. Power Autom. Equip. 2019, 39, 13–19. [Google Scholar] [CrossRef]
  13. Fan, W.; Huang, L.L.; Cong, B.; Tan, Z.; Xing, T. Research on an optimization model for wind power and thermal power participating in two-level power market transactions. Int. J. Electr. Power Energy Syst. 2022, 134, 107423. [Google Scholar] [CrossRef]
  14. Xu, Y. Spot market in consideration of medium and long term trading restrictions of electricity sales company decision. Energy Policy 2021, 54, 79–85. [Google Scholar]
  15. Do Prado, J.C.; Qiao, W. A stochastic bilevel model for an electricity retailer in a liberalized distributed renewable energy market. IEEE Trans. Sustain. Energy 2020, 11, 2803–2812. [Google Scholar] [CrossRef]
  16. Lu, X.; Qiu, J.; Zhang, C.; Lei, G.; Zhu, J. Seizing unconventional arbitrage opportunities in virtual power plants: A profitable and flexible recruitment approach. Appl. Energy 2024, 358, 122628. [Google Scholar] [CrossRef]
  17. Mondal, S.; Ruffini, M. Fairness Guaranteed and Auction-Based x-Haul and Cloud Resource Allocation in Multi-Tenant O-RANs. IEEE Trans. Commun. 2023, 71, 3452–3468. [Google Scholar] [CrossRef]
  18. Breiman, L. Random Forests. Mach. Learn. 2001, 45, 5–32. [Google Scholar] [CrossRef]
  19. Yang, L.; Su, Z.; Hou, C.; Bai, Y.; Wang, T.; Kong, J. Soil Moisture Content Retrieval in Arid Area Based on Random Forest Using Polarimetric SAR Data. J. Jilin Univ. (Earth Sci. Ed.) 2022, 52, 1255–1264. [Google Scholar] [CrossRef]
  20. Wei, M.; Yu, X.; Yang, X.; Xiao, X. Accuracy analysis of regional ZTD modeling based on random forest and back propagation neural network machine learning method. J. Geod. Geodyn. 2023, 43, 755–760. [Google Scholar] [CrossRef]
  21. You, J.S.; Juarez, R. Incentive-compatible simple mechanisms. Econ. Theory 2021, 71, 1569–1589. [Google Scholar] [CrossRef]
  22. An, Q.; Wang, J.; Wu, Z.; Zhong, H.; Li, G. Benefit Allocation Mechanism Design of Electricity Markets with Penetration ofHigh Proportion of Renewable Energy. Autom. Electr. Power Syst. 2022, 46, 13–22. [Google Scholar] [CrossRef]
  23. Wang, R.; Cheng, S.; Wang, Y.; Dai, J.; Zuo, X. Low-carbon economic optimal scheduling of regional integrated energy system based on multi-agent master-slave game. Power Syst. Prot. Control 2022, 50, 12–21. [Google Scholar] [CrossRef]
  24. Pan, B.; Fang, S.; Li, G.; Lu, X.; Zhou, Z.; Wang, P. Robust optimization economic dispatch method for grid-connected virtual power plant with distributed generation. Renew. Energy Resour. 2022, 50, 12–21. [Google Scholar] [CrossRef]
  25. Li, X. Research on Robust Trading and Operation Strategy Considering Uncertainty Under Dual-Track System. Ph.D. Thesis, Xinjiang University, Ürümqi, China, 2021. [Google Scholar] [CrossRef]
  26. Zhang, Y. Research on Bilateral Transaction Mode and Trading Strategies of Tradable Green Certificates. Ph.D. Thesis, North China Electric Power University, Beijing, China, 2021. [Google Scholar] [CrossRef]
  27. Ren, L.; Zhao, X.; Yu, X.; Zhang, Y. Cost-benefit evolution for concentrated solar power in China. J. Clean. Prod. 2018, 190, 471–482. [Google Scholar] [CrossRef]
  28. Wang, G.; You, D.; Lou, S.; Zhang, Z.; Dai, L. Economic valuation of low-load operation with auxiliary firing of coal-fired units. Energies 2017, 10, 1317. [Google Scholar] [CrossRef]
  29. Schiro, D.A.; Zheng, T.; Zhao, F.; Litvinov, E. Convex hull pricing in electricity markets: Formulation, analysis, and implementation challenges. IEEE Trans. Power Syst. 2015, 31, 4068–4075. [Google Scholar] [CrossRef]
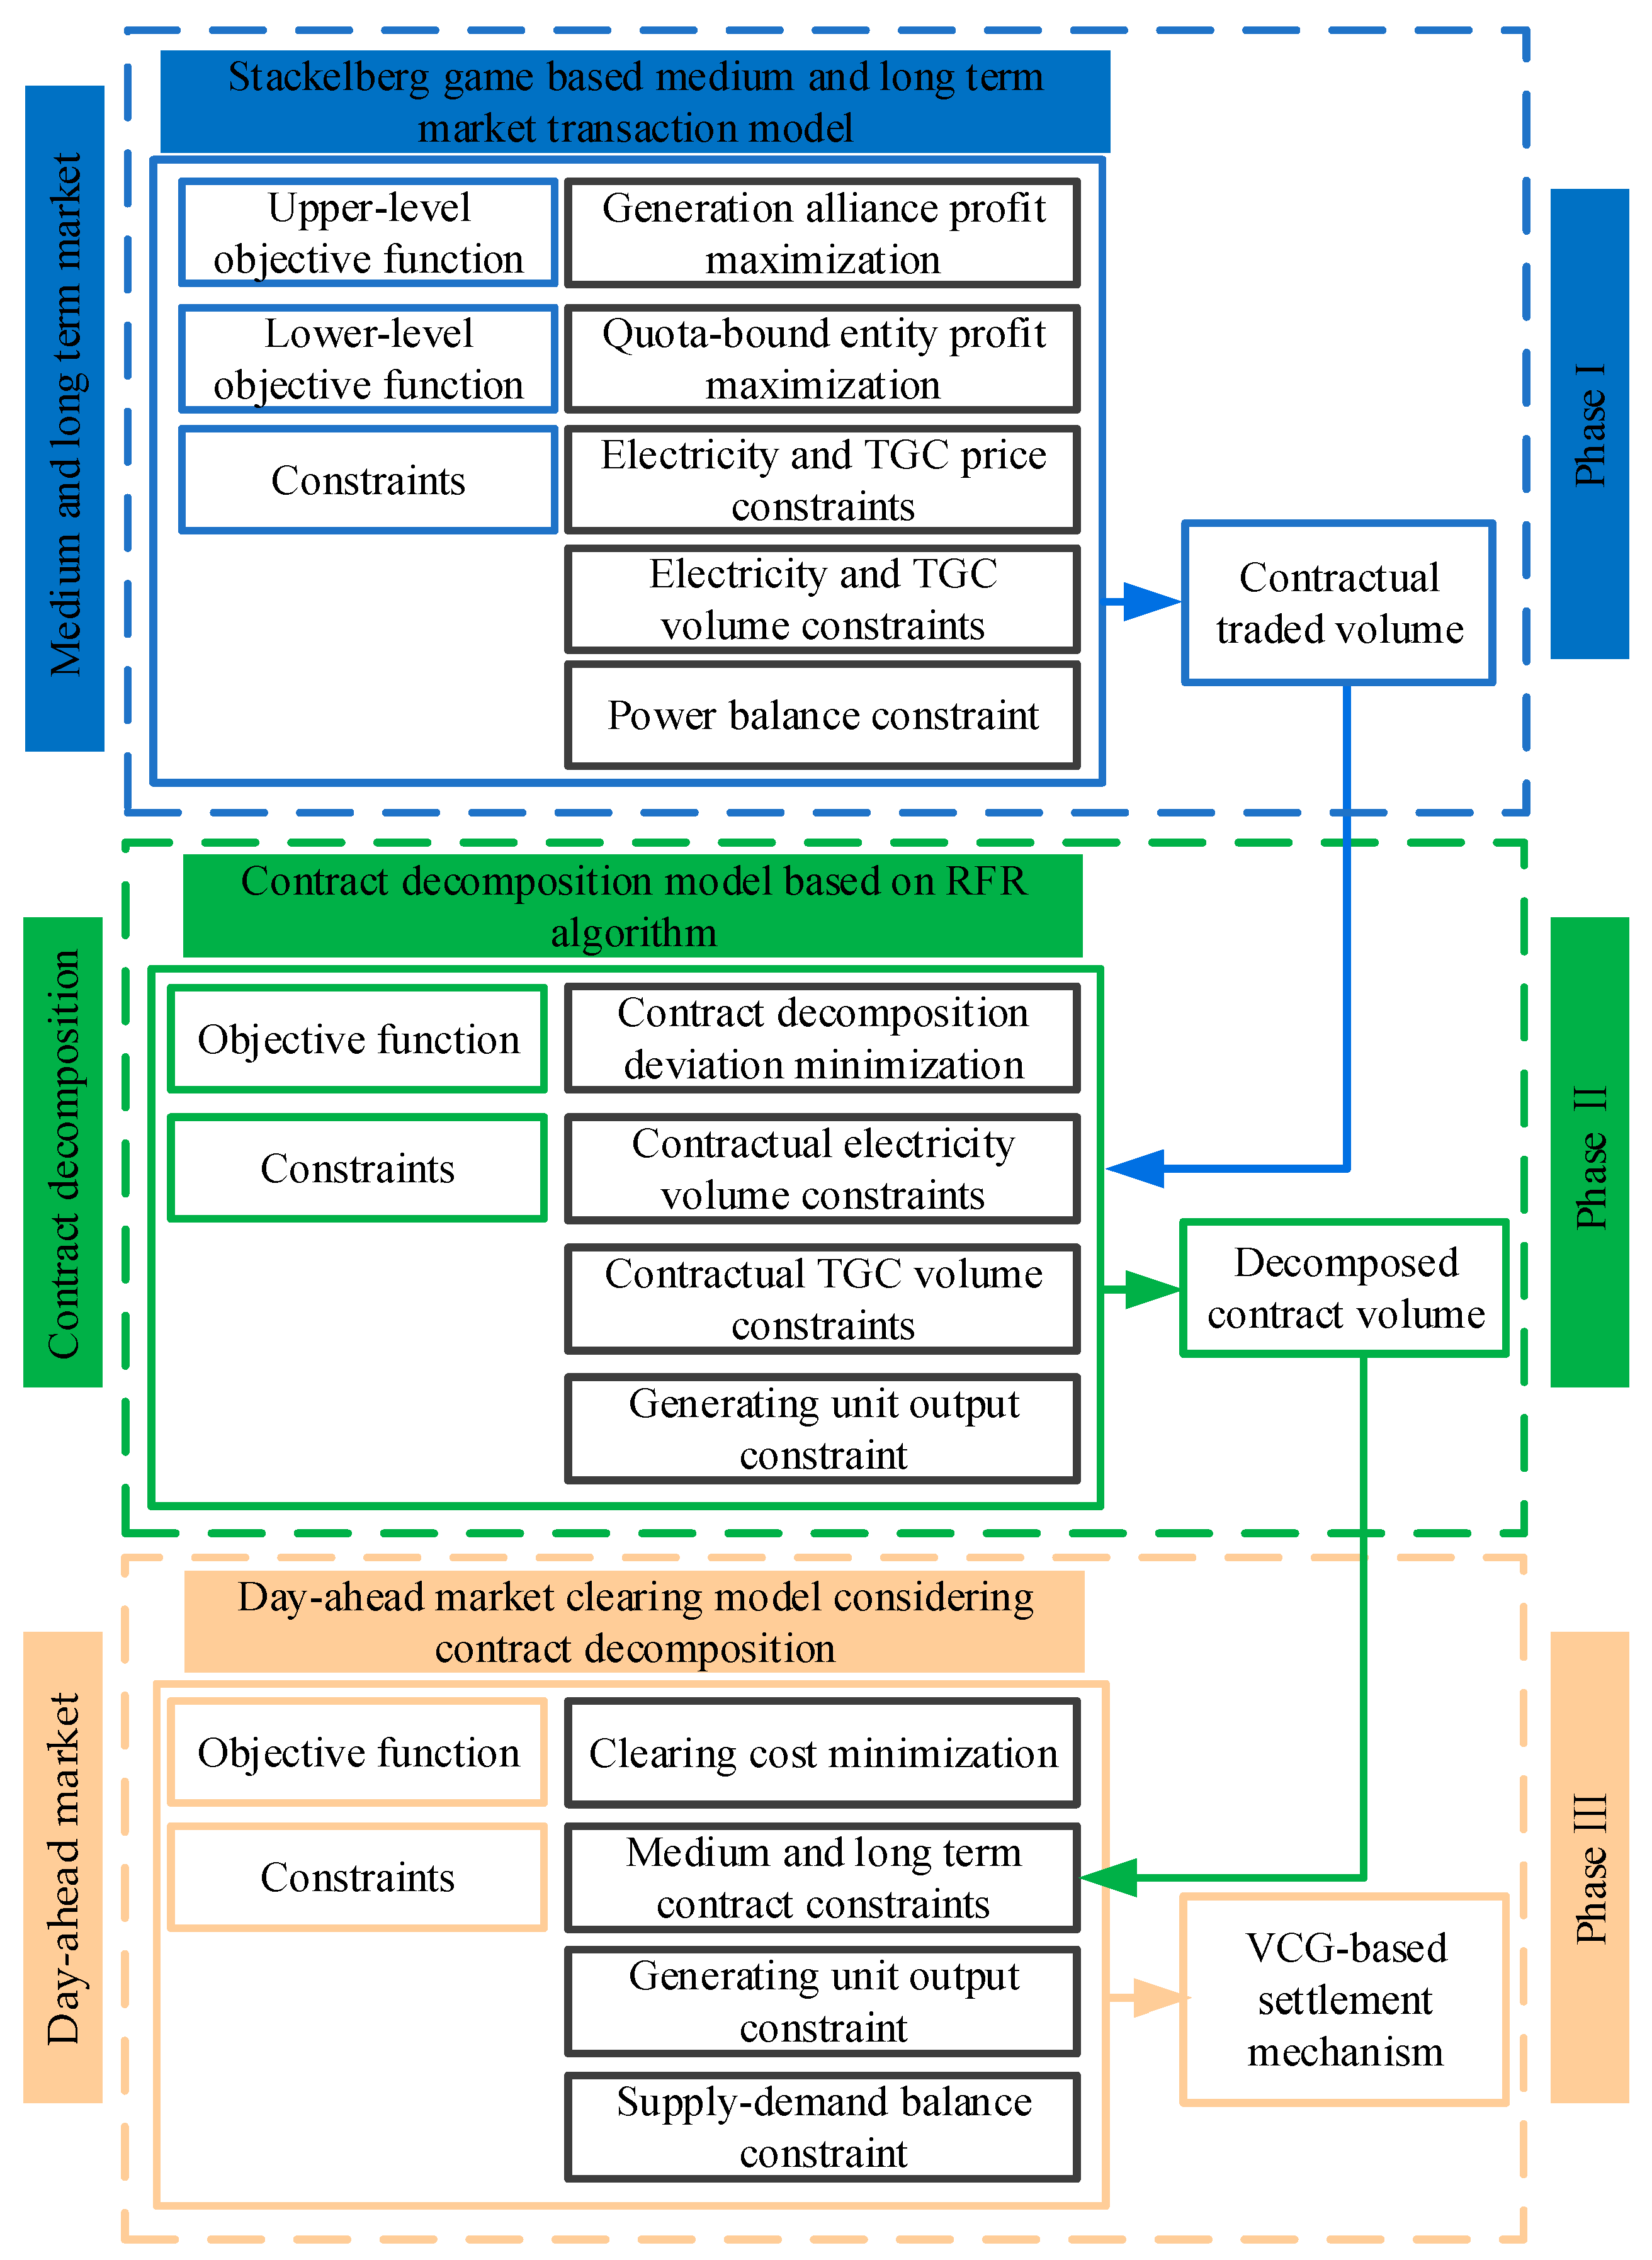
Figure 1. A three-phase joint simulation of the operational mechanism for the medium- and long-term spot market interface.
Processes 13 02478 g001
Figure 2. Interactive diagram of the Stackelberg game model for medium- and long-term trading.
Processes 13 02478 g002
Figure 3. Schematic diagram of the RFR algorithm.
Processes 13 02478 g003
Figure 4. Program solution and calculation flow.
Processes 13 02478 g004
Figure 5. Forecasts of electricity consumption and renewable energy generation for the overall society for each quota subject.
Processes 13 02478 g005
Figure 6. Case 1 Quota Entity A trading strategy.
Processes 13 02478 g006
Figure 7. Case 1 Quota Entity B trading strategy.
Processes 13 02478 g007
Figure 8. Case 1 Quota Entity C trading strategy.
Processes 13 02478 g008
Figure 9. Case 2 Quota Entity A trading strategy.
Processes 13 02478 g009
Figure 10. Case 2 Quota Entity B trading strategy.
Processes 13 02478 g010
Figure 11. Case 2 Quota Entity C trading strategy.
Processes 13 02478 g011
Figure 12. Inter-annual variation patterns of meteorological data in Northwest China.
Processes 13 02478 g012
Figure 13. Annual power generation profile.
Processes 13 02478 g013
Figure 14. Medium- and long-term contract electricity decomposition results.
Processes 13 02478 g014
Figure 15. TGC decomposition results for medium- and long-term contracts.
Processes 13 02478 g015
Figure 16. Day-ahead clearing program.
Processes 13 02478 g016
Figure 17. Thermal power units’ clearing power.
Processes 13 02478 g017
Figure 18. Renewable energy unit clearing power.
Processes 13 02478 g018
Figure 19. Net profit levels under different declaration ratios.
Processes 13 02478 g019
Table 1. Comparison of profits under different game scenarios.
Profits/(×108 yuan)Scenario 1Scenario 2
Thermal unit profits7.468.88
Wind power profits6.218.61
Photovoltaic power profits4.356.41
Generation alliance profits18.0123.91
Quota entity A profits12.9615.35
Quota entity B profits10.159.77
Quota entity C profits20.5820.08
Quota entities profits43.6845.21
Table 2. Comparative analysis of physically fulfilled energy: decomposed medium- and long-term contracts vs. day-ahead market clearing in the electricity market.
Cleared Energy/(×103 MW)Decomposed Energy from Medium- and Long-Term ContractsDay-Ahead Cleared Energy
Thermal unit44.0994.08
Wind power16.8917.03
Photovoltaic power17.7618.84
Table 3. Comparison of revenue and costs for different generation units.
Unit NumberRevenue/(×CNY 104)Cost/(×CNY 104)Profit/(×CNY 104)
G1376.58268.48108.10
G2374.60266.50108.10
G3372.07263.98108.10
G4369.11261.01108.10
G5185.86148.1037.75
G6185.33147.5737.75
G7185.86148.1037.75
G8147.77125.8221.95
G9147.73125.7821.95
G10147.22125.2721.95
G11146.78124.8321.95
G1288.5983.475.12
G1388.6283.505.12
G1461.0261.020.00
G150.000.000.00
PV1223.78160.5963.19
PV2273.19192.9680.22
WT1280.93209.5571.38
WT2247.51172.6574.87
Disclaimer/Publisher’s Note: The statements, opinions and data contained in all publications are solely those of the individual author(s) and contributor(s) and not of MDPI and/or the editor(s). MDPI and/or the editor(s) disclaim responsibility for any injury to people or property resulting from any ideas, methods, instructions or products referred to in the content.