Article

Eudragit® S 100 Coating of Lipid Nanoparticles for Oral Delivery of RNA

by
Md. Anamul Haque
,
Archana Shrestha
and
George Mattheolabakis
*
School of Basic Pharmaceutical and Toxicological Sciences, College of Pharmacy, University of Louisiana at Monroe, Monroe, LA 71201, USA
*
Author to whom correspondence should be addressed.
Processes 2025, 13(8), 2477; https://doi.org/10.3390/pr13082477
Submission received: 3 June 2025 / Revised: 29 July 2025 / Accepted: 30 July 2025 / Published: 5 August 2025

Abstract

Lipid nanoparticle (LNP)-based delivery systems are promising tools for advancing RNA-based therapies. However, there are underlying challenges for the oral delivery of LNPs. In this study, we optimized an LNP formulation, which we encapsulated in a pH-sensitive Eudragit® S 100 (Eu) coating. LNPs were prepared using the DLin-MC3-DMA ionizable lipid, cholesterol, DMG-PEG, and DSPC at a molar ratio of 50:38.5:10:1.5. LNPs were coated with 1% Eu solution via nanoprecipitation using 0.25% acetic acid to get Eu-coated LNPs (Eu-LNPs). Particle characteristics of LNPs were determined by using dynamic light scattering (DLS). Ribogreen and agarose gel retardation assays were used to evaluate nucleic acid entrapment and stability. LNPs and Eu-LNPs were ~120 nm and 4.5 μm in size, respectively. Eu-LNPs decrease to an average size of ~191 ± 22.9 nm at a pH of 8. Phosphate buffer (PB)-treated and untreated Eu-LNPs and uncoated LNPs were transfected in HEK-293 cells. PB-treated Eu-LNPs showed significant transfection capability compared to their non-PB-treated counterparts. Eu-LNPs protected their nucleic acid payloads in the presence of a simulated gastric fluid (SGF) with pepsin and maintained transfection capacity following SGF or simulated intestinal fluid. Hence, Eu coating is a potentially promising approach for the oral administration of LNPs.

1. Introduction

The success of Onpattro, the first-of-its-kind FDA-approved small interfering RNA (siRNA) therapy for hereditary transthyretin-mediated amyloidosis (hATTR), and mRNA vaccines by Moderna and Pfizer/BioNTech against COVID-19 represented significant milestones in RNA-based therapies, showcasing their immense potential to treat both genetic and infectious diseases [1,2]. Notably, lipid nanoparticles (LNPs) were used as the delivery system in Onpattro and mRNA vaccines, playing a pivotal role in ensuring the stability and effective delivery of the respective nucleic acids to the target cells [3]. LNPs, which incorporate ionizable lipids, remain without a cationic charge at a neutral pH, while a layer of helper lipids assists in the protection of the encapsulated nucleic acids. However, at lower pH values, the LNPs’ ionizable lipids become positively charged, which, with the helper lipids, assists in the endosomal escape for the release of the nucleic acid load into the cytosol. Unlike permanent cationic lipids used in cationic liposomes or LNPs, this behavior of the ionizable lipids and the biocompatibility of the helper lipids contributed to diminished cytotoxicity with potent transfection capacity [4,5]. However, approved LNP-based therapeutics, including Onpattro, COVID vaccines (Comirnaty, Spikevax), and techniques in ongoing clinical trials using LNP and liposomal gene therapy [5,6] for a wide variety of diseases are injectables (i.e., IV, IM, etc.) [7,8].
Despite significant progress in RNA therapeutics, the development of oral gene delivery systems remains a major challenge and an area with substantial room for advancement. The main hurdles for oral gene delivery include degradation by enzymes, low pH, the presence of ribonucleases in the digestive tract and poor permeation of the RNA across the intestinal epithelium, which restricts the entry of RNA into target tissues [9,10]. In recent years, efforts have taken place to address the oral delivery of nucleic acids. Representatively, chitosan-gold-taurocholic acid-based nanoparticles were developed by Kang et al. for oral delivery of Akt2 siRNA to study colorectal liver metastasis in mice [11]. In another interesting study, Abramson et al. used an innovative capsule system to orally deliver mRNA entrapped in nanoparticles to the gastrointestinal tissues [12]. However, LNP systems have not extensively studied for oral administration, as it has been reported that LNPs poorly survive in the harsh environment of the GI tract, which creates a significant hurdle for their use in oral delivery [13], unless modification with cationic lipids takes place [14]. In fact, it was previously recommended that protection of LNPs with a polymer coating, such as Eudragit® (Eu), should take place for oral delivery of this formulation [13].
Eu polymers have been extensively used to protect labile molecules as they traverse through the GI tract. Though there is a variety of Eu polymers with different properties, certain types of these polymers, also known as enteric polymers, present a pH-dependent solubility. For example, in acidic environments, such as the stomach, the polymer remains insoluble, while in the more neutral to basic intestinal environment, its solubility increases, allowing the release of entrapped compounds [15]. Thus, these polymers protect compounds from their premature degradation in the stomach. Similarly, the Eu polymers have been used for the development or protection of nanoparticles. Eu S 100 is a polymer used for this purpose. It is part of the Eu family of polymers, which is pH-sensitive and dissolves at a pH of ~7 [16,17] and has been used to coat nanoparticles with various payloads [18,19]. Similarly, a Eu coating of liposomal formulations has been reported for protecting the liposomes following oral administration during their passage through the GI tract [20,21,22]. Barea et al. studied the drug release pattern of Eu S 100-coated liposomes and found significantly reduced drug release at gastric pH and comparable release to uncoated liposomes at intestinal pH [23]. Subsequently, they developed a liposome-in-microsphere (LIM) formulation, where chitosan-coated liposomes were encapsulated within a pH-sensitive Eu S 100, which enhanced gastric protection and enabled site-specific release of 5-aminosalicylic acid in the intestinal environment [24]. In this study, we investigated the development of a novel delivery system composed of Eu S 100-coated LNPs with encapsulated mRNA using a pH-driven nanoprecipitation method. The carrier was designed for oral delivery and to protect LNPs with mRNA in harsh environments simulating the GI tract. Here, we evaluate the carrier for stability and release of the nucleic acids loads and LNPs (Figure 1A).

2. Materials and Methods

2.1. Materials

DLin-MC3-DMA was purchased from MedChemExpress (Deerpark, NJ, USA). Cholesterol and 1,2-dioctadecanoyl-sn-glycero-3-phosphocholine (DSPC) were purchased from Avanti Polar Lipids (Birmingham, AL, USA). We obtained 1,2-Dimyristoyl-rac-glycero-3-methoxypolyethylene glycol-2000 (DMG-PEG 2000) from Cayman Chemical (Ann Arbor, MI, USA) and firefly luciferase mRNA (ARCA, 5mCTP, catalog no: R1012) from APExBIO Technology LLC (Houston, TX, USA). Eudragit® S 100 (CAS No: 25086-15-1) was obtained from Evonik, Essen, Germany. Triton X-100 was purchased from Sigma-Aldrich (St. Louis, MO, USA). Quant-iT Ribogreen RNA reagent, RNase A, RiboRuler High Range RNA Ladder, RiboLock RNase Inhibitor, SYBR GOLD and Lipofectamine 2000 were purchased from Thermo Fisher Scientific (Waltham, MA, USA). Dulbecco’s Modified Eagle Medium (DMEM), RPMI 1640 and Leibovitz’s L-15 Media (L-15) were purchased from Thermo Fisher Scientific. Minimal Essential Medium (EMEM) was purchased from Quality Biological (Gaithersburg, MD, USA). Staggard herringbone microfluidic mixer was acquired from Darwin Microfluidics (Paris, France).

2.2. Preparation of Lipid Nanoparticles

LNPs were prepared using DLin-MC3-DMA as the ionizable lipid. DLin-MC3-DMA, Cholesterol, DSPC, and PEG2000-DMG were mixed at a molar ratio of 50:38.5:10:1.5 in 100% ethanol, while mRNA was dissolved in 30 mM of sodium acetate buffer at pH 4.0 [25,26,27]. For the LNP formulation, we evaluated 9 different preparation conditions, as presented in Table 1. Briefly, we evaluated the change of two major conditions: (a) nitrogen-to-phosphate (N/P) ratio, ranging between 3 and 10, and (b) starting total lipid concentration, ranging between 1.5 and 2.2 mg/mL. For mixing the two solutions, a staggard herringbone microfluidic mixer equipped with two syringe pumps (Braintree Scientific & KD Scientific Inc., Braintree, MA, USA) was used [28,29]. The inlets of the mixer were connected to the pumps using PEEK tubing (Trajan Scientific and Medical, Ringwood, VIC, Australia) with an 0.02-inch internal diameter. We maintained a total flow rate of 2 mL/min [30] with an aqueous-to-ethanol solution mixing ratio of 3:1, v/v [31]. LNPs were immediately washed in 1× PBS, pH 7.4, and centrifuged at 1000× g using Amicon® Ultra-15 centrifugal filter units with a molecular weight cutoff of 30 kDa. The final formulation was filtered through a 0.22 µm filter and stored at 4 °C. In total, 18 batches were prepared for 9 different combinations (duplicates).

2.3. mRNA Encapsulation

The encapsulation of mRNA within LNPs was quantified using the Quant-iT Ribogreen assay, with minor modifications, where possible [32]. For encapsulation quantification, LNPs were treated with or without 0.1% Triton X-100, which facilitated the lysis of LNPs’ lipid layers to release the entrapped mRNA. LNPs without Triton X-100 pre-treatment were directly diluted with 1× TE buffer (10 mM Tris-HCl, 1 mM EDTA, pH 7.5) to make a final volume of 100 µL. Alternatively, LNPs were mixed at a 1:1 v/v ratio with Triton X-100 and incubated for 5 min at room temperature before their dilution with TE buffer to 100 μL final volume. A standard curve was prepared upon serial dilution of a known standard of mRNA. 100 µL of samples and standards were placed in a clear-bottom black microplate (Corning® 96-well plate, catalog number: 3603, Corning, NY, USA) in duplicates, followed by the addition of 200 times diluted 100 µL Quant-iT™ RiboGreen™ RNA reagent in each respective well. Following brief incubation at room temperature in darkness, fluorescence was measured at an excitation of 480 nm and an emission of 520 nm.

2.4. Differential Light Scattering (DLS) and Cryo-TEM Imaging

We determined the particle size, polydispersity index (PDI), and Zeta potential using NanoBrook 90Plus PALS Brookhaven (Holtsville, NY, USA) at 25 °C [33]. For the cryo-TEM, 3 μL of sample solution was applied to a 300-mesh Lacey Carbon film grid (EMS LC300-CU-150). The blotting procedure and the quenching of specimens were performed using a Cryoplunge 3 (Gatan, Pleasanton, CA, USA) using 1.8 s plotting time. After cold-stage transfer, the samples were mounted and examined using a JEOL JEM-1400 electron cryo-microscope (Tokyo, Japan), operating at an accelerating voltage of 120 kV. The stage temperature was maintained below −170 F, and images were recorded at a defocus setting with the Gatan US1000xp2 camera [33].

2.5. Gel Retardation and Nuclease Stability Assay

mRNA encapsulation in LNPs was evaluated using gel retardation assay. Briefly, LNPs with mRNA treated with or without 0.1% Triton X-100 were introduced into the wells of an agarose gel. For stability against RNases, Ribonuclease A from the bovine pancreas (Fisher Scientific, Waltham, MA, USA) was used. Briefly, 100 mAU of RNase A per µg of naked mRNA or mRNA-LNPs were mixed and kept at room temperature for 15 min. RNase A was deactivated with the introduction of the RiboLock RNase Inhibitor (16 U/mAU of RNase). Subsequently, the samples were treated with or without 0.1% Triton X-100 in nuclease-free water. All samples were run on a 1.2% agarose gel for 90 min, followed by staining with 10,000-fold diluted SYBR™ Gold Nucleic Acid Gel Stain for 45 min before imaging. All gels were visualized using a Chemidoc Touch Imaging system (Biorad, Hercules, CA, USA).

2.6. Cell Culture, Cytotoxicity and In Vitro Transfection

HEK-293, RAW 264.7, HT-29 and SW480 cells were obtained from ATCC and cultured in EMEM, DMEM, RPMI 1640 or L-15, respectively, with 10% Fetal Bovine Serum (FBS) and 5% penicillin-streptomycin. Cells were cultured at 37 °C under humidified conditions, with 5% CO2, except for the SW480 cells which were incubated at 100% oxygen.
For transfection, 104 cells were seeded into the wells of 96-well clear-bottom black microplates. Luciferase-expressing mRNA was used for the in vitro transfections. The following day, cells were washed with 1× PBS and transfected with LNP-mRNA or Lipofectamine-mRNA (LFA-mRNA) at a dose of 125 ng of mRNA per well. Samples were incubated with the cells at 37 °C for ~6 h, followed by replacement with complete media. Subsequently, the cells were incubated for 48 h. LNPs containing luciferase mRNA were diluted with complete media, while mRNA-LFA complexes were diluted with Opti-MEM™ I (Reduced Serum Medium) and incomplete media. Fluorescence for viability and luminescence for transfection were detected using Cell Titer-Fluor™ and ONE-Glo reagent (Promega, Madison, WI, USA), respectively, using a Biotek Synergy H1 Hybrid Microplate Reader (Winooski, VT, USA).

2.7. Macrophage Polarization of mRNA-LNPs

600 × 103 RAW 264.7 cells were incubated with LPS (Lipopolysaccharide, 100 ng/mL) and IFN-γ (Interferon-gamma, 20 ng/mL) or IL-4 (Interleukin-4, 20 ng/mL) for 48 h to promote the development of pro-inflammatory or anti-inflammatory phenotypes [34]. By performing qPCR, mRNA expression gene levels associated with the pro-inflammatory phenotype, i.e., iNOS, and the anti-inflammatory phenotype, i.e., Arg-1, were measured [35,36]. The iNOS-to-Arg-1 ratio was used to identify macrophage polarization. A higher iNOS/Arg-1 ratio suggests a shift towards pro-inflammatory polarization, while a lower iNOS/Arg-1 ratio indicates a shift towards anti-inflammatory polarization.
We evaluated pro-/anti-inflammatory responses of RAW 264.7 cells in response to LNP-mRNA and LFA-mRNA. After ~6 h of treatment followed by 48 h of incubation, iNOS and Arg-1 gene expressions were measured by qPCR to evaluate the iNOS/Arg-1 ratio.

2.8. Preparation of Eu-Coated Lipid Nanoparticles (Eu-LNPs)

Prepared and characterized LNPs were mixed with 1% Eu S 100 and 1% PVA solution in Phosphate Buffer, pH 8, at Eu S 100–total lipid (Eu/L; w/w) ratios of 0.8 and 1.6. This mixture was then rapidly mixed and diluted with 0.25% acetic acid, pH 3, using a T-junction mixer/pump system at a flow rate of 1:9 (Eu-PVA mix to acetic acid, v/v) [37,38]. The Eu-coated LNPs (Eu-LNPs) produced were allowed to rest under stirring for 15-20 min before further use. The samples were subsequently centrifuged at 3000 rpm for 5 min. The supernatant was discarded and the pellet was resuspended in the same medium to obtain the final Eu-LNPs. Via a limited stability study, we identified that Eu-LNPs and their mRNA remained stable for at least up to 7 days post-preparation (maximum tested time point), as detected by gel electrophoresis. For long-term storage, a more extensive stability study will be required.

2.9. Eu-LNP In Vitro Transfection

Eu-LNPs were transfected in HEK-293 cells with or without phosphate buffer (PB) pre-treatment (WPB vs. WTPB, respectively). For PB pre-treatment, Eu-LNPs were initially diluted with PB at a 1:1 (v/v) ratio and then further diluted with complete media to achieve 4-, 8-, 12- and 16-fold dilutions (4D, 8D, 12D and 16D, respectively, in Table 2). WTPB samples received the same final dilutions with complete media only (no PB addition). Due to Eu interference with RNA quantification using the Ribogreen assay described above, dosing among different dilution groups is not uniform. However, within each dilution group, the mRNA amount remained constant, ensuring that any observed effects were due to the formulation and treatment conditions, rather than differences in mRNA dose. Following dilution, the transfection media containing the particles was added to wells for transfection, as described above. The LNP group served as the baseline control for the particles before coating at 250 ng of mRNA per well.

2.10. Evaluation of Eu-LNPs Stability After Treatment with Simulated Gastric Fluid (SGF) and Transfection of the Particles Following Either SGF or Simulated Gastric Fluid (SIF) Treatment

To evaluate the mRNA stability in Eu-LNPs, we utilized two methodologies. First, we evaluated the mRNA integrity using gel electrophoresis, and secondly, we assessed the ability of the Eu-LNPs to transfect HEK-293 cells in vitro.
For the gel electrophoresis, Eu-LNPs loaded with luciferase-expressing mRNA were incubated in simulated gastric fluid (SGF) with pepsin at concentrations of 0.32 mg/mL and 3.2 mg/mL for 30 min to evaluate Eu-LNPs stability at simulated fasting and feeding states of the stomach, respectively [11]. Following the Eu-LNPs’ incubation with SGF, we added phosphate buffer (PB) and protease inhibitors (Pro) to neutralize the pH and gradually deactivate pepsin (Pep). The methodology for deactivation was first confirmed by mixing the deactivated media with naked mRNA and evaluating the mRNA’s integrity. Finally, treated Eu-LNPs were mixed with 0.1% Triton X-100 (T) to release the encapsulated nucleic acids, and the samples were analyzed using 1.2% agarose gel electrophoresis.
For transfection, SGF-Pep (pepsin)- and SIF-Pan (pancreatin)-treated Eu-LNPs were transfected in HEK-293 cells to evaluate their transfection capability in both feeding and fasting states. Briefly, Eu-LNPs incubated with SGF-pepsin and SIF-pancreatin for 30 min were diluted with PB and complete media (final dilution of the particles at 8×) for SGF-Pep-treated samples and complete media for SIF-Pan treatment, before addition to wells with HEK-293 cells for transfection, following the protocol described above.

2.11. Statistical Analysis

We analyzed the obtained data using a one-way analysis of variance (ANOVA) followed by Tukey’s post hoc test to determine the significance of differences among multiple groups and a pairwise t-test to evaluate the significance of differences between two groups. We presented data as mean values ± standard error of the mean (SEM), where possible. p-values ≤ 0.05 were considered statistically significant.

3. Results

3.1. Characterization of LNPs

We prepared LNPs using the ionizable lipid DLin-MC3-DMA to encapsulate model nucleic acids using a microfluidic mixing chip. Our objective was to identify optimal conditions for LNP preparation by adjusting either the N/P ratio between ionizable lipids and nucleic acids or by altering the total lipid concentration introduced to the formulation. The produced LNPs were characterized for size, zeta potential and nucleic acid content. We determined that the LNPs had a hydrodynamic size ranging from 99 to 133 nm, which corresponds with cryo-TEM imaging. The polydispersity index varied between 0.119 and 0.177, while the zeta potential was from −7.1 to 7.02 mV. The encapsulation ranged from 76.9 to 94.5% (Table 3). Encapsulation increased significantly with the change in N/P ratio from 3 to 10, while there was a subtle difference in particle size, polydispersity index and zeta potential. Higher encapsulation of mRNA was observed when total lipid concentration (TLC) increased from 1.5 to 1.8 mg/mL for each of the respective tested N/P ratios. However, no further improvement in encapsulation was observed when TLC increased to 2.2 mg/mL (Figure 1B).

3.2. LNPs Encapsulate mRNA with Optimal Morphological Characteristics and Payload Retention

Morphology was assessed using TEM, and the particles were found to be round-shaped with diameters comparable to those detected by DLS measurements, as shown in Figure 1C. The gel retardation assay indicated that the mRNA was effectively captured by the DLin-MC3-DMA-based LNPs across different formulations with varying N/P ratios and TLCs. There was limited to no mRNA detected outside the LNPs. For the release of the nucleic acid load, the LNPs were treated with 0.1% Triton X-100 in TE buffer for 5 min at room temperature (Figure 1D).

3.3. LNPs Protected the Nucleic Acid Load from RNase Degradation

We evaluated the ability of LNPs to protect RNA from enzymatic degradation, which is crucial for the stability and efficacy of RNA-based therapeutics. After RNase treatment and incubation of naked or LNP-encapsulated mRNA, we evaluated the mRNA stability using gel electrophoresis. Naked mRNA and unencapsulated mRNA outside LNPs were rapidly degraded by RNases (Figure 1E). We also treated the mRNA- LNP with RNases, followed by RNase inhibition and 0.1% Triton X-100. LNPs retained and protected their nucleic acid load against RNase degradation, as their nucleic acid load remained stable, following the RNase treatment, their deactivation and subsequent release of the nucleic acids with Triton treatment.

3.4. LNPs Demonstrated Limited Cytotoxicity and Inflammatory Response but Strong Transfection In Vitro

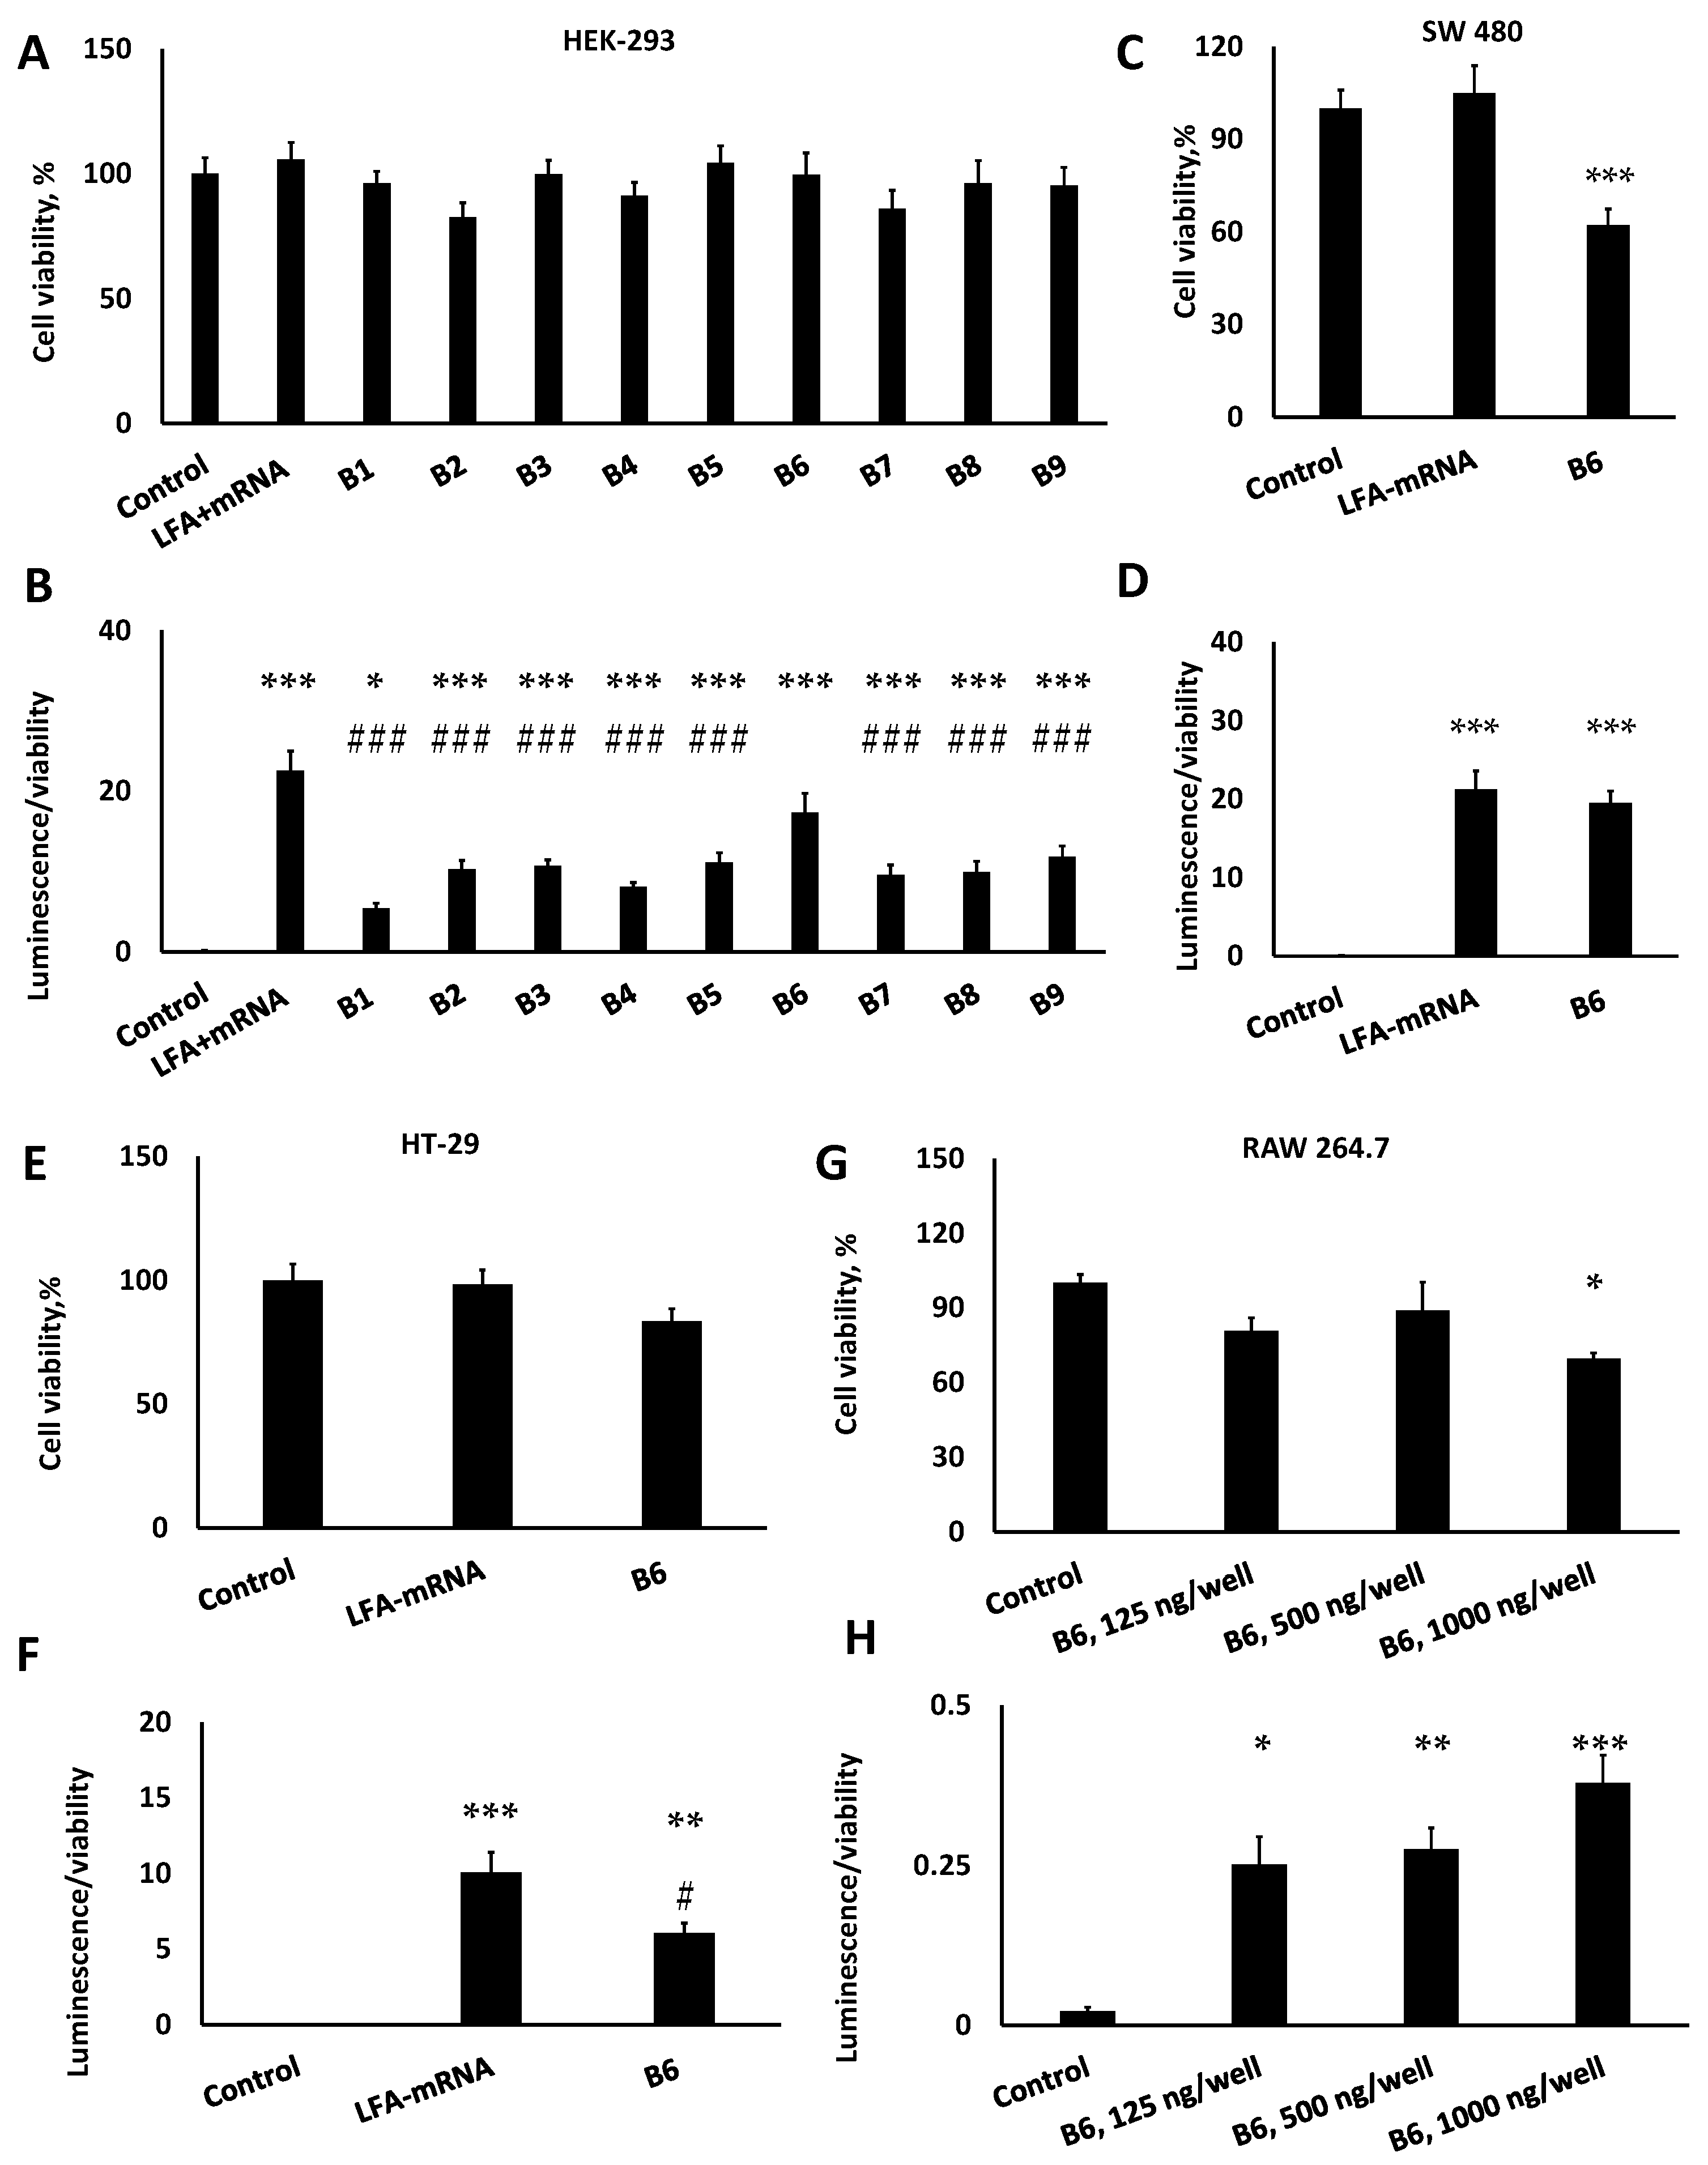
We transfected all the formulations in Table 1 at 125 ng of mRNA per well in HEK-293 to compare their transfection and cell viability. Based on these results, we selected the formulation that exhibited the strongest transfection capability and used it for all subsequent analyses. Thus, the selected formulation was evaluated against SW480, HT-29 and RAW 264.7 cells for transfection, cytotoxicity and macrophage polarization. Groups transfected with lipofectamine (LFA-mRNA) were considered positive controls. To normalize our results, we utilized the ratio of luminescence to viability as an indicator of transfection efficiency, as it takes into consideration the luminescence signal per cell count.
Using HEK-293 cells, all of the formulations presented limited cytotoxicity (Figure 2A) and significant transfection signal compared to the control. Although LFA was significantly higher than all of the tested formulations (p < 0.05 using Tukey’s post hoc analysis), LNPs also demonstrated potent transfection, ranging between 24–77% of the LFA transfection levels. In fact, the formulation B6 indicated a non-statistically significant difference compared to the LFA transfection, as indicated by a pairwise t-test analysis (Figure 2B). Thus, we selected this formulation for further evaluation of its transfection capability in the other cell lines.
There was a significant luciferase expression in SW480 (p < 0.001) compared to control (Figure 2D). Similarly, in HT-29 cells, B6 produced strong luciferase expression (p < 0.01) vs. control (Figure 2F). Finally, B6 successfully induced luciferase expression in RAW 264.7 cells (p < 0.001; Figure 2H).
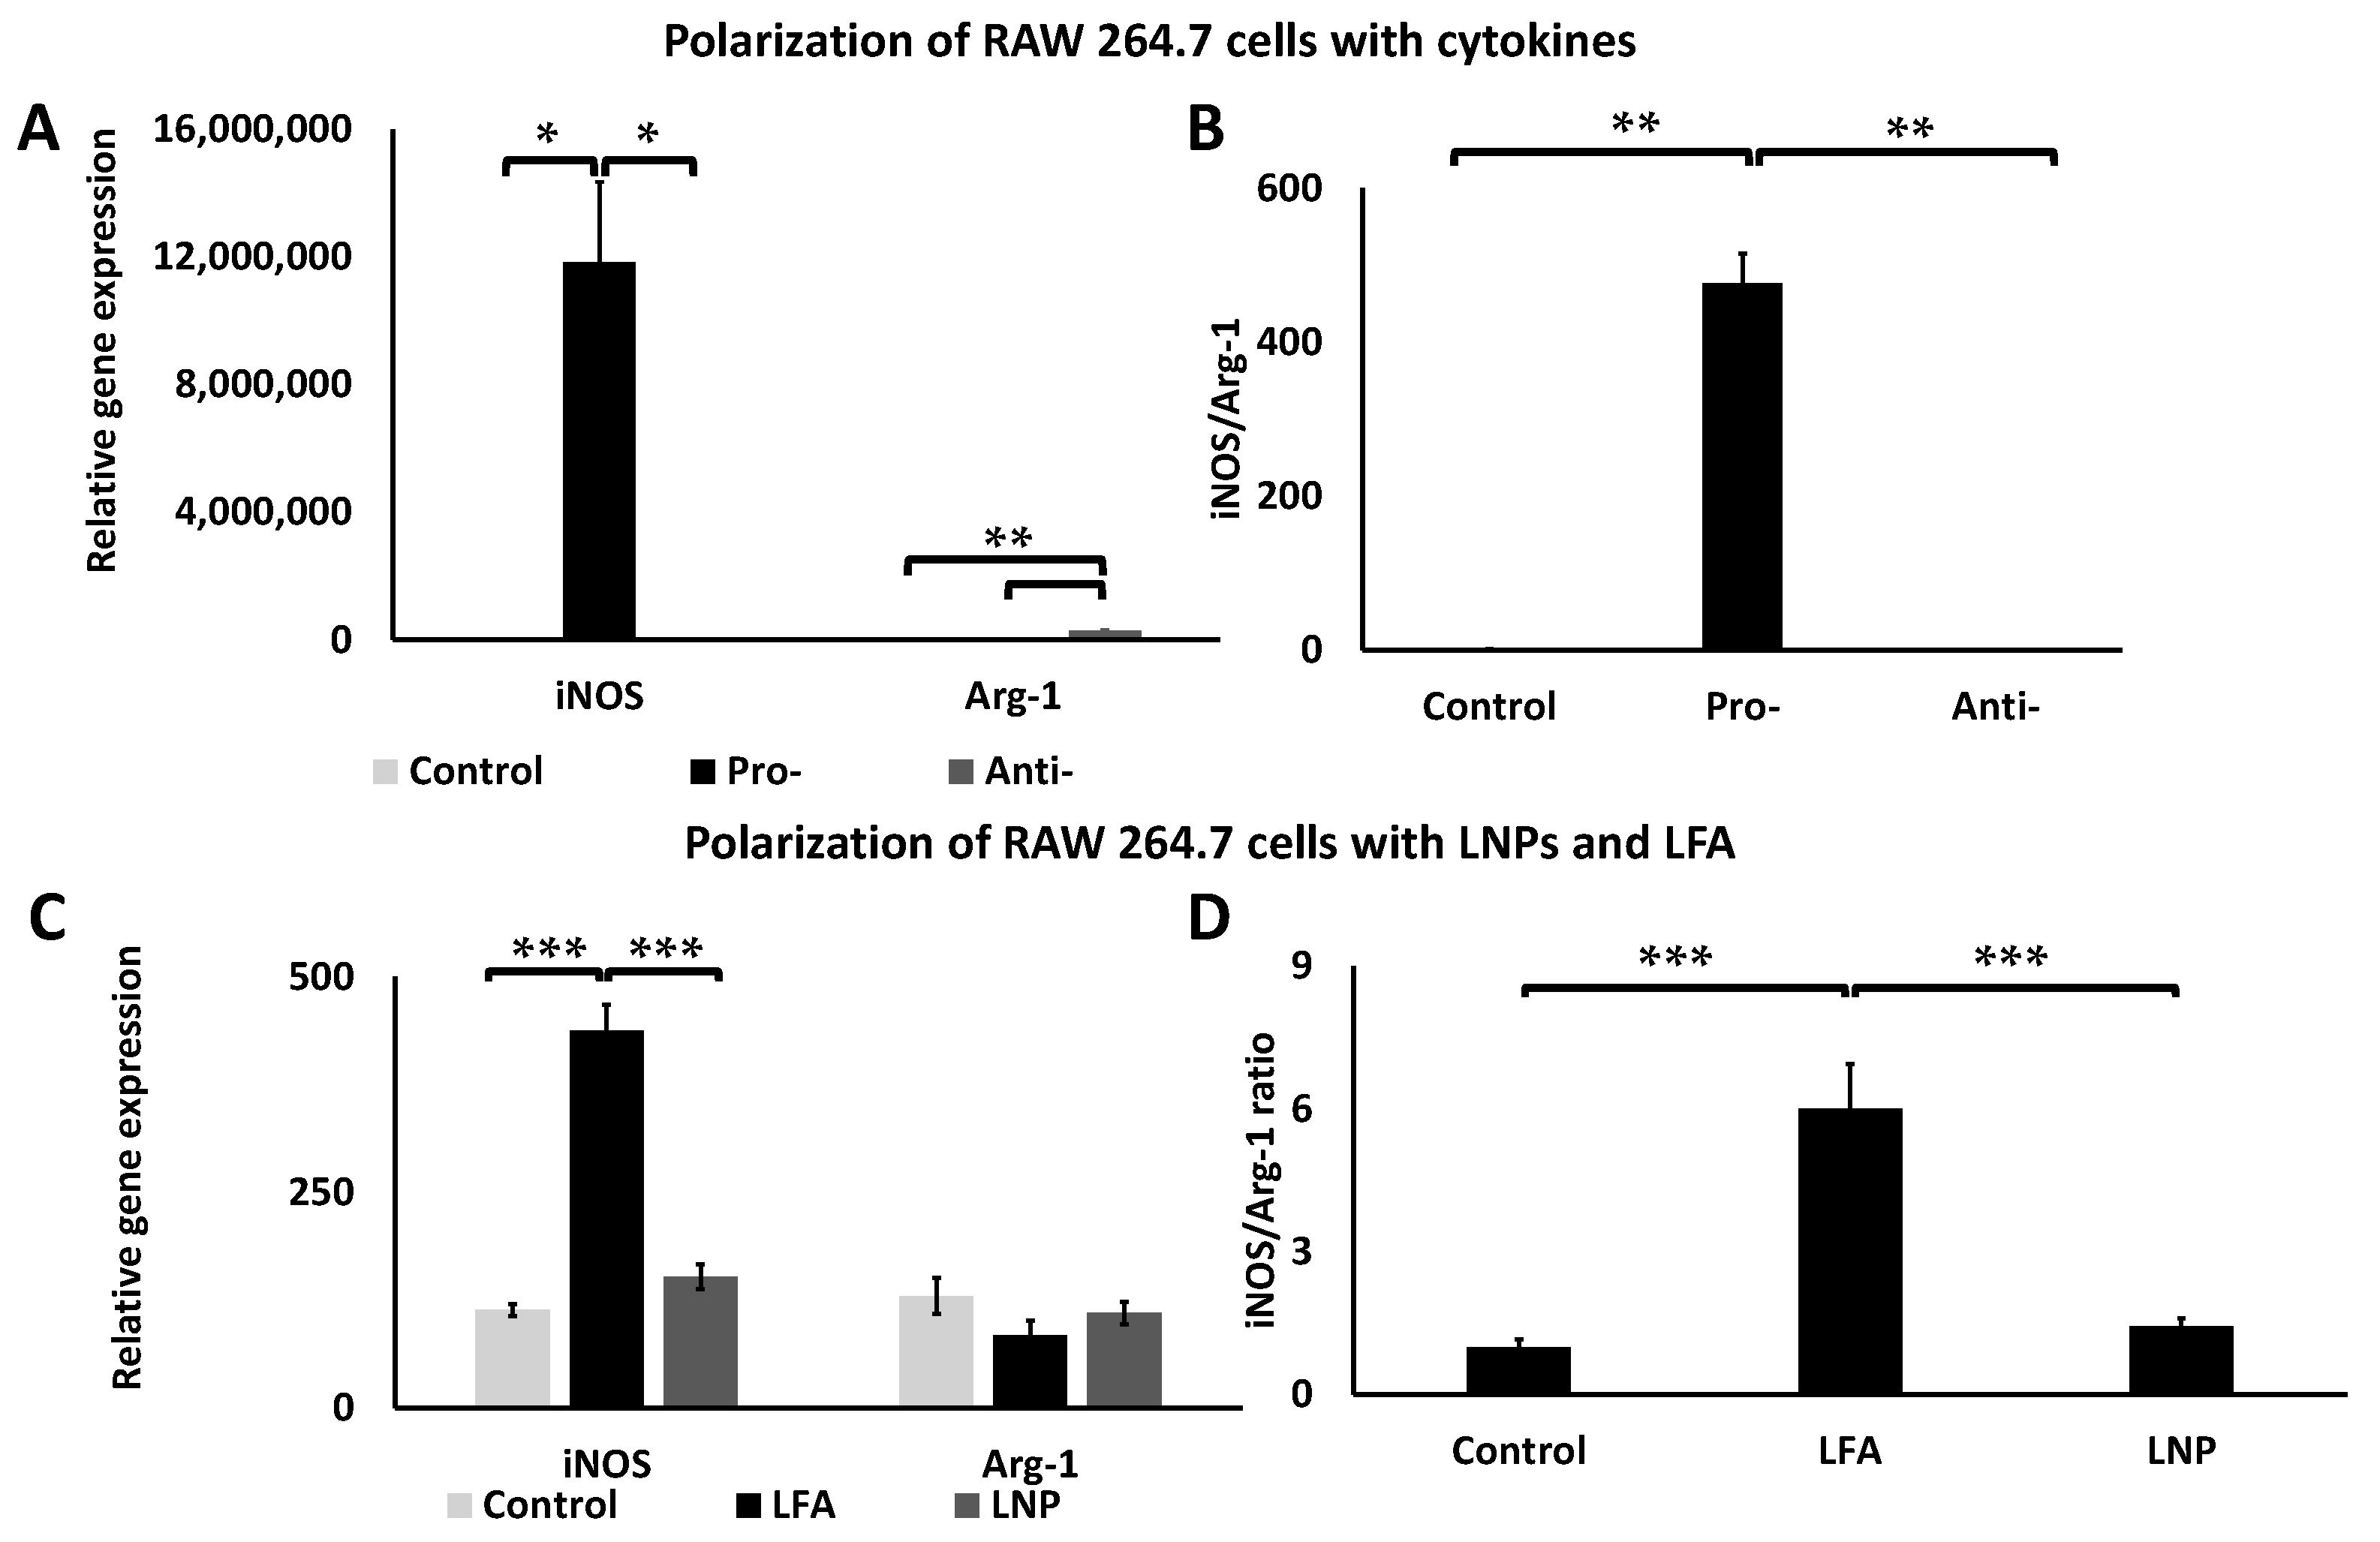
Finally, we evaluated the inflammatory effect of the LNPs in macrophages. As oral delivery may take place during inflammatory conditions, we evaluated whether LNPs could potentially exacerbate inflammation. To this end, we used RAW 264.7 cells to evaluate the LNPs. First, we used qPCR to detect the pro- or anti-inflammatory macrophage response to LPS with IFN-γ, and IL-4, respectively. iNOS was selected as a gene associated with pro-inflammatory macrophage response, while Arg-1 was selected for the anti-inflammatory response. A ratio between the expression of the two genes (i.e., iNOS/Arg-1) was used as a criterion of an inflammatory response. As shown in Figure 3A, LPS with IFN-γ caused a significantly (p < 0.05) higher iNOS expression in the macrophages, while IL-4 caused a significantly (p < 0.05) higher expression of Arg-1 in the macrophages. The iNOS/Arg-1 ratio was at ~476 for the pro-inflammatory (i.e., LPS + IFN-γ) response and at ~0.0004 for the anti-inflammatory response (IL-4; Figure 3B).
We treated non-polarized macrophages with LNPs or LFA, both at the same mRNA concentration per well for comparison. The LFA presented a significantly (p < 0.001) higher iNOS expression compared to LNPs and untreated cells (control). LNPs did not alter the expression of iNOS nor Arg-1 significantly (Figure 3C). The iNOS/Arg-1 ratio for LFA was 6, while for LNPs, it was 1.44 (Figure 3D). These indicate that LNPs did not affect the macrophage polarization either towards pro- or anti-inflammatory phenotype. At the same time, LFA promoted a pro-inflammatory response to the macrophages.

3.5. LNPs Were Released from Their Eu-Coating with Intact Nucleic Acid in a Neutral to Basic Environment

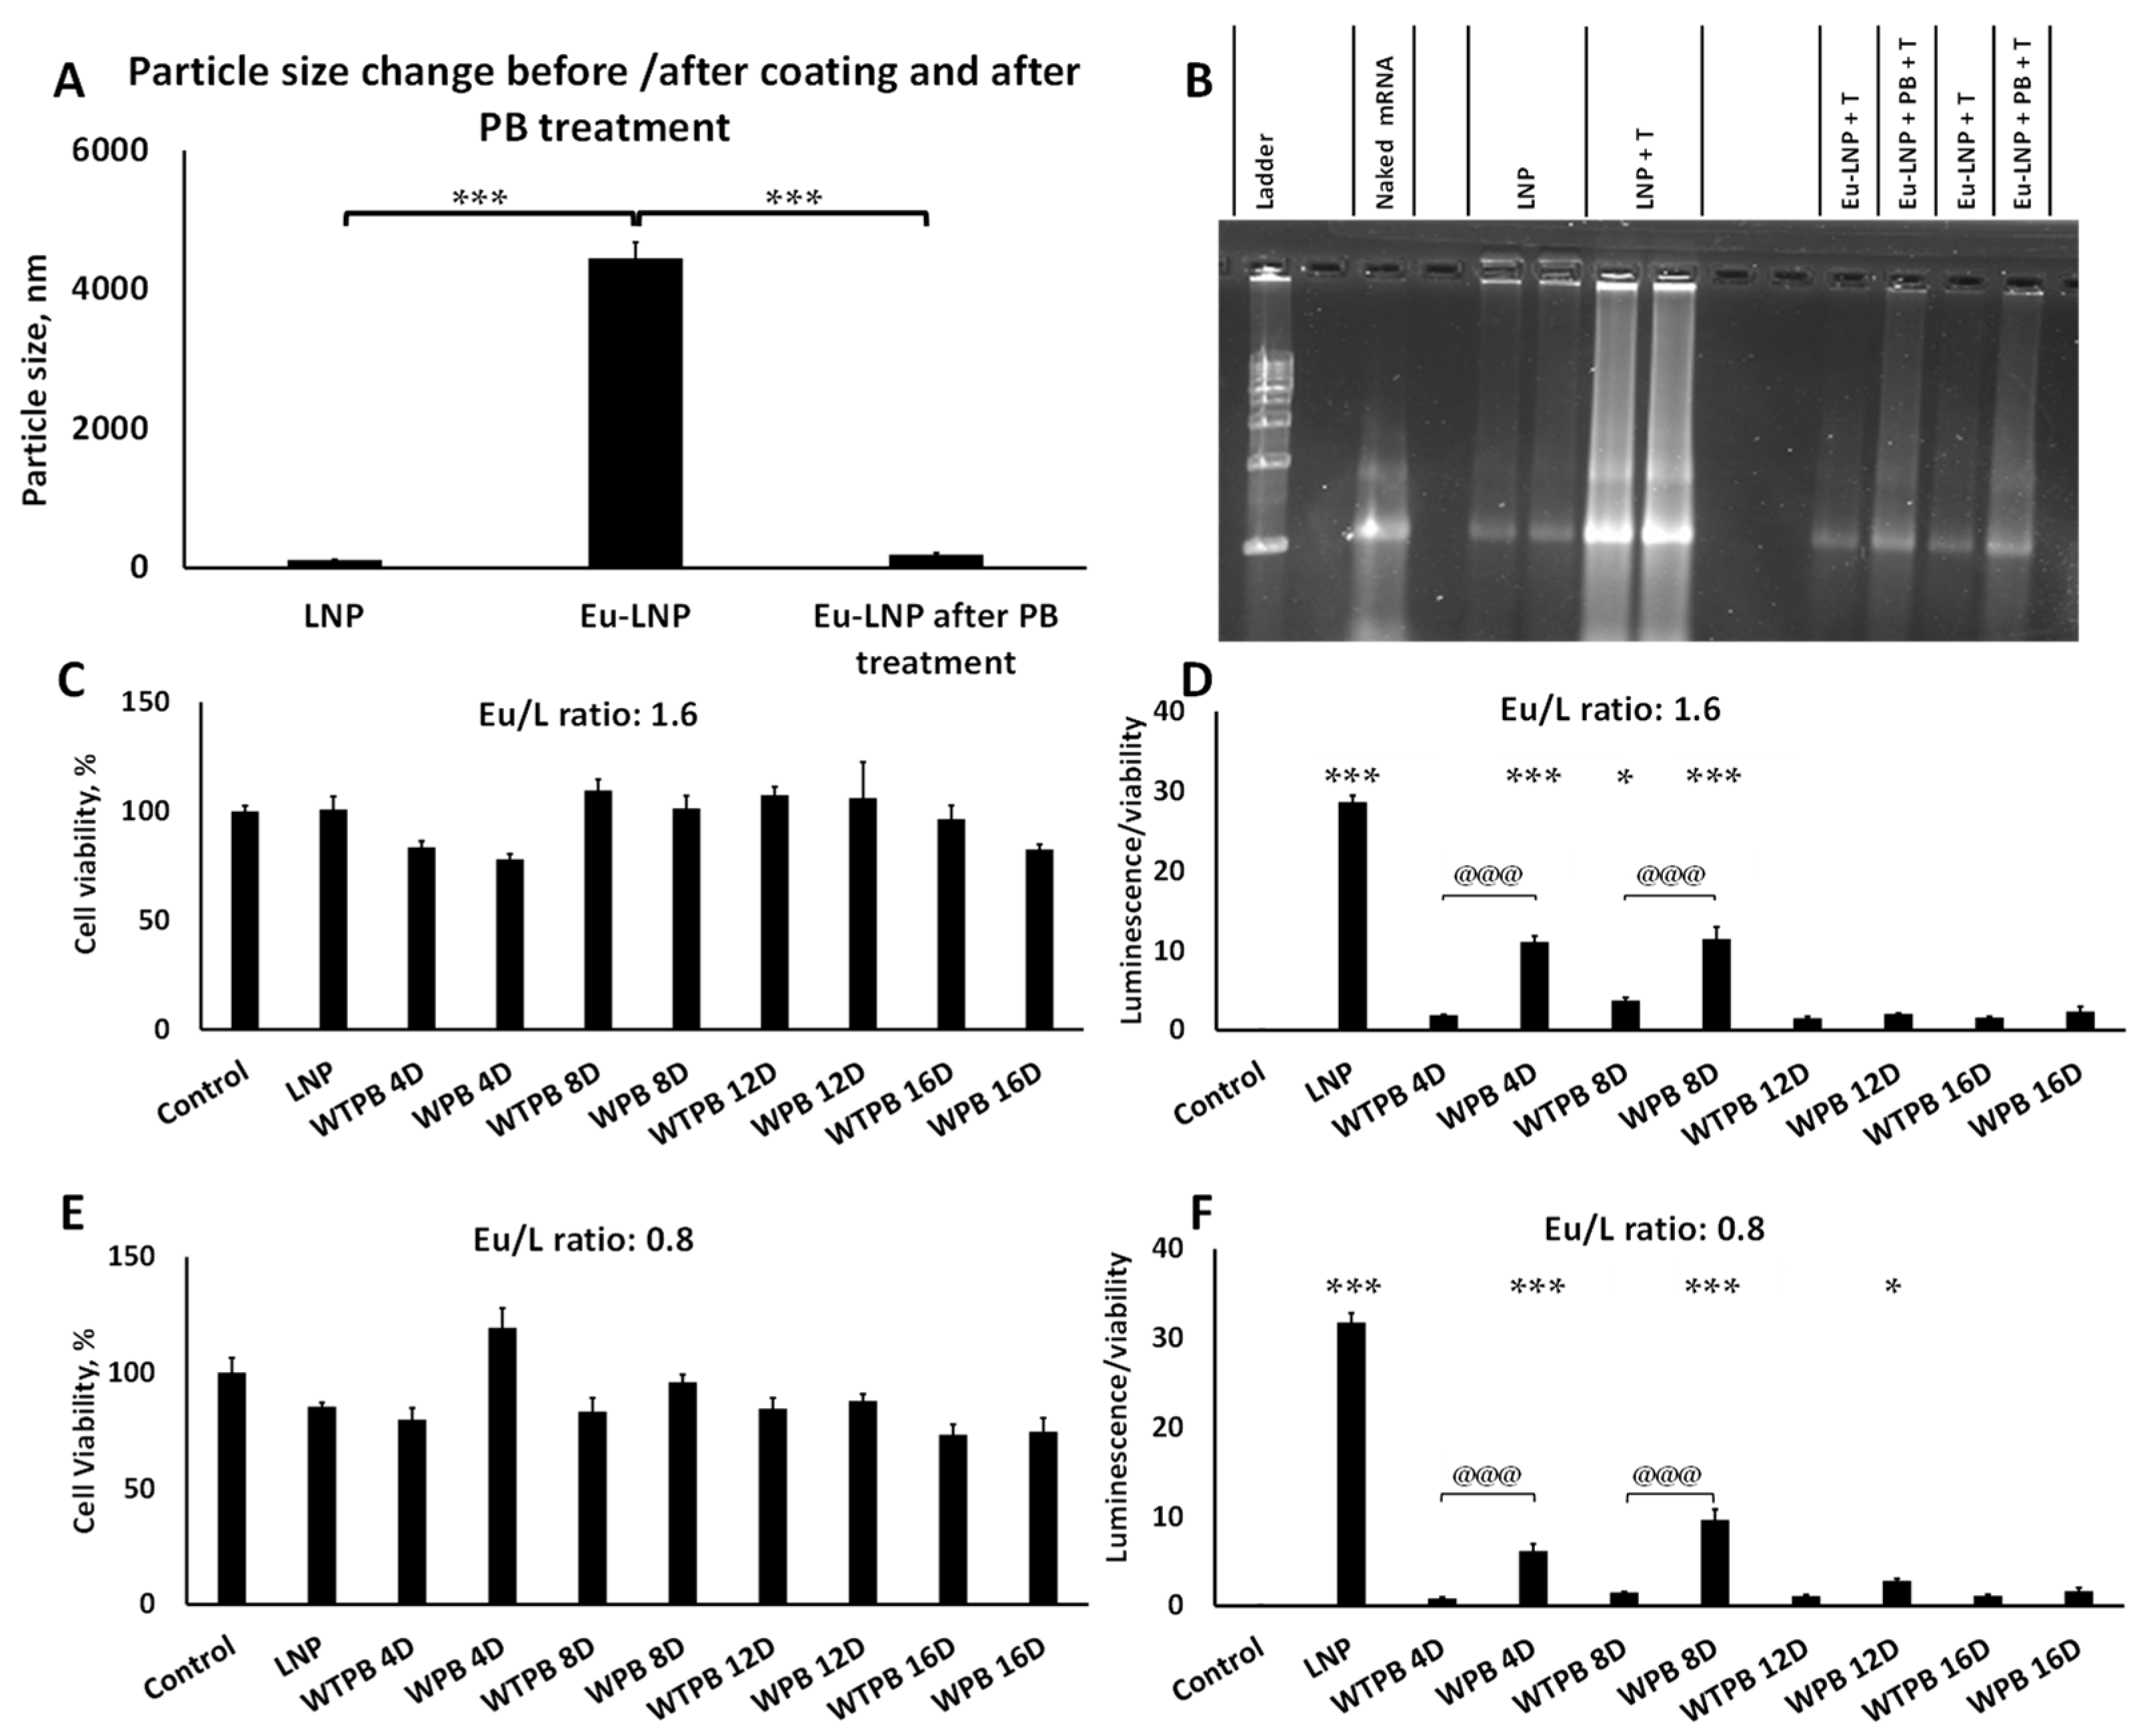
We evaluated the particle size of LNPs both before and after Eu coating and following treatment of the Eu-coated LNPs with phosphate buffer (PB) at pH 8. We determined particle sizes of 113.9 ± 3.7 nm, 4448.3 ± 228.7 nm and 191.2 ± 22.9 nm for LNPs, Eu-LNPs and Eu-LNPs after 2-4 h of PB treatment, respectively (Figure 4A), using DLS. The measurement of the Eu-LNPs’ particle size may have been skewed by the limitation of the DLS methodology, which restricts the maximum particle size that can be measured to 10 μm. However, no large aggregates were visually observed. Samples were not filtered to avoid the loss of any product. Eu-LNPs were further analyzed using gel electrophoresis to evaluate the stability of the mRNA during Eu coating. We used gel electrophoresis to assess the mRNA in LNPs before and after Eu coating and following treatment of the Eu-coated LNPs with PB at pH 8. The PB is meant to dissolve the Eu coating and release the entrapped LNPs. Subsequently, the mRNA was released from the LNPs using 0.1% (v/v) Triton X. As shown in Figure 4B, the mRNA remained intact during the Eu coating of the LNPs, and a small amount of the mRNA was detected following treatment of the Eu-LNPs with only Triton X. In fact, treatment of Eu-LNPs with PB followed by Triton X indicated a sharp increase in the release of the mRNA, indicating that the majority of the LNPs maintain their mRNA cargo entrapped, and the majority of the LNPs are inside the Eu coating. Thus, the analysis showed that intact mRNA remained within the LNPs following the harsh Eu coating process. The Eu coating serves as a protective barrier against Triton X, preventing the premature release of mRNA until the Eu coating is dissolved in the appropriate pH environment.

3.6. Eu-LNPs Produce Strong Transfection Following Eu Dissolution

Eu-LNP transfection was assessed in HEK-293 cells with (WPB) or without (WTPB) PB treatment. Eu-LNPs were exposed to PB (1:1 v/v; WPB groups) before transfection to dissolve the Eu coating for ~1–2 h. The particles (WPB or WTPB) were subsequently diluted with media to final dilution factors of 4 D, 8 D, 12 D and 16 D (Table 2). For comparison, LNPs without any coating (parent formulation) were used to evaluate the effects of the Eu coating of the LNPs and PB treatment on the cell viability and transfection efficiency. Two Eu/L ratios 0.8 and 1.6, were evaluated. As the Eu polymer interfered with the quantification of mRNA in the Eu-LNPs, the amount of mRNA per well varied between different dilutions. However, the amount of mRNA between the same dilutions (i.e., WPB vs. WTPB of the same dilution) is equal. LNPs (parent particles) demonstrated the strongest luciferase expression compared to all other groups. All formulations, with or without PB treatment, presented minimal cytotoxicity (Figure 4C,E). Eu-LNPs without PB pre-treatment (WTPB) showed minimal transfection (Figure 4D,F), with no significant increase compared to the untreated control group, with only the exception of 8D dilution for Eu/L ratio 1.6, which demonstrated a significantly higher luciferase signal compared to control (p < 0.05; Figure 4D). Overall, PB treatment of the Eu-LNPs (WPB) and their subsequent incubation with HEK-293 gave significantly higher luciferase signal compared to the control group (p < 0.001) and their respective WTPB groups (p < 0.001), for both Eu/L ratios of 1.6 and 0.8. The only exceptions to this were the higher dilutions (i.e., 12 D and 16 D), which can be attributed to the excessive dilution and resulting low transfection dose. These results demonstrated that LNPs were encapsulated within the Eu coating with mRNA remaining inaccessible for release from the LNPs without PB treatment and dissolution of the Eu.

3.7. Eu-LNPs Protected mRNA Against Simulated Gastric Fluids and Showed Significant Transfection After Treatment with SGF-Pep and SIF-Pan

In Supplementary Figure S1, we evaluated the stability of naked mRNA in simulated gastric conditions and explored the proper procedures to deactivate the simulated gastric environment. Our goal was to identify the necessary steps for pH neutralization and pepsin deactivation of the media used with LNPs or Eu-LNPs before releasing the mRNA load for further evaluation to prevent its degradation upon release. Naked mRNA was unstable under simulated gastric conditions (lanes: mRNA + (AA pH 3.75 + SGF-Pep)). Thus, we evaluated and deactivated the SGF-pep using a combination of PB, heat and protease inhibitors, and the resulting solution was then mixed with naked mRNA. Subsequently, the mRNA’s stability was confirmed using gel electrophoresis.
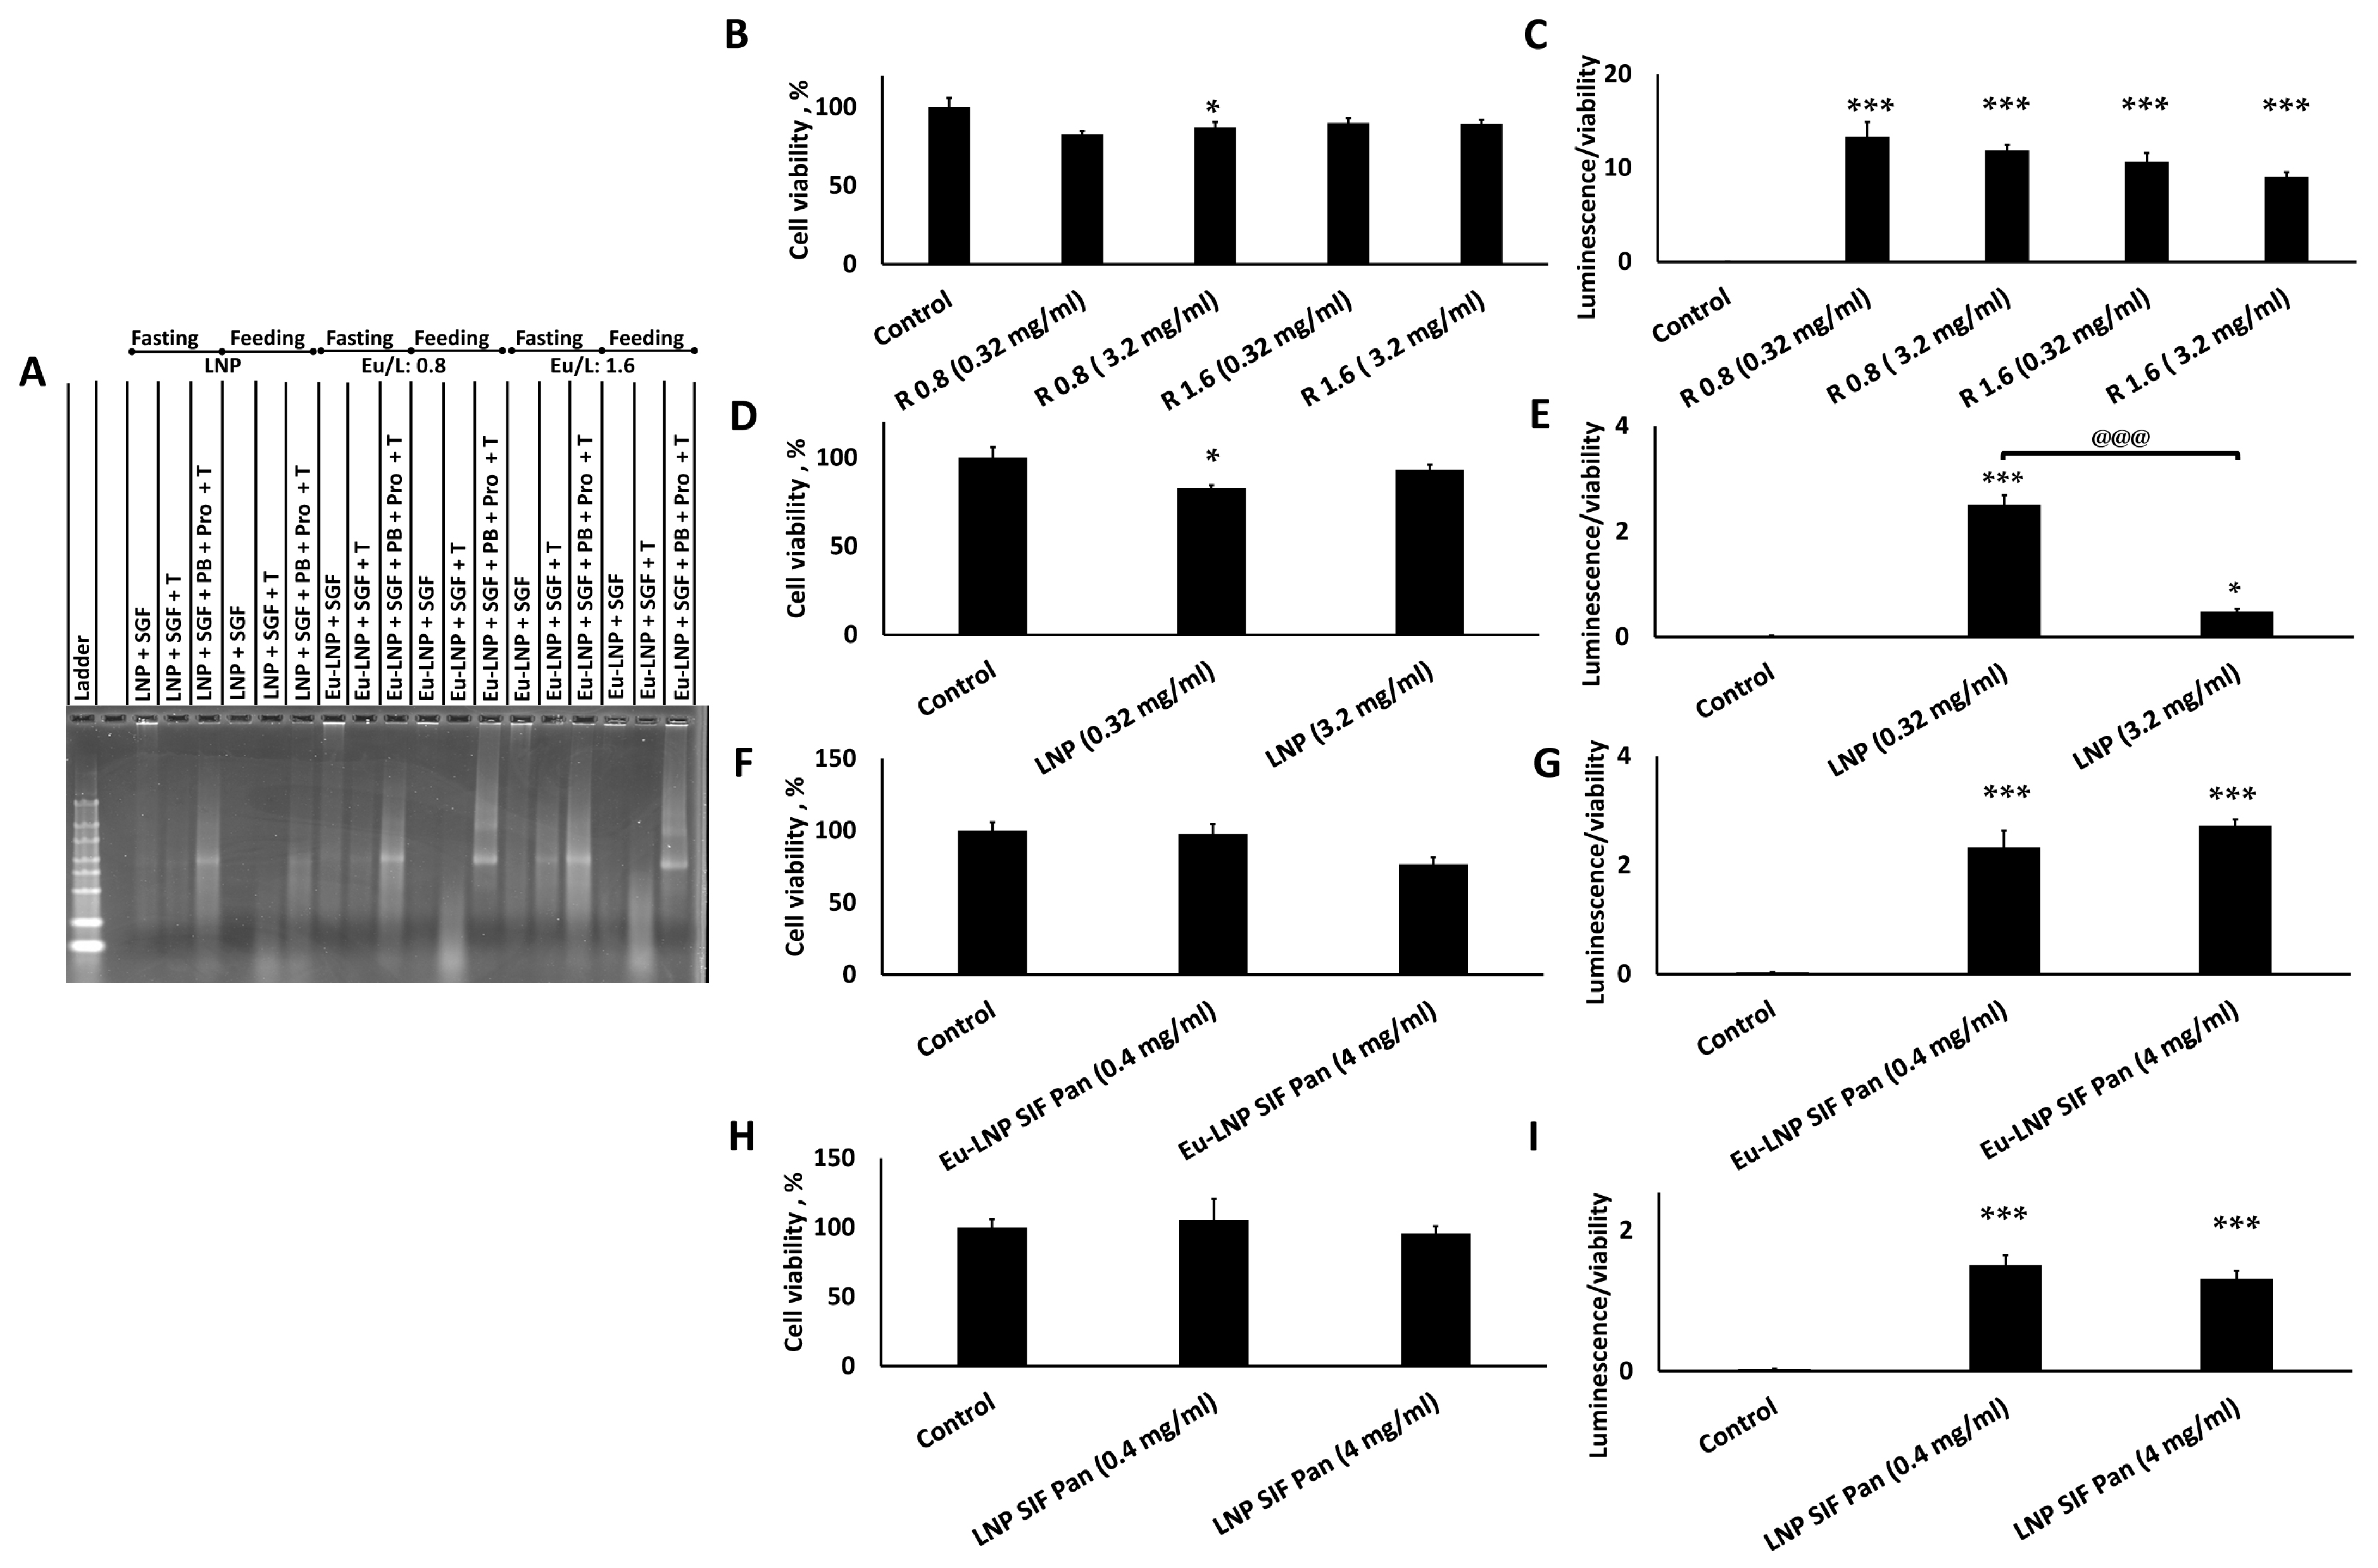
In contrast, Eu-LNPs with mRNA were directly incubated in the presence of simulated gastric fluid (SGF) with pepsin (Pep) at fasting (0.32 mg/mL) and feeding (3.2 mg/mL) state for 30 min. Subsequently, the mixtures were treated with phosphate buffer at pH 8 (PB), heat and protease inhibitors to neutralize the acidic environment, deactivate pepsin and dissolve Eu, based on the results obtained from the naked mRNA and Supplementary Figure S1. Finally, Triton X was used to release the mRNA from the LNPs. As shown in Figure 5A, LNPs provided limited to no protection for the mRNA load under SGF-Pep conditions, although in a fasted state (i.e., reduced pepsin concentration at 0.32 mg/mL), intact mRNA was detected. In a non-fasted state environment (i.e., high pepsin concentration at 3.2 mg/mL), the majority of the mRNA was degraded. In contrast, the Eu-LNPs, when incubated in either a fasted or fed state (i.e., SGF+Pep with either 0.32 or 3.2 mg/mL of pepsin), protected their mRNA load. Briefly, following the proper deactivation of the SGF-Pep environment, Eu dissolution and mRNA release (i.e., lanes marked with “PB + Pro + T”) presented mRNA bands of similar signal for both Eu/L ratios at either the fasted or fed states for the simulated environment. For reference, if the proper deactivation of the SGF-Pep environment does not take place, no to minimal mRNA can be detected (i.e., lanes marked only with “T”).
Eu-LNPs demonstrated significant transfection compared to the control (p < 0.001) following treatment with SGF-Pep or SIF-Pan under both low and high enzyme concentrations in either environment (Figure 5B,C,F,G, respectively) [13,39]. Furthermore, no significant difference in luciferase expression was observed between Eu-LNPs treated with either 0.32 mg/mL or 3.2 mg/mL of pepsin in SGF (Figure 5C). In contrast, a significant difference in luciferase expression (p < 0.001) was observed between LNPs treated with 0.32 mg/mL and 3.2 mg/mL of pepsin (Figure 5E), confirming the limited stability of unprotected LNPs and their limited ability to protect their nucleic acid load from degradation in SGF with high pepsin concentration. The transfection between the Eu-LNP groups and LNP groups was maintained at an equal dilution of the media to ensure equal mRNA concentration in their respective groups.
Finally, Eu-LNPs produced significant transfection after SIF-Pan treatment compared to the control (p < 0.001) and there was no significant difference between the groups with 4 or 0.4 mg/mL of pancreatin in SIF (Figure 5G). LNPs transfected the HEK-293 cells in SIF at either pancreatin concentration (Figure 5I).

4. Discussion

Optimization of the molar ratio among lipid components, the lipid-to-nucleic acid ratio (nitrogen to phosphate: N/P ratio) and the mixing procedure are crucial in determining the performance of lipid nanoparticles (LNPs) in terms of encapsulation efficiency, particle size, stability, and transfection efficiency [5]. A molar ratio of 50:38.5:10:1.5 for ionizable lipid, cholesterol, DSPC and DMG-PEG has been used in several studies [25,40,41] and is considered a benchmark for siRNA LNP preparations, such as Onpattro which used a N/P ratio of 3 and a total lipid-to-nucleic acid ratio (w/w) of 12.1. In contrast, the Moderna and Pfizer mRNA SARS-CoV-2 vaccines were formulated at an N/P ratio of 6 and total lipid to mRNA ratio (w/w) of 19.4 and 25.5, respectively, having molar ratios of 50:38.5:1.5 and 46.3:9.4:42.7:1.6 [7,42]. Adjusting the N/P ratio can influence the size of LNPs and, consequently, their capacity to accommodate mRNA. N/P ratio generally varies during optimization processes, ranging from 2 to 16 for mRNA LNP preparation [5] and optimal outcomes can be achieved at different N/P ratios depending on multiple factors, such as N/P 3 [43], 5.67 [44], 6 [45], 7.5 [46], 8 [47], 9 [48], 10 [49,50], and 12 [32,51]. In our study, we optimized our formulation based on experimental outcomes, i.e., encapsulation (%), particle size, zeta potential, polydispersity and transfection efficiency at different N/P ratios and lipid concentrations, using a model firefly luciferase-expressing mRNA. We used N/P ratios of 3, 6, and 10, which correspond to total lipid-to-mRNA ratios (w/w) of 10.4, 20.9 and 34.4, respectively. Hence, the total lipid concentrations used for mixing with mRNA (TLC) were 1.5 mg/mL, 1.8 mg/mL, and 2.2 mg/mL (Table 1). Although there was no statistically significant difference between N/P 6 and either N/P 3 or N/P 10, for a TLC of 1.5, there was a clear trend towards improved encapsulation, as the N/P 10 was higher than the N/P 3. This trend was also apparent for the other TLC conditions tested, indicating that an N/P 10 produces improved mRNA encapsulation in all scenarios. On the other hand, by fixing the N/P ratio at either 3, 6 or 10, and changing the TLC from 1.5 to 2.2, minimal changes in mRNA encapsulation were observed. Regarding the particle size, there was a trend of decreasing size as the N/P ratio increased for TLC 1.5 and 1.8. However, this trend was absent for TLC 2.2.
mRNA maintained stability inside the LNPs in the presence of RNases as detected using gel electrophoresis. Briefly, naked mRNA or mRNA-LNPs were treated with RNase and degradation of the naked mRNA was observed, suggesting the vulnerability of mRNA outside the protective lipid nanoparticle environment. In contrast, the LNPs protected their mRNA load from degradation, as detected by treating the mRNA-LNPs with RNase, followed by RNase inhibition and Triton X-100. We evaluated the transfection capability of various LNP formulations (B1–B9, in duplicate) using HEK-293 cells and compared them to Lipofectamine (LFA-mRNA, positive control) and control groups. All tested formulations showed transfection capabilities. However, B1 showed the weakest transfection (p < 0.05) compared to all other formulations, while B6 exhibited the strongest (p < 0.001), compared to the other groups. In fact, formulation B6 was the only formulation that, in a pairwise statistical comparison, did not present a statistically significant difference compared to LFA. For LFA-mRNA positive control, B1–B5 and B7–B9 showed significantly lower transfection (p < 0.001). Taken together, we selected formulation B6 for subsequent experiments, with N/P ratio of 10 and TLC of 1.8, as it presented the highest mRNA encapsulation, the smallest particle size and the strongest transfection.
Expanding into other cells, including cancer cells and cells of the immune system, the B6 formulation induced significant luciferase expression (p < 0.001) compared to the control and showed almost identical transfection when compared to LFA-mRNA in SW480 cells. Similarly, B6 also showed significant luciferase expression (p < 0.001) in HT-29 cells compared to the control, although it was significantly lower (p < 0.05) than LFA-mRNA. Finally, the B6 formulation induced luciferase expression (p < 0.001) in RAW 264.7 cells, as determined at varying mRNA concentrations per well. Overall, the selected B6 formulation demonstrated strong transfection capacity in the various tested cell lines.
We subsequently evaluated whether LNPs may induce an inflammatory response in RAW 264.7 cells, and compared them to LFA. Initially, we established that the iNOS/Arg-1 gene expression ratio can be used to determine whether a response is pro- or anti-inflammatory response in the macrophages, aligning with previously reported studies [52]. In our analysis, mRNA-LNPs demonstrated no significant pro- or anti-inflammatory polarization using RAW 264.7 cells, whereas treatment with lipofectamine presented a significant (p < 0.001) change in the iNOS/Arg-1 gene expression ratio, indicating a pro-inflammatory response.
For oral administration, Eu polymers are extensively used to protect drug loads from the stomach’s acidic environment and to regulate drug release at different portions in the intestines, in a pH or time-dependent manner [17]. To this end, Eu has also been utilized in nano-delivery for coating and protecting nanoparticles. There have been several examples where liposomal structures were coated with Eu to protect them during oral administration [20,21,22,38]. We utilized this approach to protect LNPs, which also are lipid-based. We used Eu S 100 to protect the LNPs in an acidic environment, while releasing the LNPs in a neutral to basic environment.
The Eu-LNPs were formulated by mixing pre-prepared and characterized LNPs with Eu polymer during a rapid pH drop. The pH change caused Eu S 100 to precipitate, encapsulating or trapping the LNPs within the precipitated polymer matrix resulting in Eu-LNPs. After coating the LNPs with Eu S 100, the particle size of the LNPs increased significantly. However, after phosphate buffer (PB) treatment, which dissolved the Eu polymer, the particle size of the Eu-LNPs decreased significantly, bringing the size close to that of the original LNPs. This indicates that the LNPs remained intact during the entrapment and dissolution of Eu.
As the ratio of Eu/L may alter the polymeric coating’s thickness surrounding LNPs, we evaluated 2 scenarios, i.e., the Eu/L ratio of 0.8 and 1.6, to determine whether the released LNPs presented a difference in their capacity to transfect. Thus, Eu-LNPs with Eu/L ratios of 0.8 or 1.6 were treated with PB, and their transfection was evaluated before (WTPB) and after (WPB) PB treatment, using HEK-293 cells. In either case for the Eu/L ratio, we observed a significant difference in luciferase expression between WTPB and WPB for the 4D and 8D dilution groups, indicating that either Eu/L coating ratio should be sufficient to entrap LNPs.
Subsequently, we evaluated the stability of mRNA in the Eu-LNPs in conditions simulating the stomach environment by using simulated gastric fluid. Eu polymers have previously demonstrated the capacity to protect formulations in such an environment [17]. Thus, we incubated the Eu-LNPs in SGF with pepsin both in fasting and feeding conditions for 30 min, followed by treatment with PB and protease inhibitors to neutralize the acidic environment and deactivate the pepsin. The mRNA was released by the formulation using Triton X. mRNA encapsulated in Eu-LNPs remained stable in the presence of SGF with pepsin at both 0.32 and 3.2 mg/mL, attributed to the shielding effect of the Eu coating. LNP’s gene silencing capacity was previously reported to be reduced at higher pepsin concentrations resembling fed conditions, while at fasting pepsin concentrations, LNPs retained their transfection ability [13]. We treated Eu-LNPs with SGF-Pep under both feeding and fasting stomach conditions and transfected them into HEK-293 cells to evaluate their transfection efficiency after the SGF-Pep treatment and Eu dissolution. Our results showed that the Eu coating mostly prevented the LNPs from degrading in SGF-Pep and demonstrated significant luciferase transfection at both feeding and fasting stomach conditions compared to the control. There was no significant difference between the luciferase expression at pepsin concentrations of 0.32 mg/mL and 3.2 mg/mL. In contrast, unprotected LNPs present minimal transfection in the HEK-293 cells under fed conditions. Finally, the Eu-LNPs and uncoated LNPs transfected the HEK-293 cells following SIF-Pan treatment.
Our results showed that Eu S 100 protects LNPs encapsulating nucleic acids, and our proposed approach warrants further evaluation for the oral administration of nucleic acids.

5. Conclusions

Despite significant progress in RNA therapeutics, oral gene delivery systems still face substantial challenges that hinder their broader application. Overcoming these barriers is critical for developing oral RNA-based therapies, which could provide a more convenient and less invasive alternative to injections or other delivery methods, and could be used for topical treatments targeting the gastrointestinal tract. The Eu polymeric coating of liposomes has been reported for the delivery of conventional drugs. In our study, we coated LNPs carrying nucleic acids with Eu S 100 for the pH-sensitive protective coating of the LNPs. Our approach shielded the nucleic acid-loaded LNPs in the acidic environment of the gastrointestinal tract. This approach protected the loaded RNA, while the LNPs maintained their transfection capabilities in vitro. This study addressed the key challenges of RNA degradation and LNP stability in the context of oral administration.

Supplementary Materials

The following supporting information can be downloaded at: https://www.mdpi.com/article/10.3390/pr13082477/s1, Figure S1: Stability of naked mRNA in the presence of SGF-Pep, and conditions to deactivate SGF-Pep prior to incubation with mRNA. Naked mRNA treated in simulated gastric fluid (SGF) with or without pepsin (Pep.) and acetic acid (AA). Naked mRNA degraded in the presence of SGF-Pep as shown in lane (mRNA + (AA pH 3.75 + SGF-Pep)). SGF-Pep pre-treatment with PB, heat and protease inhibitor deactivated pepsin and neutralized the acidic environment, evidenced by mRNA remaining mostly stable after its subsequent addition, as per lane (mRNA + (AA pH 3.75 + SGF-Pep + Heat +Pro+ PB); Figure S2: Raw images as obtained by TEM or Chemidoc for corresponding figures in the manuscript. (Original image for Figure 1C) Transmission electron imaging of mRNA-LNPs. Scale bar = 200 nm; (Original image for Figure 1D) Agarose gel electrophoresis of representative mRNA-LNP formulations with or without 0.1% Triton X-100 (T); (Original image for Figure 1E) LNPs treated with or without RNAse followed by extraction with 0.1% Triton X-100 (T) showed LNP protected mRNA load against RNAse, as detected by gel electrophoresis; (Original image for Figure 4B) Gel electrophoresis assay of Eu-LNPs with mRNA, treated with Triton X or PB followed by Triton X; (Original image for Figure 5A) Gel electrophoresis assay for LNPs and Eu-LNPs with encapsulated mRNA that were treated with SGF in fasting (0.32 mg/mL of pepsin) and feeding (3.2 mg/mL of pepsin) conditions; (Original image for Supplementary Figure S1) mRNA stability in SGF-Pep.

Author Contributions

M.A.H.: Conceptualization, Data curation, Formal Analysis, Investigation, Methodology, Project administration, Software, Validation, Visualization, Writing—original draft, Writing—review and editing. A.S.: Data curation, Investigation, Methodology, Writing—review and editing. G.M.: Conceptualization, Data curation, Formal Analysis, Funding acquisition, Investigation, Methodology, Project administration, Resources, Supervision, Visualization, Writing—original draft, Writing—review and editing. All authors have read and agreed to the published version of the manuscript.

Funding

This research was funded by the College of Pharmacy, University of Louisiana at Monroe start-up funding and National Institutes of Health (NIH) through the National Institute of General Medical Science Grants P20 GM103424-21.

Data Availability Statement

The original contributions presented in the study are included in the article/Supplementary Materials. Further inquiries can be directed to the corresponding author.

Conflicts of Interest

The authors declare no conflict of interest.

Abbreviations

The following abbreviations are used in this manuscript:
LNPsLipid nanoparticles
EuEudragit®
Eu-LNPsEudragit® coated LNPs
PBPhosphate buffer at pH 8
Arg-1Arginase-1
iNOSInducible nitric oxide synthase
Eu/LEudragit® to lipid weight to weight ratio
WPBWith PB treatment
WTPBWithout PB treatment
SGFSimulated gastric fluid
SIFSimulated intestinal fluid
ProProtease inhibitor
PepPepsin
PanPancreatin
LFALipofectamine
SEMStandard error of the mean

References

  1. Naeem, S.; Zhang, J.; Zhang, Y.; Wang, Y. Nucleic acid therapeutics: Past, present, and future. Mol. Ther. Nucleic Acids 2025, 36, 102440. [Google Scholar] [CrossRef]
  2. Zhang, M.M.; Bahal, R.; Rasmussen, T.P.; Manautou, J.E.; Zhong, X.B. The growth of siRNA-based therapeutics: Updated clinical studies. Biochem. Pharmacol. 2021, 189, 114432. [Google Scholar] [CrossRef] [PubMed]
  3. Hald Albertsen, C.; Kulkarni, J.A.; Witzigmann, D.; Lind, M.; Petersson, K.; Simonsen, J.B. The role of lipid components in lipid nanoparticles for vaccines and gene therapy. Adv. Drug Deliv. Rev. 2022, 188, 114416. [Google Scholar] [CrossRef] [PubMed]
  4. Lu, R.M.; Hsu, H.E.; Perez, S.; Kumari, M.; Chen, G.H.; Hong, M.H.; Lin, Y.S.; Liu, C.H.; Ko, S.H.; Concio, C.A.P.; et al. Current landscape of mRNA technologies and delivery systems for new modality therapeutics. J. Biomed. Sci. 2024, 31, 89. [Google Scholar] [CrossRef] [PubMed]
  5. Haque, M.A.; Shrestha, A.; Mikelis, C.M.; Mattheolabakis, G. Comprehensive analysis of lipid nanoparticle formulation and preparation for RNA delivery. Int. J. Pharm. X 2024, 8, 100283. [Google Scholar] [CrossRef]
  6. Nsairat, H.; Alshaer, W.; Odeh, F.; Esawi, E.; Khater, D.; Bawab, A.A.; El-Tanani, M.; Awidi, A.; Mubarak, M.S. Recent advances in using liposomes for delivery of nucleic acid-based therapeutics. OpenNano 2023, 11, 100132. [Google Scholar] [CrossRef]
  7. Suzuki, Y.; Ishihara, H. Difference in the lipid nanoparticle technology employed in three approved siRNA (Patisiran) and mRNA (COVID-19 vaccine) drugs. Drug Metab. Pharmacokinet. 2021, 41, 100424. [Google Scholar] [CrossRef]
  8. Lim, S.A.; Cox, A.; Tung, M.; Chung, E.J. Clinical progress of nanomedicine-based RNA therapies. Bioact. Mater. 2022, 12, 203–213. [Google Scholar] [CrossRef]
  9. Han, L.; Tang, C.; Yin, C. Oral delivery of shRNA and siRNA via multifunctional polymeric nanoparticles for synergistic cancer therapy. Biomaterials 2014, 35, 4589–4600. [Google Scholar] [CrossRef]
  10. Hossian, A.; Mackenzie, G.G.; Mattheolabakis, G. miRNAs in gastrointestinal diseases: Can we effectively deliver RNA-based therapeutics orally? Nanomedicine 2019, 14, 2873–2889. [Google Scholar] [CrossRef]
  11. Kang, S.H.; Revuri, V.; Lee, S.J.; Cho, S.; Park, I.K.; Cho, K.J.; Bae, W.K.; Lee, Y.K. Oral siRNA Delivery to Treat Colorectal Liver Metastases. ACS Nano 2017, 11, 10417–10429. [Google Scholar] [CrossRef]
  12. Abramson, A.; Kirtane, A.R.; Shi, Y.; Zhong, G.; Collins, J.E.; Tamang, S.; Ishida, K.; Hayward, A.; Wainer, J.; Rajesh, N.U.; et al. Oral mRNA delivery using capsule-mediated gastrointestinal tissue injections. Matter 2022, 5, 975–987. [Google Scholar] [CrossRef]
  13. Ball, R.L.; Bajaj, P.; Whitehead, K.A. Oral delivery of siRNA lipid nanoparticles: Fate in the GI tract. Sci. Rep. 2018, 8, 2178. [Google Scholar] [CrossRef]
  14. Suri, K.; Pfeifer, L.; Cvet, D.; Li, A.; McCoy, M.; Singh, A.; Amiji, M.M. Oral delivery of stabilized lipid nanoparticles for nucleic acid therapeutics. Drug Deliv. Transl. Res. 2025, 15, 1755–1769. [Google Scholar] [CrossRef] [PubMed]
  15. Nikam, A.; Sahoo, P.R.; Musale, S.; Pagar, R.R.; Paiva-Santos, A.C.; Giram, P.S. A Systematic Overview of Eudragit® Based Copolymer for Smart Healthcare. Pharmaceutics 2023, 15, 587. [Google Scholar] [CrossRef]
  16. Vollrath, A.; Schubert, S.; Windhab, N.; Biskup, C.; Schubert, U.S. Labeled Nanoparticles Based on Pharmaceutical EUDRAGIT® S 100 Polymers. Macromol. Rapid Commun. 2010, 31, 2053–2058. [Google Scholar] [CrossRef]
  17. Khan, M.Z.; Prebeg, Z.; Kurjakovic, N. A pH-dependent colon targeted oral drug delivery system using methacrylic acid copolymers. I. Manipulation Of drug release using Eudragit L100-55 and Eudragit S100 combinations. J. Control. Release 1999, 58, 215–222. [Google Scholar] [CrossRef]
  18. Lee, S.H.; Back, S.Y.; Song, J.G.; Han, H.K. Enhanced oral delivery of insulin via the colon-targeted nanocomposite system of organoclay/glycol chitosan/Eudragit®S100. J. Nanobiotechnol. 2020, 18, 104. [Google Scholar] [CrossRef]
  19. Chen, S.; Guo, F.; Deng, T.; Zhu, S.; Liu, W.; Zhong, H.; Yu, H.; Luo, R.; Deng, Z. Eudragit S100-Coated Chitosan Nanoparticles Co-loading Tat for Enhanced Oral Colon Absorption of Insulin. AAPS PharmSciTech 2017, 18, 1277–1287. [Google Scholar] [CrossRef] [PubMed]
  20. De Leo, V.; Di Gioia, S.; Milano, F.; Fini, P.; Comparelli, R.; Mancini, E.; Agostiano, A.; Conese, M.; Catucci, L. Eudragit S100 Entrapped Liposome for Curcumin Delivery: Anti-Oxidative Effect in Caco-2 Cells. Coatings 2020, 10, 114. [Google Scholar] [CrossRef]
  21. Catalan-Latorre, A.; Ravaghi, M.; Manca, M.L.; Caddeo, C.; Marongiu, F.; Ennas, G.; Escribano-Ferrer, E.; Peris, J.E.; Diez-Sales, O.; Fadda, A.M.; et al. Freeze-dried eudragit-hyaluronan multicompartment liposomes to improve the intestinal bioavailability of curcumin. Eur. J. Pharm. Biopharm. 2016, 107, 49–55. [Google Scholar] [CrossRef]
  22. Alghurabi, H.; Tagami, T.; Ogawa, K.; Ozeki, T. Preparation, Characterization and In Vitro Evaluation of Eudragit S100-Coated Bile Salt-Containing Liposomes for Oral Colonic Delivery of Budesonide. Polymers 2022, 14, 2693. [Google Scholar] [CrossRef]
  23. Barea, M.J.; Jenkins, M.J.; Gaber, M.H.; Bridson, R.H. Evaluation of liposomes coated with a pH responsive polymer. Int. J. Pharm. 2010, 402, 89–94. [Google Scholar] [CrossRef] [PubMed]
  24. Barea, M.J.; Jenkins, M.J.; Lee, Y.S.; Johnson, P.; Bridson, R.H. Encapsulation of Liposomes within pH Responsive Microspheres for Oral Colonic Drug Delivery. Int. J. Biomater. 2012, 2012, 458712. [Google Scholar] [CrossRef] [PubMed]
  25. Chander, N.; Basha, G.; Yan Cheng, M.H.; Witzigmann, D.; Cullis, P.R. Lipid nanoparticle mRNA systems containing high levels of sphingomyelin engender higher protein expression in hepatic and extra-hepatic tissues. Mol. Ther. Methods Clin. Dev. 2023, 30, 235–245. [Google Scholar] [CrossRef] [PubMed]
  26. Leung, A.K.; Hafez, I.M.; Baoukina, S.; Belliveau, N.M.; Zhigaltsev, I.V.; Afshinmanesh, E.; Tieleman, D.P.; Hansen, C.L.; Hope, M.J.; Cullis, P.R. Lipid Nanoparticles Containing siRNA Synthesized by Microfluidic Mixing Exhibit an Electron-Dense Nanostructured Core. J. Phys. Chem. C Nanomater. Interfaces 2012, 116, 18440–18450. [Google Scholar] [CrossRef]
  27. Larson, N.R.; Hu, G.; Wei, Y.; Tuesca, A.D.; Forrest, M.L.; Middaugh, C.R. pH-Dependent Phase Behavior and Stability of Cationic Lipid-mRNA Nanoparticles. J. Pharm. Sci. 2022, 111, 690–698. [Google Scholar] [CrossRef]
  28. Cheung, C.C.L.; Al-Jamal, W.T. Sterically stabilized liposomes production using staggered herringbone micromixer: Effect of lipid composition and PEG-lipid content. Int. J. Pharm. 2019, 566, 687–696. [Google Scholar] [CrossRef]
  29. Cui, L.; Renzi, S.; Quagliarini, E.; Digiacomo, L.; Amenitsch, H.; Masuelli, L.; Bei, R.; Ferri, G.; Cardarelli, F.; Wang, J.; et al. Efficient Delivery of DNA Using Lipid Nanoparticles. Pharmaceutics 2022, 14, 1698. [Google Scholar] [CrossRef]
  30. Belliveau, N.M.; Huft, J.; Lin, P.J.; Chen, S.; Leung, A.K.; Leaver, T.J.; Wild, A.W.; Lee, J.B.; Taylor, R.J.; Tam, Y.K.; et al. Microfluidic Synthesis of Highly Potent Limit-size Lipid Nanoparticles for In Vivo Delivery of siRNA. Mol. Ther. Nucleic Acids 2012, 1, e37. [Google Scholar] [CrossRef]
  31. Lokugamage, M.P.; Vanover, D.; Beyersdorf, J.; Hatit, M.Z.C.; Rotolo, L.; Echeverri, E.S.; Peck, H.E.; Ni, H.; Yoon, J.K.; Kim, Y.; et al. Optimization of lipid nanoparticles for the delivery of nebulized therapeutic mRNA to the lungs. Nat. Biomed. Eng. 2021, 5, 1059–1068. [Google Scholar] [CrossRef]
  32. Blakney, A.K.; McKay, P.F.; Yus, B.I.; Aldon, Y.; Shattock, R.J. Inside out: Optimization of lipid nanoparticle formulations for exterior complexation and in vivo delivery of saRNA. Gene Ther. 2019, 26, 363–372. [Google Scholar] [CrossRef]
  33. Hossian, A.; Jois, S.D.; Jonnalagadda, S.C.; Mattheolabakis, G. Nucleic Acid Delivery with alpha-Tocopherol-Polyethyleneimine-Polyethylene Glycol Nanocarrier System. Int. J. Nanomed. 2020, 15, 6689–6703. [Google Scholar] [CrossRef] [PubMed]
  34. Li, H.; Huang, N.; Zhu, W.; Wu, J.; Yang, X.; Teng, W.; Tian, J.; Fang, Z.; Luo, Y.; Chen, M.; et al. Modulation the crosstalk between tumor-associated macrophages and non-small cell lung cancer to inhibit tumor migration and invasion by ginsenoside Rh2. BMC Cancer 2018, 18, 579. [Google Scholar] [CrossRef]
  35. Gao, S.; Wang, L.; Liu, W.; Wu, Y.; Yuan, Z. The synergistic effect of homocysteine and lipopolysaccharide on the differentiation and conversion of raw264.7 macrophages. J. Inflamm. 2014, 11, 13. [Google Scholar] [CrossRef] [PubMed]
  36. Chen, S.; Saeed, A.; Liu, Q.; Jiang, Q.; Xu, H.; Xiao, G.G.; Rao, L.; Duo, Y. Macrophages in immunoregulation and therapeutics. Signal Transduct. Target. Ther. 2023, 8, 207. [Google Scholar] [CrossRef]
  37. Mirzaeei, S.; Taghe, S.; Alany, R.G.; Nokhodchi, A. Eudragit® L100/Polyvinyl Alcohol Nanoparticles Impregnated Mucoadhesive Films as Ocular Inserts for Controlled Delivery of Erythromycin: Development, Characterization and In Vivo Evaluation. Biomedicines 2022, 10, 1917. [Google Scholar] [CrossRef]
  38. De Leo, V.; Milano, F.; Mancini, E.; Comparelli, R.; Giotta, L.; Nacci, A.; Longobardi, F.; Garbetta, A.; Agostiano, A.; Catucci, L. Encapsulation of Curcumin-Loaded Liposomes for Colonic Drug Delivery in a pH-Responsive Polymer Cluster Using a pH-Driven and Organic Solvent-Free Process. Molecules 2018, 23, 739. [Google Scholar] [CrossRef]
  39. Mudie, D.M.; Amidon, G.L.; Amidon, G.E. Physiological parameters for oral delivery and in vitro testing. Mol. Pharm. 2010, 7, 1388–1405. [Google Scholar] [CrossRef] [PubMed]
  40. Carrasco, M.J.; Alishetty, S.; Alameh, M.G.; Said, H.; Wright, L.; Paige, M.; Soliman, O.; Weissman, D.; Cleveland, T.E.; Grishaev, A.; et al. Ionization and structural properties of mRNA lipid nanoparticles influence expression in intramuscular and intravascular administration. Commun. Biol. 2021, 4, 956. [Google Scholar] [CrossRef]
  41. Takanashi, A.; Pouton, C.W.; Al-Wassiti, H. Delivery and Expression of mRNA in the Secondary Lymphoid Organs Drive Immune Responses to Lipid Nanoparticle-mRNA Vaccines after Intramuscular Injection. Mol. Pharm. 2023, 20, 3876–3885. [Google Scholar] [CrossRef]
  42. Schoenmaker, L.; Witzigmann, D.; Kulkarni, J.A.; Verbeke, R.; Kersten, G.; Jiskoot, W.; Crommelin, D.J.A. mRNA-lipid nanoparticle COVID-19 vaccines: Structure and stability. Int. J. Pharm. 2021, 601, 120586. [Google Scholar] [CrossRef]
  43. Philipp, J.; Dabkowska, A.; Reiser, A.; Frank, K.; Krzyszton, R.; Brummer, C.; Nickel, B.; Blanchet, C.E.; Sudarsan, A.; Ibrahim, M.; et al. pH-dependent structural transitions in cationic ionizable lipid mesophases are critical for lipid nanoparticle function. Proc. Natl. Acad. Sci. USA 2023, 120, e2310491120. [Google Scholar] [CrossRef]
  44. Hassett, K.J.; Benenato, K.E.; Jacquinet, E.; Lee, A.; Woods, A.; Yuzhakov, O.; Himansu, S.; Deterling, J.; Geilich, B.M.; Ketova, T.; et al. Optimization of Lipid Nanoparticles for Intramuscular Administration of mRNA Vaccines. Mol. Ther. Nucleic Acids 2019, 15, 1–11. [Google Scholar] [CrossRef]
  45. Jürgens, D.C.; Deßloch, L.; Porras-Gonzalez, D.; Winkeljann, J.; Zielinski, S.; Munschauer, M.; Hörner, A.L.; Burgstaller, G.; Winkeljann, B.; Merkel, O.M. Lab-scale siRNA and mRNA LNP manufacturing by various microfluidic mixing techniques—An evaluation of particle properties and efficiency. OpenNano 2023, 12, 100161. [Google Scholar] [CrossRef]
  46. Sanghani, A.; Kafetzis, K.N.; Sato, Y.; Elboraie, S.; Fajardo-Sanchez, J.; Harashima, H.; Tagalakis, A.D.; Yu-Wai-Man, C. Novel PEGylated Lipid Nanoparticles Have a High Encapsulation Efficiency and Effectively Deliver MRTF-B siRNA in Conjunctival Fibroblasts. Pharmaceutics 2021, 13, 382. [Google Scholar] [CrossRef]
  47. Roces, C.B.; Lou, G.; Jain, N.; Abraham, S.; Thomas, A.; Halbert, G.W.; Perrie, Y. Manufacturing Considerations for the Development of Lipid Nanoparticles Using Microfluidics. Pharmaceutics 2020, 12, 1095. [Google Scholar] [CrossRef]
  48. Somu Naidu, G.; Rampado, R.; Sharma, P.; Ezra, A.; Kundoor, G.R.; Breier, D.; Peer, D. Ionizable Lipids with Optimized Linkers Enable Lung-Specific, Lipid Nanoparticle-Mediated mRNA Delivery for Treatment of Metastatic Lung Tumors. ACS Nano 2025, 19, 6571–6587. [Google Scholar] [CrossRef]
  49. Massaro, M.; Wu, S.; Baudo, G.; Liu, H.; Collum, S.; Lee, H.; Stigliano, C.; Segura-Ibarra, V.; Karmouty-Quintana, H.; Blanco, E. Lipid nanoparticle-mediated mRNA delivery in lung fibrosis. Eur. J. Pharm. Sci. 2023, 183, 106370. [Google Scholar] [CrossRef]
  50. Kong, W.; Wei, Y.; Dong, Z.; Liu, W.; Zhao, J.; Huang, Y.; Yang, J.; Wu, W.; He, H.; Qi, J. Role of size, surface charge, and PEGylated lipids of lipid nanoparticles (LNPs) on intramuscular delivery of mRNA. J. Nanobiotechnol. 2024, 22, 553. [Google Scholar] [CrossRef]
  51. Rampado, R.; Naidu, G.S.; Karpov, O.; Goldsmith, M.; Sharma, P.; Ezra, A.; Stotsky, L.; Breier, D.; Peer, D. Lipid Nanoparticles with Fine-Tuned Composition Show Enhanced Colon Targeting as a Platform for mRNA Therapeutics. Adv. Sci. 2025, 12, e2408744. [Google Scholar] [CrossRef] [PubMed]
  52. Miki, S.; Suzuki, J.I.; Takashima, M.; Ishida, M.; Kokubo, H.; Yoshizumi, M. S-1-Propenylcysteine promotes IL-10-induced M2c macrophage polarization through prolonged activation of IL-10R/STAT3 signaling. Sci. Rep. 2021, 11, 22469. [Google Scholar] [CrossRef] [PubMed]
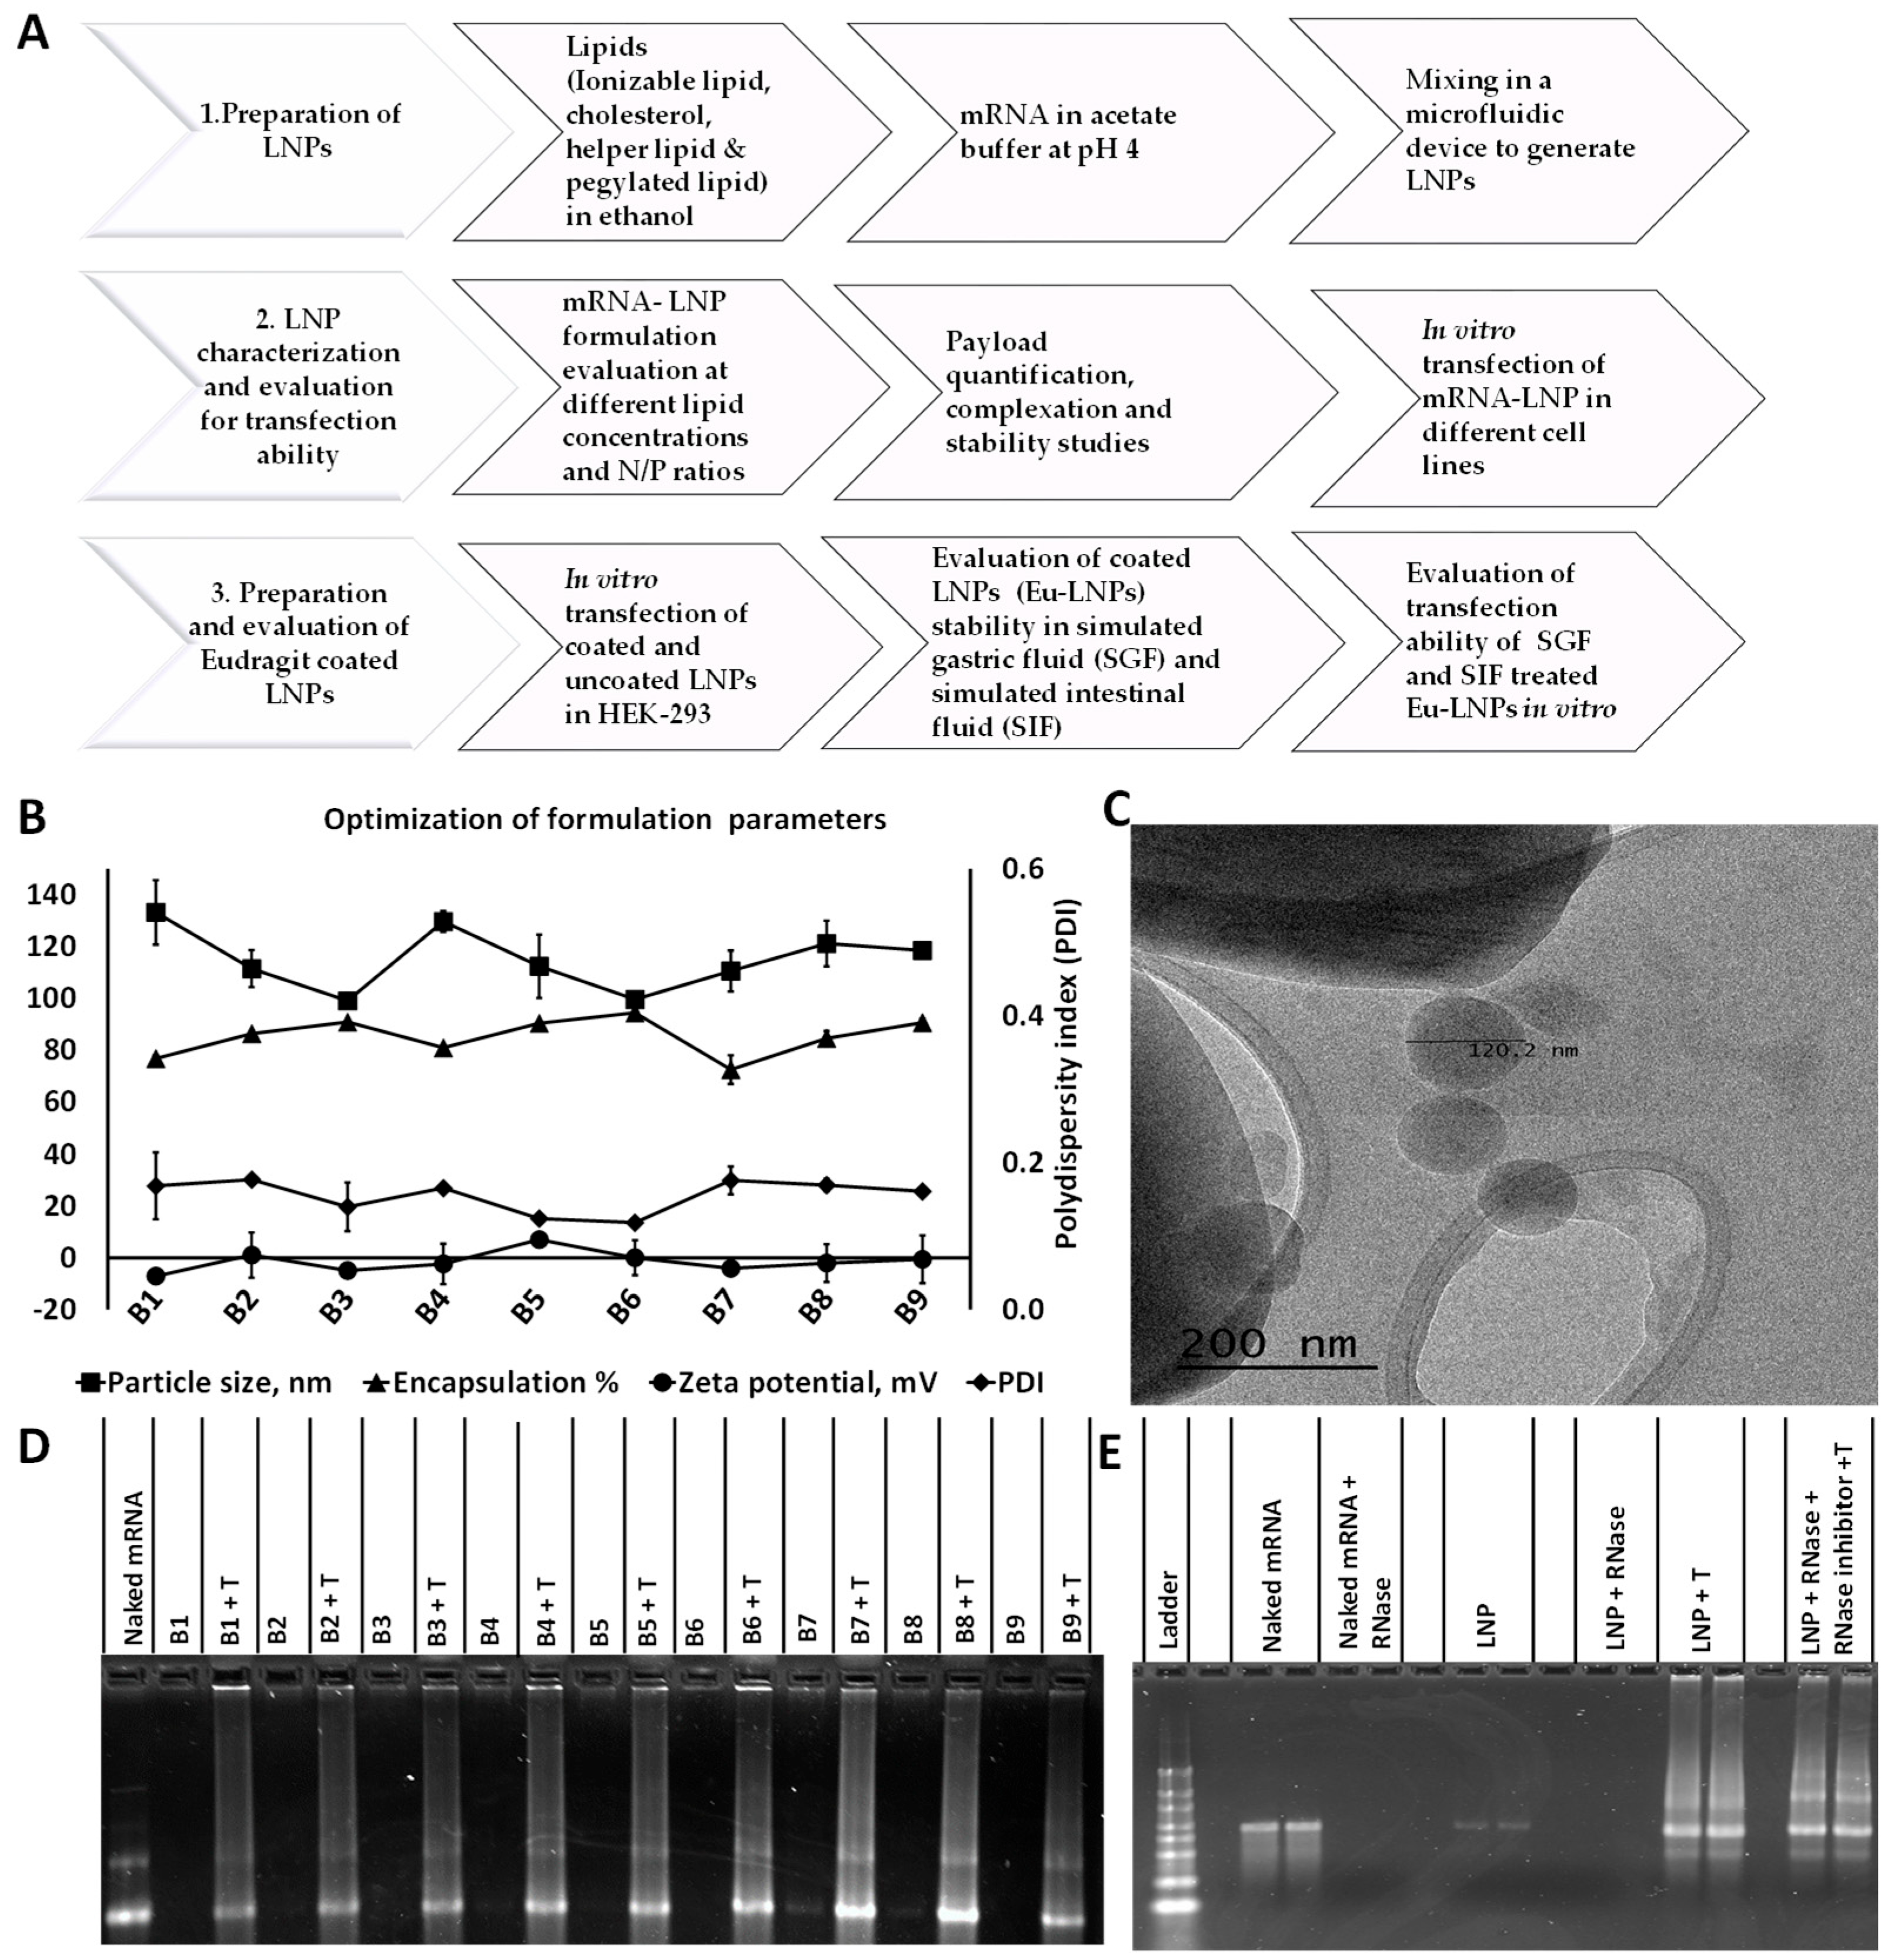
Figure 1. LNP characterization under different formulation conditions. (A) Diagram showing methods used for the preparation and characterization of the carrier; (B) particle size (nm), encapsulation (%), zeta potential (mV) and polydispersity index (PDI) according to changes in N/P ratio or total lipid concentration; (C) transmission electron imaging of mRNA-LNPs. Scale bar = 200 nm; (D) Agarose gel electrophoresis of representative mRNA-LNP formulations with or without 0.1% Triton X-100 (T); (E) LNPs treated with or without RNase followed by extraction with 0.1% Triton X-100 (T) showed that LNPs protected mRNA load against RNase, as detected by gel electrophoresis. All gels were stained with SYBR Gold prior to imaging.
Processes 13 02477 g001
Figure 2. Transfection of LNPs in different cell lines. Cell viability and normalized luminescence/viability ratios determined the toxicity and transfection of the LNP formulations for each cell types i.e., HEK-293 (A,B), SW480 (C,D) and HT-29 (E,F), RAW 264.7 (G,H). All treatment groups received 125 ng of mRNA/well, except for RAW 264.7 cells, which were also transfected at 500 and 1000 ng/well. *: p < 0.05; **: p < 0.01; ***: p < 0.001 vs. control using one-way ANOVA followed by Tukey’s post hoc test; #: p < 0.05, ###: p < 0.001 vs. lipofectamine using one-way ANOVA followed by pairwise comparison.
Processes 13 02477 g002
Figure 3. Evaluation of macrophage (RAW 264.7) polarization by qPCR for LNPs vs. lipofectamine (A) IFN-γ/LPS or IL-4 induced changes on the expression of key pro-inflammatory (iNOS) and anti-inflammatory (Arg-1) markers, as determined by qPCR, respectively. GAPDH was used as reference gene; (B) iNOS/Arg-1 ratio for the two polarized states was used to distinguish pro- or anti-inflammatory responses; (C) Expression of iNOS and Arg-1 after transfecting RAW 264.7 cells with either LNP-mRNA or LFA-mRNA; (D) The ratio of iNOS to Arg-1 gene expression was used for determining macrophage polarization. *: p < 0.05, **: p < 0.01, ***: p < 0.001. Statistical analysis done using one-way ANOVA followed by Tukey’s post hoc test.
Processes 13 02477 g003
Figure 4. Eu-LNPs characterization and transfection in HEK-293 (A) Particle size change of LNPs/Eu-LNPs after coating and PB treatment; (B) Gel electrophoresis assay of Eu-LNPs with mRNA, treated with Triton X or PB followed by Triton X; (CF). Evaluation of the cytotoxicity and transfection efficacy of the Eu-LNPs after transfecting HEK-293 cells with Luciferase-expressing mRNA at Eu/L ratio 1.6 (C,D) and 0.8 (E,F). WTPB groups represent Eu-LNPs without PB treatment while WPB groups are Eu-LNPs treated with PB. *: p < 0.05; ***: p < 0.001 vs. control using one-way ANOVA followed by Tukey’s post hoc test; @@@: p < 0.001 pairwise comparison between WPB vs. WTPB using one-way ANOVA followed by Tukey’s post hoc test.
Processes 13 02477 g004
Figure 5. Eu-LNPs and LNP stability in SGF and their transfection following SGF and SIF incubation at low or high pepsin/pancreatin. Two Eu/L ratios were evaluated (i.e., 0.8 and 1.6). (A) Gel electrophoresis assay for LNPs and Eu-LNPs with encapsulated mRNA that were treated with SGF in fasting (0.32 mg/mL of pepsin) and feeding (3.2 mg/mL of pepsin) conditions. The particles were treated with SGF-Pep, 0.1% Triton X-100 (T), and phosphate buffer pH 8 (PB) and protease inhibitor (Pro), as marked in each respective column; (BE) Cell viability (B,D) and transfection (C,E) of Eu-LNPs and LNPs treated with SGF-Pep. R 0.8 and 1.6 refer to Eu/L weight ratios. Parenthesis concentrations denote pepsin concentrations; (FI) Cell viability (F,H) and transfection (G,I) for Eu-LNPs and LNPs treated with SIF-Pan. Parenthesis concentrations denote pancreatin concentrations. *: p < 0.05, ***: p < 0.001 vs. control; one-way ANOVA followed by Tukey’s post hoc test, @@@: p < 0.001 pairwise comparison between marked groups using one-way ANOVA followed by pairwise test.
Processes 13 02477 g005
Table 1. mRNA-LNP formulation conditions during optimization.
Batch No.IdentificationNitrogen-to-Phosphate (N/P) RatioTotal Lipid Concentration (TLC), mg/mLTotal Lipid/mRNA
Ratio, w/w
B1NP 3/TLC 1.531.510.4
B2NP 6/TLC 1.561.520.9
B3NP 10/TLC 1.5101.534.4
B4NP 3/TLC 1.831.810.4
B5NP 6/TLC 1.861.820.9
B6NP 10/TLC 1.8101.834.4
B7NP 3/TLC 2.232.210.4
B8NP 6/TLC 2.262.220.9
B9NP 10/TLC 2.2102.234.4
Table 2. Eu-LNP formulations and their respective treatment with (WPB) or without (WTPB) phosphate buffer (PB, pH 8) used for transfection in vitro.
LNPsParent LNP Batch
WTPB 4D 4 times dilution in complete media without PB treatment
WPB 4D4 times dilution (1:1 initial dilution with PB, followed by 1:2 complete media dilution)
WTPB 8D 8 times dilution in complete media without PB treatment
WPB 8D8 times dilution (1:1 initial dilution with PB, followed by 1:4 complete media dilution)
WTPB 12D 12 times dilution in complete media without PB treatment
WPB 12D12 dilutions (1:1 initial dilution with PB, followed by 1:6 complete media dilution)
WTPB 16D 16 times dilution in complete media without PB treatment
WPB 16D16 times dilution (1:1 initial dilution with PB, followed by 1:8 complete media dilution)
Table 3. Characterization of mRNA-LNP formulations.
Average ± SEM
LNP FormulationsEncapsulation, %Zeta Potential, mVParticle Size, nmPDI
B1 76.9 ±1.4−7.11 ± 2.7133.3 ± 12.440.169 ± 0.05
B2 86.5 ± 0.321.05 ± 8.72111.6 ± 7.140.177 ± 0.00
B3 91 ± 0.26−4.93 ± 0.4299.2 ± 2.530.140± 0.03
B4 81 ± 0.07−2.4 ± 7.79129.8 ± 3.970.166 ± 0.00
B5 90.5 ± 0.437.02 ± 2.66112.5 ± 12.190.124 ± 0.01
B6 94.5± 0.220.0 ± 6.7399.7 ± 2.00.119± 0.00
B7 72.6 ± 5.53−4.09 ± 2.76110.7 ± 7.940.176 ± 0.02
B884.7 ± 2.82−2.08 ± 7.27121.3 ± 8.790.170 ± 0.01
B990.8 ± 1.53−0.61 ± 9.21118.6 ± 0.210.161 ± 0.01
Disclaimer/Publisher’s Note: The statements, opinions and data contained in all publications are solely those of the individual author(s) and contributor(s) and not of MDPI and/or the editor(s). MDPI and/or the editor(s) disclaim responsibility for any injury to people or property resulting from any ideas, methods, instructions or products referred to in the content.