Article

A Stackelberg Game-Based Joint Clearing Model for Pumped Storage Participation in Multi-Tier Electricity Markets

1
Central China Branch of State Grid Corporation of China, Wuhan 430077, China
2
School of Electrical and Electronic Engineering, Huazhong University of Science and Technology, Wuhan 430074, China
*
Author to whom correspondence should be addressed.
Processes 2025, 13(8), 2472; https://doi.org/10.3390/pr13082472
Submission received: 30 June 2025 / Revised: 19 July 2025 / Accepted: 30 July 2025 / Published: 4 August 2025
(This article belongs to the Section Energy Systems)

Abstract

To address the limited flexibility of pumped storage power stations (PSPSs) under hierarchical clearing of energy and ancillary service markets, this study proposes a joint clearing mechanism for multi-level electricity markets. A bi-level optimization model based on the Stackelberg game is developed to characterize the strategic interaction between PSPSs and the market operator. Simulation results on the IEEE 30-bus system demonstrate that the proposed mechanism captures the dynamics of nodal supply and demand, as well as time-varying network congestion. It guides PSPSs to operate more flexibly and economically. Additionally, the mechanism increases PSPS profitability, reduces system costs, and improves frequency regulation performance. This game-theoretic framework offers quantitative decision support for PSPS participation in multi-level spot markets and provides insights for optimal storage deployment and market mechanism improvement.

1. Introduction

With the deepening of electricity market reforms in China, the power system operation paradigm has gradually evolved from traditional centralized dispatch to a multi-level, coordinated market mechanism. Coordinated clearing between energy and ancillary service markets has become a key direction of multi-level market reform [1]. In recent years, various regions have accelerated the development of ancillary service markets, playing a positive role in ensuring power quality, maintaining system stability, and facilitating the integration of renewable energy [2]. In mature international electricity markets, joint clearing of energy and ancillary services is commonly adopted to achieve holistic dispatch optimization [3,4,5,6,7,8]. However, China’s spot markets are still in the pilot stage and predominantly employ sequential clearing mechanisms, where each market participant enters a single market independently as a price taker. Although this approach is simple and low risk, it often results in inefficient resource allocation and distorted price signals. This hinders the effective participation of flexible and dispatchable units in system regulation [9].
PSPSs, with their fast response and bidirectional regulation capabilities, exhibit significant advantages in frequency regulation and peak shaving services. However, under the current mechanism, the participation model of PSPSs as independent market players remains unclear, and sequential clearing further restricts their ability to coordinate across multiple markets. Existing research primarily focuses on operational optimization of PSPSs [10,11,12,13,14,15] and revenue evaluation [16,17,18]. Previous work [19] developed a risk–return model incorporating energy and ancillary services, demonstrating the importance of reasonable ancillary pricing in cost recovery. Another study [20] emphasized the revenue model and cost recovery analysis of variable-speed pumped storage power stations (VSPSPs) in market environments, illustrating the role of market mechanisms in reflecting flexibility value and achieving profitability. Also, ref. [21] quantitatively analyzed PSPS energy revenue potential under a peak–valley time-of-use pricing mechanism linked with spot markets. The authors of [22] constructed a life-cycle-based cost modeling framework for PSPSs, systematically analyzing the evolution of cost recovery pathways under different market stages. Also, ref. [23] introduced a comparison of sequential and joint clearing mechanisms from the perspective of independent storage value, assessing their impacts on electricity prices, procurement costs, and system flexibility. Also, ref. [24] constructed a bi-level clearing framework incorporating provincial pre-clearing and regional optimization to improve resource allocation and reduce congestion risks in the Yangtze River Delta market. While these studies incorporate market optimization models to some extent, research on cross-market bidding behavior in spot markets, especially from a game-theoretic perspective, remains limited.
As the types and number of market participants on the generation, network, and demand sides continue to increase, the electricity market is transitioning from an oligopolistic to a more competitive structure. Participants now face increasingly complex strategic interactions, which require not only competition over products but also consideration of decision-making sequences [25]. In this context, the Stackelberg game has attracted widespread attention for its ability to model hierarchical decision-making structures [26]. PSPSs, which both fulfill system regulation responsibilities and possess flexible bidding capabilities in joint market environments, inherently embody the characteristics of “leaders” and are thus well suited as upper-level agents in a Stackelberg game framework.
Based on this background, this paper proposes a bi-level Stackelberg game model for PSPSs participating in joint clearing of energy and frequency regulation markets within multi-level electricity markets. The model simulates the strategic interactions between PSPSs and the system operator as a market-clearing agent, analyzing how PSPS bidding strategies affect market outcomes. Compared with existing studies that either treat PSPSs as passive participants in market dispatch or do not consider the feedback between PSPS bidding and market clearing, the proposed model introduces a hierarchical decision-making framework. It explicitly captures the price–quantity coupling between PSPS bidding strategies and multi-market clearing outcomes. This innovation enhances the behavioral realism of PSPS modeling and enables more accurate assessments of operational flexibility and profitability in coordinated market environments. The objective is to provide a theoretical foundation and modeling tool for the development of novel joint clearing mechanisms that effectively integrate flexible resources into future electricity markets.

2. Strategy Modeling Framework for Cross-Market Bidding of PSPSs

As the electricity market transitions toward competitive mechanisms, flexible resources such as PSPSs face increasing challenges in coordinating bidding strategies across spot energy and ancillary service markets. The strategic interactions among market participants in these bidding processes significantly influence price formation and resource allocation, resulting in a game-theoretic nature of market outcomes.
To capture the dynamic linkage between the bidding strategies of PSPSs across markets and the corresponding system dispatch response, this study adopts a Stackelberg game-based leader–follower modeling approach. In this structure, the upper-level leader is the PSPS, which determines its optimal bidding strategies for energy and frequency regulation services based on anticipated bidding information from other market participants, with the objective of maximizing its profit. The lower-level follower is the market operator (or dispatch center), which, upon receiving all bids, clears the market by minimizing total system procurement costs while ensuring optimal resource allocation under system constraints.
As shown in Figure 1, this modeling framework reflects the sequential nature of decision making among strategic agents in electricity markets, where “bidding precedes dispatch,” and provides a systematic approach to analyzing cross-market bidding strategies for pumped storage units within a multi-market environment.

3. Modeling of Coordinated Multi-Market Trading Mechanism for PSPSs

3.1. Bidding Strategy Model of PSPSs

3.1.1. Objective Function

The upper-level model characterizes the bidding behavior of PSPSs in the spot market. The objective is to maximize their total profit through coordinated participation in both energy and frequency regulation markets.
max F U = t = 1 T n = 1 N C X λ t P n , t e P n , t p + t = 1 T n = 1 N C X λ t c a p P n , t c a p λ t m i l P n , t m i l
Here, N C X is the number of pumped storage units; P n , t e is the awarded generation power of unit n at time t; P n , t p is the awarded pumping power of unit n at time t; P n , t c a p is the awarded regulation capacity of unit n at time t; P n , t m i l is the awarded regulation mileage of unit n at time t; λ t is the clearing price in the energy market at time t; λ t c a p is the clearing price in the regulation capacity market at time t; and λ t m i l is the clearing price in the regulation mileage market at time t.

3.1.2. Constraints

  • Output constraints of pumped storage:
E n , m i n C X E n , t C X E n , m a x C X E n , t C X = E n , t 1 C X + η n p p n , t p 1 / η n e p n , t e
0 p n , t e u n , t e p n , m a x e 0 p n , t p u n , t p p n , m a x p u n , t e + u n , t p 1
where E n , t C X is the state of charge (SOC) of unit n at time t; E n , m a x C X and E n , m i n C X are the maximum and minimum energy storage limits; η n p and η n e are the pumping and generating efficiency coefficients; and u n , t e and u n , t p are binary variables indicating generating or pumping mode at time t.
  • Bidding constraints for pumped storage:
0 p n , t p + p n , t c a p p n , m a x p 0 p n , t e + p n , t c a p p n , m a x e 0 p n , t c a p p n , m a x c a p 0 p n , t m i l p n , m a x c a p s C X , n m c
0 b n , t e b n , m a x e 0 b n , t p b n , m a x p 0 b n , t c a p b n , m a x c a p 0 b n , t m i l b n , m a x m i l
where p n , m a x c a p is the maximum regulation capacity bid limit of unit n; s C X , n m c is the mileage-to-capacity ratio for unit n; b n , t p , b n , t e , b n , t c a p , and b n , t m i l are the bidding prices for pumping, generating, regulation capacity and mileage, respectively; and b n , m a x p , b n , m a x e , b n , m a x c a p , and b n , m a x m i l are the corresponding bidding upper limits.
This model does not explicitly include ramping costs or switching delay penalties between pumping and generating modes of PSPS units. This simplification is adopted to maintain model tractability and focus on market-clearing strategy formulation. However, incorporating these dynamic operation characteristics in future work could further improve the realism and accuracy of PSPS dispatch modeling, especially in high-resolution or real-time operation frameworks. This trade-off enables strategic analysis at the market level while acknowledging that future extensions could incorporate more detailed operational features.

3.2. Coordinated Market Clearing Model

3.2.1. Objective Function

The lower-level clearing model aims to minimize the total social cost:
min F L = C g d + C t p
C g d = t = 1 T m = 1 N G b m , t G P m , t G + n = 1 N C X b n , t e P n , t e b n , t p P n , t p
C t p = t = 1 T m = 1 N G b m , t G c a p P m , t G c a p + b m , t G m i l P m , t G m i l +   n = 1 N C X b n , t c a p P n , t c a p + b n , t m i l P n , t m i l
where C g d is the total power purchase cost from thermal generators; C t p is the cost for procuring frequency regulation services; N G is the number of thermal generating units; b m , t G , b m , t G c a p , and b m , t G m i l are the bidding prices of generator m at time t in the energy, regulation capacity, and mileage markets; and P m , t G , P m , t G c a p , and P m , t G m i l are the corresponding awarded quantities.

3.2.2. Constraints

  • Bidding award constraints:
0 P n , t e p n , t e 0 P n , t p p n , t p 0 P m , t G p m , t G
0 P n , t c a p p n , t c a p 0 P n , t m i l p n , t m i l 0 P n , t m i l s C X , n m c p n , t c a p 0 P m , t G c a p p m , t G c a p 0 P m , t G m i l p m , t G m i l 0 P m , t G m i l s G , m m c p m , t G c a p
where p m , t G , p m , t G c a p , and p m , t G m i l are the declared bids; and s G , m m c is the mileage-to-capacity ratio of thermal generator m.
  • Regulation demand constraints:
n = 1 N C X P n , t c a p + m = 1 N G P m , t G c a p = P t c a p n = 1 N C X P n , t m i l + m = 1 N G P m , t G m i l = P t m i l
where P t c a p and P t m i l are the total system requirements for regulation capacity and mileage.
  • Generation capacity limits:
0 P n , t e + P n , t c a p p n , m a x e 0 P n , t p + P n , t c a p p n , m a x p p m , m i n G P m , t G + P m , t G c a p p m , m a x G
where p m , m i n G and p m , m a x G are the output limits of generator m.
  • Node power balance constraint:
m ϕ g i P m , t G + n ϕ C X i P n , t e P n , t p L ϕ L i P L , t L o a d = k ϕ g i B i k θ i , t θ k , t
where ϕ g i , ϕ C X i , and ϕ L i are the sets of thermal units, pumped storage, and loads at node i; ϕ i is the set of adjacent nodes; B i k is the susceptance of the line between nodes i and k; and θ i , t and θ k , t are voltage angles.
  • Line transmission limits:
L l B i k θ i , t θ k , t L l
where L l is the transmission capacity of line l.

4. Model Reformulation and Solution Approach

The proposed bi-level Stackelberg game model exhibits a strong coupling between the upper and lower levels and contains nonlinear components, which prevent it from being directly solved using conventional linear programming methods. To address this issue, the lower-level optimization problem is reformulated into a set of complementarity constraints by applying the Karush–Kuhn–Tucker (KKT) optimality conditions and duality theory [27]. This reformulation transforms the original bi-level structure into a single-level mixed-integer linear programming (MILP) problem. The reformulated model is implemented and solved using the Gurobi solver within the MATLAB 2022b environment. The overall solution procedure is illustrated in Figure 2.
The proposed model adopts a deterministic bi-level structure. The lower-level problem is reformulated as a MILP and solved using Gurobi, which ensures convergence through branch-and-bound search. For a fixed input and scenario, the convex structure of the objective function and constraints leads to a unique solution. The application of KKT conditions in the reformulation ensures theoretical consistency and facilitates tractable implementation of the bi-level game.
The realization steps for solving the bidding–clearing model of PSPSs in multi-market environments are as follows:
1.
Initialize the iteration counter i = 1 , and formulate the PSPS’s initial bidding strategy aimed at maximizing its profit;
2.
Input initial market-clearing prices and bidding information of other market participants;
3.
Conduct a multi-agent bidding game under the joint clearing framework of the energy and ancillary service markets;
4.
Perform joint market clearing to determine clearing prices and awarded quantities;
5.
Calculate the revenue R i of the PSPS unit based on the clearing results;
6.
Compare the current revenue R i with the previous value R i 1   ; if R i > R i 1   , update the bidding strategy, and continue to the next iteration; otherwise, terminate the process;
7.
Output the optimal bidding strategy and corresponding expected revenue.

5. Case Study and Analysis

5.1. Basic Data and Parameters

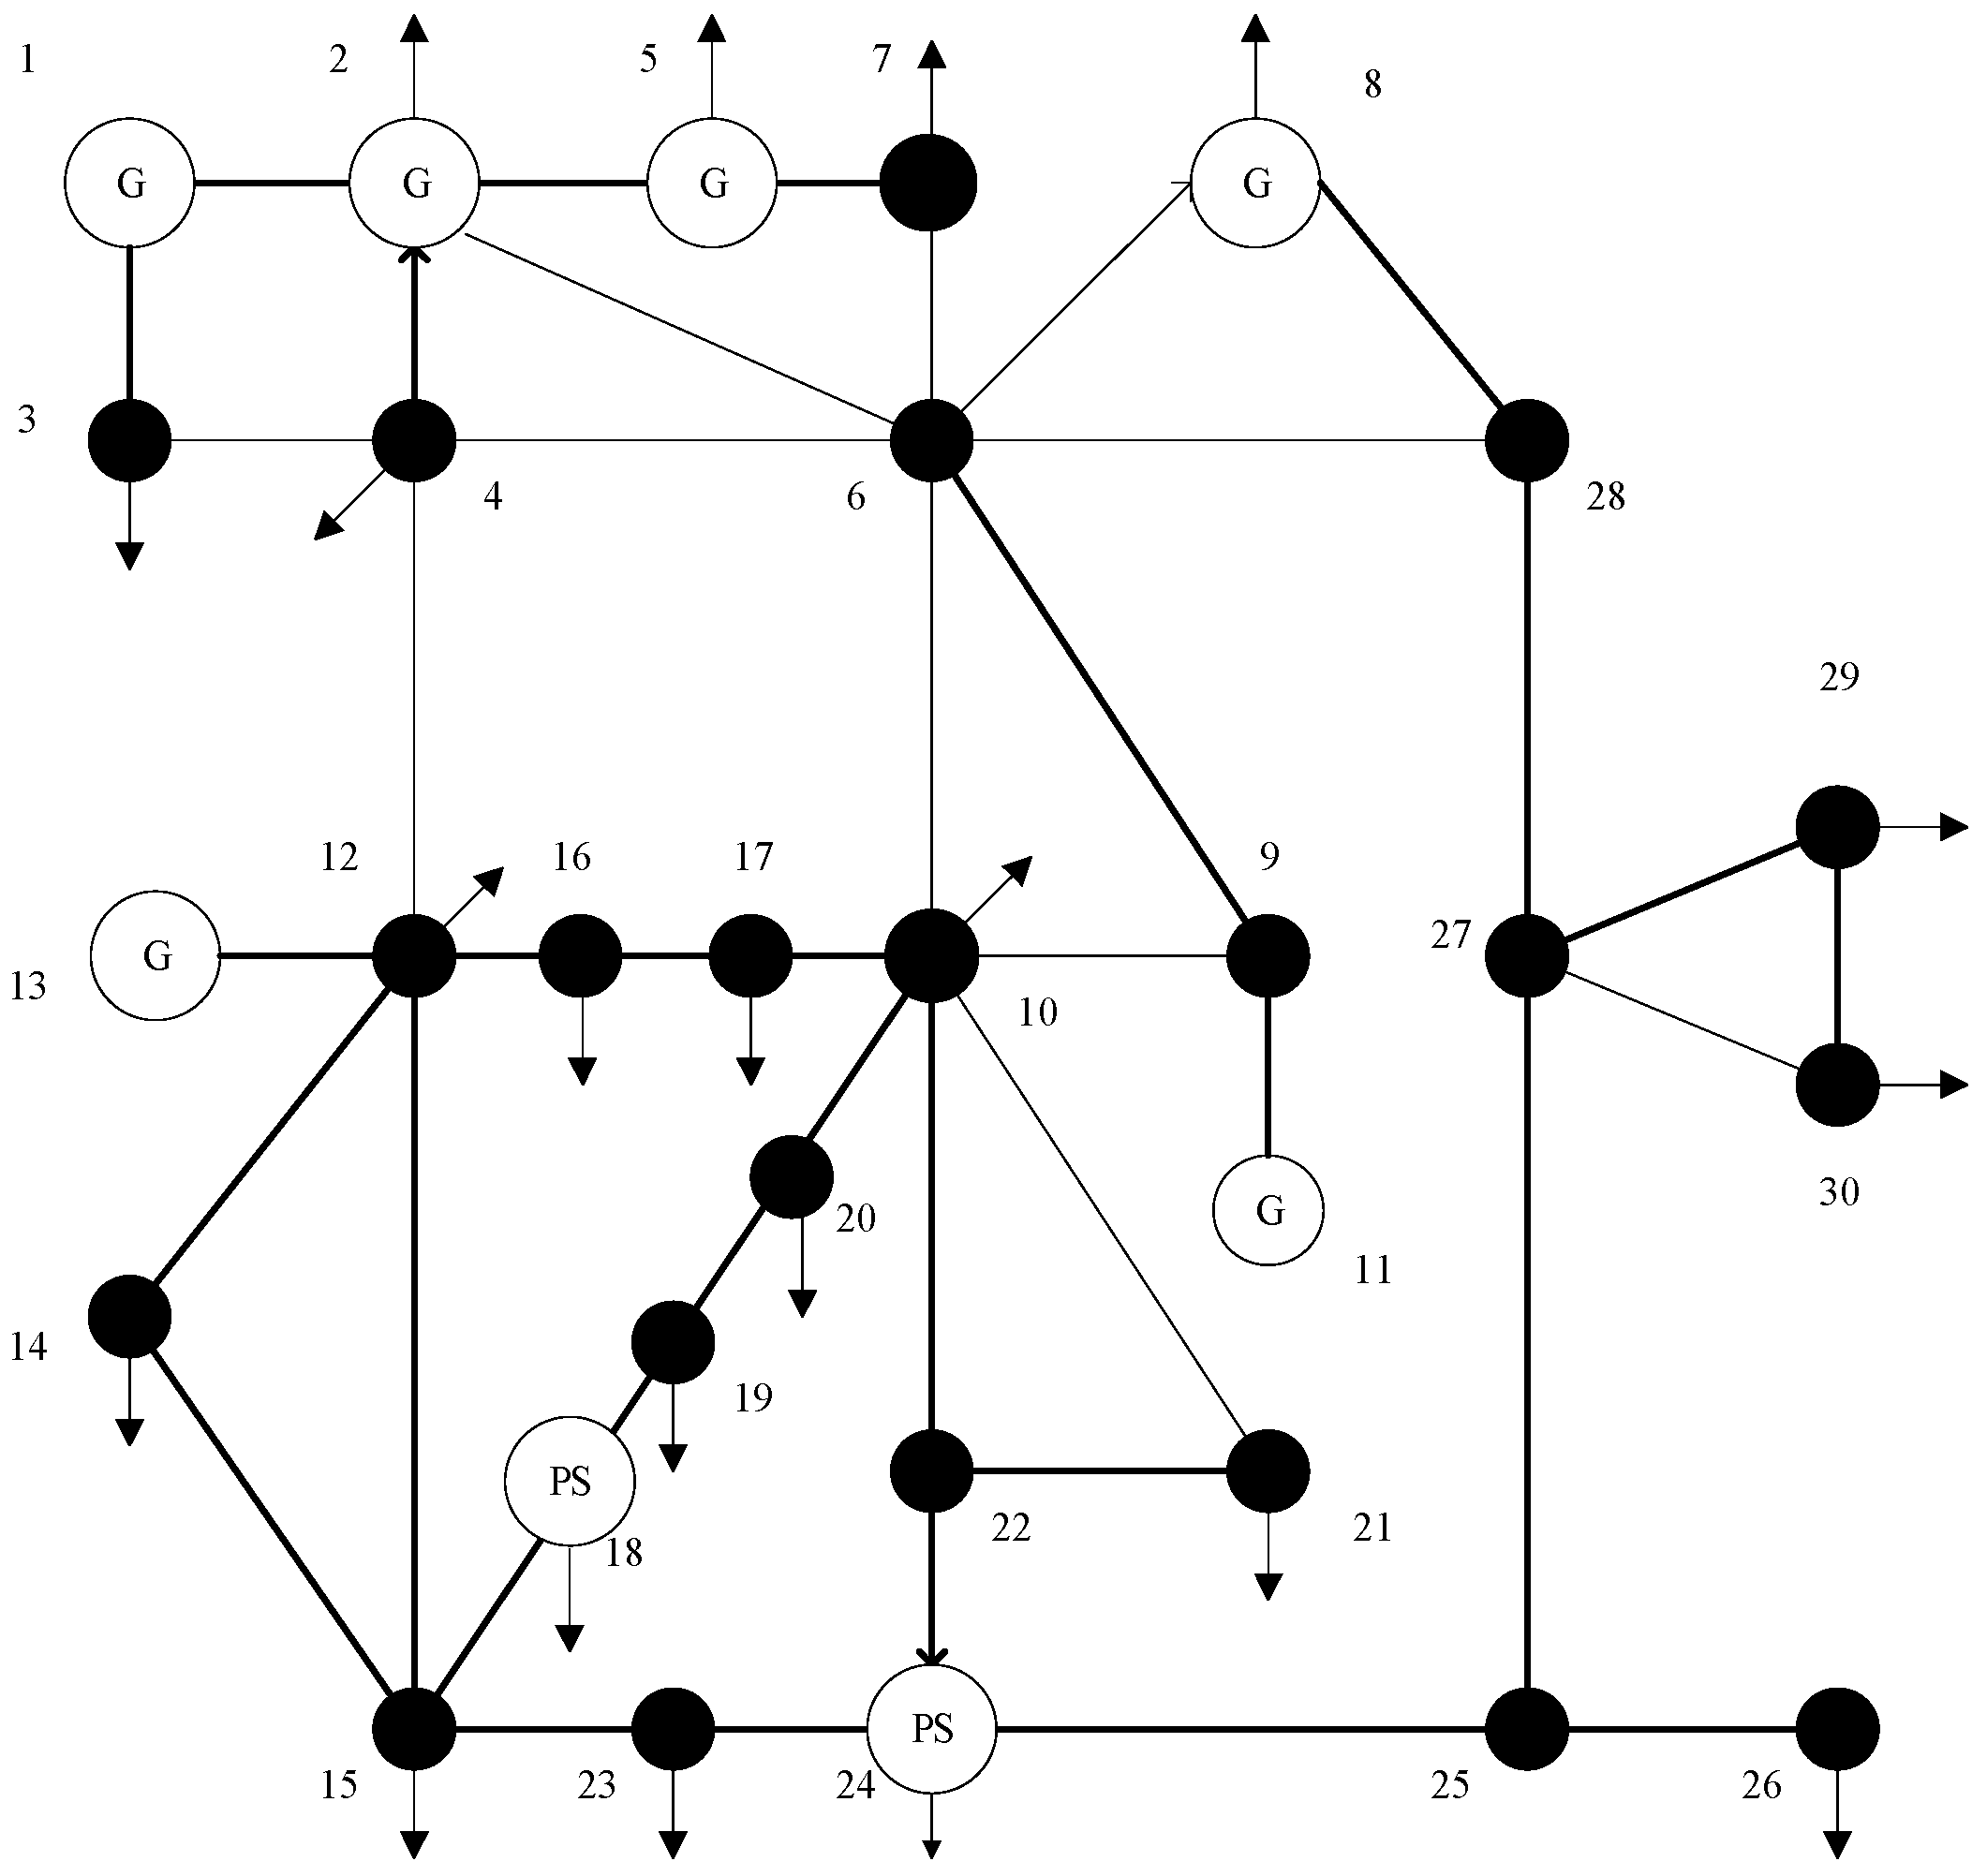
To validate the effectiveness of the proposed joint clearing model for PSPSs in the spot energy and frequency regulation ancillary service markets, the IEEE 30-bus test system is employed for simulation analysis. The system topology is illustrated in Figure 3.
This test system comprises six conventional thermal generating units located at buses 1, 2, 5, 8, 11, and 13, with detailed parameters listed in Table 1 [23]. Two PSPSs are integrated at buses 18 and 24, with rated capacities of 20 MW/60 MWh and 10 MW/40 MWh, respectively. The frequency regulation capacity requirement is set at 5% of the total system load, and the mileage requirement is calculated by multiplying this value by the system’s historical mileage-to-capacity ratio [23].

5.2. Clearing Results of the Energy Market

The spot energy market clearing results are illustrated in Figure 4. During peak load periods (08:00–12:00 and 18:00–20:00), the combined output of thermal units and pumped storage units reaches its daily maximum to meet high demand. In the off-peak period (00:00–05:00), thermal output decreases, and pumped storage units either suspend generation or operate in pumping mode, consistent with their economic dispatch strategy of “pumping at low prices and generating at high prices.”
In terms of total output, thermal units dominate power supply. Units G2 and G4, due to their competitive bidding prices, are dispatched at full capacity for most of the day. Once their output limits are reached, G1 serves as the next-best unit to fill the load gap. Pumped storage units contribute relatively little to the spot energy market, with their daily discharge accounting for approximately 3% of total system load. Given the limited price volatility in the energy market, the units reduce their declared capacity intentionally to reserve regulation potential for the ancillary service market, thereby maximizing their revenue through cross-market coordination.
The market clearing prices are reflected as locational marginal prices (LMPs) at each node and time period. During peak hours, rising demand and increased marginal costs, along with potential congestion, drive up the LMPs. In contrast, LMPs decrease during off-peak hours. While nodal LMPs are generally close across the system, certain hours (e.g., hours 11, 12, and 19) exhibit substantial spikes due to sudden load surges, resulting in unit ramping and transmission congestion. During these times, the pumped storage units generate power, relieving nodal congestion and reducing local LMPs.
Figure 5 reveals a noticeable peak in the electricity market clearing price during the evening hours, particularly around hour 19. This spike coincides with the system’s peak demand period, during which additional generation is needed to meet consumption. As thermal units approach their capacity limits and the dispatch of PSPSs becomes essential, the LMP reflects this tight supply condition by rising significantly. The surge also illustrates the scarcity value of flexible resources in meeting ramping needs during peak load transitions. The joint clearing model effectively captures this supply–demand dynamic, translating physical and economic constraints into price signals that guide optimal unit dispatch and promote efficient resource allocation.

5.3. Clearing Results of the Frequency Regulation Market

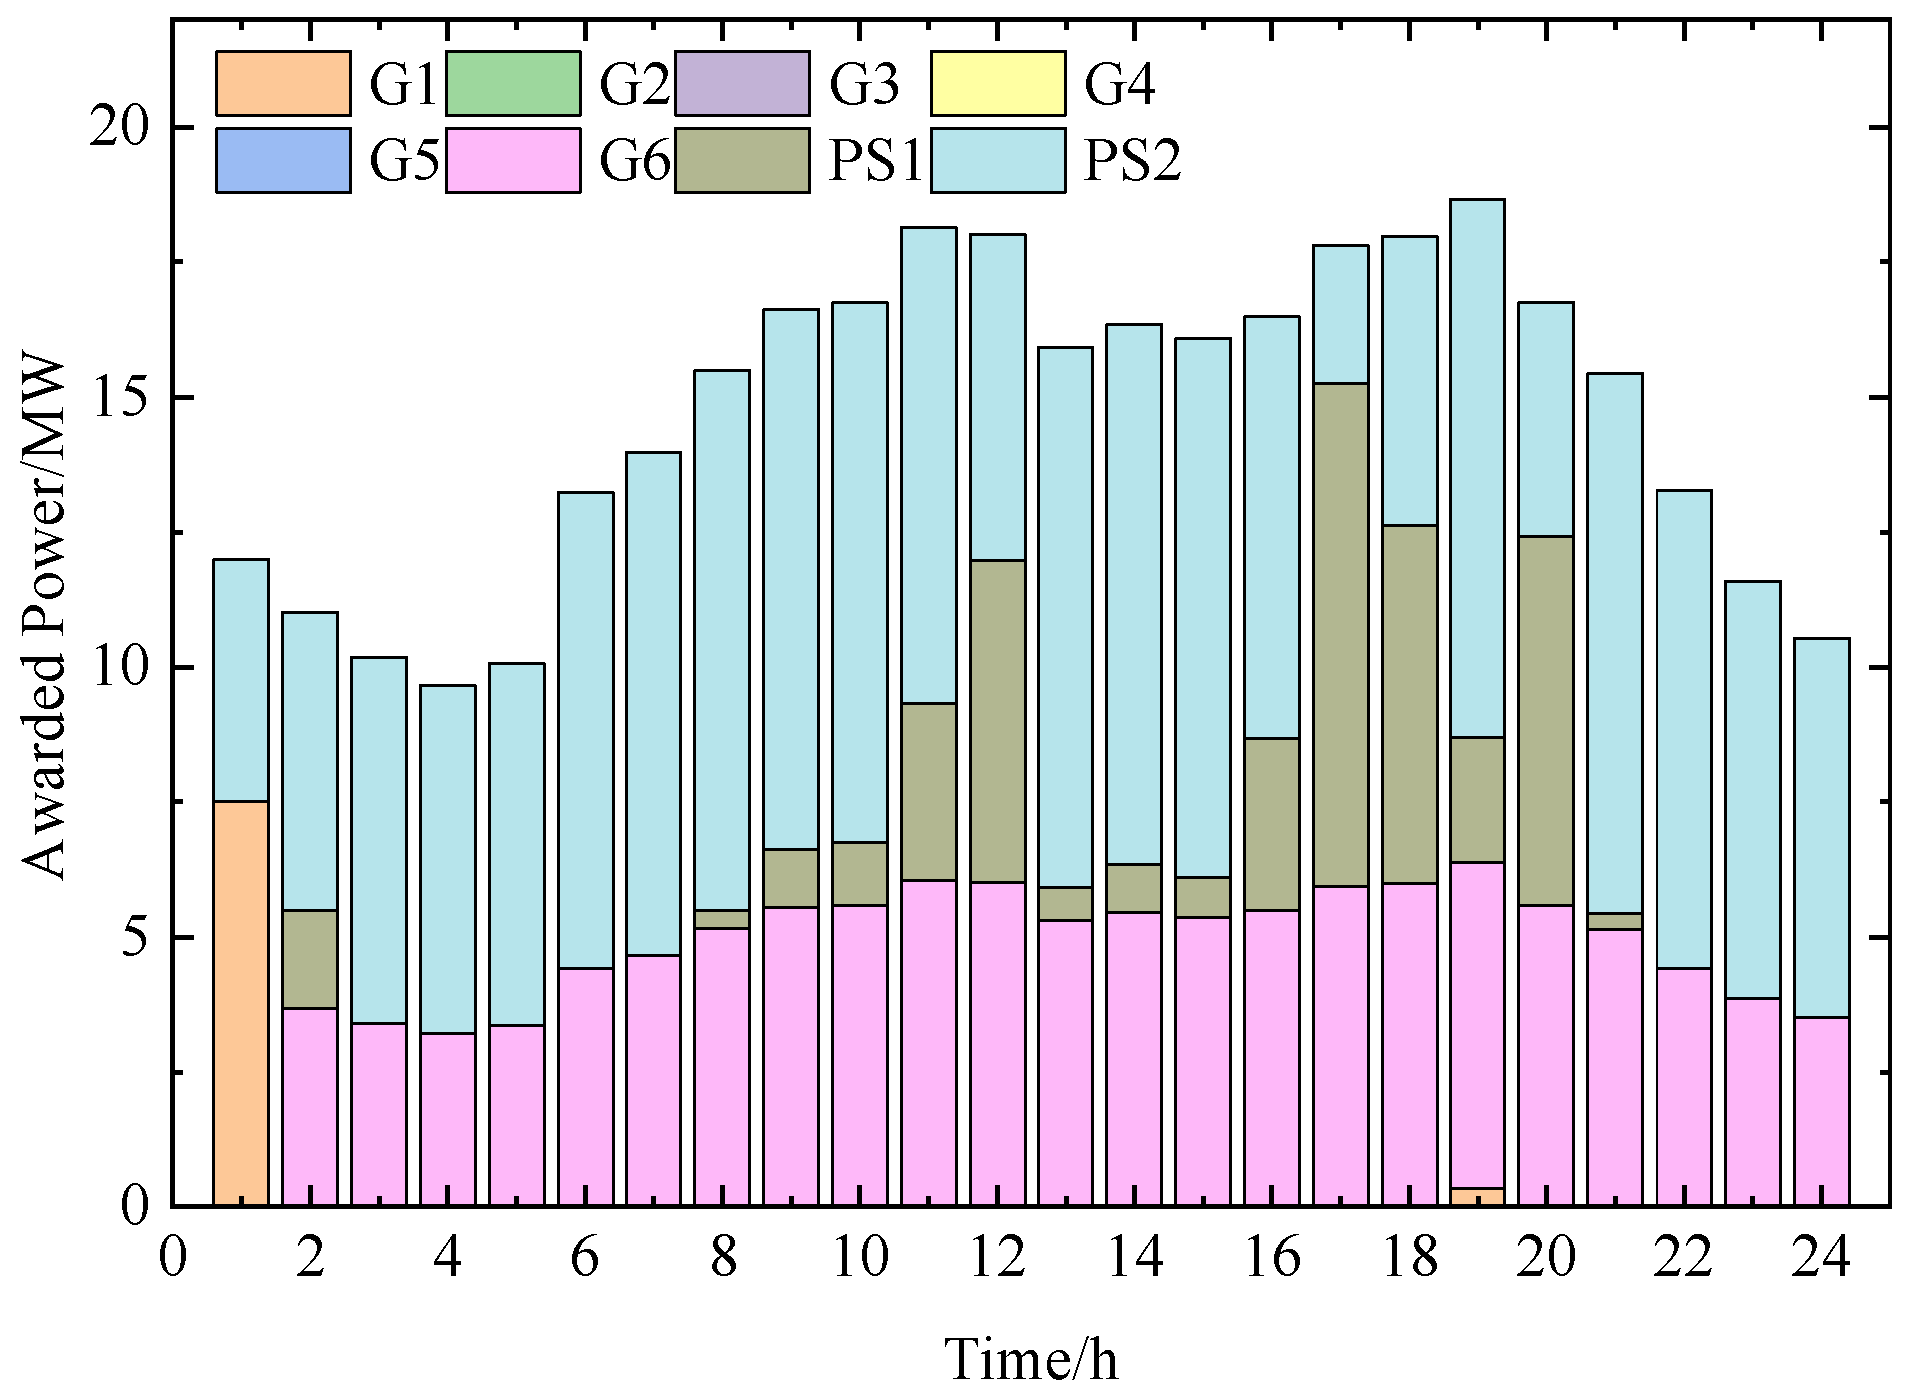
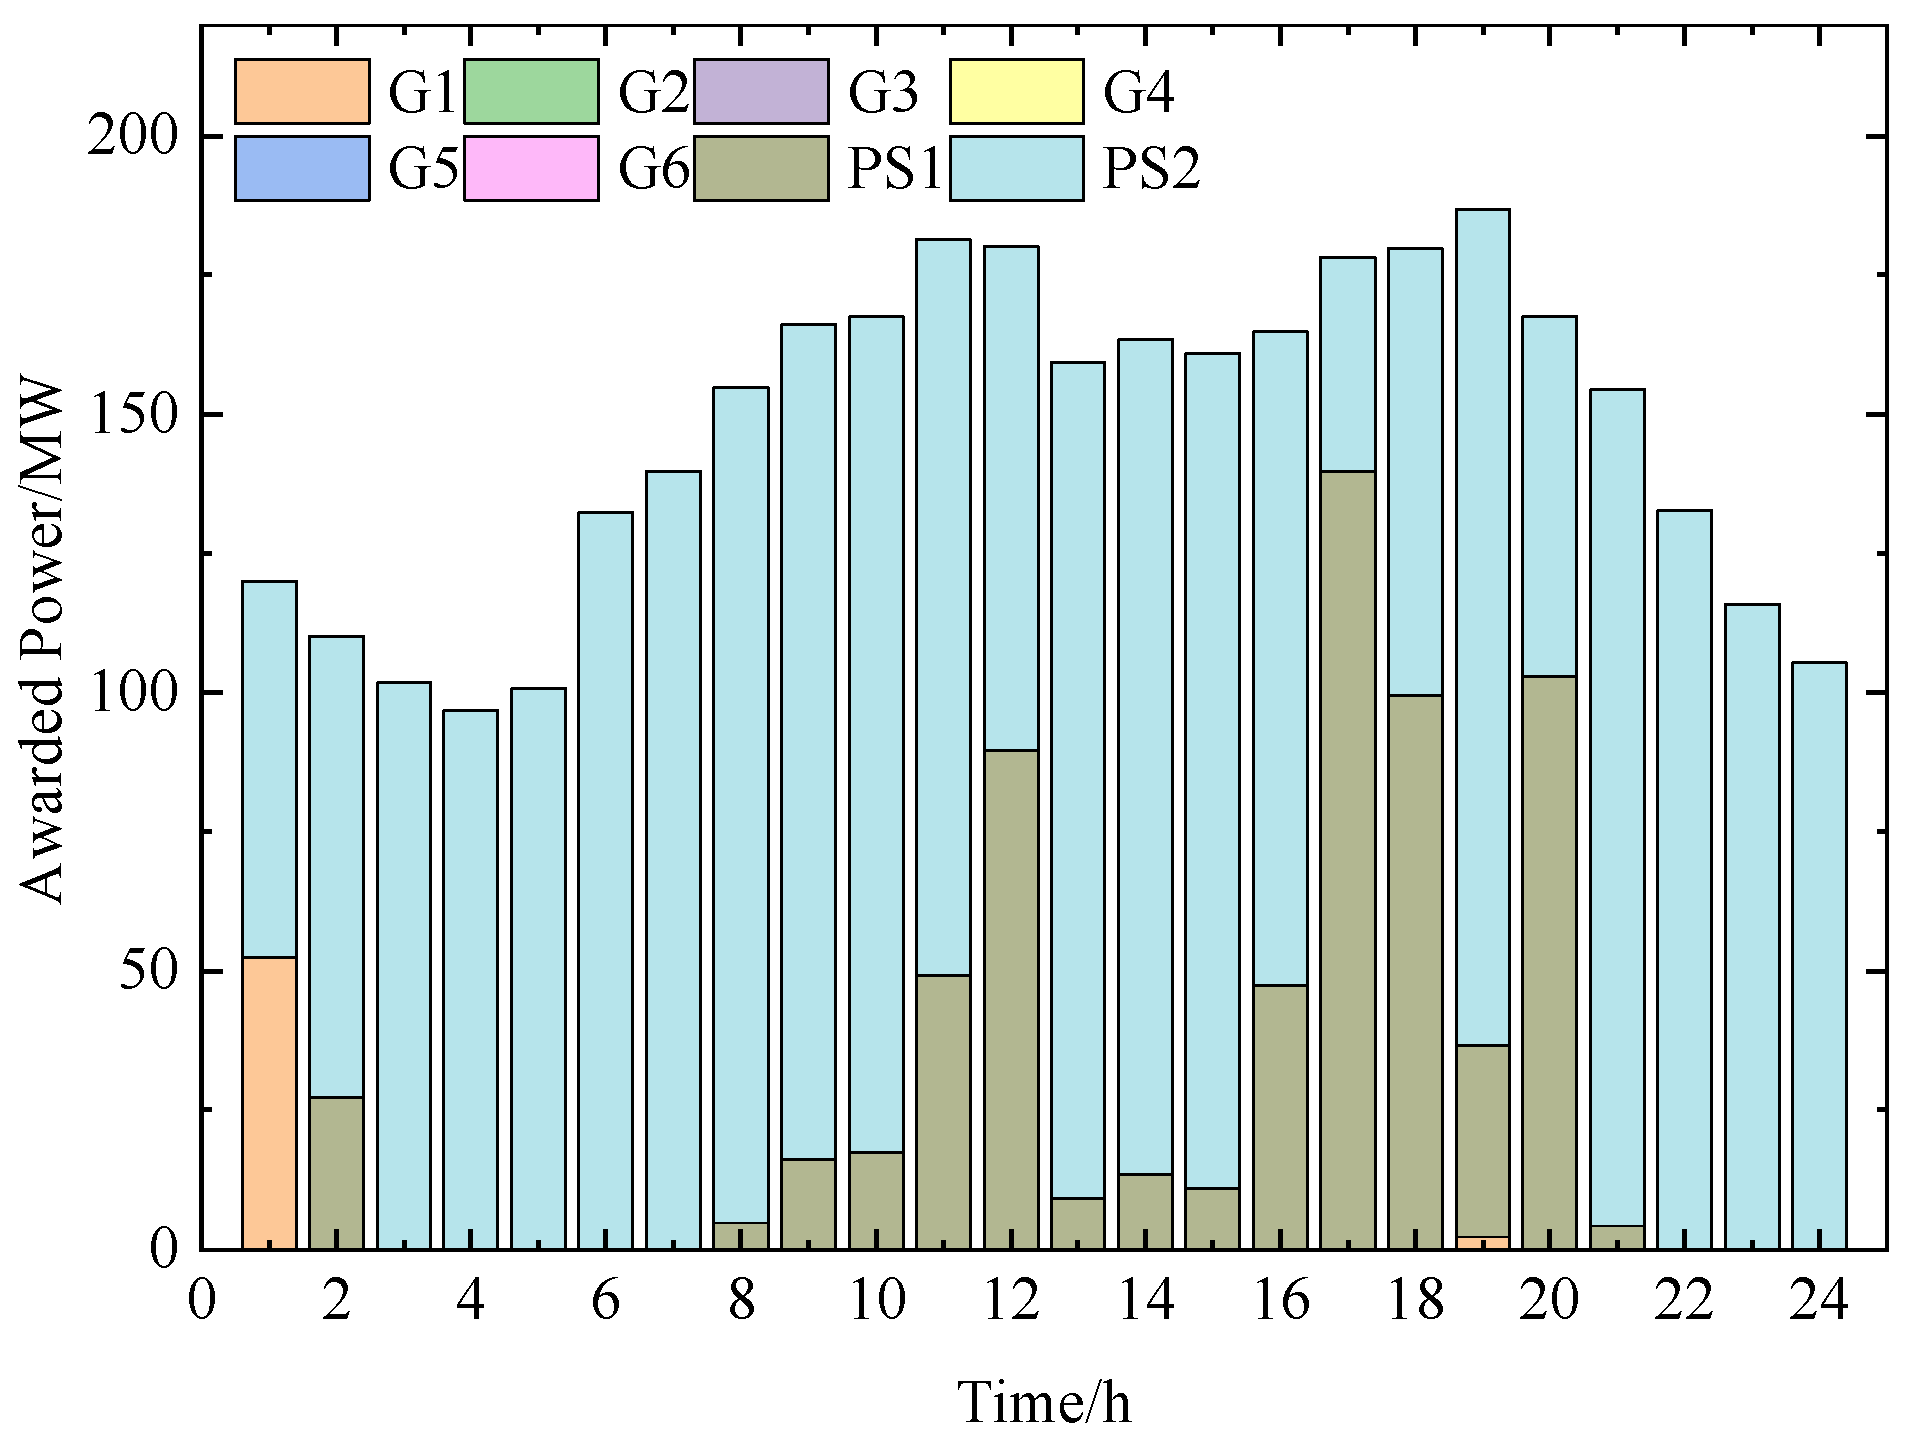
Figure 6 and Figure 7 present the clearing results in the frequency regulation market, indicating the awarded capacities for each unit and time period. Frequency regulation capacity demand is positively correlated with load, while mileage demand is linked to frequency deviation and load fluctuation.
Pumped storage units dominate the frequency regulation markets, undertaking 68.11% of total capacity and 98.44% of mileage regulation tasks. Although thermal units contribute to capacity, their mileage response is significantly limited by technical constraints. The superior responsiveness and high mileage output per unit of capacity give pumped storage units a clear advantage, making them the preferred resources in market clearing.
The non-uniform power distribution observed in Figure 6 and Figure 7 reflects the strategic response of market participants to varying market conditions and operational constraints. First, fluctuations in LMPs and regulation clearing prices across time periods incentivize both PSPS and thermal units to concentrate their generation or reserve provision in hours with higher economic returns. Second, PSPS units are subject to reservoir volume constraints, which limit their ability to provide uniform output across all periods. Consequently, these units prioritize participation during peak-price or high-regulation-demand periods to optimize operational profits. Third, the regulation mileage demand and ramping requirements vary by hour, further driving time-specific dispatch behavior. This non-uniformity highlights the model’s capability to reflect realistic market-driven flexibility allocation and time-coupled decision-making processes. This confirms the effectiveness of the model in capturing economic and operational incentives.
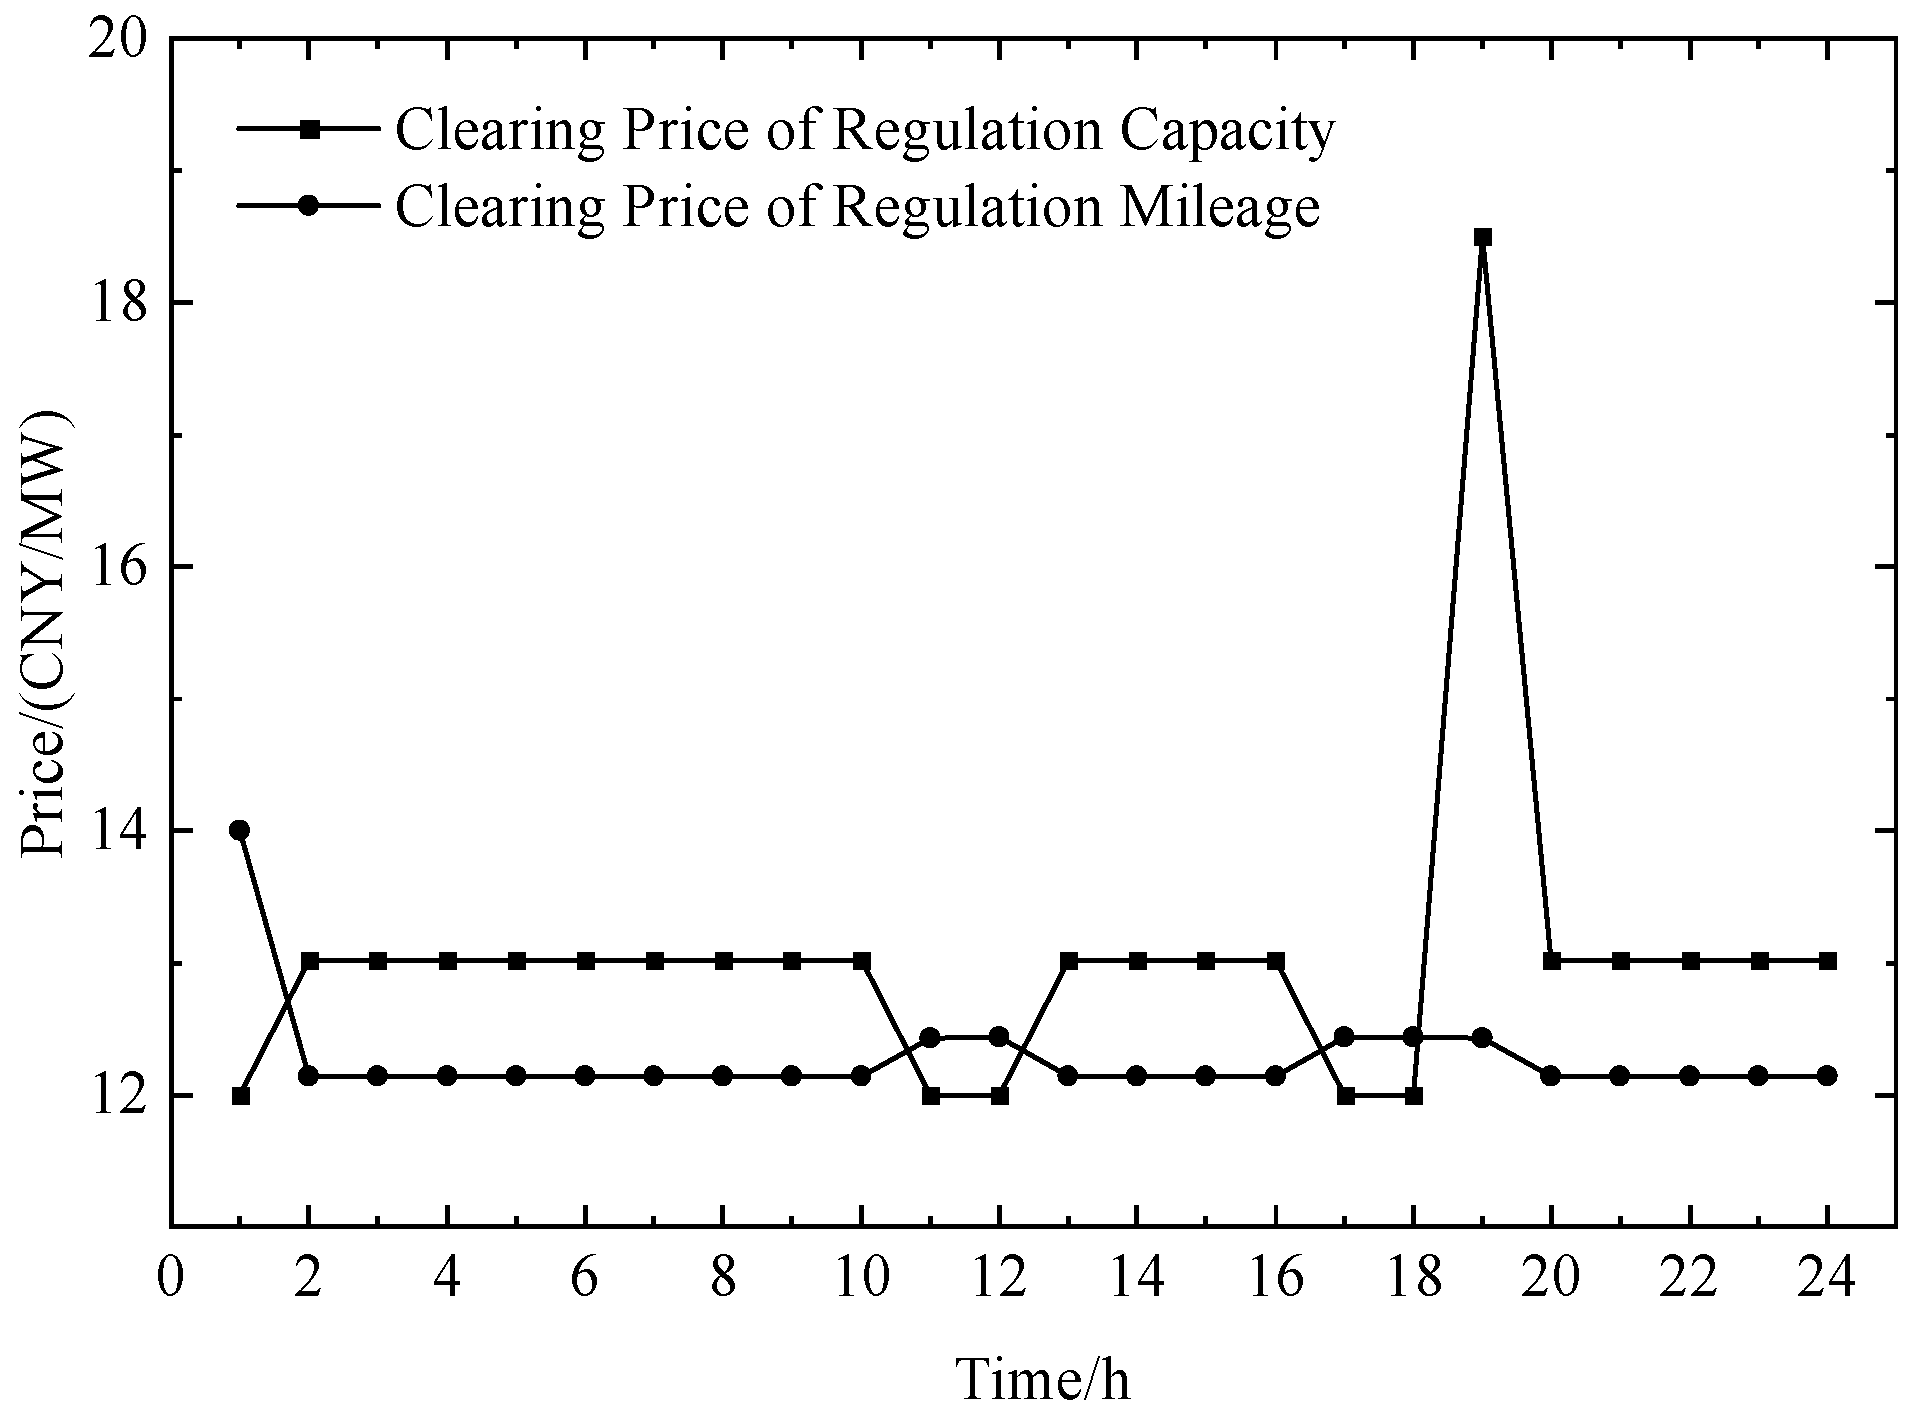
The clearing prices for frequency regulation are shown in Figure 8. Overall, regulation capacity prices remain stable throughout the day, except at hour 18, where a prominent peak occurs. This peak is caused by the simultaneous surge in system regulation demand during the peak load hour and the switching of PSPS units from pumping to generation mode. Due to output and ramping constraints, low-cost units cannot fully meet the increased regulation demand, necessitating the dispatch of higher-cost units, which drives prices upward. Meanwhile, the PSPS units rapidly respond by releasing stored energy into the grid, contributing to the concentrated upward dispatch signal reflected in the peak price. Mileage prices fluctuate slightly, mainly during nighttime and load ramping hours, indicating overall stable frequency control. The synchronized variation between price curves and regulation demand demonstrates the market mechanism’s effectiveness in transmitting supply–demand signals and the PSPS’s role in enhancing system flexibility.

5.4. Pumped Storage Operational Strategy

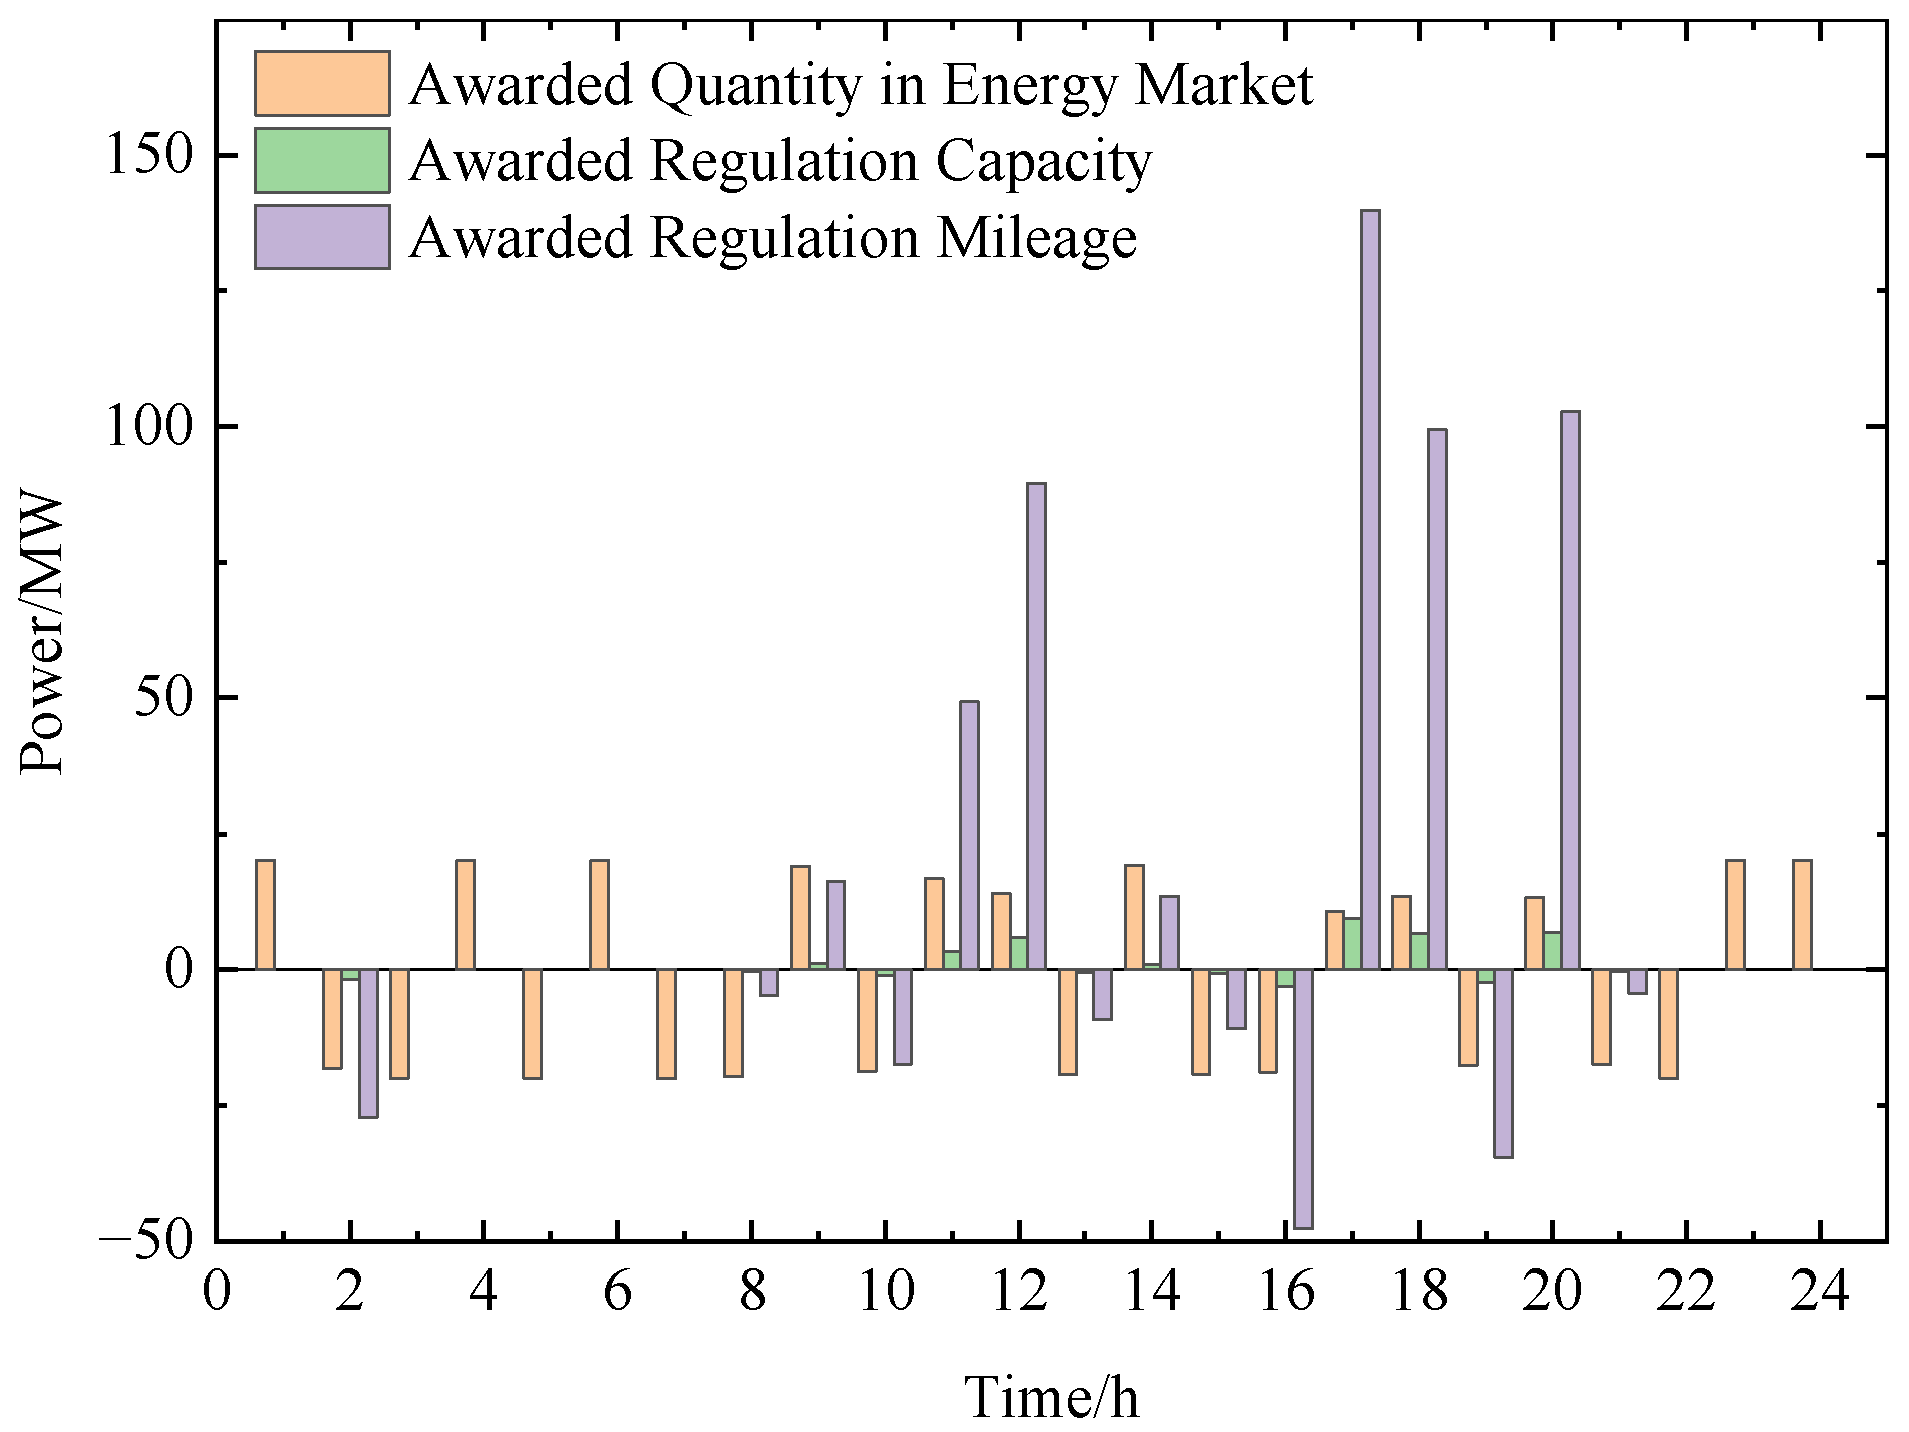
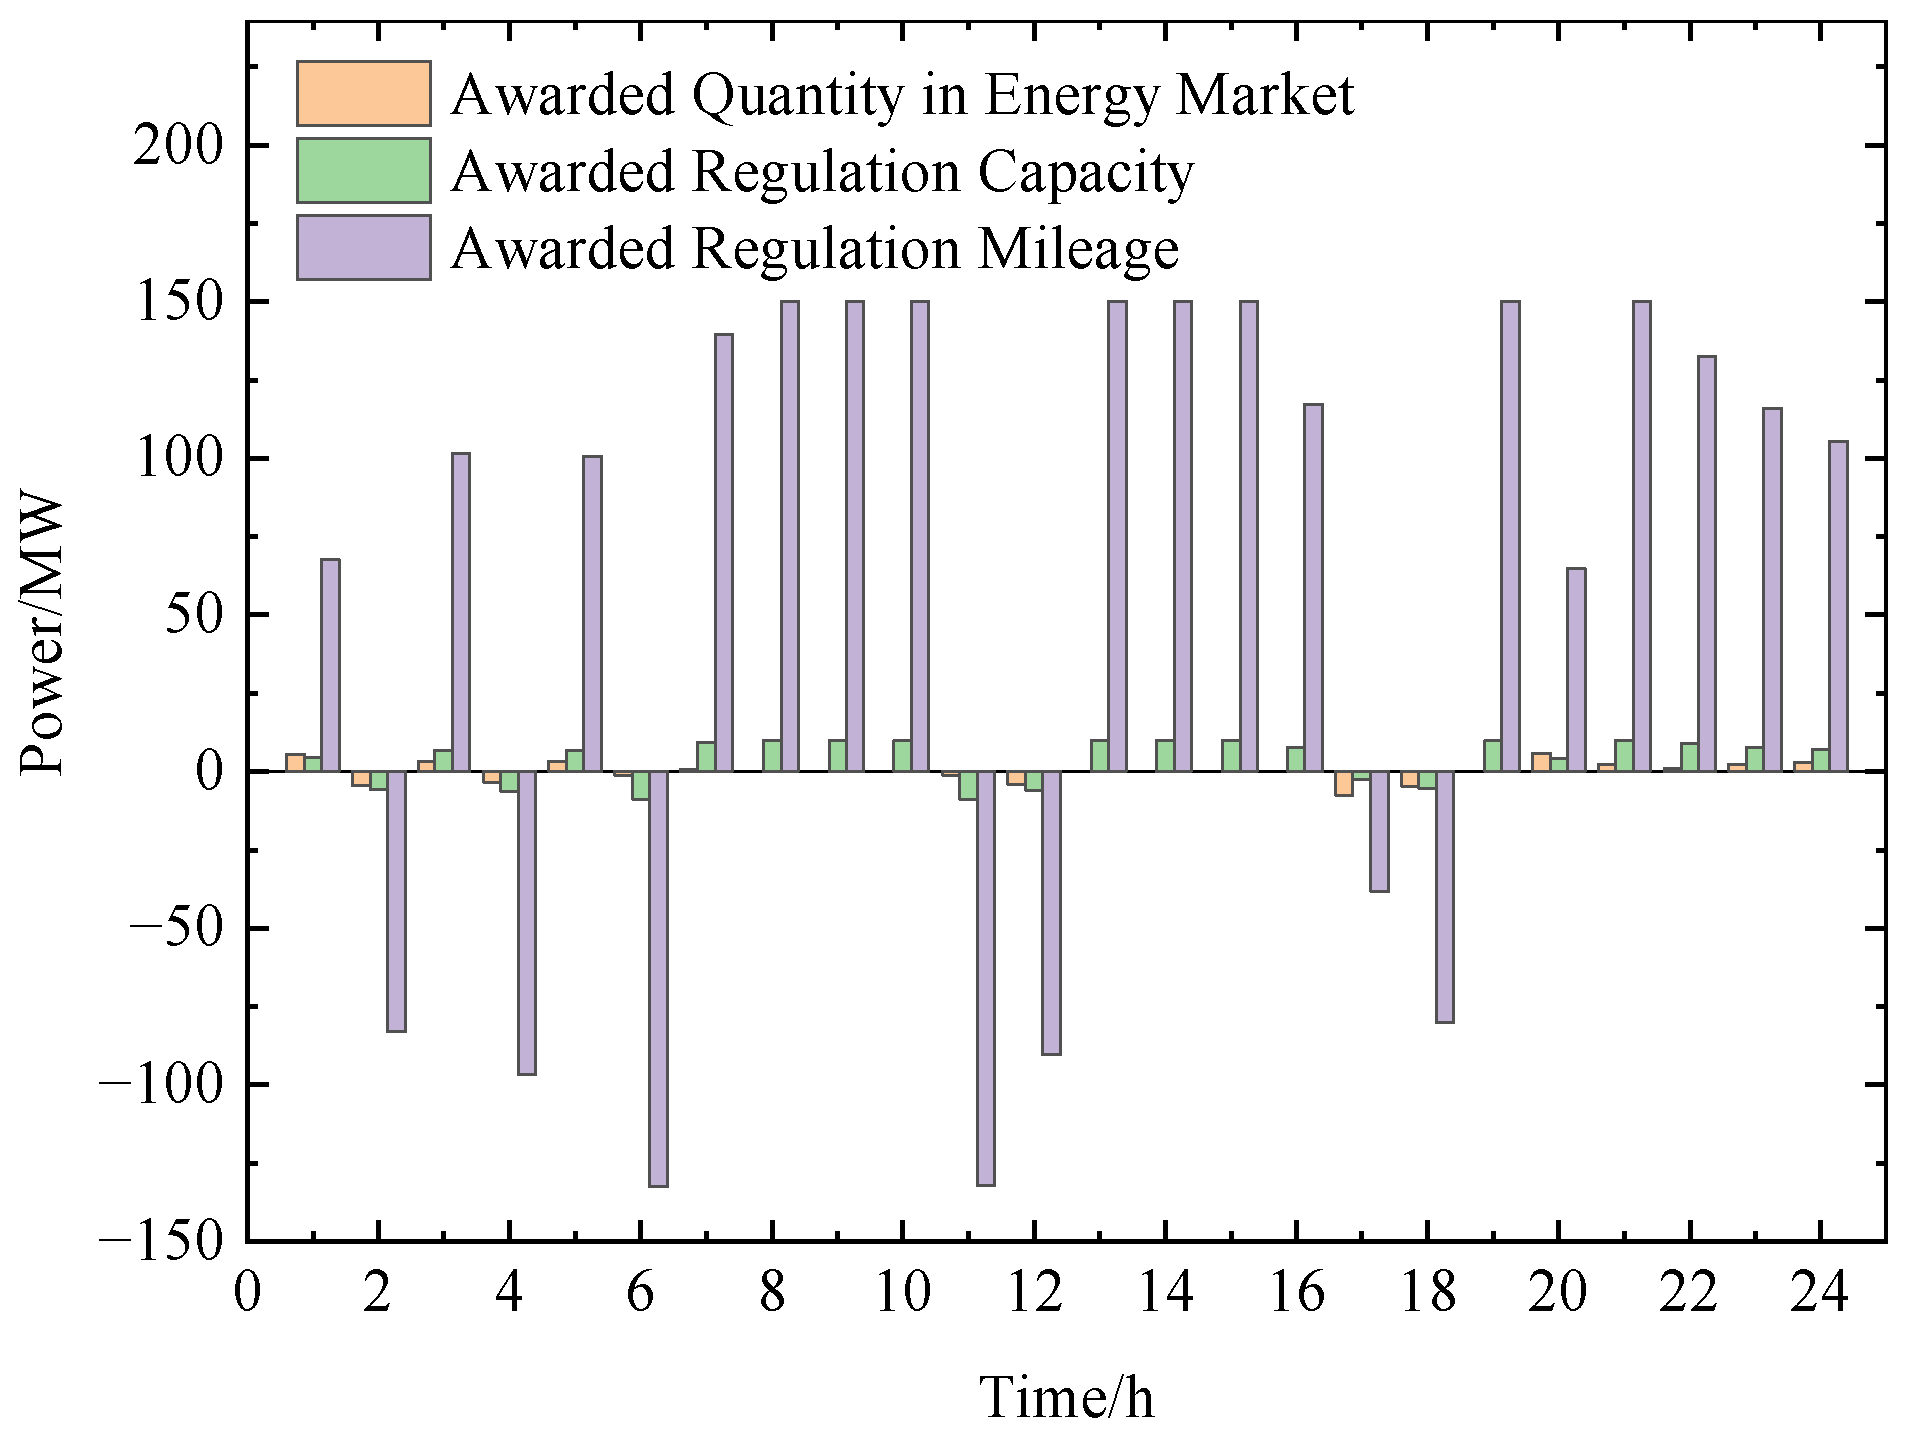
Figure 9 and Figure 10 show the awarded results of the two pumped storage units in the joint market.
The units generate during high-load, high-price periods and switch to pumping during low-load, low-price hours. In the figures, positive values represent generation output, while negative values denote pumping power (i.e., electricity consumption for water storage). This sign convention is used solely for visualization clarity; the underlying optimization model treats generation and pumping as separate decision variables.
The PSPSs respond directionally to system frequency needs, providing efficient adjustment through load shifting. The operational patterns of PS1 and PS2 differ in power direction, influenced by factors such as node location, installed capacity, efficiency, and minimum runtime. This reflects the differentiated, optimal strategies generated by the joint clearing mechanism, which considers constraints like ramping, efficiency, network flows, and LMPs.

5.5. Profit Analysis of Market Participants

The revenues of different participants in the spot market are summarized in Table 2. Thermal units mainly provide base load power, earning the bulk of energy revenues. However, due to their limited ramping speed and flexibility, they gain relatively little in the regulation market and receive only minimal compensation from regulation services.
In contrast, the two pumped storage units achieve significant revenues, especially from the regulation mileage market. Their flexible characteristics—such as rapid startup and fast ramping—allow them to perform frequent adjustments and secure higher profits. Their income from ancillary services far exceeds that from the energy market, showing their value in relieving thermal regulation pressure and improving system economics. Encouraging their participation in ancillary services is essential for both cost recovery and system optimization.

5.6. Economic Benefit Analysis of Pumped Storage

Based on the clearing results and operating strategies under the joint clearing model, the daily profits of pumped storage units are calculated. As shown in Table 3, the total daily profit from joint participation in the energy and frequency regulation markets reaches CNY 40,964.26, which is CNY 3977.96 higher than under traditional planned dispatch. Projected over a 50-year lifetime, the cumulative economic value amounts to approximately CNY 748 million, with most of the revenue derived from ancillary services.
Although the economic benefits under the joint market model are only marginally higher than those under a two-part tariff scheme, this is due to the limited scope of the simulated markets: only energy and frequency regulation are considered. Other ancillary services, such as reserves and black start, are excluded, leading to potential underestimation. Future market reforms should further enhance the role of pumped storage in ancillary services and improve market incentives to support its efficient utilization, thereby strengthening the system’s overall flexibility and regulation capabilities.

6. Conclusions

This paper develops a bi-level Stackelberg game model to characterize the strategic bidding behavior of PSPSs in multi-tier electricity markets. The model captures the interactions between PSPSs and the market operator under a joint clearing mechanism for energy and ancillary services. Simulation results based on the IEEE 30-bus system confirm the effectiveness of the proposed framework in coordinating market-clearing outcomes and guiding PSPS operation strategies. The joint clearing mechanism integrates energy and frequency regulation markets, thereby improving resource allocation efficiency and reducing total system procurement costs.
PSPSs leverage their fast response, ramping capability, and bidirectional operation to switch between generation and pumping according to price signals. They provide frequency regulation services during peak and ramping periods, alleviating the burden on thermal units and enhancing system flexibility and economic performance. Moreover, PSPSs achieve higher revenues from frequency regulation services compared to the energy market alone. Coordinated participation across both markets maximizes their overall profit and demonstrates their economic potential in modern power systems.
Compared with conventional models that treat PSPS operation as a passive dispatch outcome, the proposed Stackelberg game-based framework enables PSPSs to strategically determine their bidding strategies in response to multi-market coordination and price feedback. This modeling innovation allows for more realistic simulation of market interactions. Simulation results demonstrate that the joint clearing mechanism improves PSPS profitability, enhances operational flexibility, and reduces total regulation costs, thereby revealing clear comparative advantages over existing models.
It is explicitly assumed that the proposed model adopts a deterministic setting with known market and system parameters. While this simplification facilitates the formulation and solution of the Stackelberg game model, it does not reflect the inherent uncertainties of real-world systems. In future research, incorporating stochastic elements such as renewable forecast errors, real-time frequency deviations, and demand fluctuations will enhance the model’s applicability and robustness in practical market environments. Such enhancements would support decision making under uncertainty and align with emerging market environments characterized by high renewable energy sources penetration.
This study offers a theoretical foundation and modeling tool for optimizing PSPS participation in spot markets. Future work may extend the proposed framework in several directions: (i) incorporating intermittent renewable energy sources such as wind and solar to better reflect market volatility and highlight the flexibility of PSPSs and (ii) integrating additional ancillary services such as spinning reserve and black-start capability to improve system resilience and support comprehensive market coordination.

Author Contributions

Conceptualization, L.Z., M.H. and Z.C.; Methodology, L.Z., M.H. and H.X.; Software and validation, L.Z., H.X. and W.L.; Formal analysis and investigation, L.Z. and M.H.; Writing—original draft preparation, L.Z., M.H. and J.Z.; Writing—review and editing, S.R. and X.C.; Visualization, W.L. and J.Z.; Supervision and project administration, Z.C. and X.C. All authors have read and agreed to the published version of the manuscript.

Funding

This work was funded by the Central China Branch of State Grid Corporation of China through the Science and Technology Project: Research on Joint Optimization Scheduling Technology of Clean Energy and Multi-Type Energy Storage in Large Power Grids (No. SGHZ0000DKJS2400240). The APC was funded by the same project.

Data Availability Statement

The original contributions presented in this study are included in the article. Further inquiries can be directed to the corresponding author.

Conflicts of Interest

Authors Lingkang Zeng, Hao Xu, Zhongzhong Chen and Wanjing Li were employed by the company Central China Branch of State Grid Corporation of China. The authors declare that this study received funding from State Grid Corporation of China. The funder was not involved in the study design, collection, analysis, interpretation of data, the writing of this article or the decision to submit it for publication. The remaining authors declare that the research was conducted in the absence of any commercial or financial relationships that could be construed as a potential conflict of interest.

Nomenclature

PSPSPumped storage power station
LMPLocational marginal price
MILPMixed-integer linear programming
KKTKarush–Kuhn–Tucker
λ t The clearing price in the energy market at time t, CNY/MWh
λ t c a p The clearing price in the regulation capacity market at time t, CNY/MW
λ t m i l The clearing price in the regulation mileage market at time t, CNY/MW
F U The objective function of the upper level
F L The objective function of the lower level
C g d The total energy procurement cost from thermal generators
C t p The total cost of frequency regulation services
p n , t e The declared generation power of PSPS unit n at time t, MW
p n , t p The declared pumping power of PSPS unit n at time t, MW
p n , t c a p The declared regulation capacity of PSPS unit n at time t, MW
p n , t m i l The declared regulation mileage of PSPS unit n at time t, MW
p m , t G The declared energy bid of thermal unit m at time t, MW
p m , t G c a p The declared regulation capacity bid of unit m at time t, MW
p m , t G m i l The declared regulation mileage bid of unit m at time t, MW
P n , t e The awarded generation power of PSPS unit n at time t, MW
P n , t p The awarded pumping power of PSPS unit n at time t, MW
P n , t c a p The awarded regulation capacity of PSPS unit n at time t, MW
P n , t m i l The awarded regulation mileage of PSPS unit n at time t, MW
P m , t G The awarded generation power of thermal unit m at time t, MW
P m , t G c a p The awarded regulation capacity of unit m at time t, MW
P m , t G m i l The awarded regulation mileage of unit m at time t, MW
b n , t e The generation bid price of PSPS unit n at time t, CNY/MWh
b n , t p The pumping bid price of PSPS unit n at time t, CNY/MWh
b n , t c a p The regulation capacity bid price of PSPS unit n at time t, CNY/MW
b n , t m i l The regulation mileage bid price of PSPS unit n at time t, CNY/MW
b m , t G The generation bid price of thermal unit m at time t, CNY/MWh
b m , t G c a p The regulation capacity bid price of unit m at time t, CNY/MW
b m , t G m i l The regulation mileage bid price of unit m at time t, CNY/MW
E n , t C X The state of charge of PSPS unit n at time t, MWh
E n , m a x C X The maximum energy storage of unit n, MWh
E n , m i n C X The minimum energy storage of unit n, MWh
η n e The efficiency coefficient for generation of unit n
η n p The efficiency coefficient for pumping of unit n
u n , t e The binary variable indicating generation status, u n , t e [ 0,1 ]
u n , t p The binary variable indicating pumping status, u n , t p [ 0,1 ]
P t c a p The total regulation capacity demand at time t, MW
P t m i l The total regulation mileage demand at time t, MW
s C X , n m c The mileage-to-capacity ratio of PSPS unit n
s G , m m c The mileage-to-capacity ratio of thermal unit m
θ i , t The voltage angle at node i and time t
B i k The line susceptance between nodes i and k
L l The transmission limit of line l, MW

References

  1. National Energy Administration. Blue Book on Development Planning of National Unified Electricity Market; National Energy Administration: Beijing, China, 2024. [Google Scholar]
  2. National Development and Reform Commission; National Energy Administration. Notice on Establishing and Improving the Price Mechanism for Power Auxiliary Services. 2024. Available online: https://www.gov.cn/zhengce/zhengceku/202402/content_6931026.htm (accessed on 25 June 2025).
  3. Papalexopoulos, A.D.; Andrianesis, P.E. Performance-Based Pricing of Frequency Regulation in Electricity Markets. IEEE Trans. Power Syst. 2014, 29, 441–449. [Google Scholar] [CrossRef]
  4. MISO. Business Practices Manual: Energy and Operating Reserve Markets. Available online: https://www.misoenergy.org/legal/business-practice-manuals/ (accessed on 25 June 2025).
  5. PJM. PJM Manual 11: Energy and Ancillary Services Market Operations. Available online: https://www.pjm.com/~/media/documents/manuals/m11.ashx (accessed on 25 June 2025).
  6. ISO-NE. Market Rule 1: Standard Market Design. Available online: https://iso-ne.com/staticassets/documents/2014/12/mr1_sec_1_12.pdf (accessed on 25 June 2025).
  7. ERCOT. Market Rule 1: Standard Market Design. Available online: http://www.ercot.com/content/wcm/libraries/151823/April_11__2018_Nodal_Protocols.pdf (accessed on 25 June 2025).
  8. NYISO. Market Administration and Control Area Services Tariff. Available online: https://www.nyiso.com/public/markets_operations/documents/tariffs/index.jsp (accessed on 25 June 2025).
  9. Liu, X.; Zhao, S.; Bo, L.; Jin, Z.; Liang, H. Comparative Study on Sequential Clearing and Joint Clearing of Joint Markets under Different Load Conditions. J. N. China Electr. Power Univ. 2025, 52, 107–125. [Google Scholar] [CrossRef]
  10. Nazari, M.E.; Ardehali, M.M. Optimal Bidding Strategy for a GENCO in Day-Ahead Energy and Spinning Reserve Markets with Considerations for Coordinated Wind-Pumped Storage-Thermal System and CO2 Emission. Energy Strategy Rev. 2019, 26, 100405. [Google Scholar] [CrossRef]
  11. Igder, M.A.; Niknam, T.; Khooban, M.H. Bidding Strategies of the Joint Wind, Hydro, and Pumped-Storage in Generation Company Using Novel Improved Clonal Selection Optimisation Algorithm. IET Sci. Meas. Technol. 2017, 11, 991–1001. [Google Scholar] [CrossRef]
  12. Zhang, J.; Huang, N.; Chen, B.; Li, Y.; Zhao, M. Optimal Operation Strategy for Pumped Storage Participating in Energy Market under Electricity Market Environment. Electr. Power Constr. 2020, 41, 45–52. [Google Scholar]
  13. Liang, N.; Li, P.; Liu, Z.; Song, Q.; Luo, L. Optimal Scheduling of Island Microgrid with Seawater-Pumped Storage Station and Renewable Energy. Processes 2020, 8, 737. [Google Scholar] [CrossRef]
  14. Chen, X.; Wu, P.; He, H.; Song, B.; Qin, K.; Teng, X.; Yang, F.; Li, D. Optimal Flexibility Dispatching of Multi-Pumped Hydro Storage Stations Considering the Uncertainty of Renewable Energy. Symmetry 2024, 16, 1404. [Google Scholar] [CrossRef]
  15. Fan, H.; Wu, H.; Li, S.; Han, S.; Ren, J.; Huang, S.; Zou, H. Optimal Scheduling Method of Combined Wind–Photovoltaic–Pumped Storage System Based on Improved Bat Algorithm. Processes 2025, 13, 101. [Google Scholar] [CrossRef]
  16. Wang, K.; Li, Z.; Bie, Z.; Liu, H.; Zhang, X. Research on Electricity Price Mechanism and Market Bidding Mode for Pumped Storage Power Stations. Smart Power 2019, 47, 47–55. [Google Scholar]
  17. Qiao, H.; Zhang, Y.; Gao, M.; Song, X.; Wei, J. Thoughts on Electricity Price Mechanism of Pumped Storage in New Power Systems. Hydropower Pumped Storage 2021, 7, 24–27. [Google Scholar] [CrossRef]
  18. Feng, C.; Guo, Q.; Liu, Q.; Jian, F. An Optimized Dynamic Benefit Evaluation Method for Pumped Storage Projects in the Context of the “Dual Carbon” Goal. Energies 2025, 18, 2815. [Google Scholar] [CrossRef]
  19. Yang, H.; Zhou, M.; Zhang, M.; Li, R.; Jin, P. Operation Strategy and Benefit Analysis of Pumped Storage Power Stations in Electricity Market. J. N. China Electr. Power Univ. 2021, 48, 71–80. [Google Scholar] [CrossRef]
  20. Li, Y.; Fan, Y.; Ke, X.; Huo, C.; Zhou, M.; Yang, Y.; Wang, J.; Xin, Y. Cost Recovery for Variable-Speed Pumped Storage Power Plants in the Market Environment. Energies 2025, 18, 153. [Google Scholar] [CrossRef]
  21. Ma, L.; Zhai, H.; Yang, W.; Chen, C.; Hu, Y. Analysis of Electricity Revenue and Comprehensive Benefits of Pumped Storage Power Stations in Spot Market. Water Resour. Hydropower Eng. 2023, 54 (Suppl. S1), 283–289. [Google Scholar] [CrossRef]
  22. Liu, F.; Che, Y.; Tian, X.; He, J.; Wu, D. Cost Transmission Mechanism of Pumped Storage Power Stations in New Power Systems: A Review and Prospects. J. Shanghai Jiao Tong Univ. 2023, 57, 757–768. [Google Scholar] [CrossRef]
  23. Xiao, Y.; Zhang, L.; Zhang, X.; Sun, W.; Luo, J. Coordinated Clearing Mechanism for Spot Energy and Frequency Regulation Ancillary Service Markets Incorporating Independent Energy Storage. Proc. CSEE 2020, 40 (Suppl. S1), 167–180. [Google Scholar] [CrossRef]
  24. Li, Y.; Zhang, L.; Cong, Y.; Chen, H.; Zhang, F. Designing a Clearing Model for the Regional Electricity Spot Market Based on the Construction of the Provincial Electricity Market: A Case Study of the Yangtze River Delta Regional Electricity Market in China. Processes 2025, 13, 492. [Google Scholar] [CrossRef]
  25. Lu, Q.; Chen, L.; Mei, S. Typical Applications of Game Theory in Power Systems and Some Prospects. Proc. CSEE 2014, 34, 5009–5017. [Google Scholar] [CrossRef]
  26. Zhang, H.; Zhang, S.; Cheng, H.; Li, K.; Wang, L. Application Research Review of Stackelberg Game in Electricity Markets. Trans. China Electrotech. Soc. 2022, 37, 3250–3262. [Google Scholar] [CrossRef]
  27. Zhang, H.; Xu, Y.; Yi, Z.; Tu, Z.; Rong, S.; Zhao, G. Coordinated Operation Strategy of Energy Storages with Reactive Power Compensators in Joint Active and Reactive Power Market Environment. Processes 2025, 13, 16. [Google Scholar] [CrossRef]
Figure 1. Game model architecture of pumping storage power station participating in joint market bidding.
Processes 13 02472 g001
Figure 2. Solution process of the bidding–clearing model.
Processes 13 02472 g002
Figure 3. Wiring diagram of the IEEE-30 bus system. Numbers 1–30 indicate bus indices. Black circles represent load buses, while white circles labeled ‘G’ and ‘PS’ denote generator units and pumped storage units, respectively. Arrows indicate the direction of power flow.
Processes 13 02472 g003
Figure 4. Awarded output of generating units in the main energy market.
Processes 13 02472 g004
Figure 5. Electricity market clearing price.
Processes 13 02472 g005
Figure 6. Bidding results of frequency modulation capacity.
Processes 13 02472 g006
Figure 7. Bidding results of frequency modulation mileage.
Processes 13 02472 g007
Figure 8. Clearing price in the frequency regulation market.
Processes 13 02472 g008
Figure 9. Bidding outcomes of PS1 in the integrated market.
Processes 13 02472 g009
Figure 10. Bidding outcomes of PS2 in the integrated market.
Processes 13 02472 g010
Table 1. Operating parameters of conventional units.
UnitRated Power (MW)Energy Bid (CNY/MW)Regulation Capacity Bid (CNY/MW)Regulation Mileage Bid (CNY/MW)Mileage-to-Capacity Ratio
G115019114127
G2110183121512
G36020116157
G48019014189
G54023015148
G640192121612
Table 2. Revenue analysis of power generators in spot markets.
Market ParticipantEnergy Market Revenue (CNY)Regulation Capacity Revenue (CNY)Regulation Mileage Revenue (CNY)
Thermal Units G1–G61,302,629.621578.02763.88
Pumped Storage PS1−4589.00565.358211.70
Pumped Storage PS272.432456.1434,247.64
Table 3. Revenue analysis of pumped storage under various market schemes.
Market ParticipationRevenue/Cost (CNY)Two-Part Tariff SchemeRevenue/Cost (CNY)
Daily Energy Market Revenue44,535.50Energy Charge24,657.53
Daily Regulation Capacity Revenue3021.49Capacity Charge12,328.76
Daily Regulation Mileage Revenue42,459.34--
Daily Power Purchase Cost–49,052.07--
Daily Net Profit40,964.26Daily Net Profit36,986.30
Disclaimer/Publisher’s Note: The statements, opinions and data contained in all publications are solely those of the individual author(s) and contributor(s) and not of MDPI and/or the editor(s). MDPI and/or the editor(s) disclaim responsibility for any injury to people or property resulting from any ideas, methods, instructions or products referred to in the content.