
Optimizing Multi-Cluster Fracture Propagation and Mitigating Interference Through Advanced Non-Uniform Perforation Design in Shale Gas Horizontal Wells


 ,
,
Abstract
1. Introduction
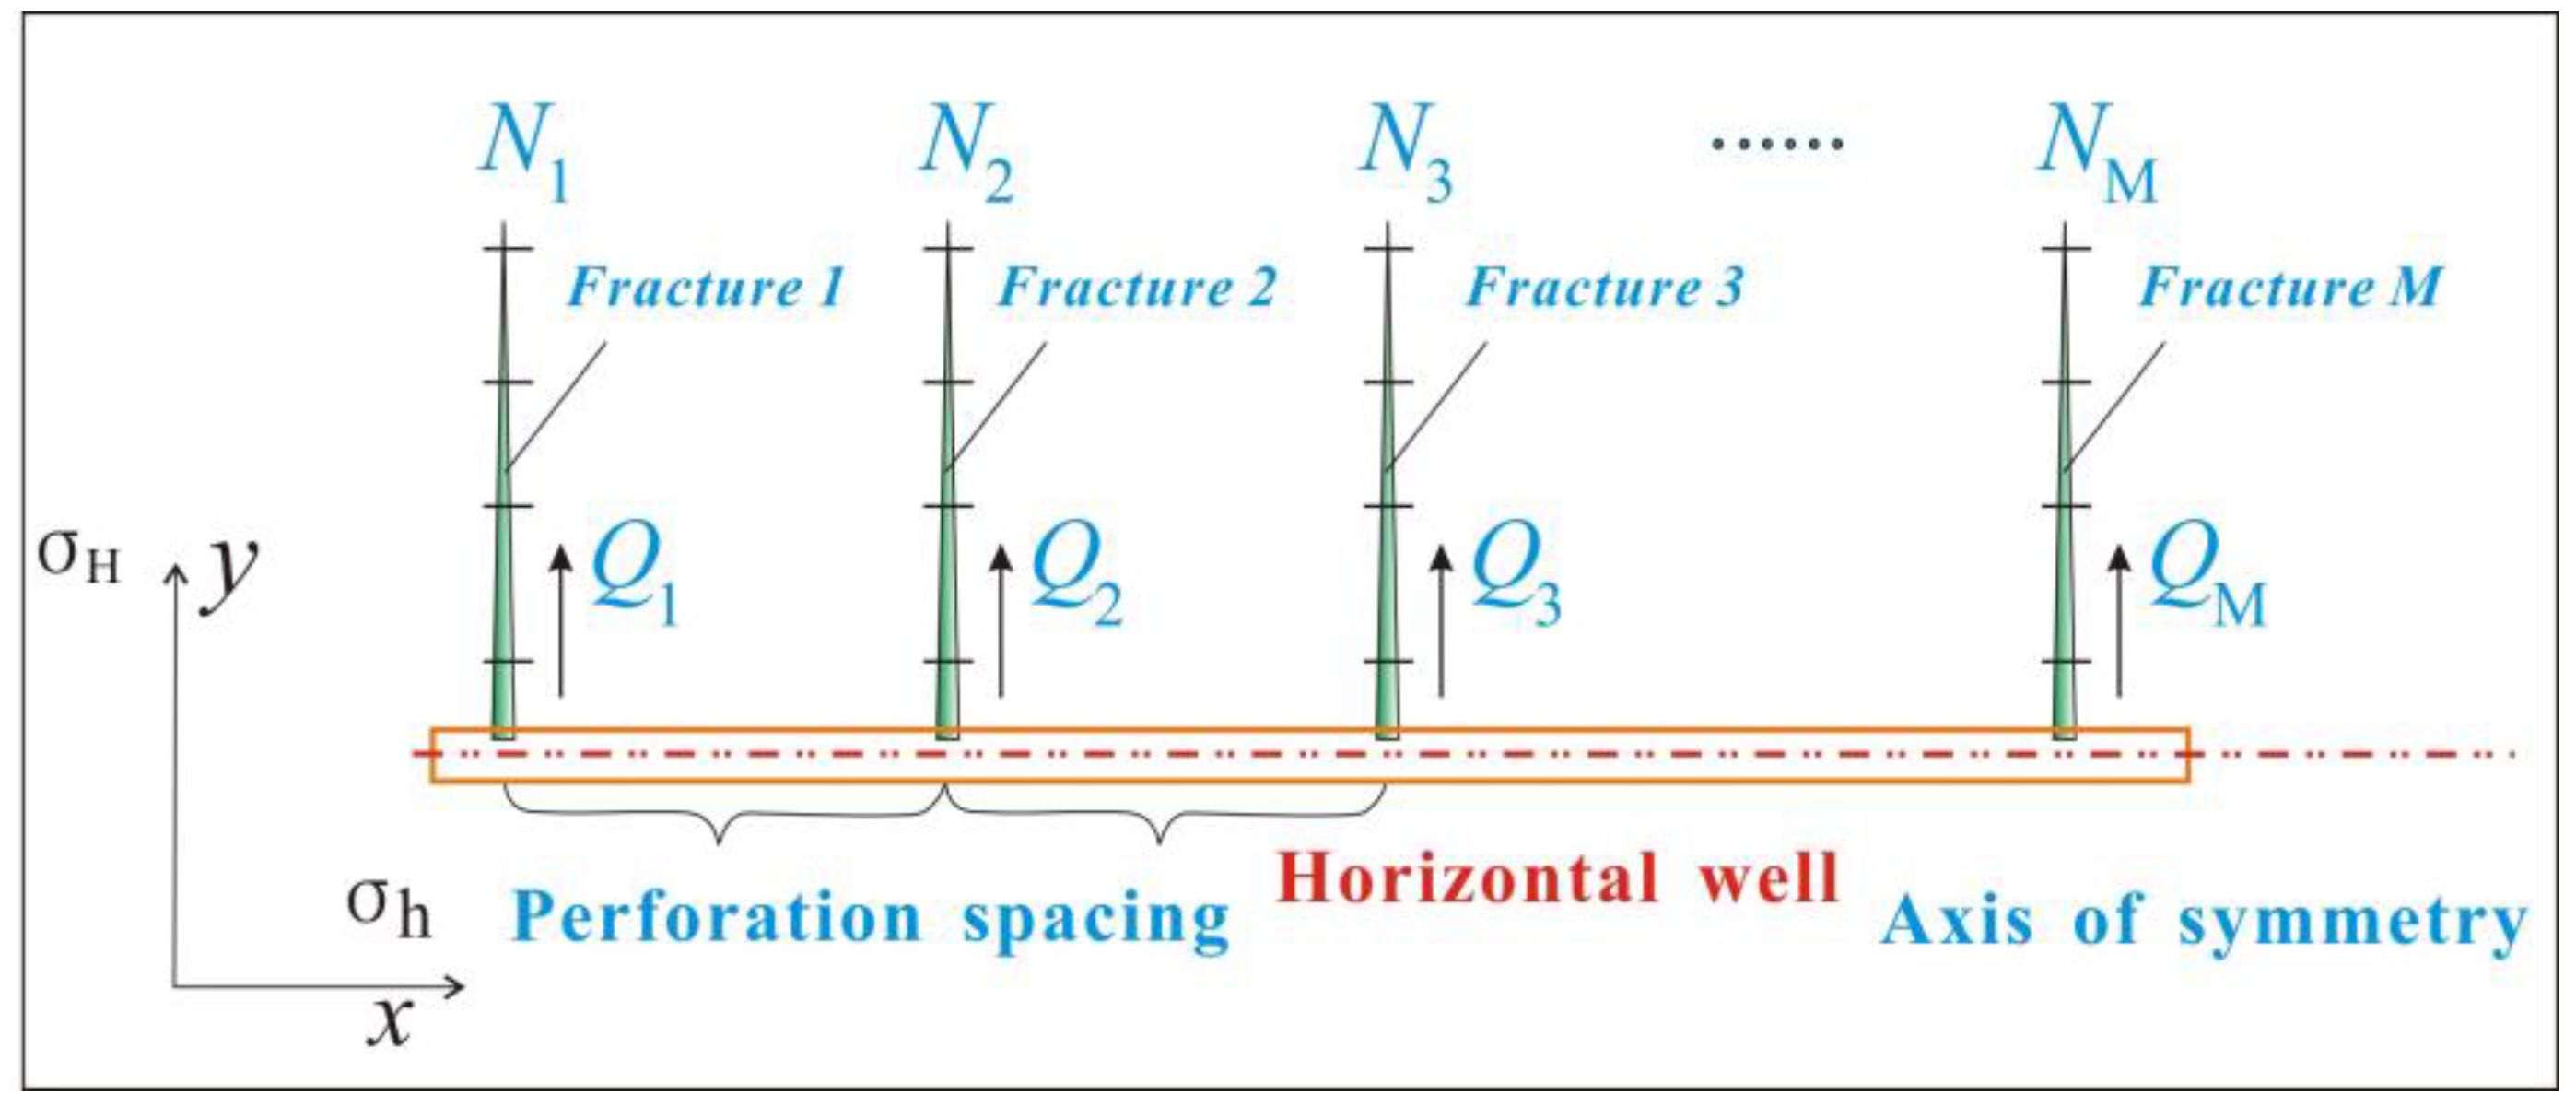
2. The Model for the Simultaneous Propagation of Multiple Fractures
2.1. The Model of the Fracturing Fluid Flow
2.2. The Stress Model of the Hydraulic Fracture
2.3. The Model of Fracture Initiation Propagation
2.4. Constitutive Model Calculation
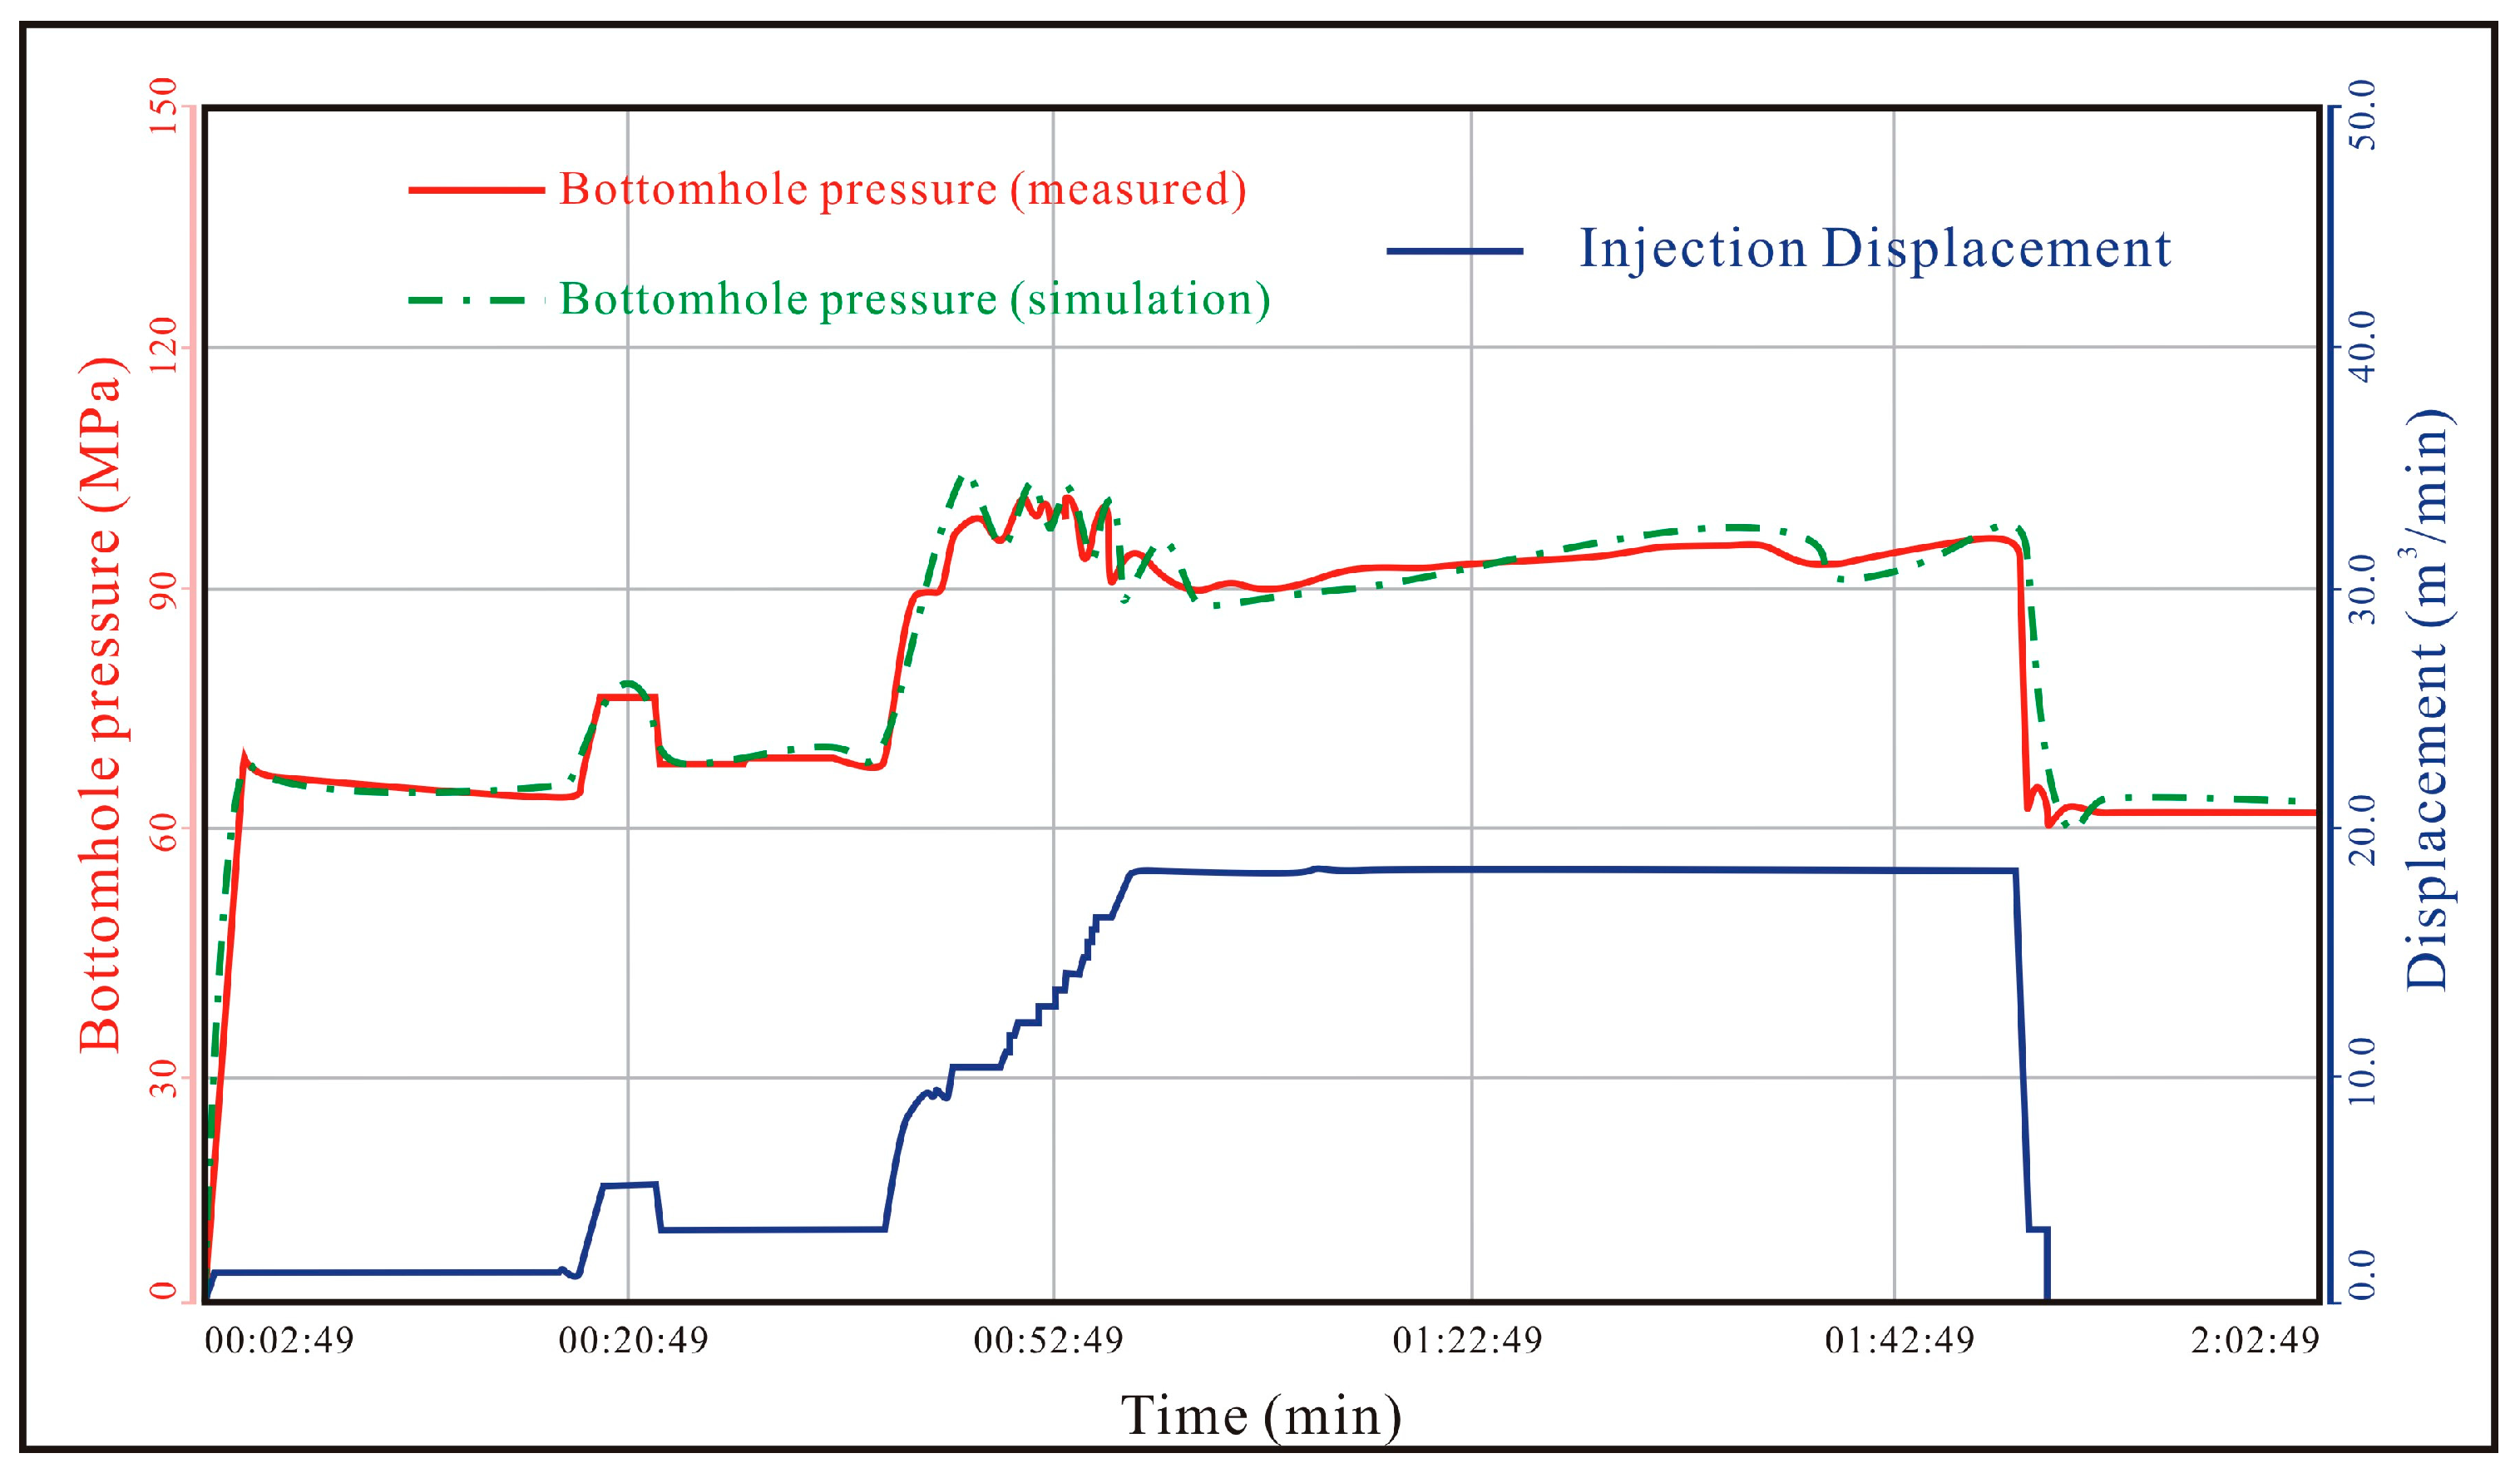
2.5. Model Verification
3. Reservoir Simulations
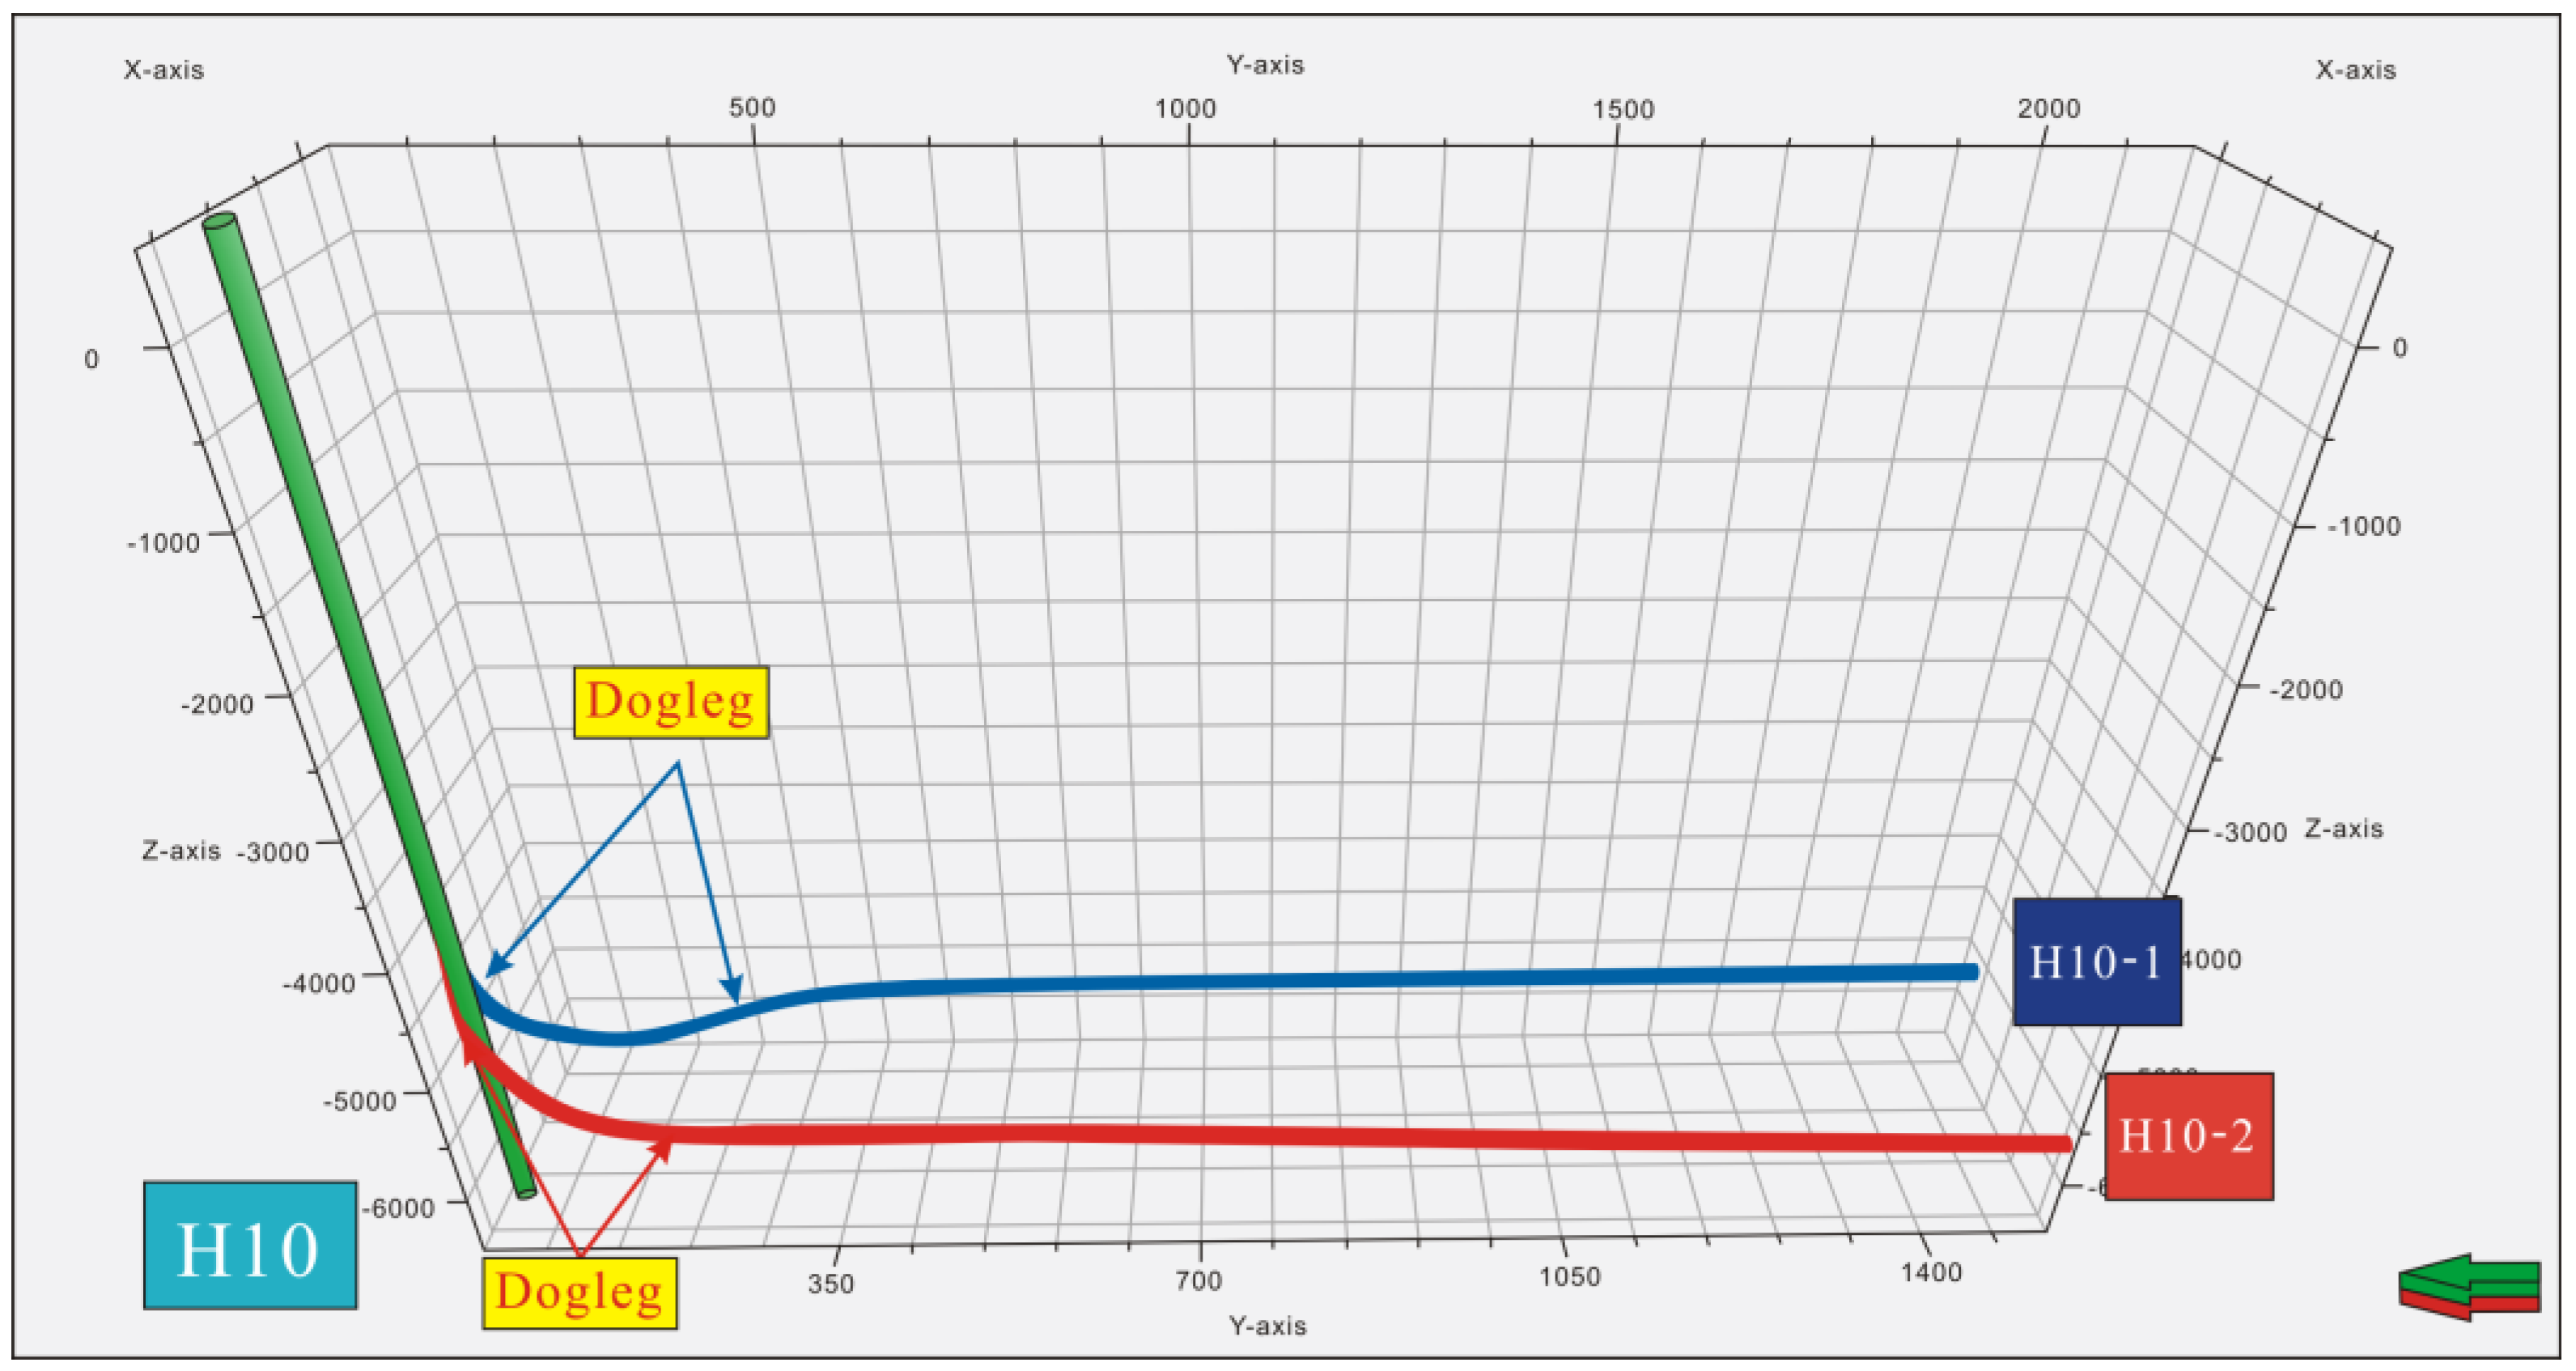
3.1. DFN Construction
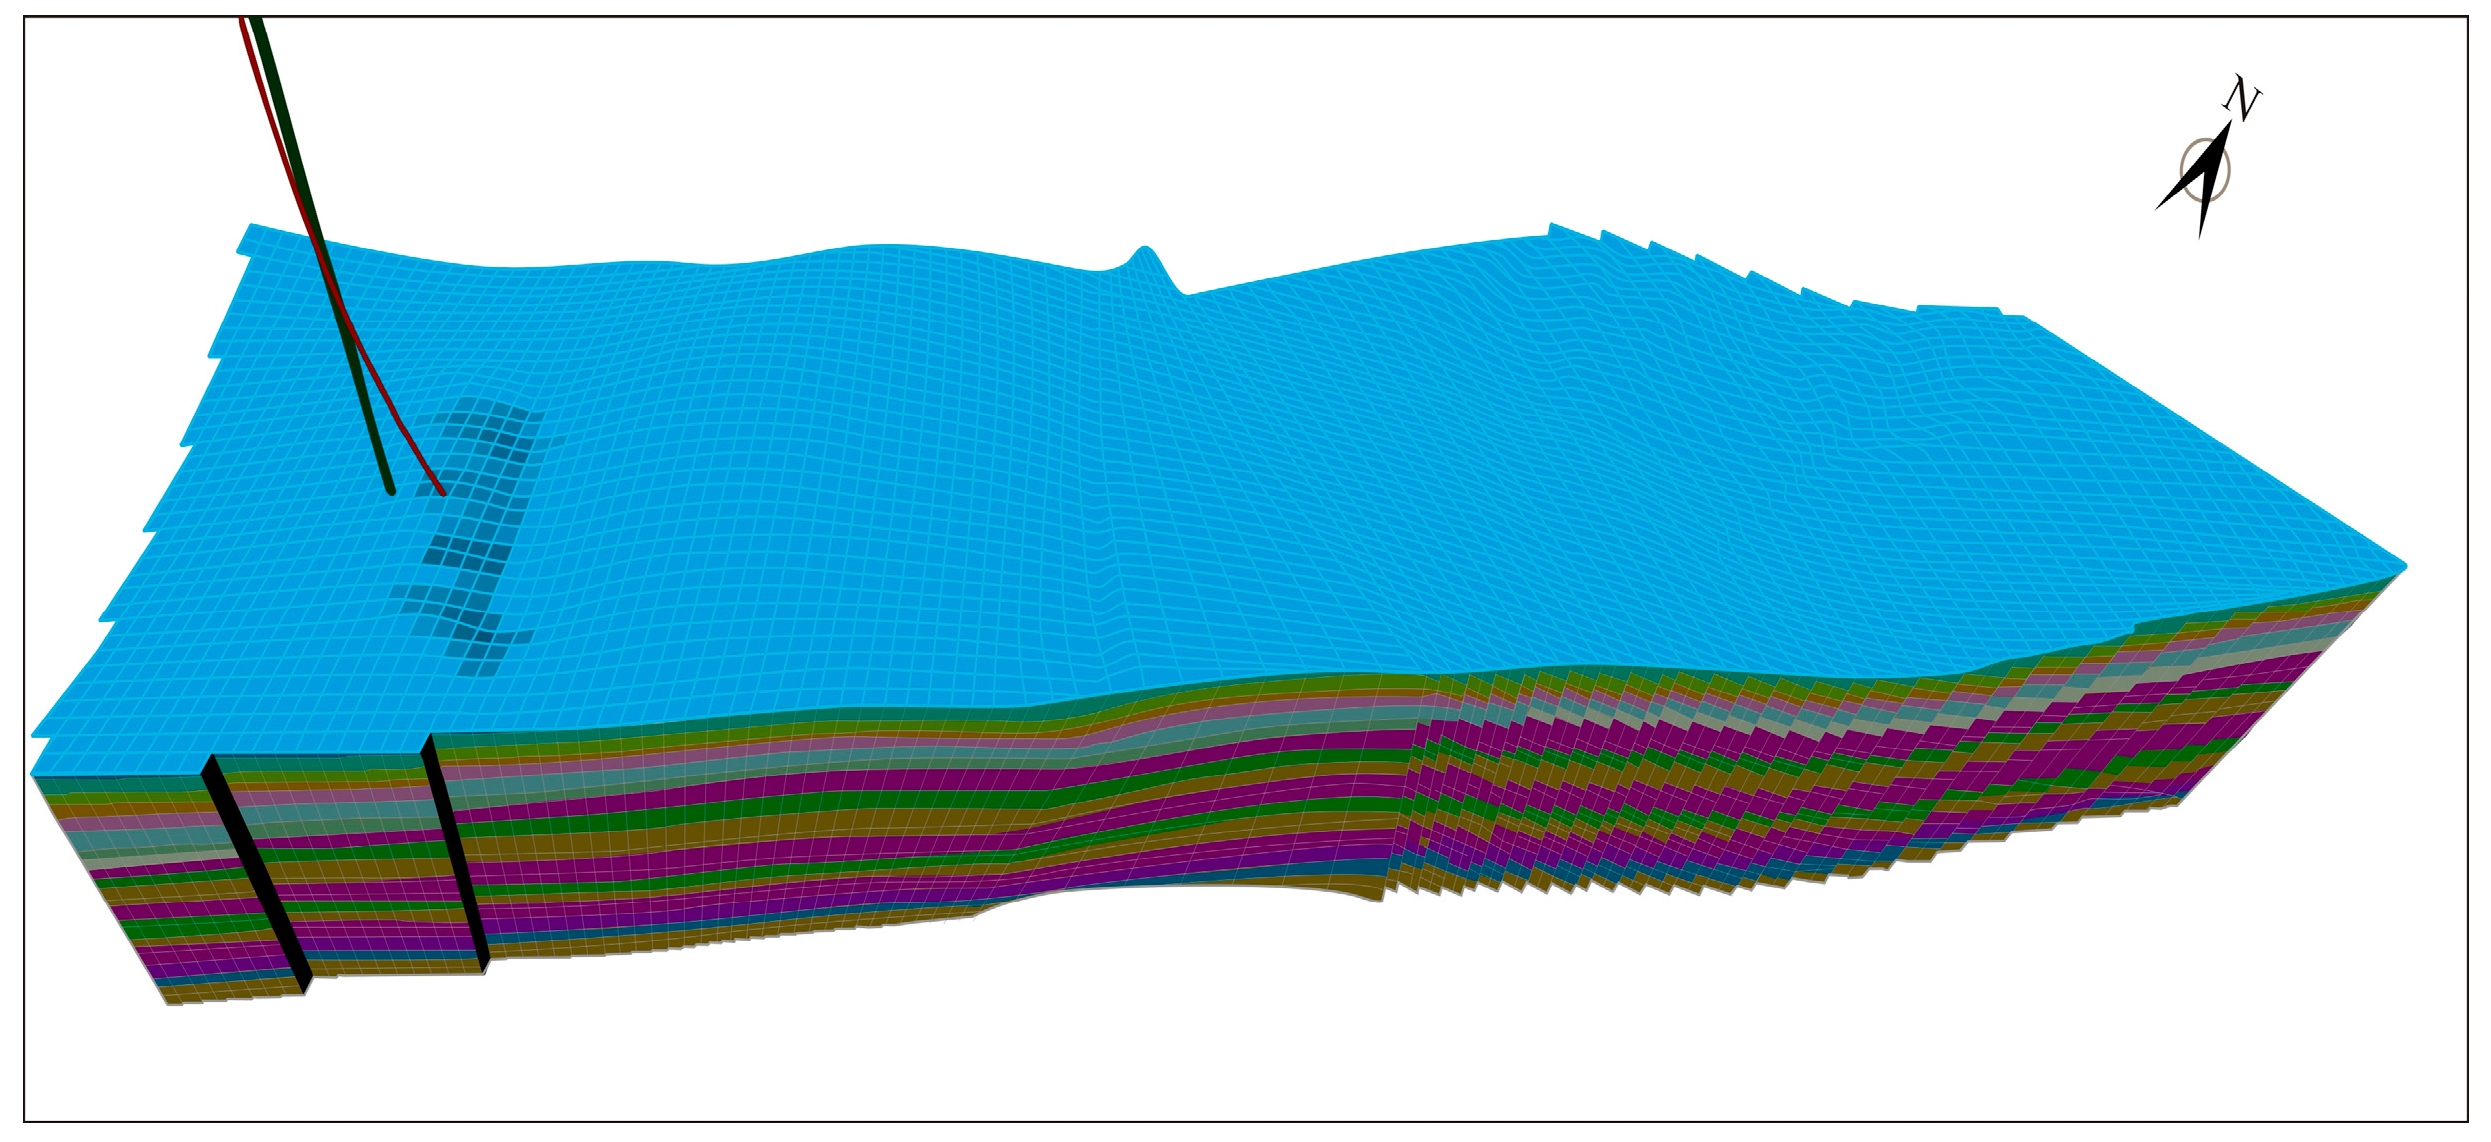
3.2. The Reservoir Model
3.3. Boundary Conditions and Parameters
4. Results and Analyses
4.1. The Competitive Propagation of Multi-Clusters Under Non-Uniform Perforations
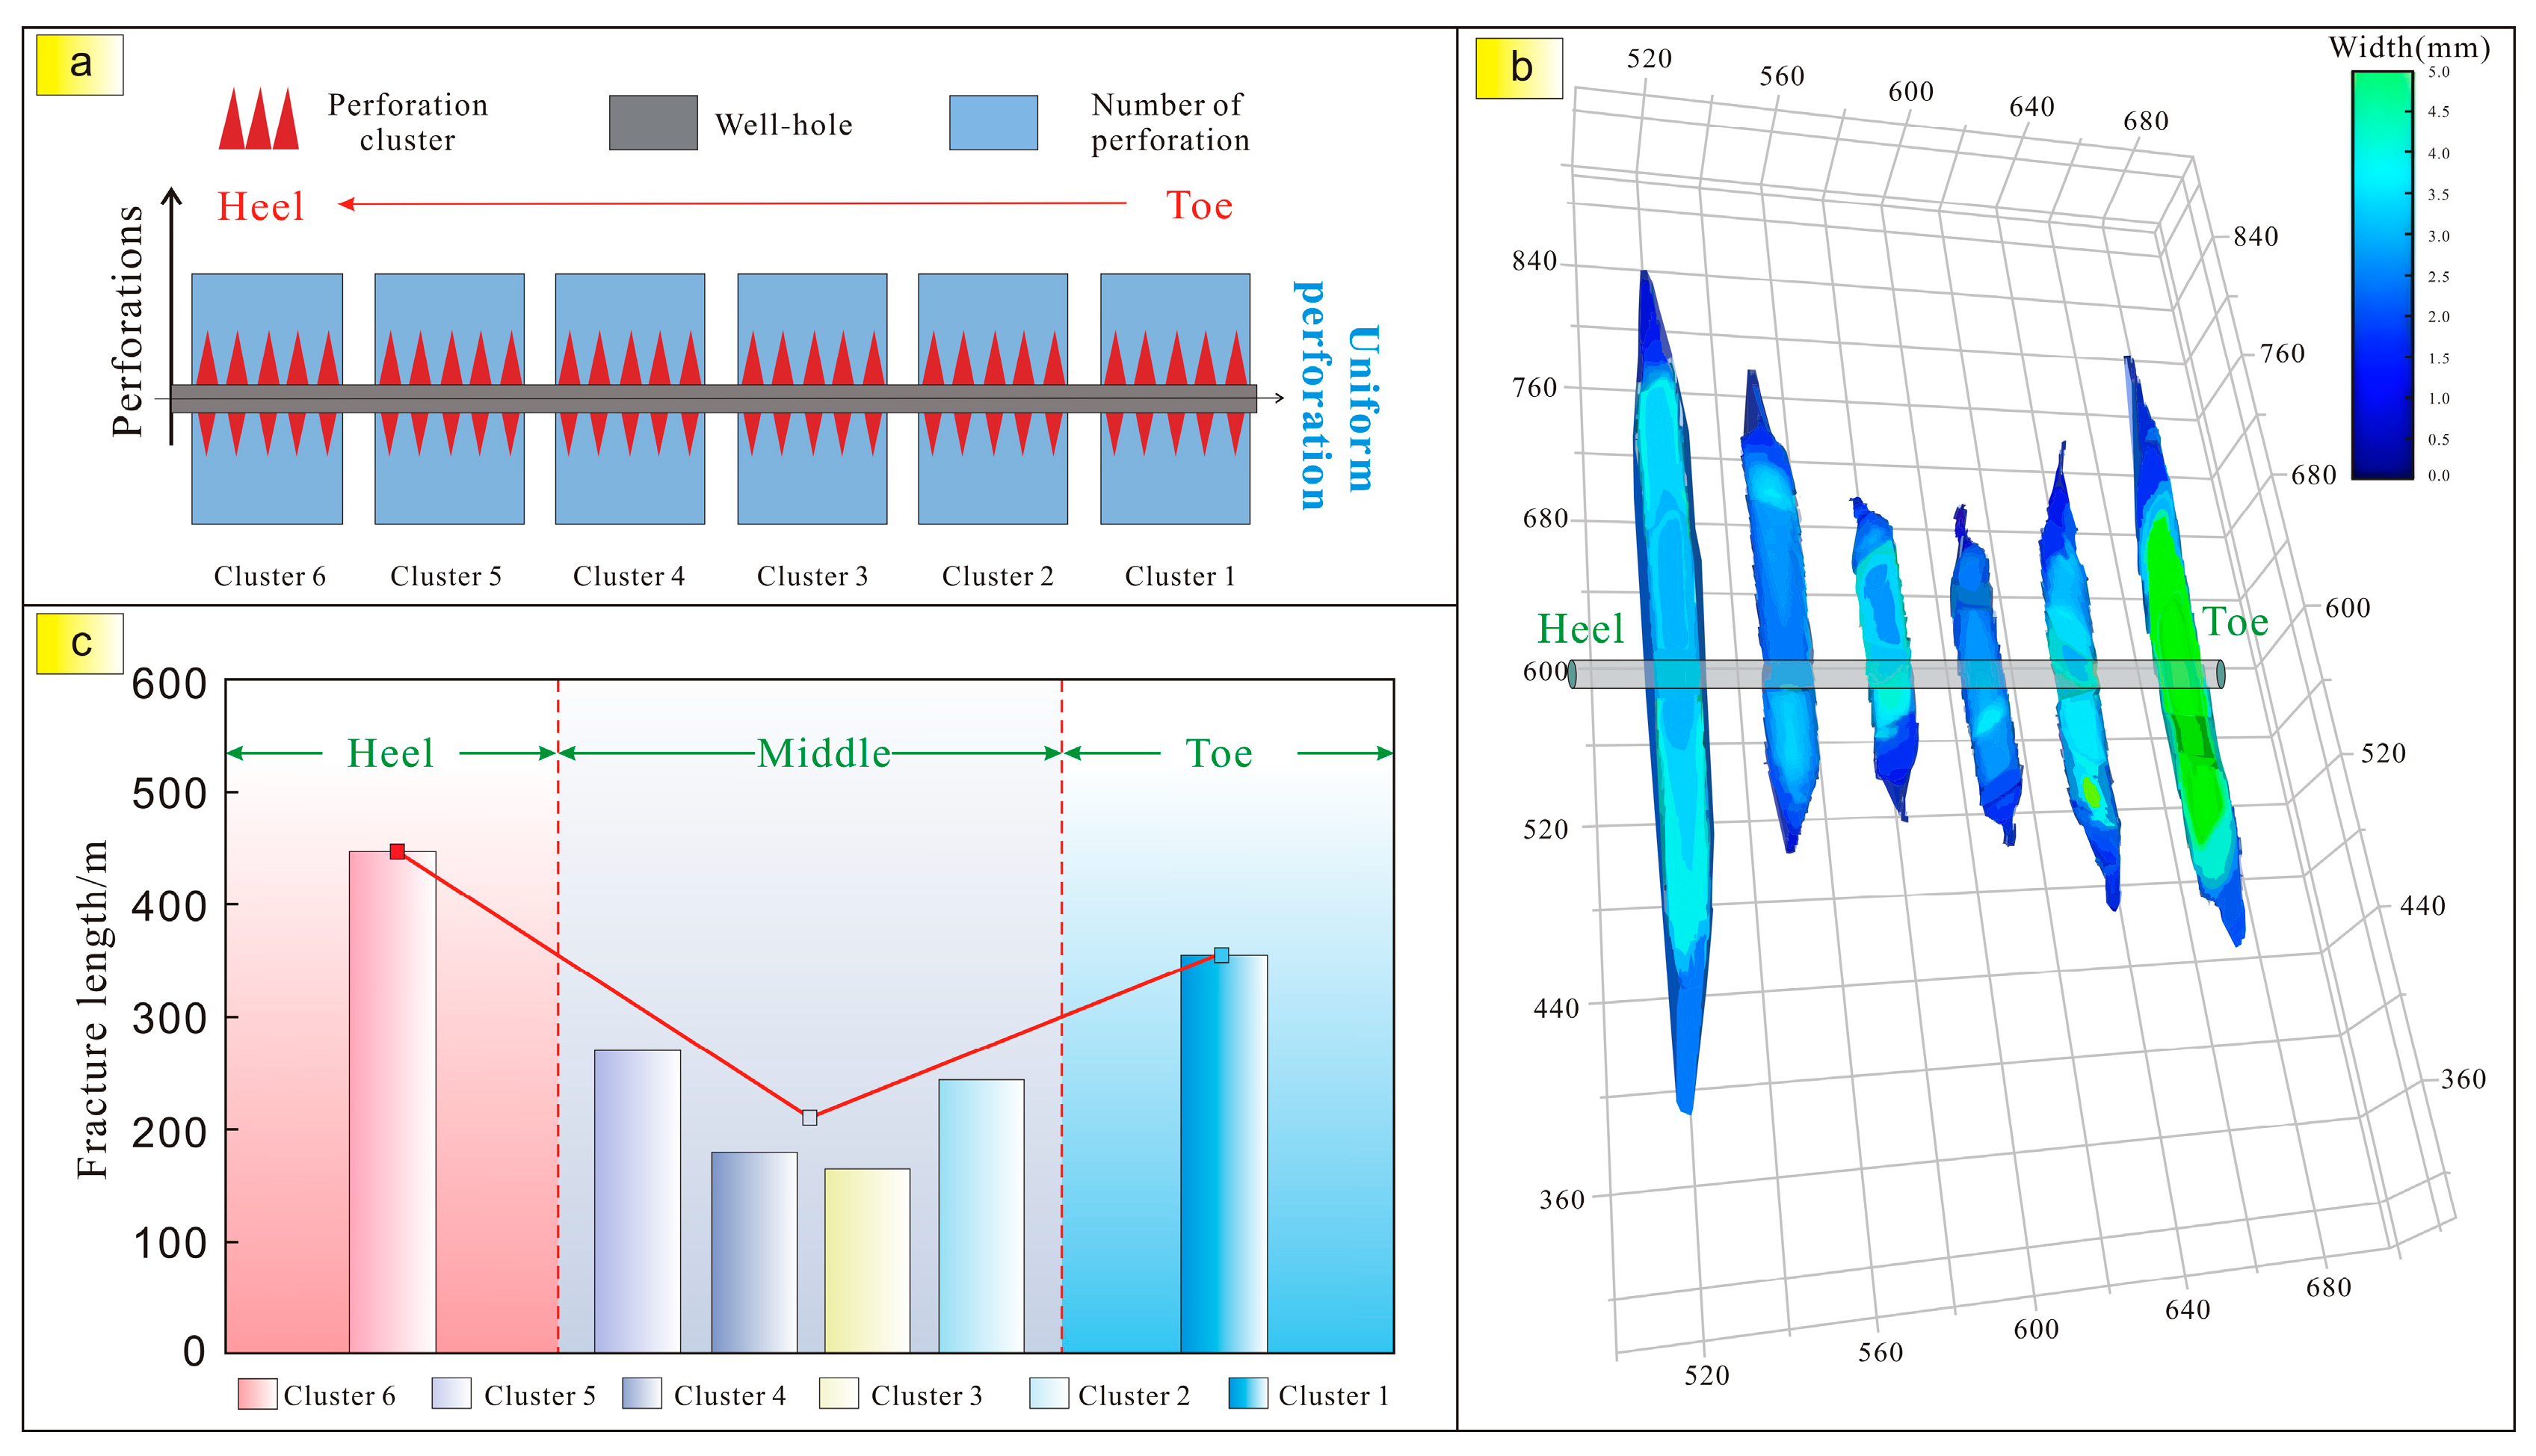
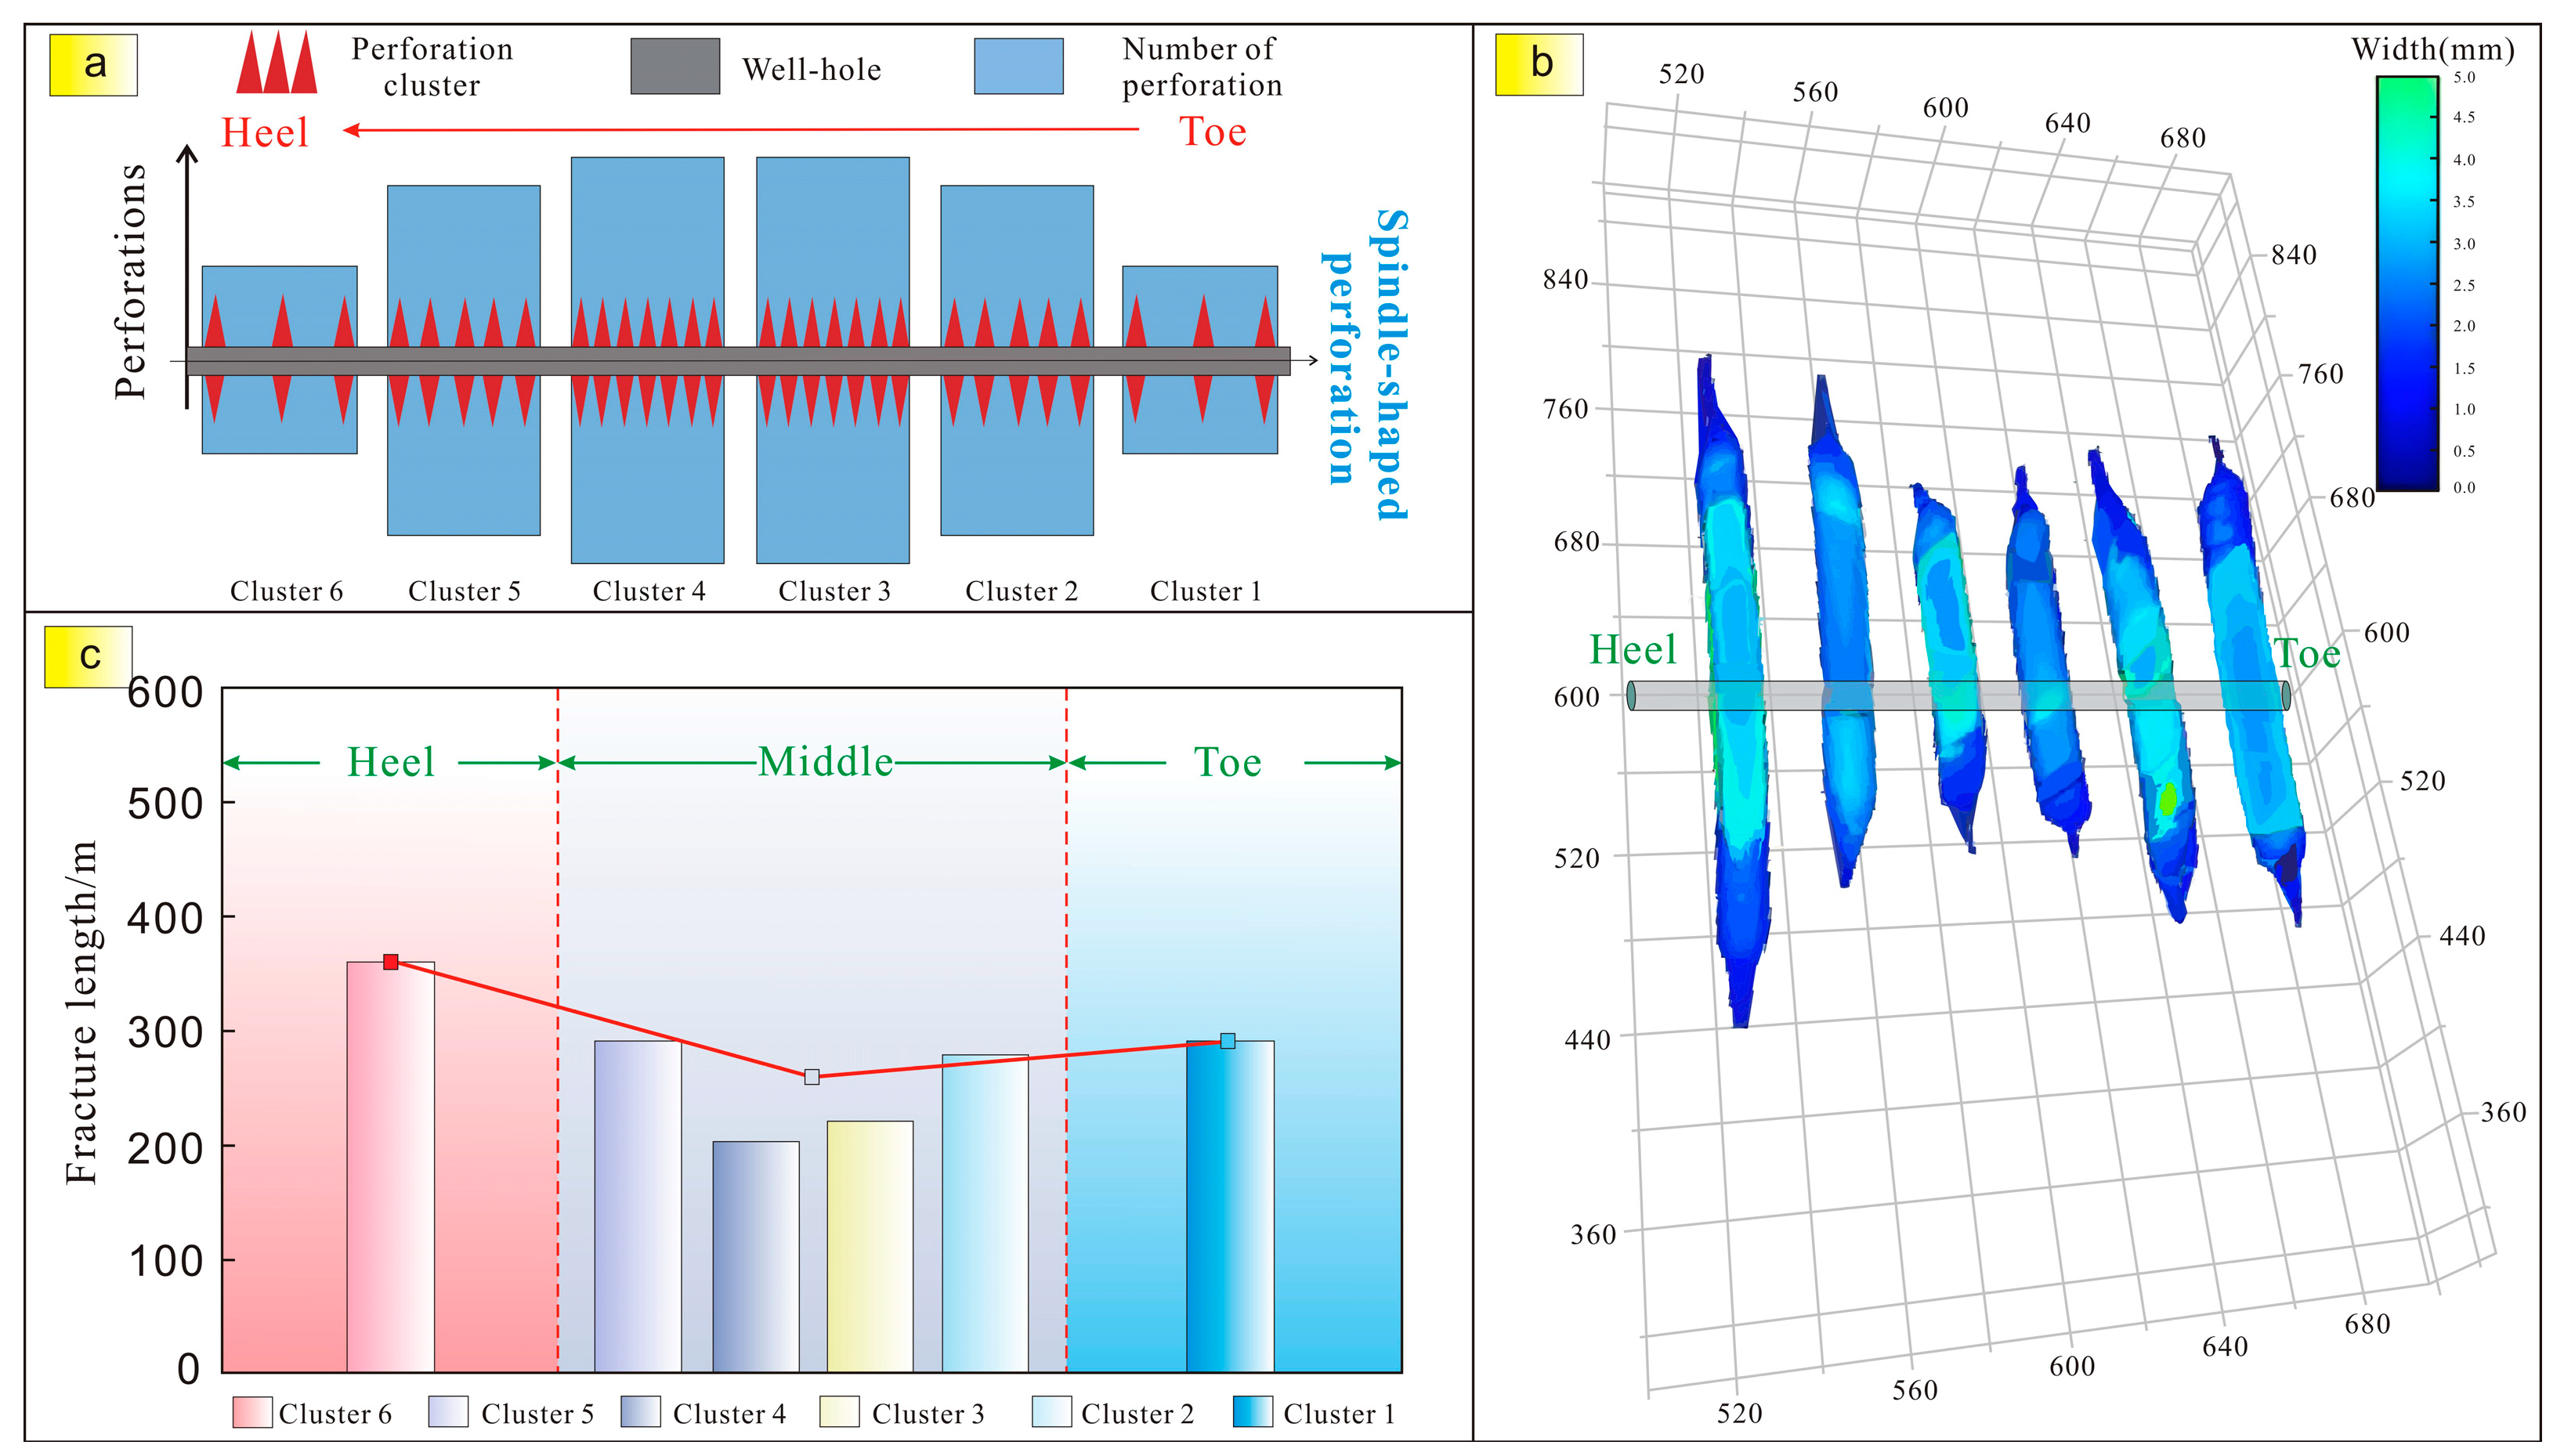
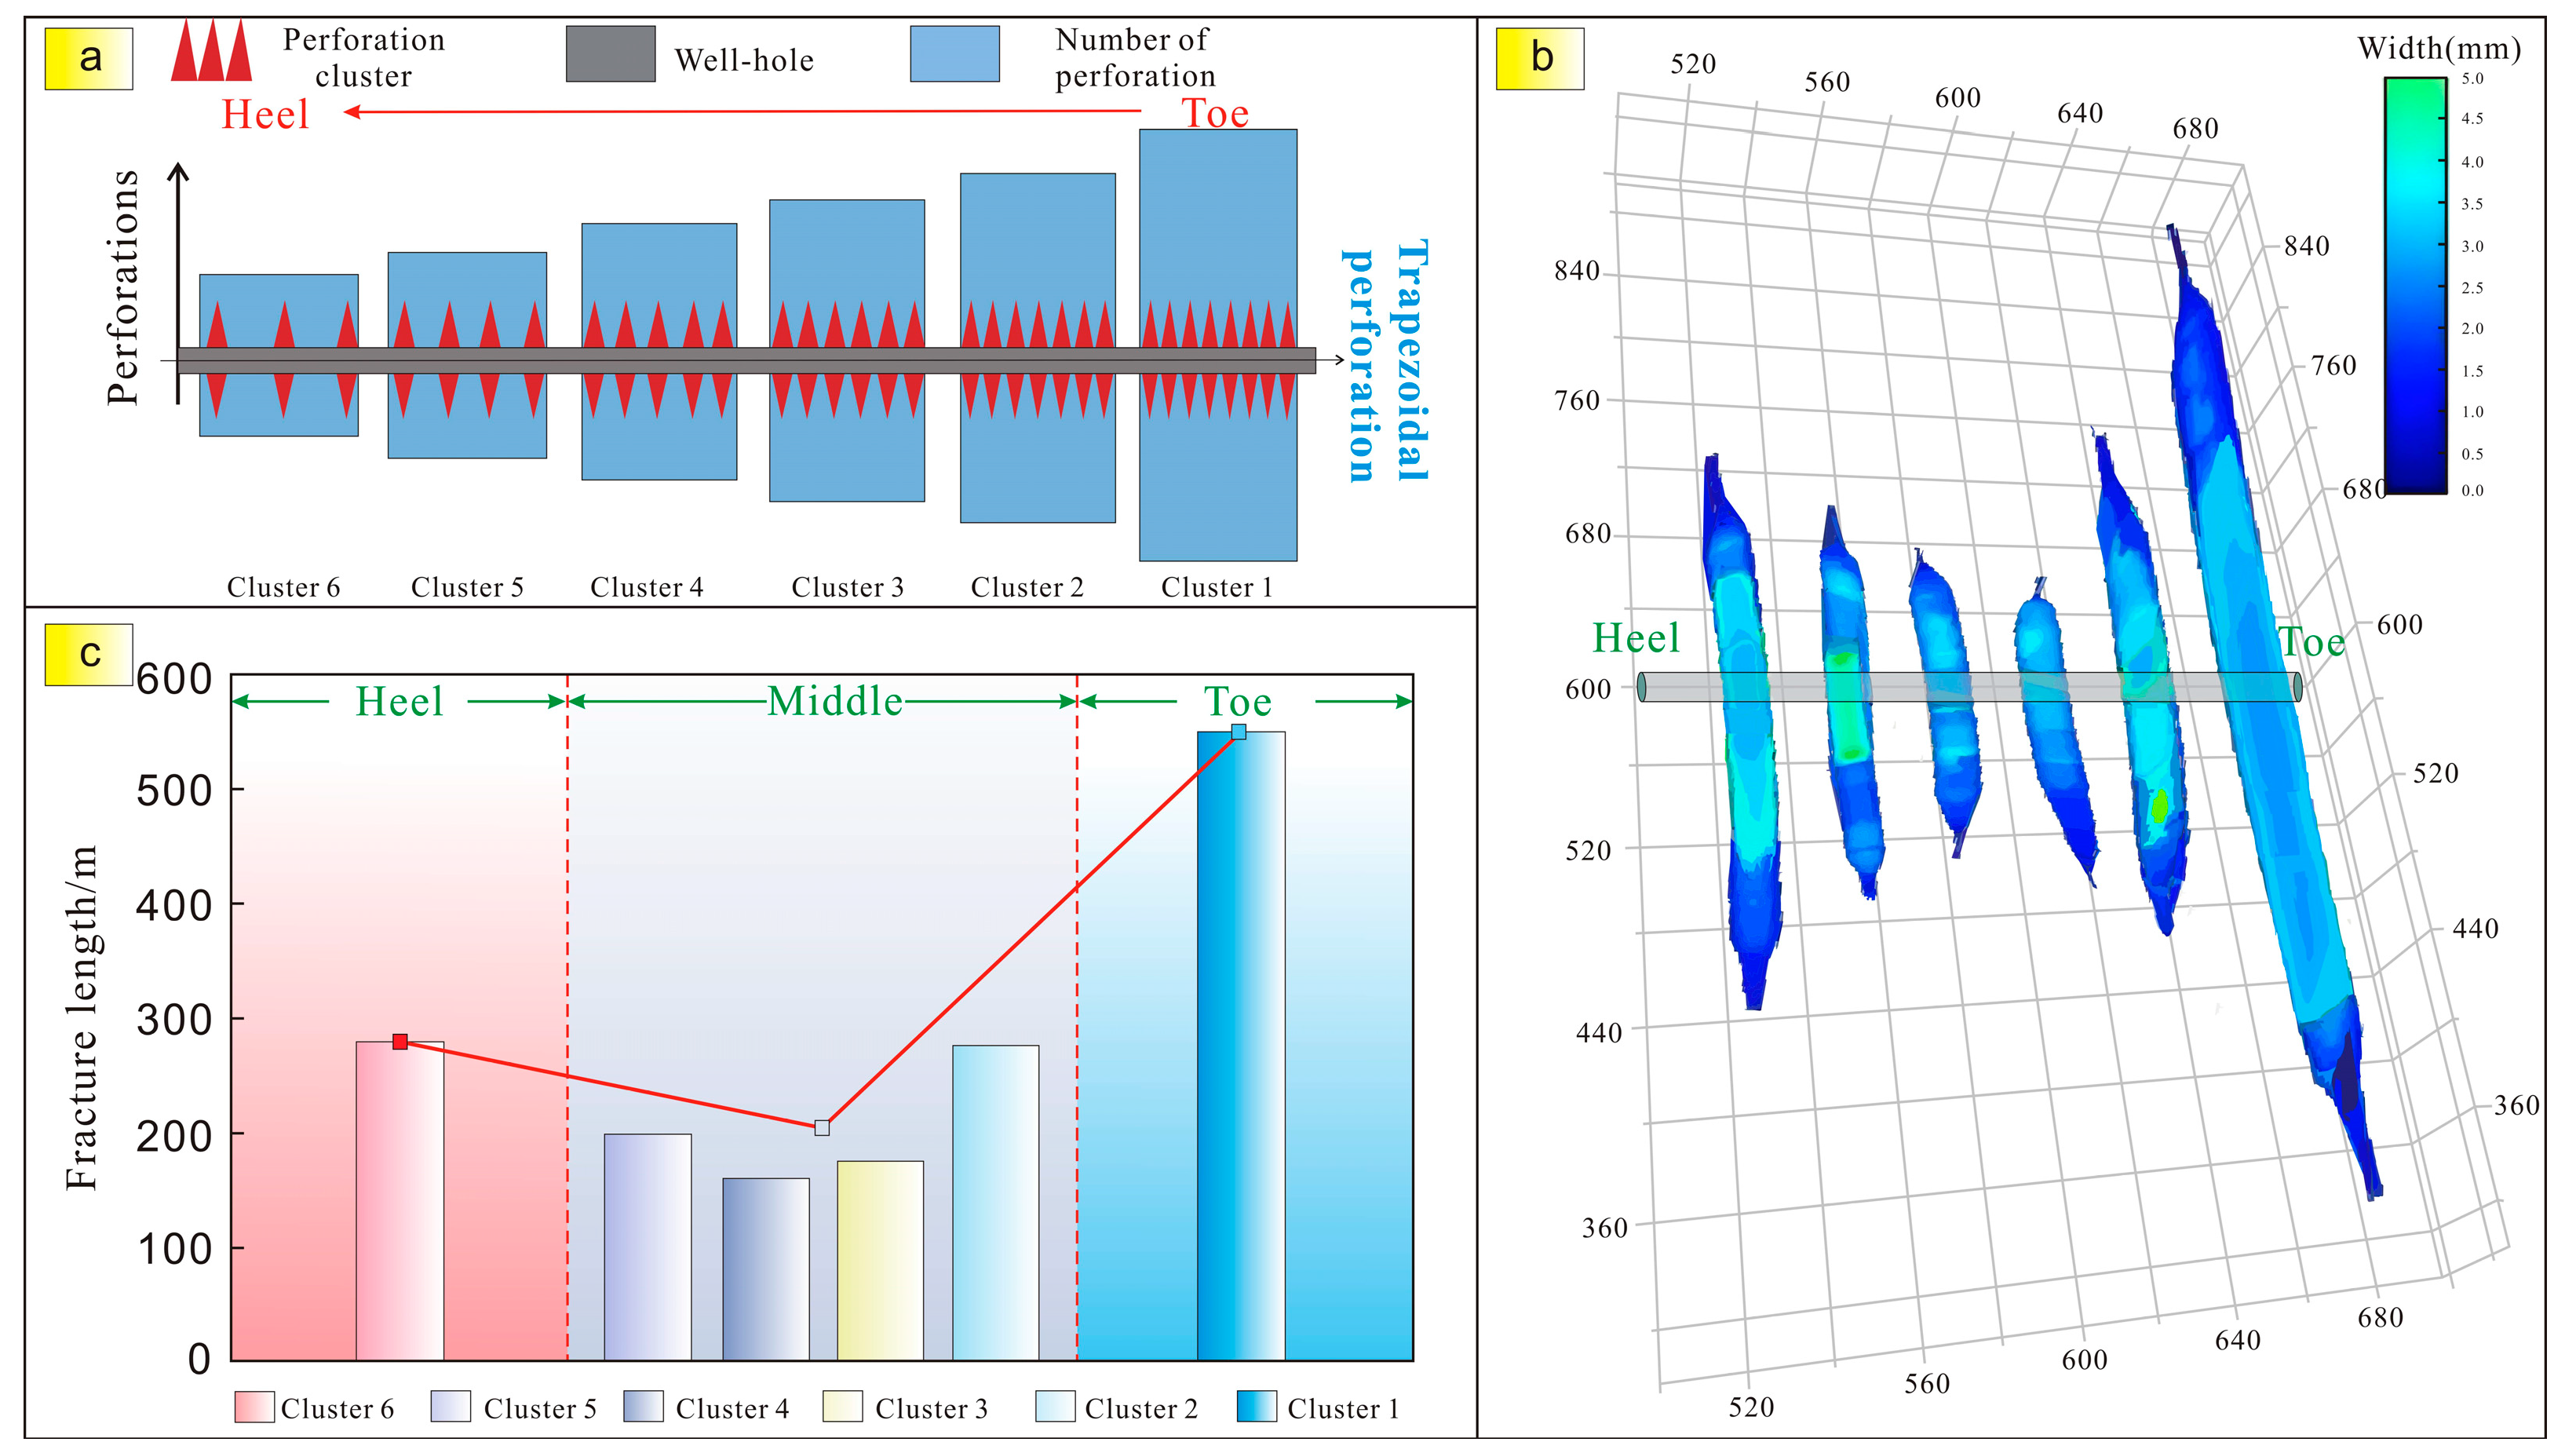
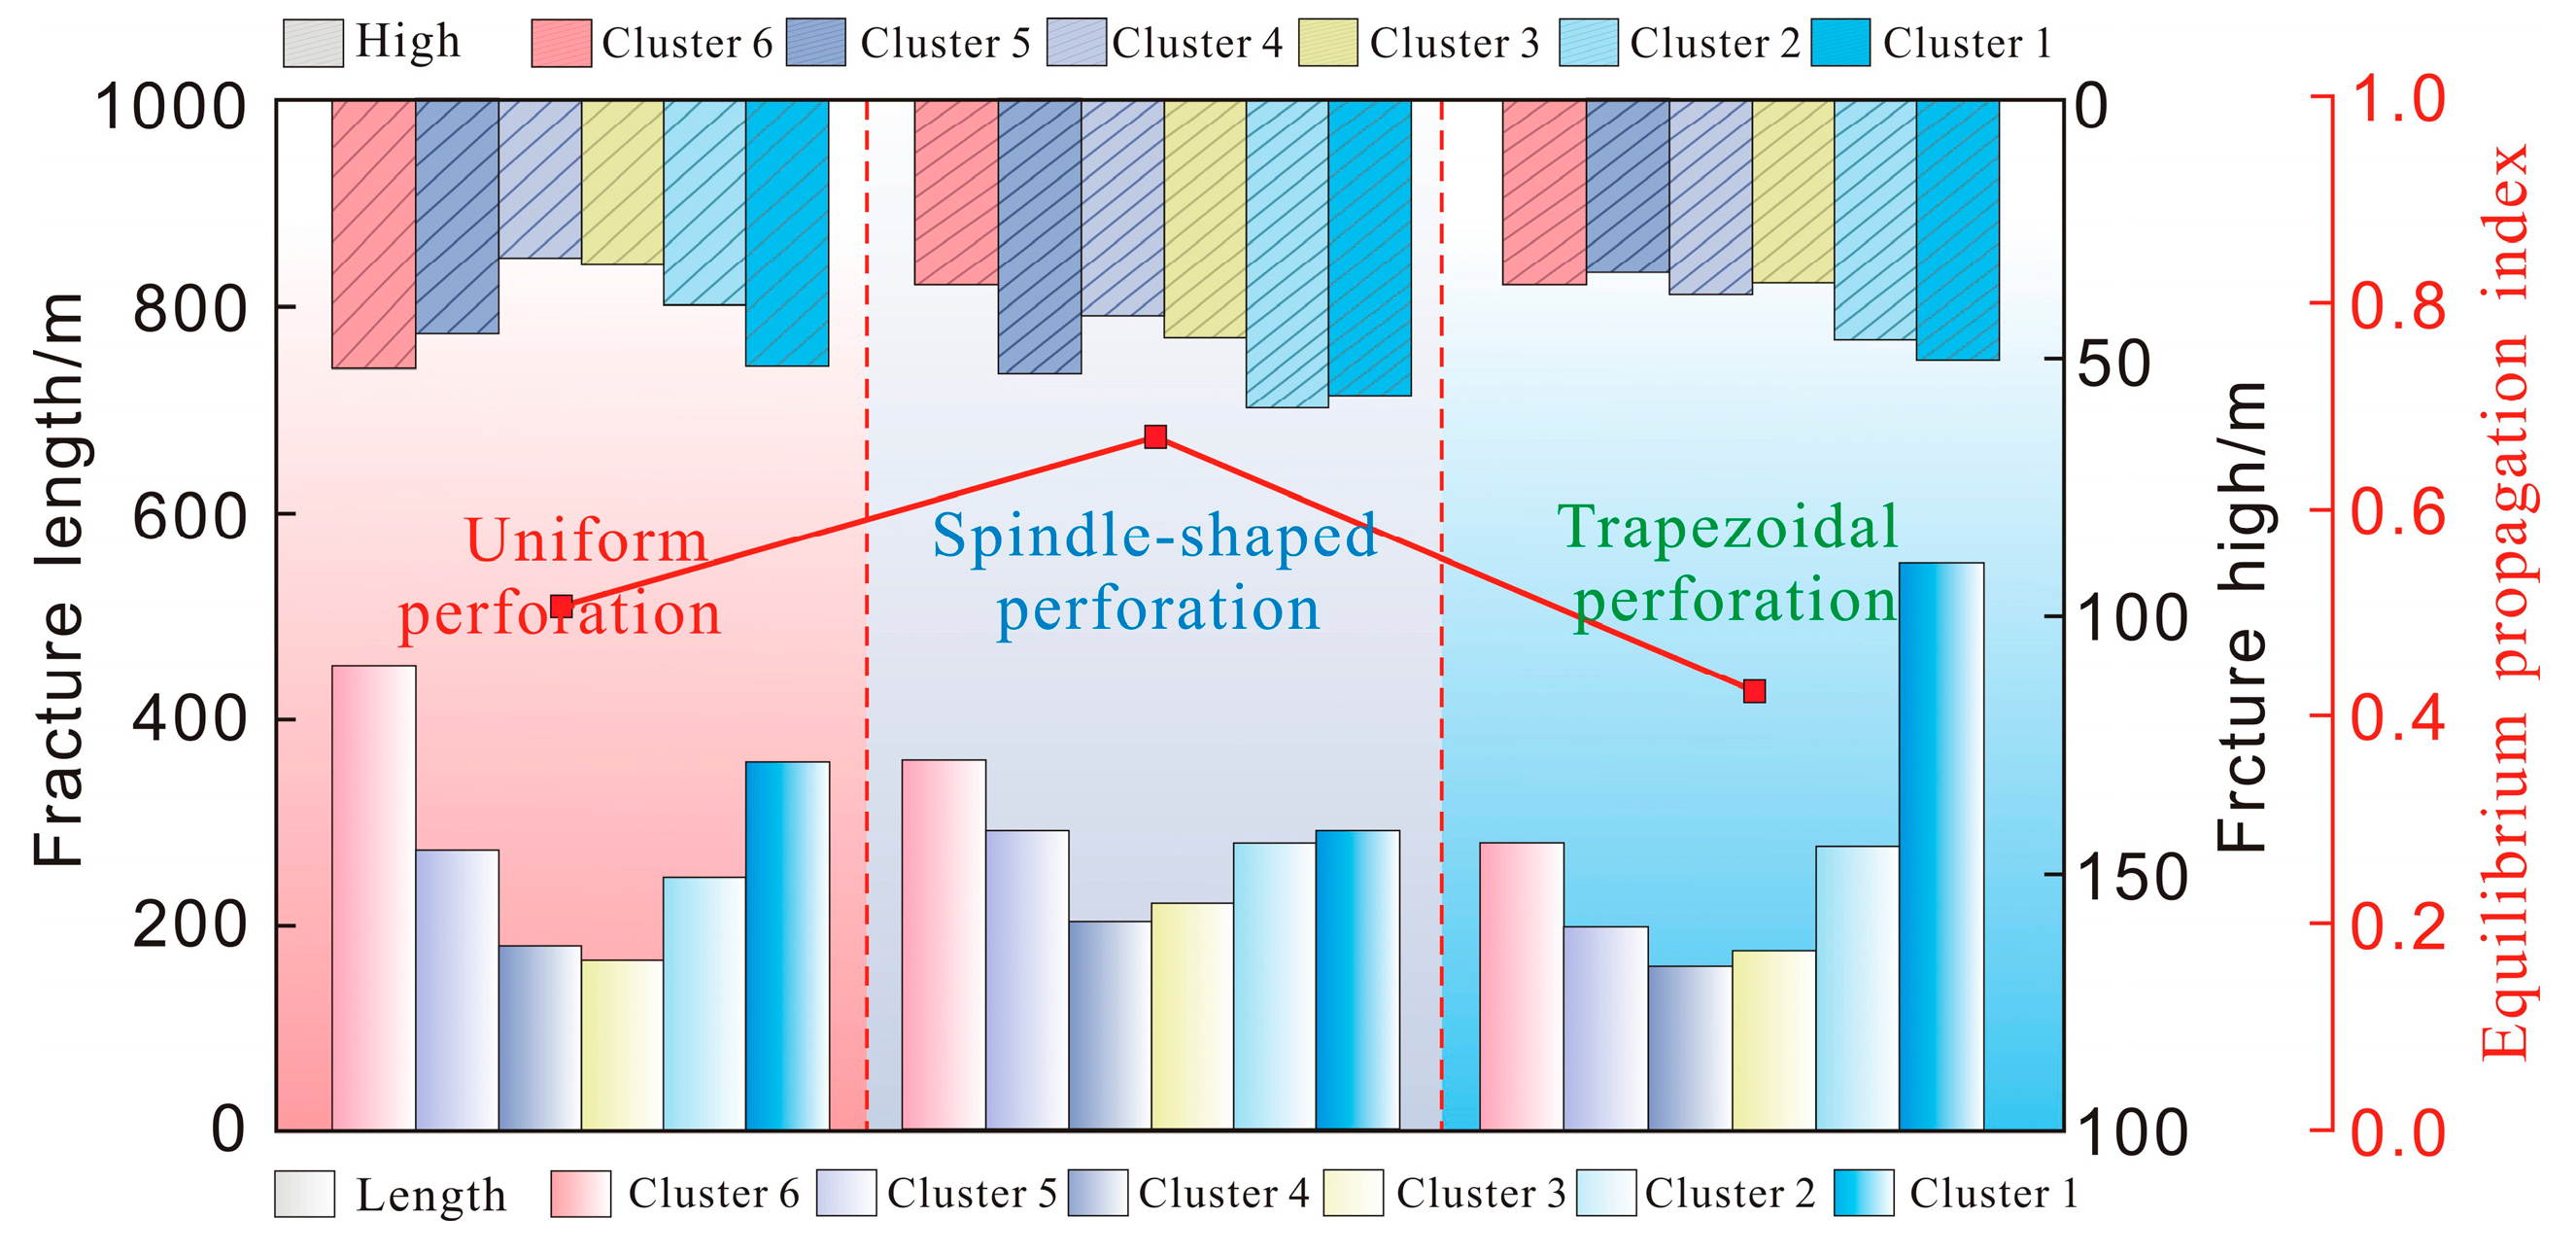
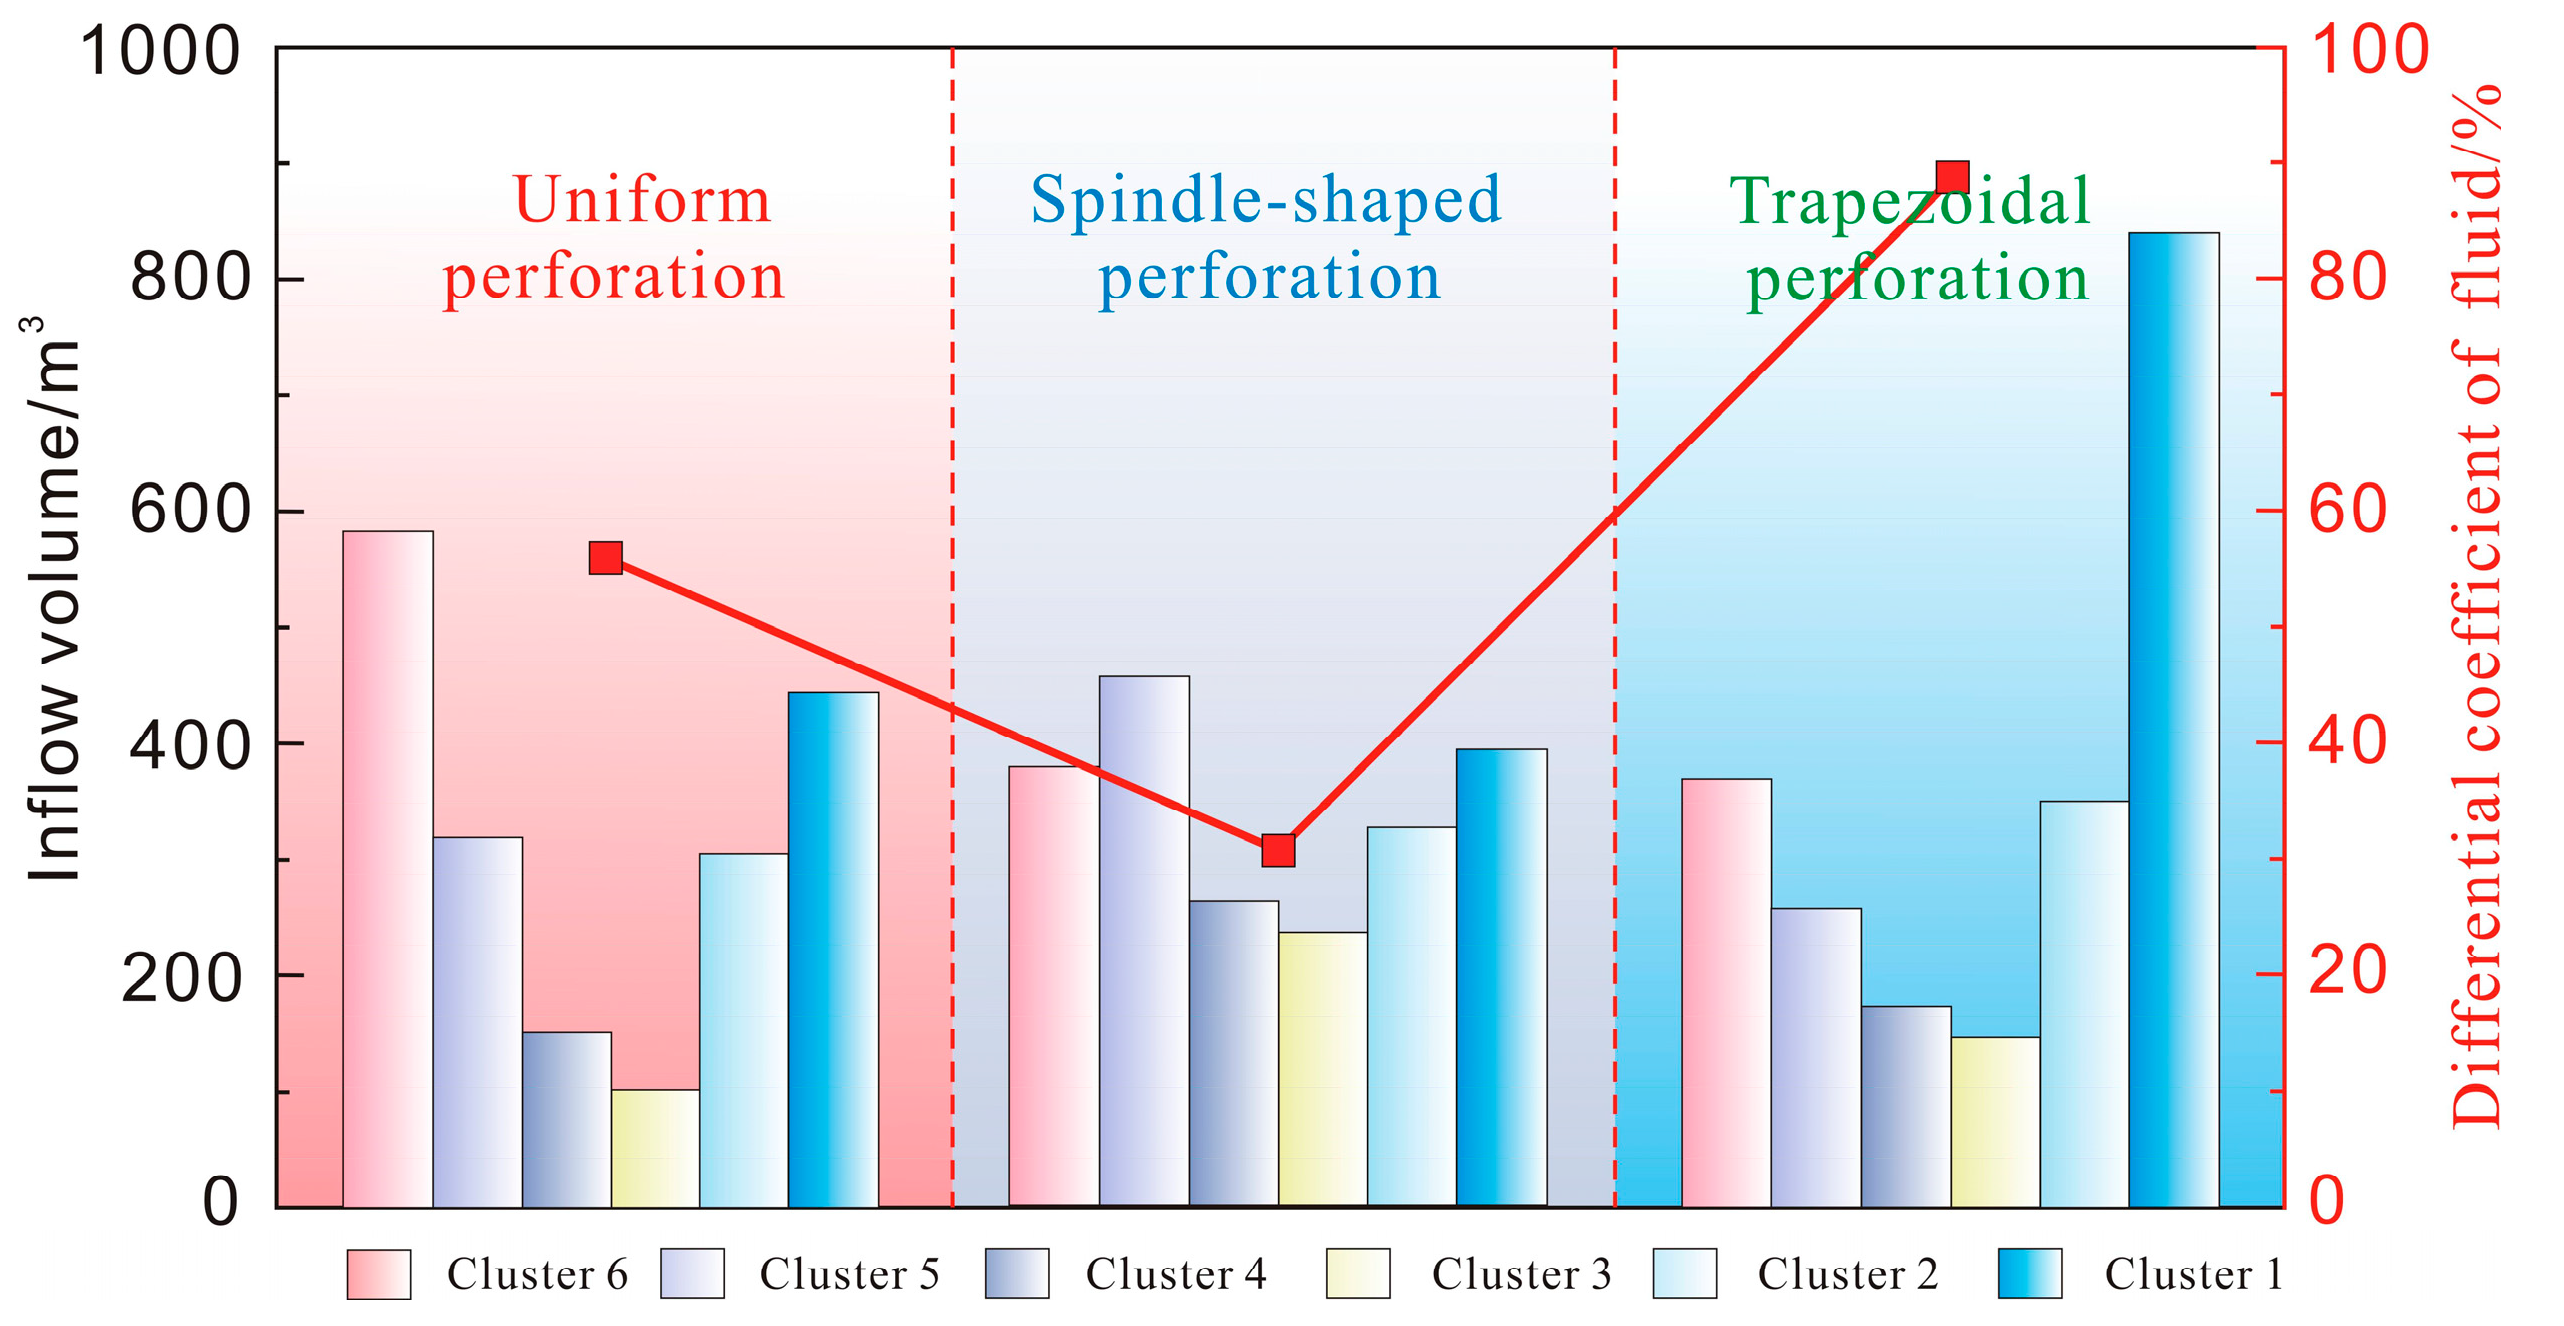
4.1.1. The Influence Mechanism of Perforation Methods on Balanced Fracture Propagation
4.1.2. The Influence of the Perforation Parameters on Balanced Fracture Propagation
- (1)
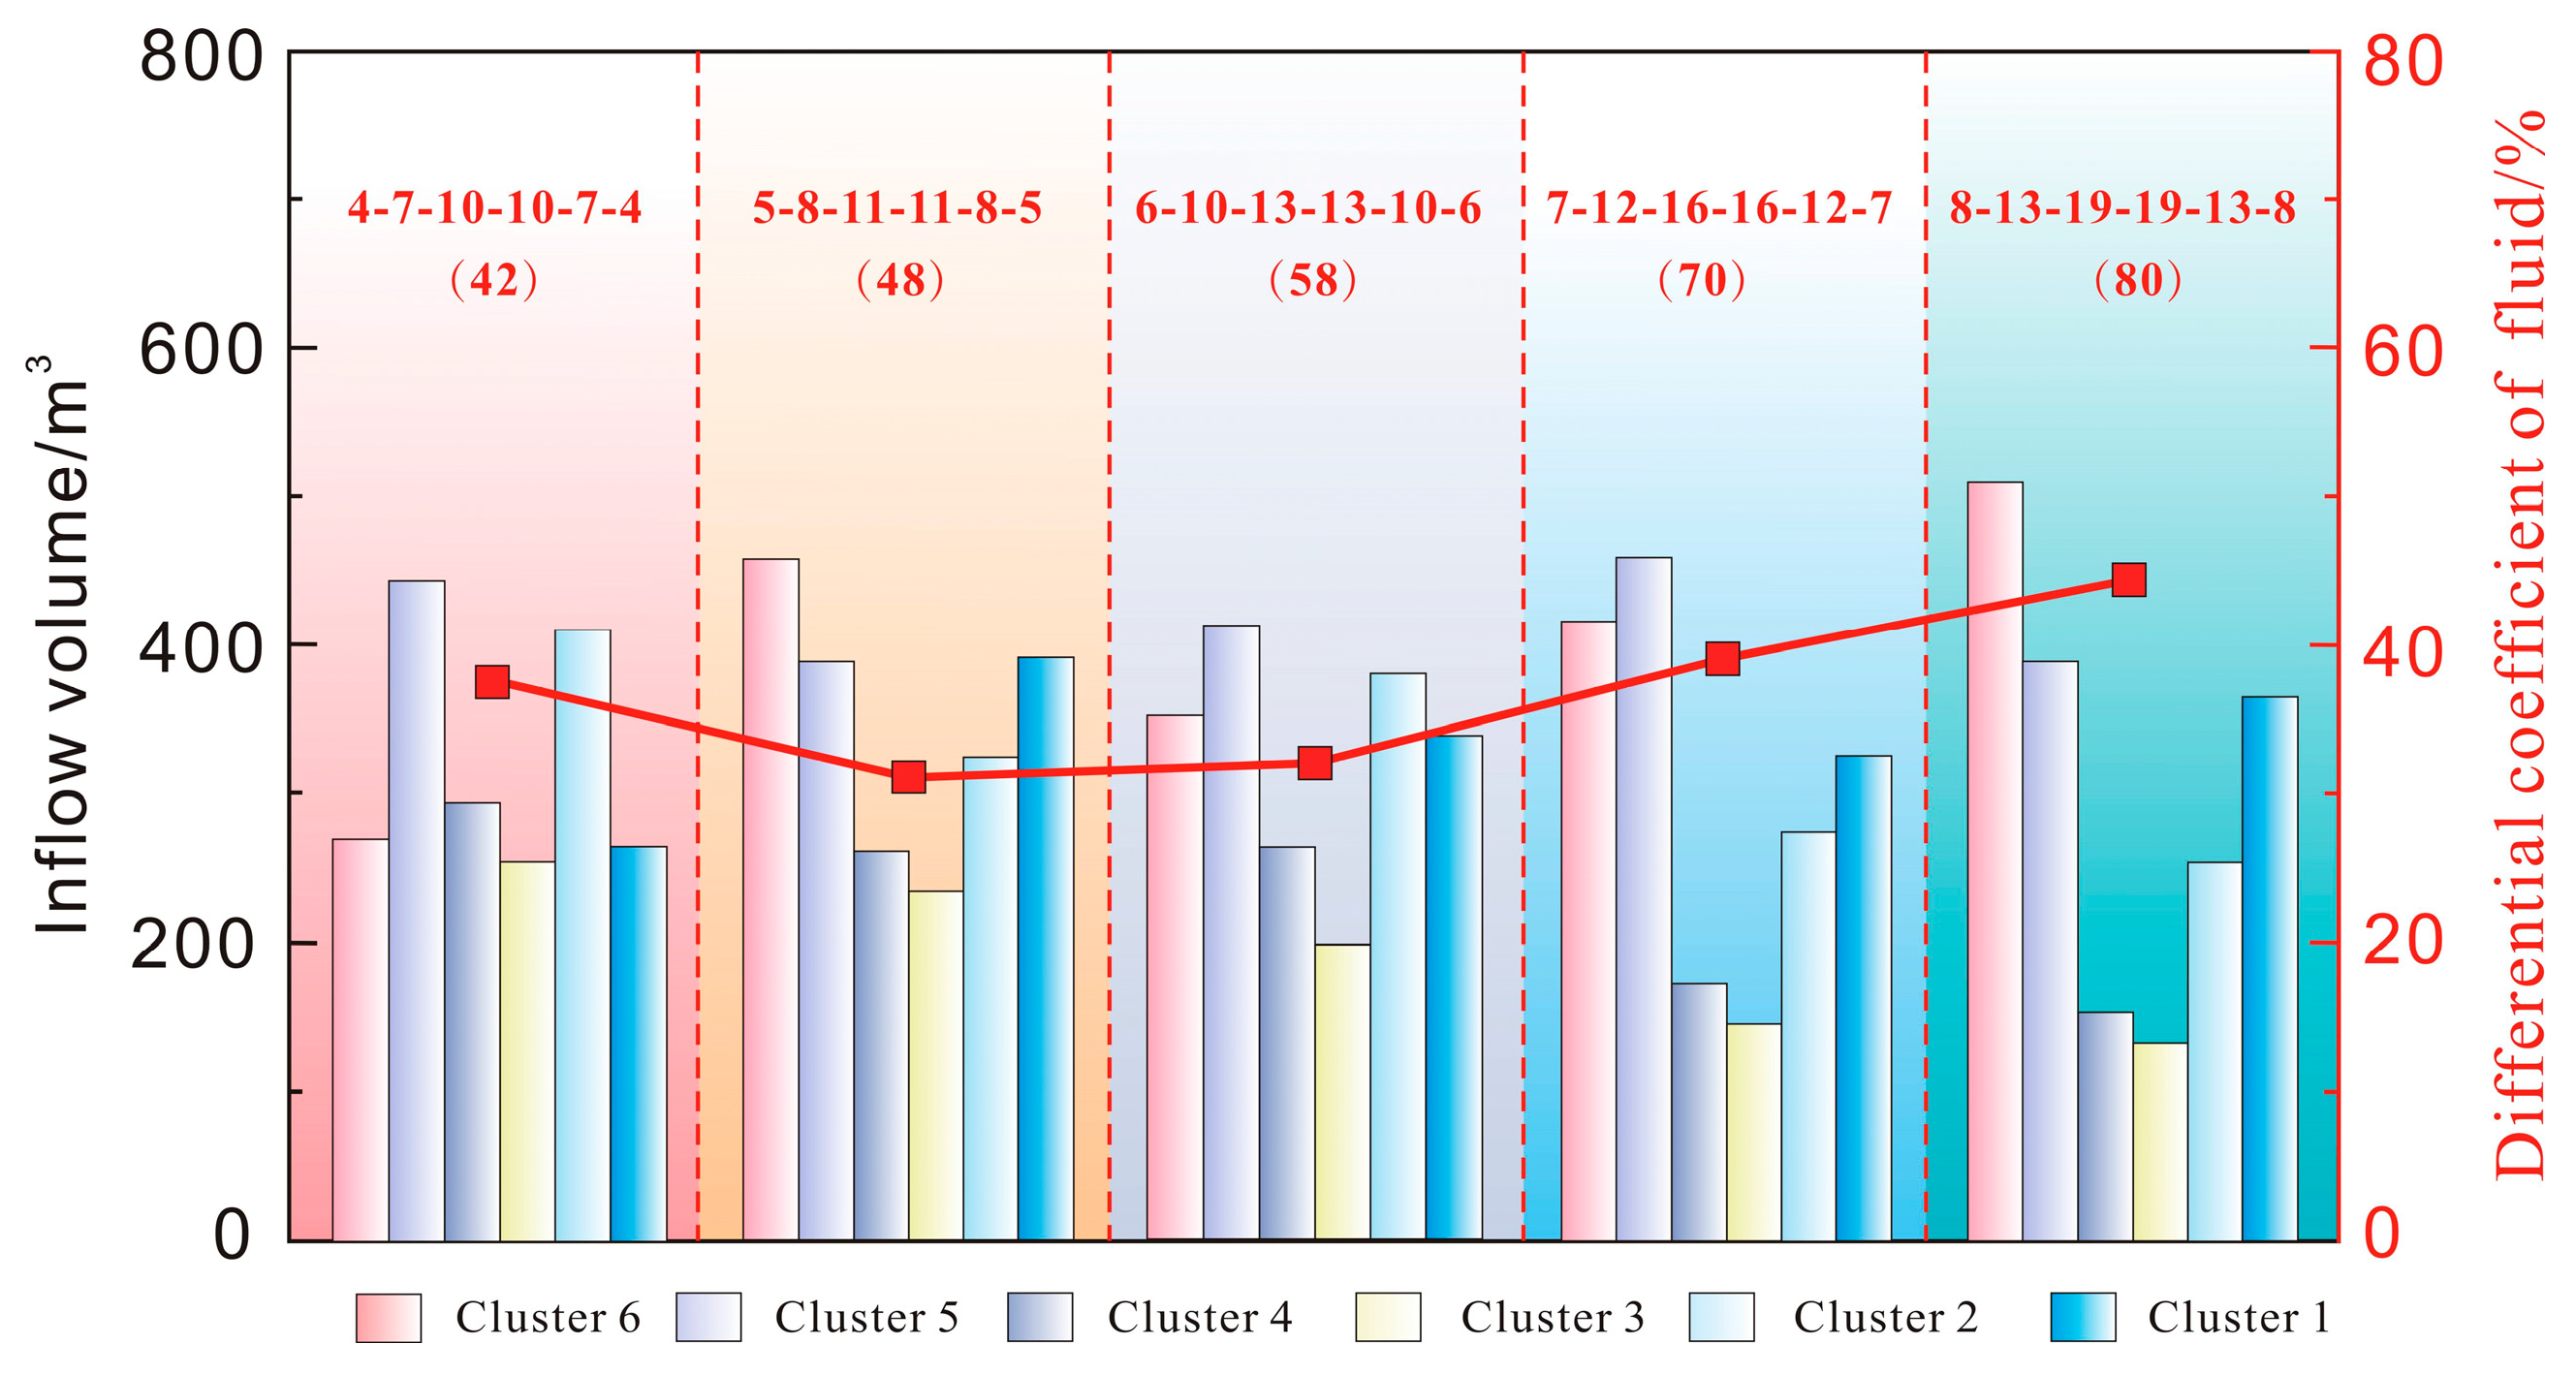
- The Perforation Quantity
- (2)
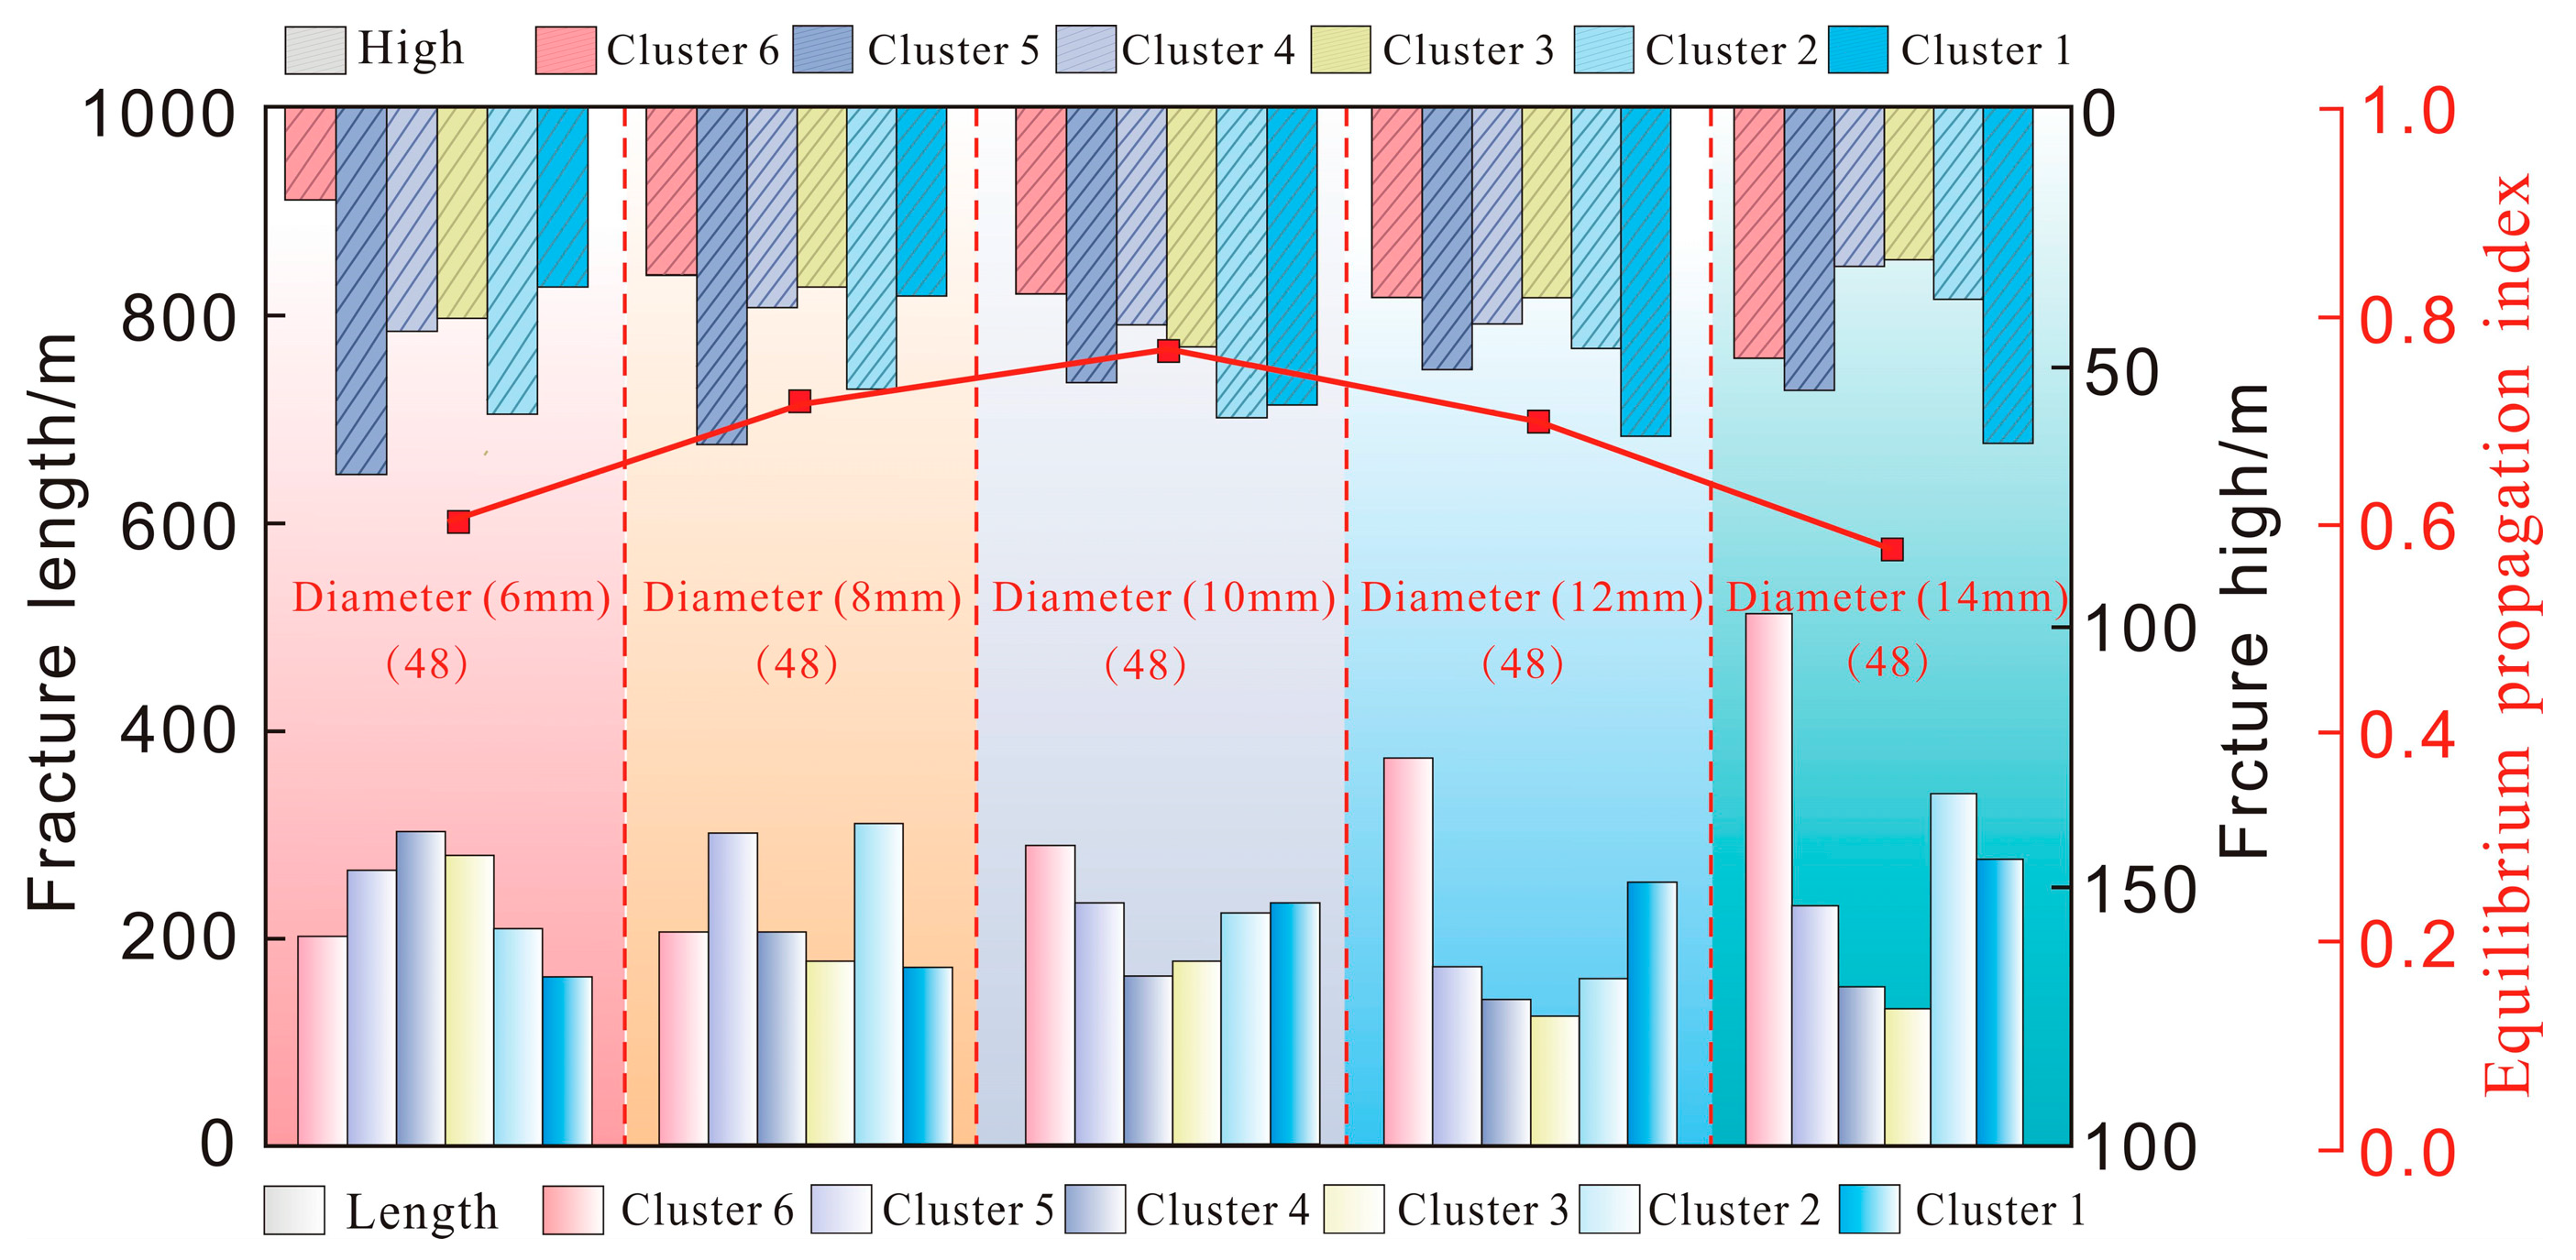
- The Perforation Diameter
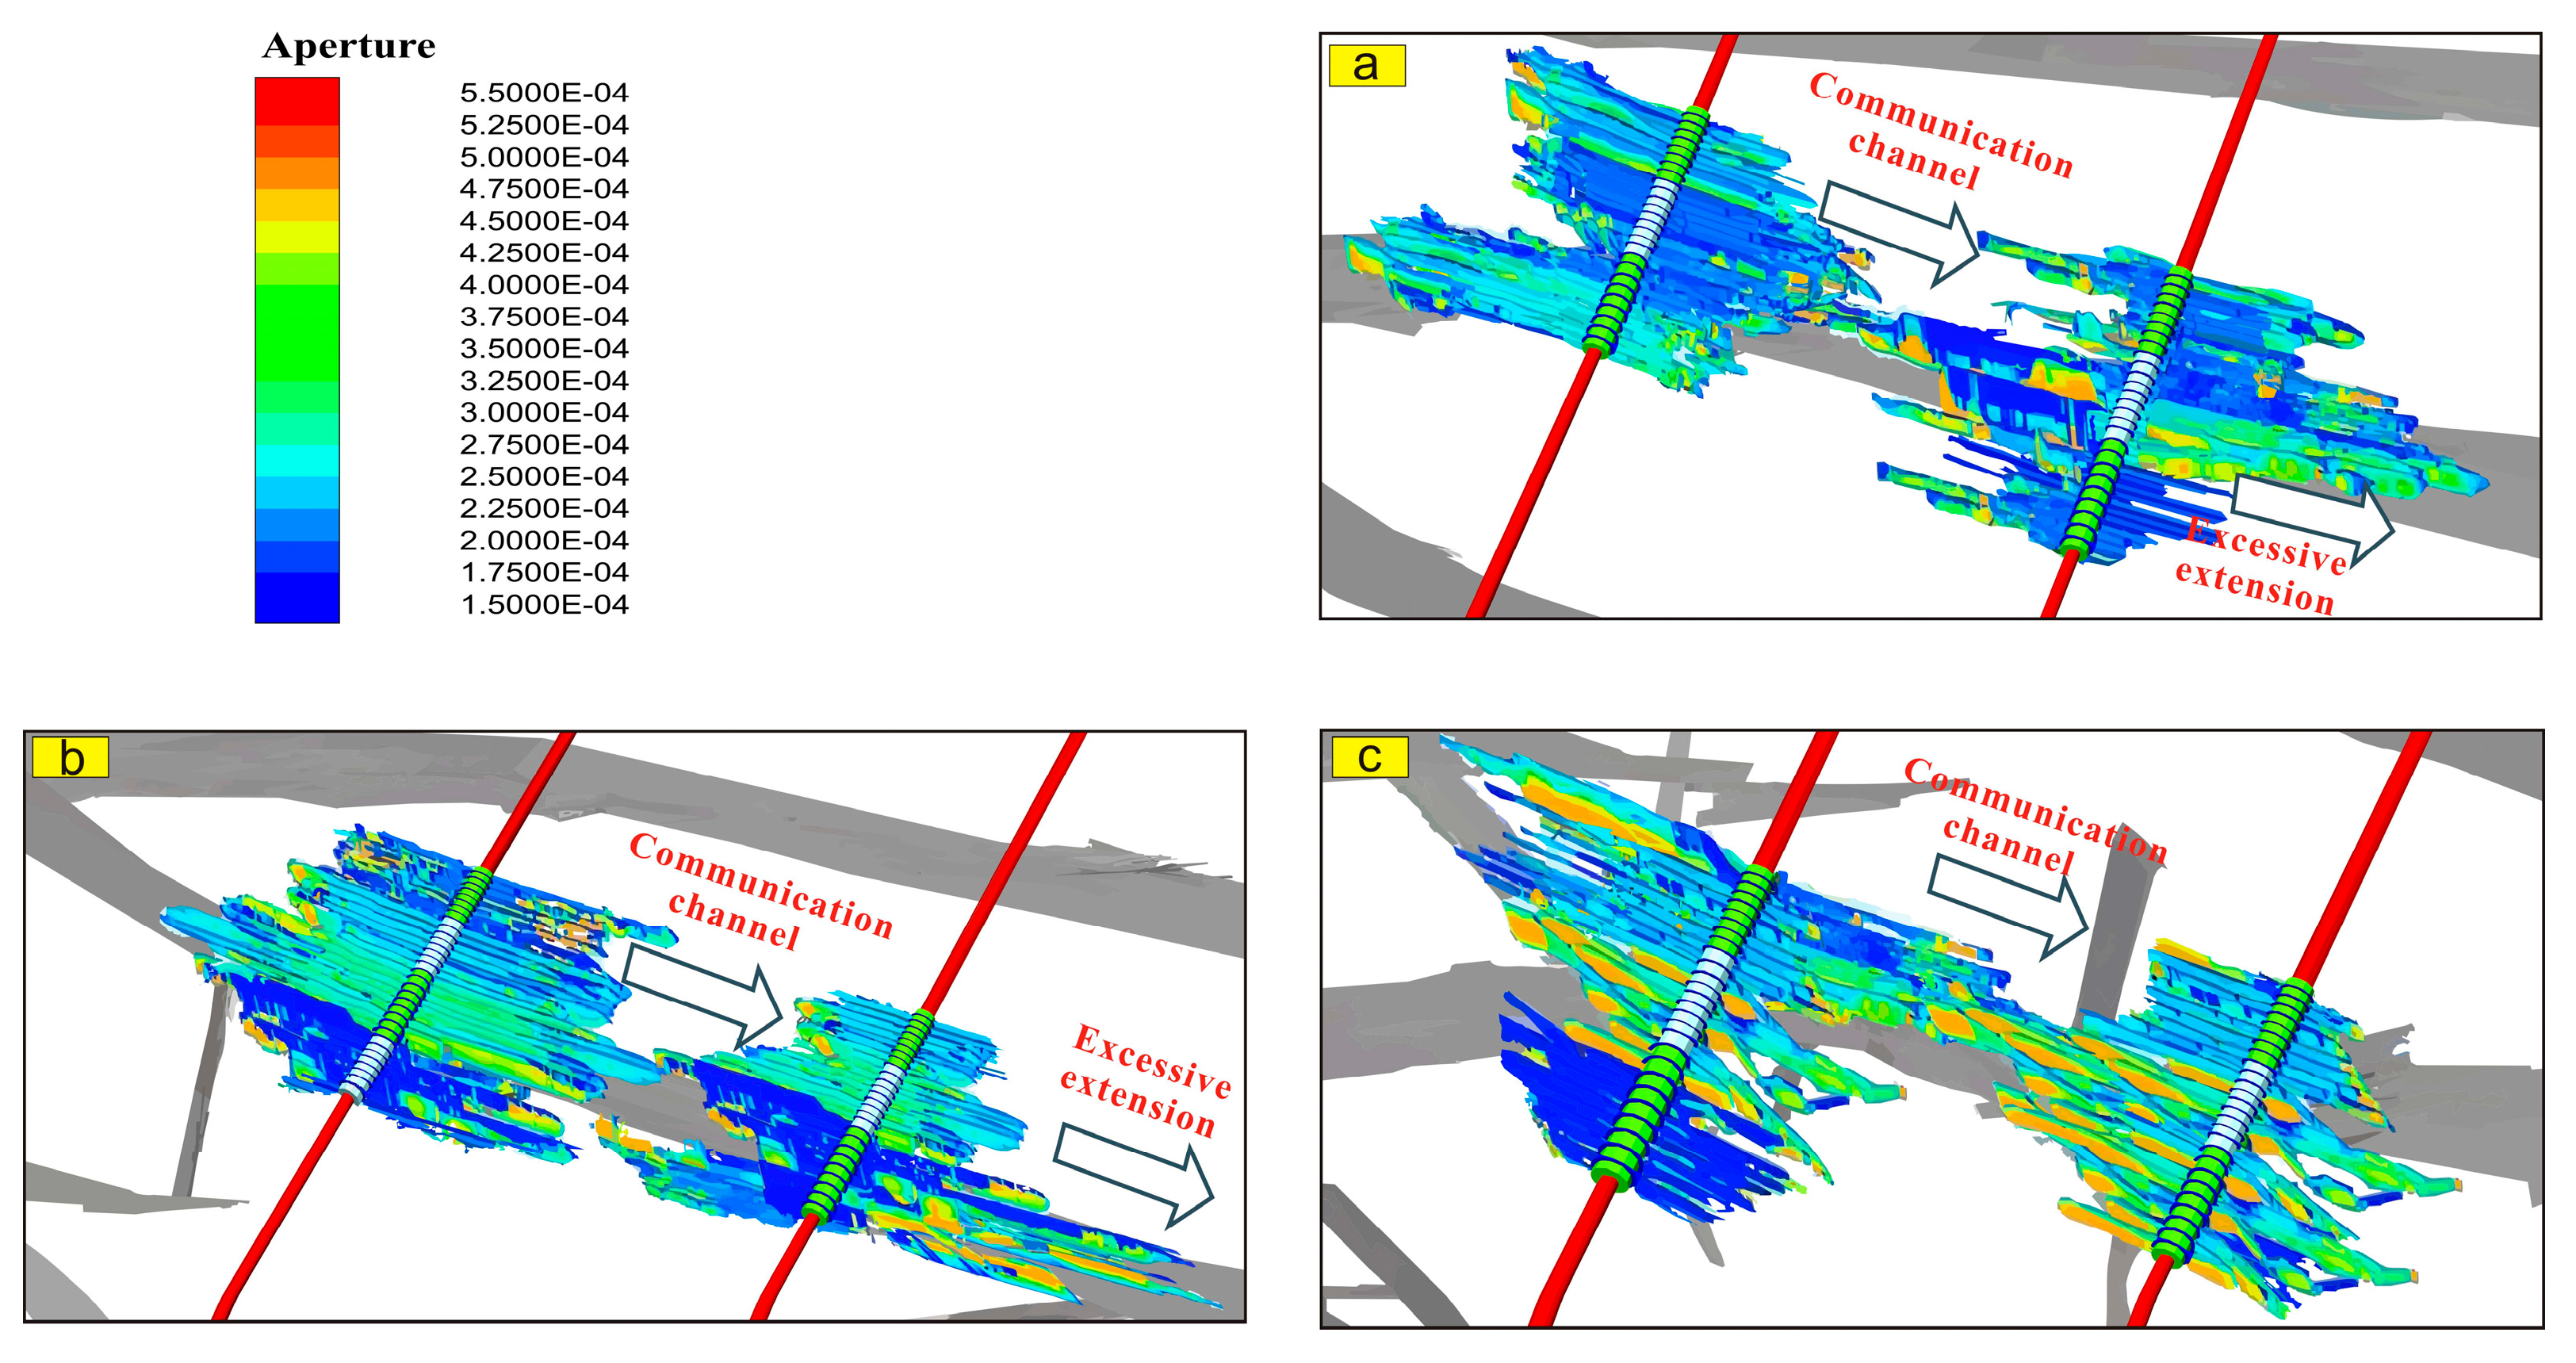
4.2. The Fracturing Interference Under Multi-Cluster Competitive Propagation
- (1)
- Natural Fractures
- (2)
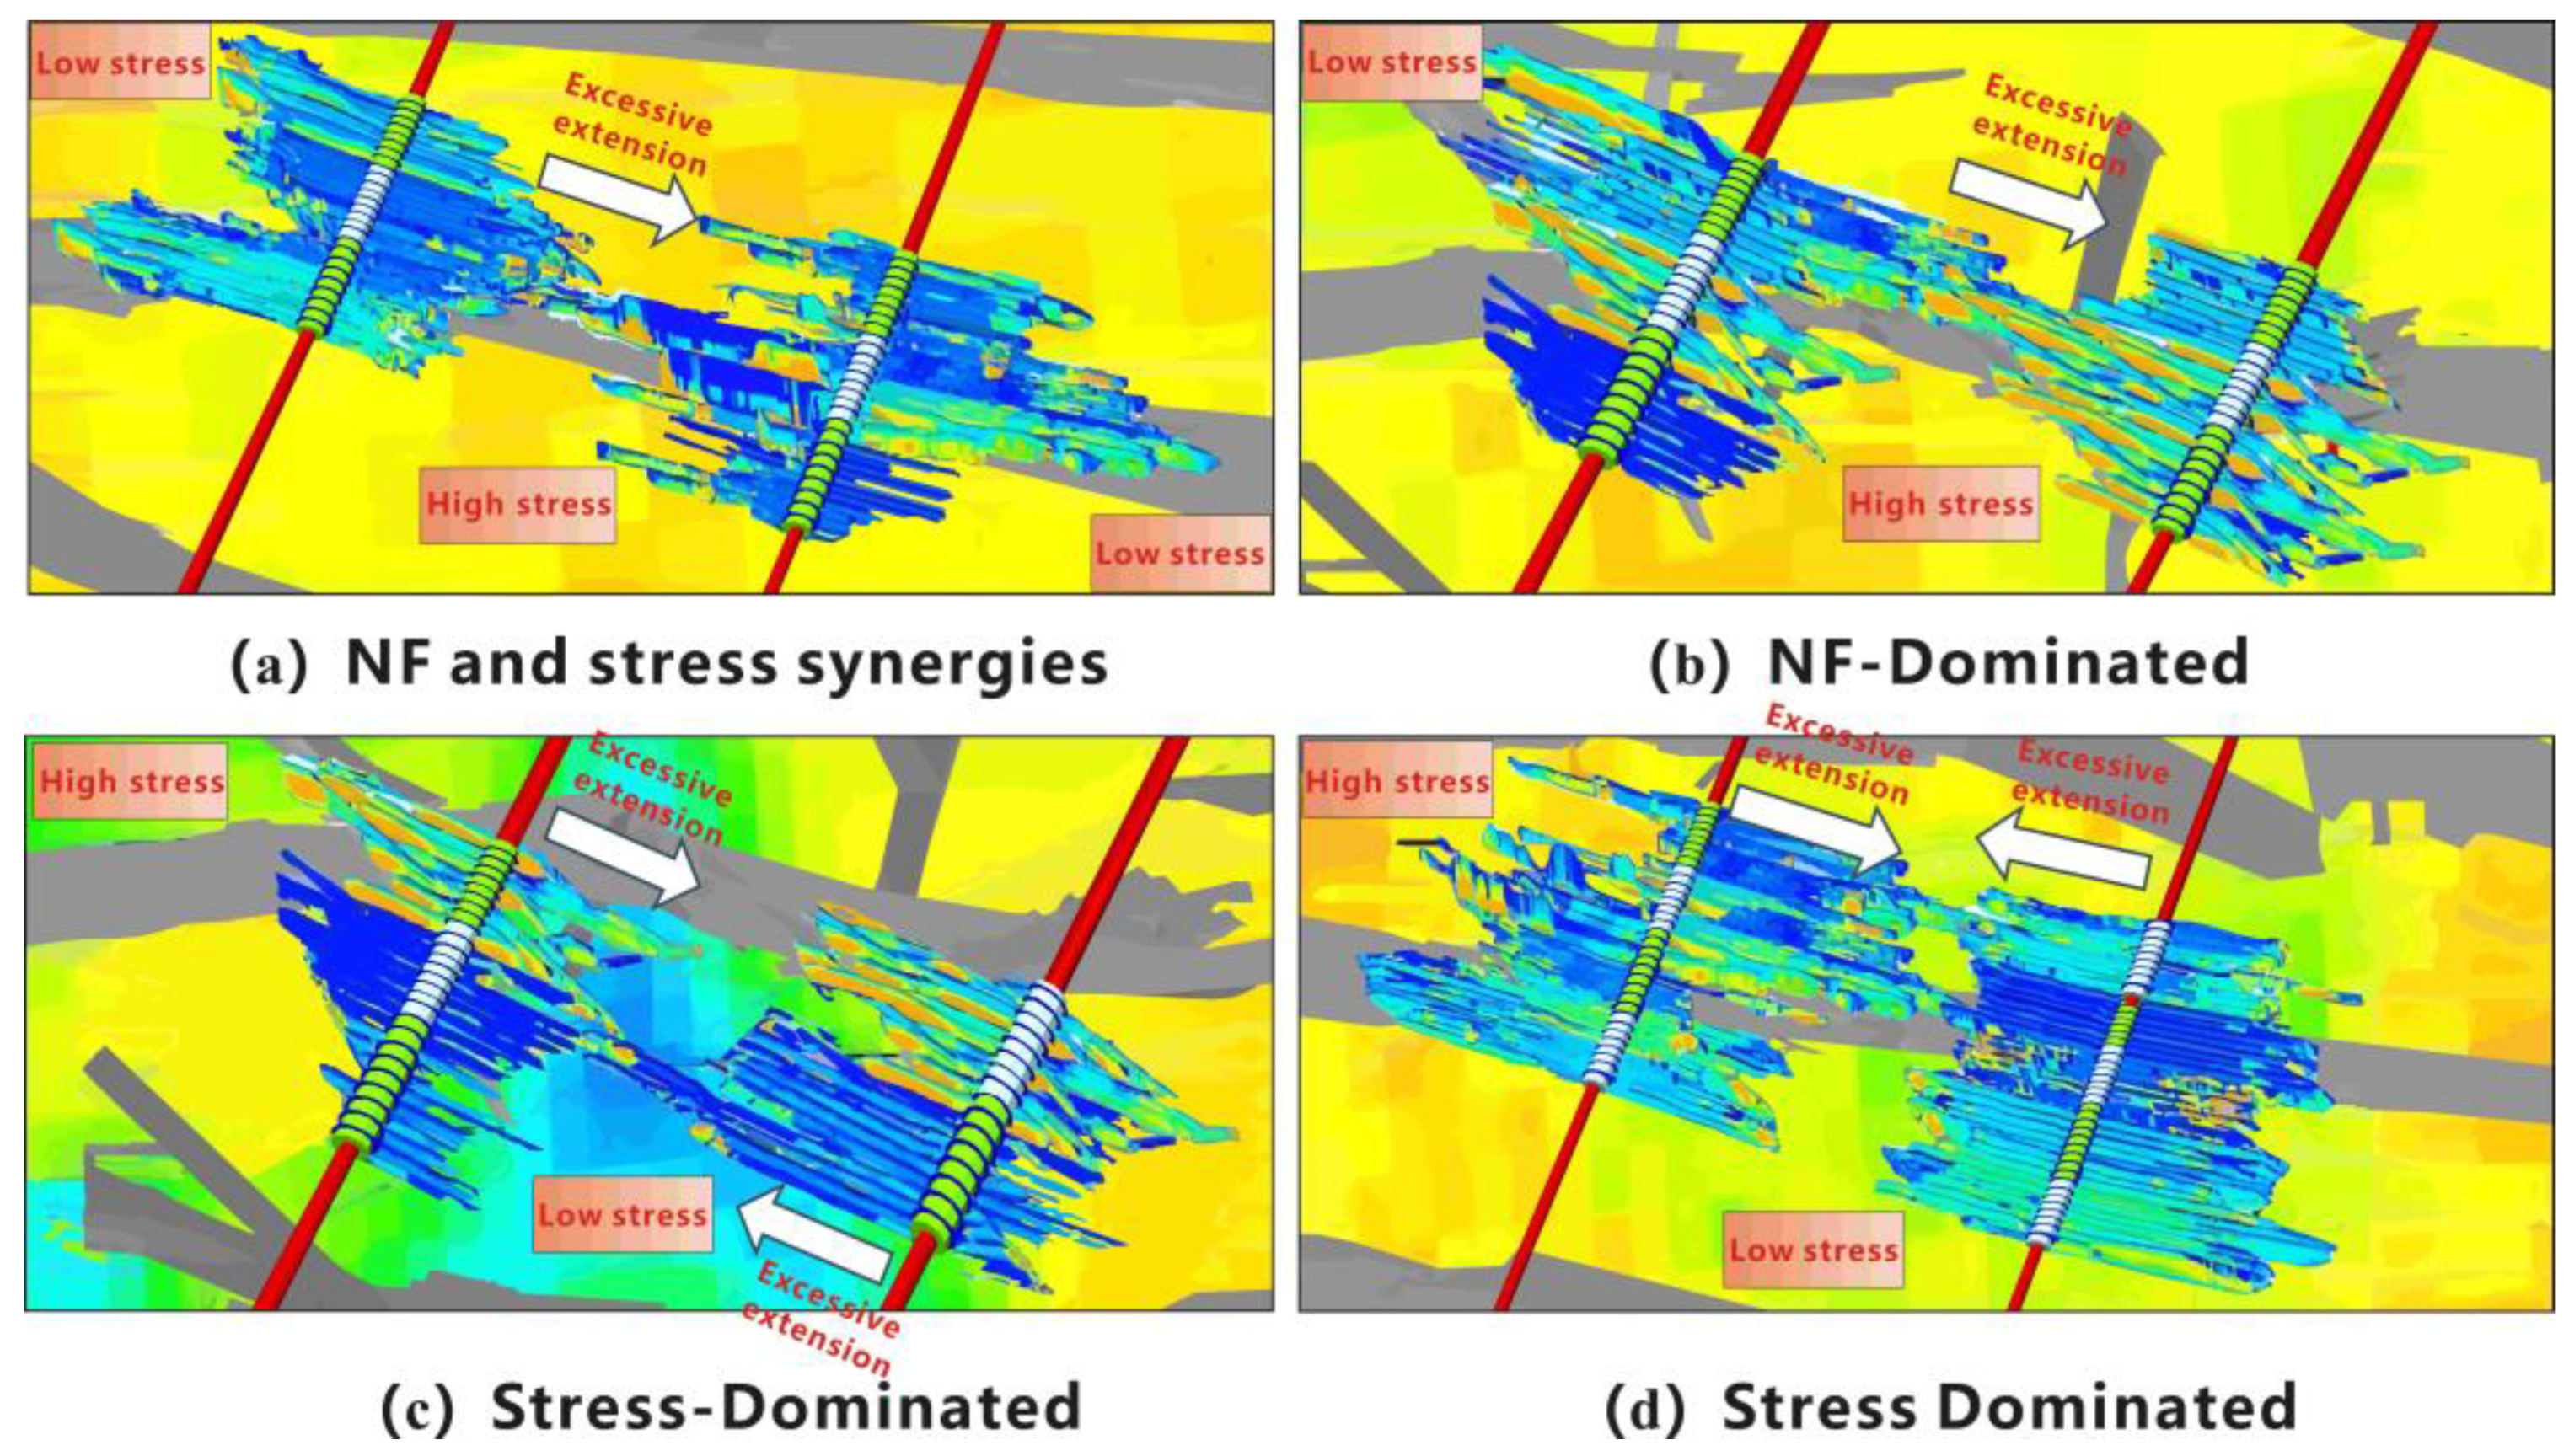
- The Horizontal Stress Difference
- (3)
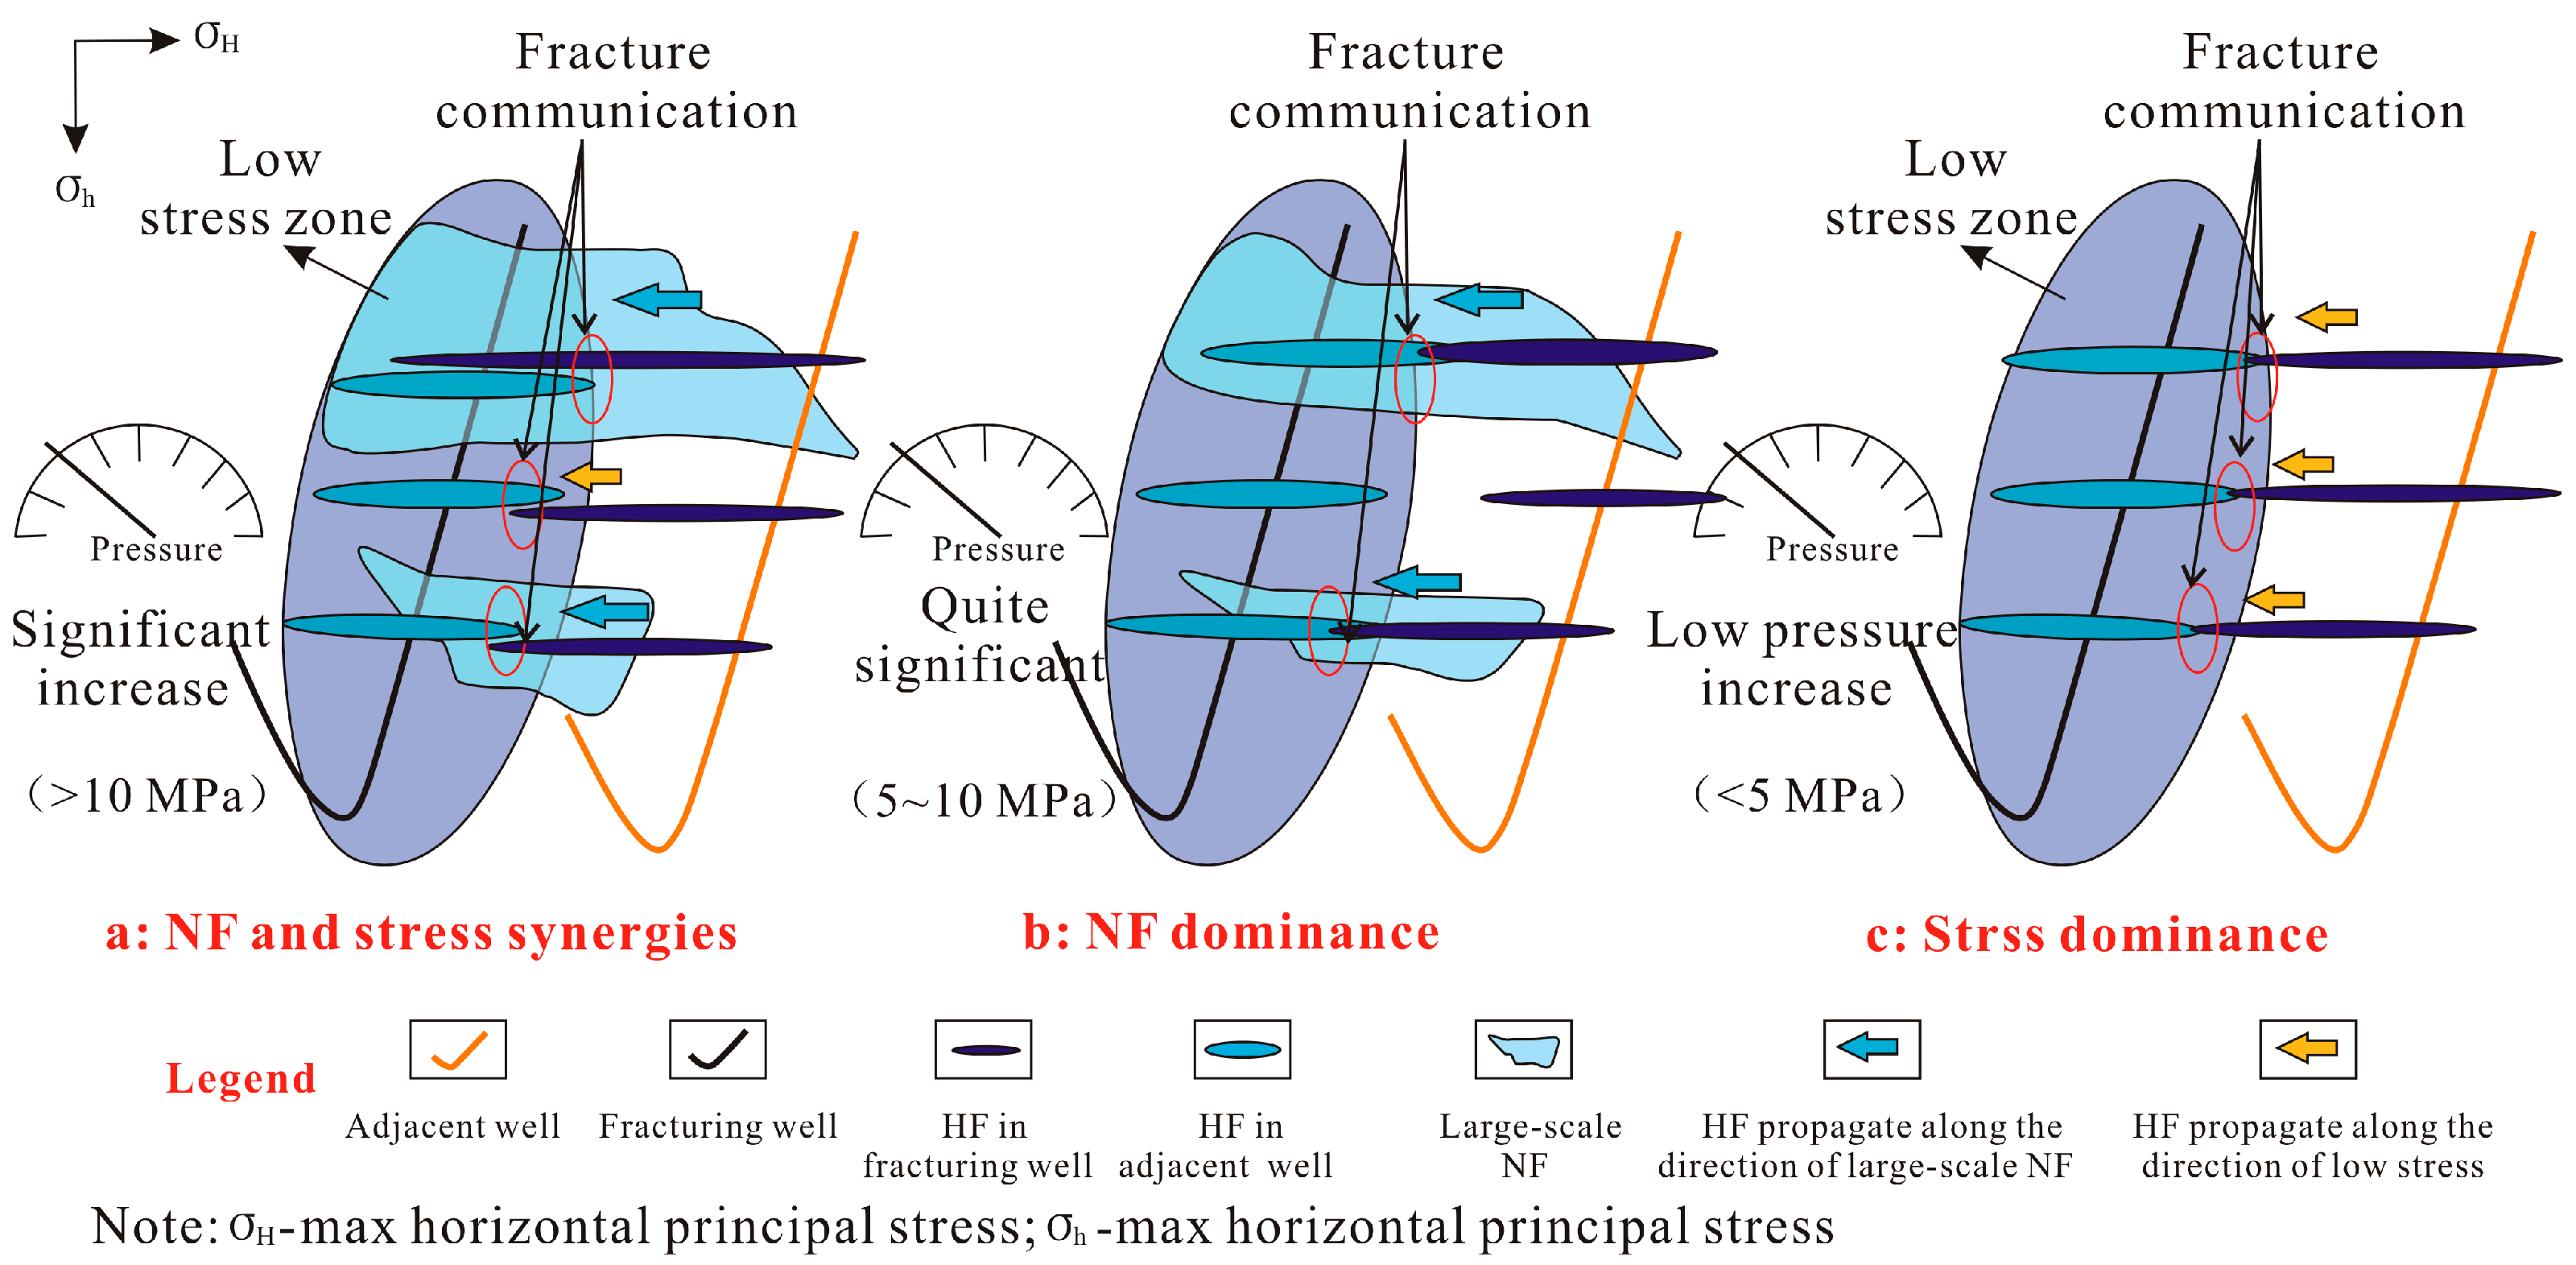
- FDI Classification
4.3. Mitigationof FDI Based on Multi-Fracture Diversion Regulation
4.4. The Prevention of Fracturing Interference Through Diversion Regulation
5. Conclusions
- (1)
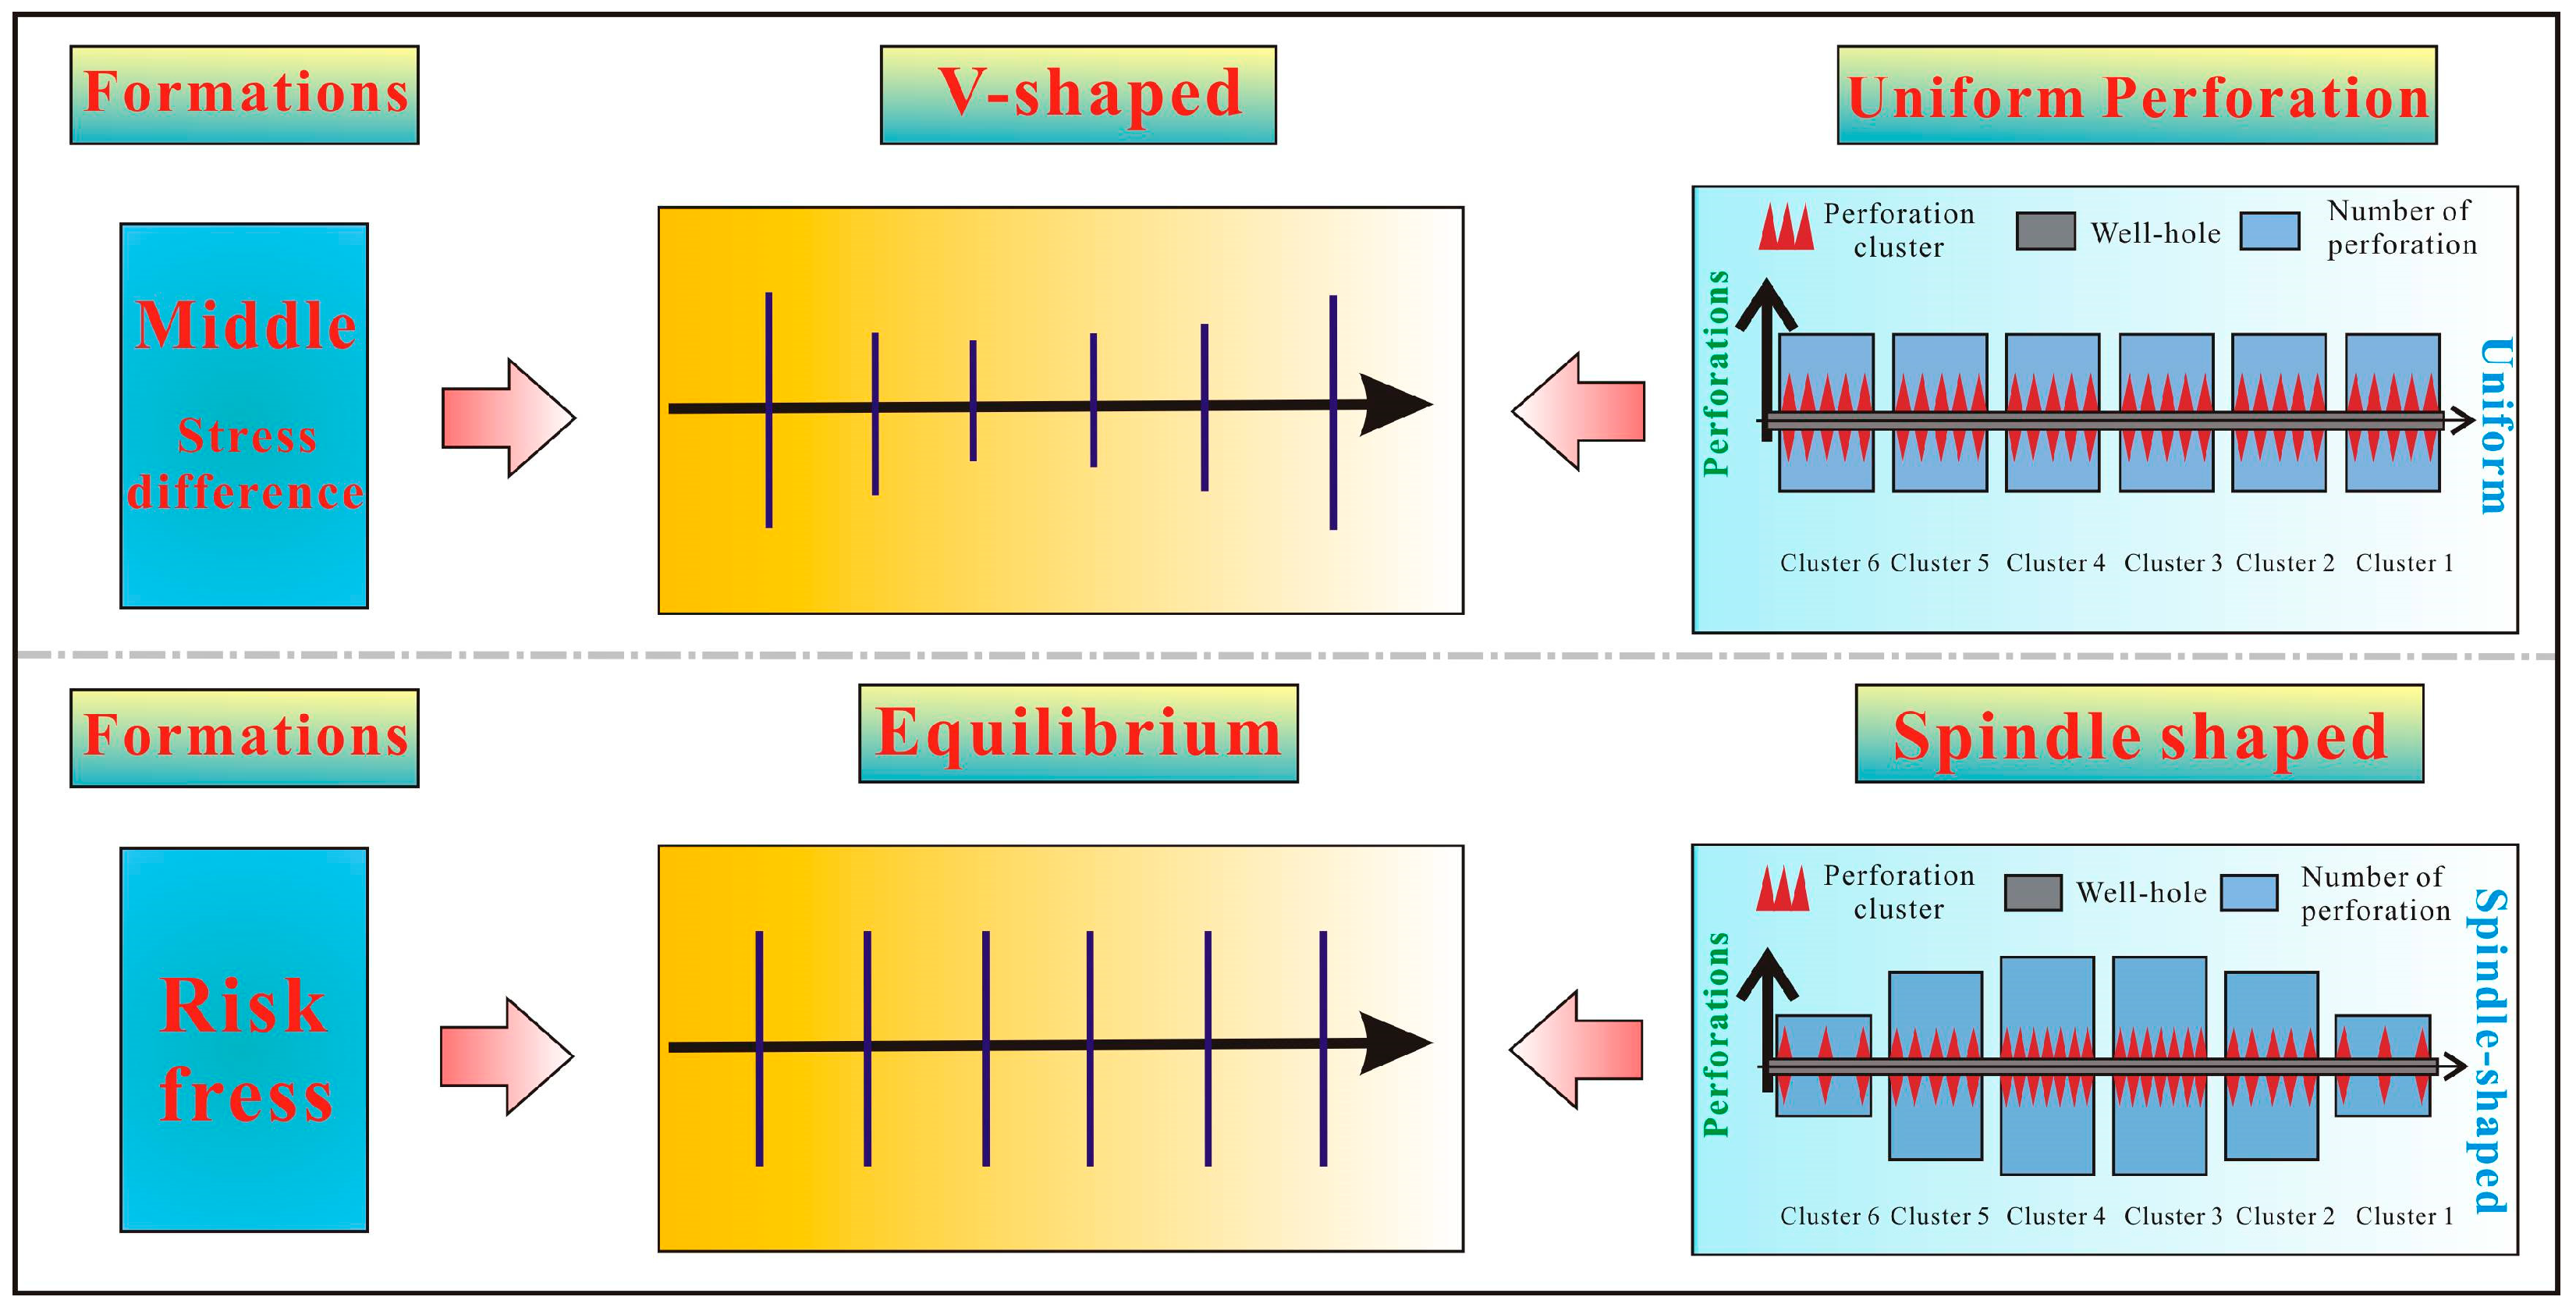
- Spindle-shaped perforations, characterized by a higher density in the middle clusters and a lower density at the terminals, reduce the stress induced in the mid-clusters compared to that under uniform/stepped patterns. This design improves the allocation of fluid to the mid-cluster, enhancing the uniformity of fracture propagation by 20.3% and 35.1% versus that under uniform and trapezoidal perforations, respectively.
- (2)
- A novel numerical simulation framework was established based on the fracture damage mechanics to model simultaneous multi-cluster propagation in horizontal well fracturing of shale gas. The advanced model precisely captured the dynamic coupling between the fluid injection, three-dimensional stress evolution, and fracture network development, while providing a quantitative analysis of complex fracture propagation patterns under various interference scenarios. Through a systematic evaluation of the fracture communication mechanisms and intensity of interference, three distinct inter-well types of FDI were identified: Type I: natural fracture–stress anisotropy synergy; Type II: natural-fracture-dominated; and Type III: stress-anisotropy-dominated.
- (3)
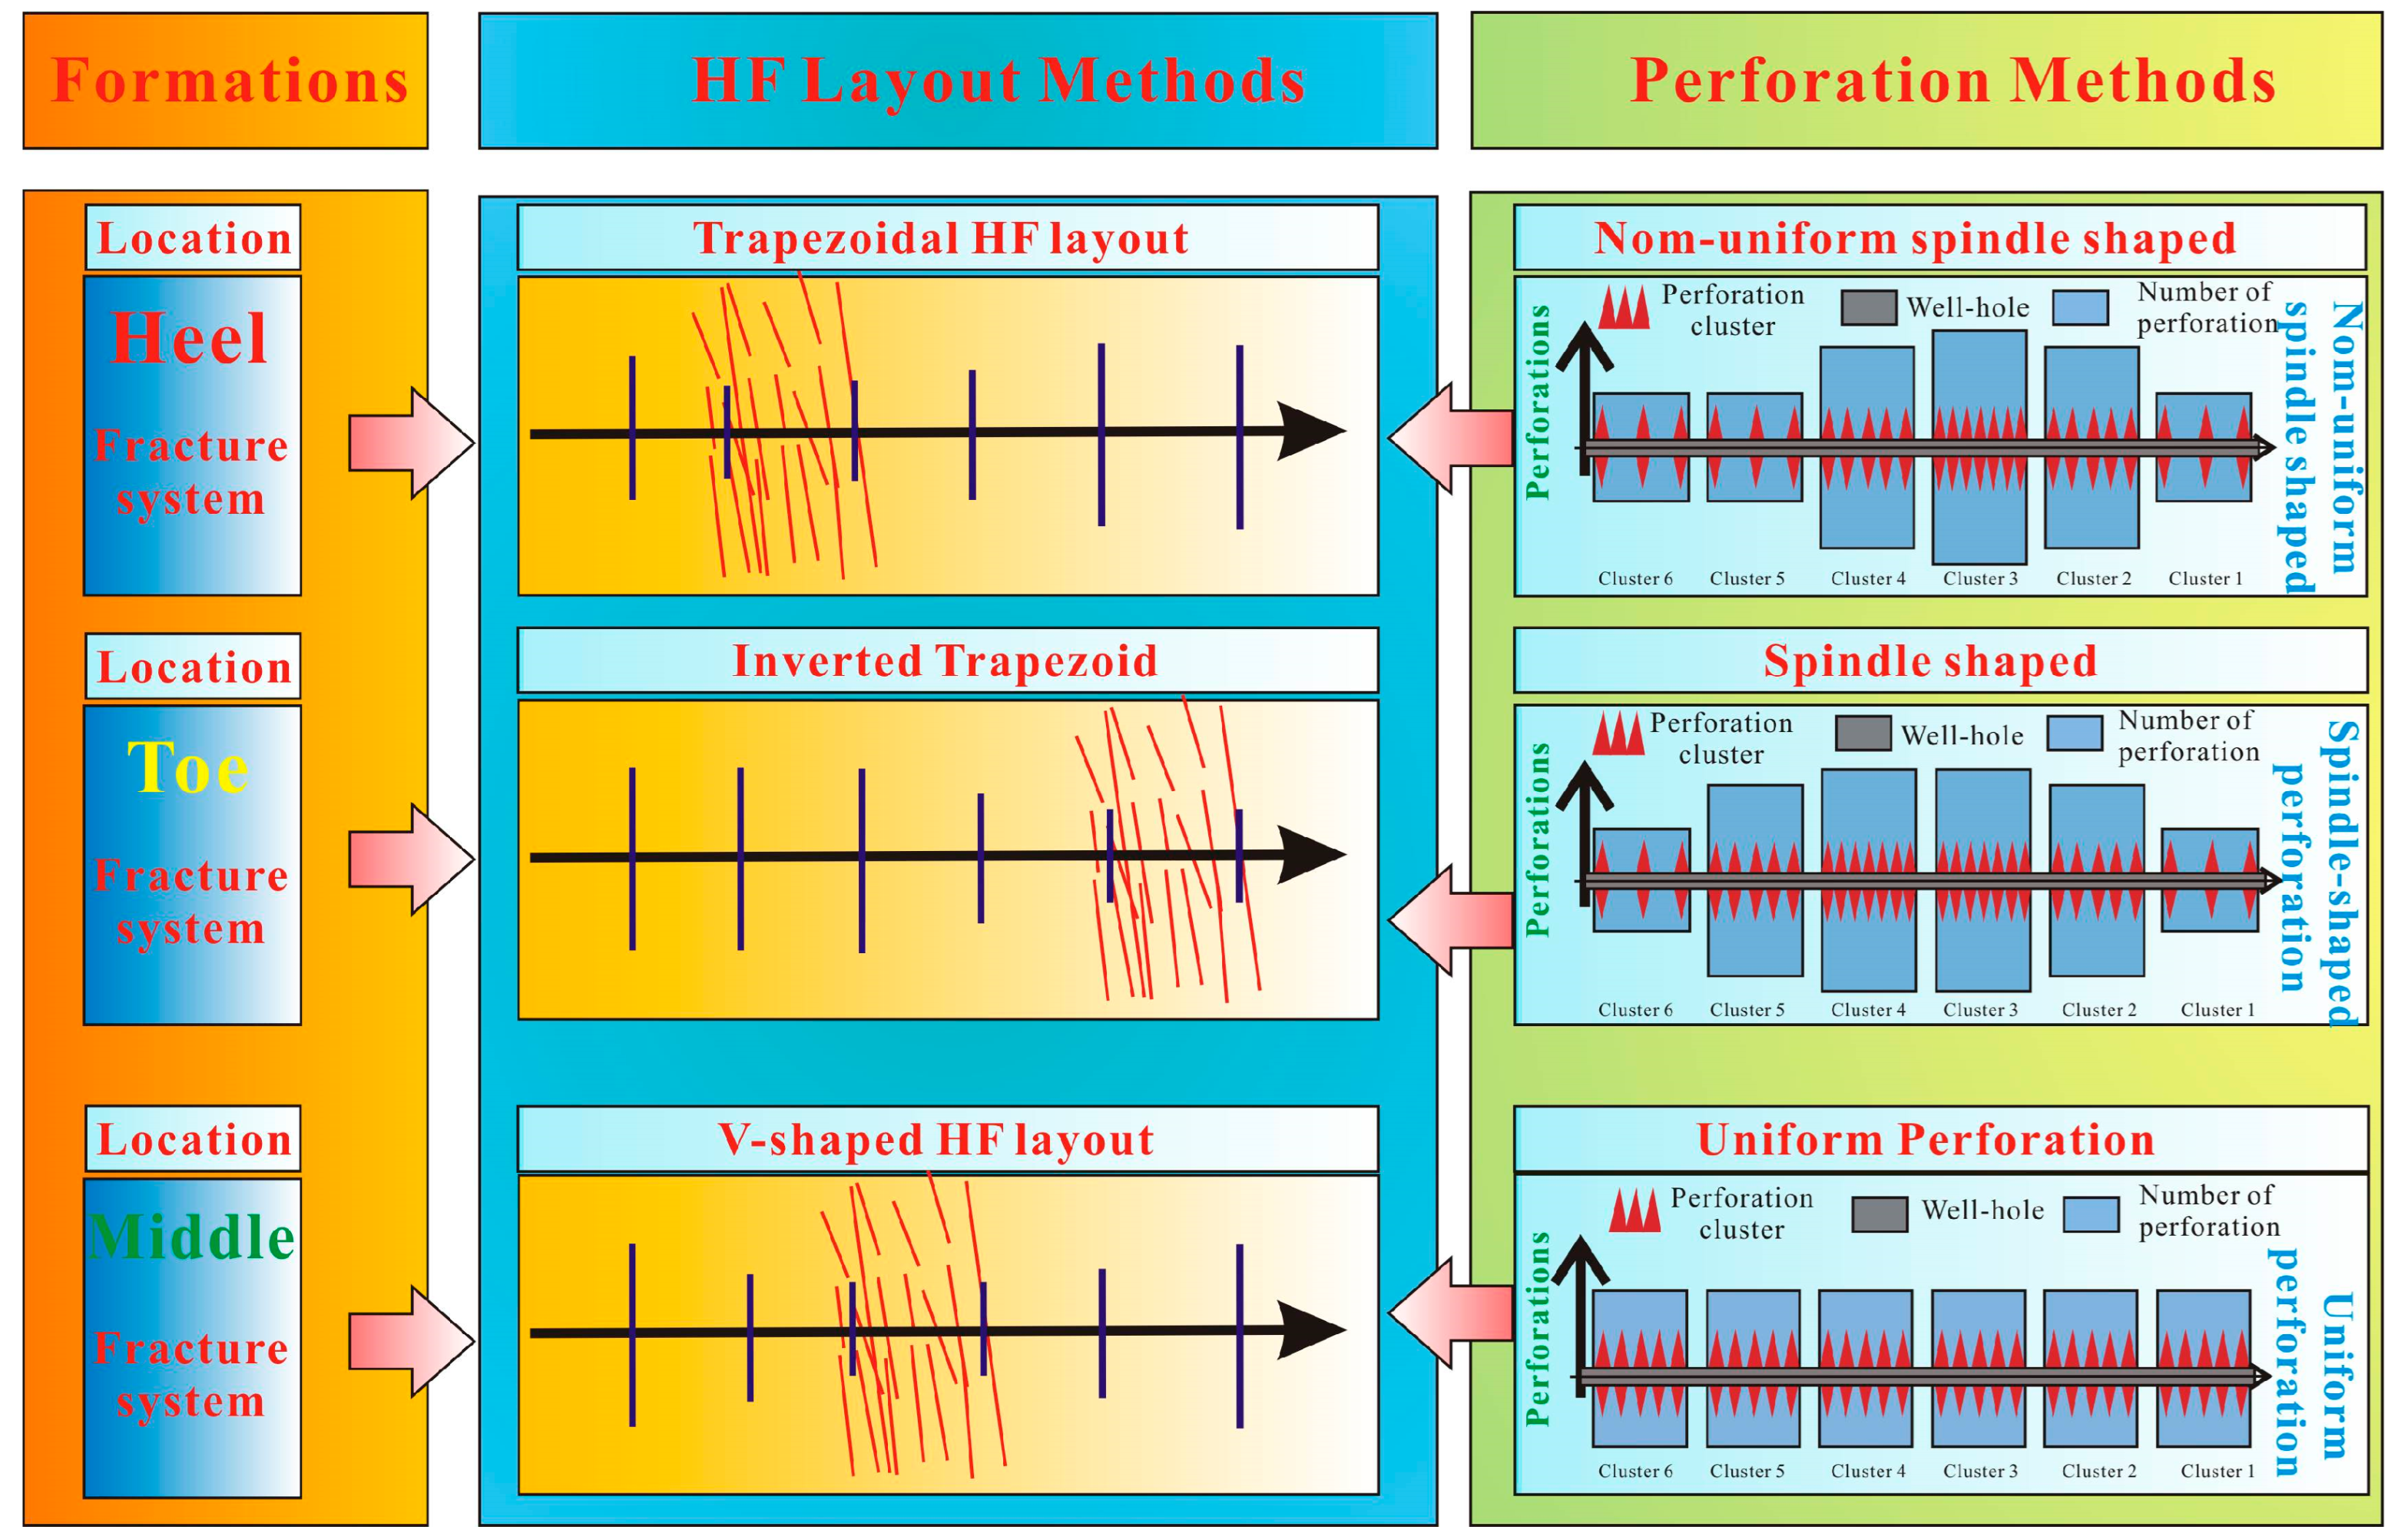
- Based on the mechanisms of fracturing interference in the study area, three fracture placement patterns were developed: trapezoidal, inverted trapezoidal, and V-shaped layouts. Corresponding perforation schemes were designed for each pattern, establishing an integrated optimization methodology for control over inter-well interference through multi-cluster competition and flow diversion regulation. The optimized flow diversion technique effectively balanced the fluid distribution among the clusters, suppressing preferential fracture growth. Field monitoring demonstrated s significant reduction in the interference of pressure from 14.95/6.23 MPa to 0.7/0 MPa in the offset wells, successfully preventing the dominant fracture pathways and inter-well communication.
Author Contributions
Funding
Data Availability Statement
Conflicts of Interest
References
- Ma, X.H.; Zhang, X.W.; Xiong, W. Prospects and challenges of shale gas development in China. Petrol. Sci. Bull. 2023, 8, 491–501. [Google Scholar]
- Zhao, J.Z.; Ren, L.; Jiang, X.T.; She, C.Y.; Fu, Y.Q.; Wu, J.F.; Jiang, T.X.; Ren, L. Ten years of shale gas fracturing in China: Review and prospect. Nat. Gas Ind. 2021, 41, 121–142. [Google Scholar] [CrossRef]
- Wang, Y.P.; Guo, T.K.; Chen, M.; Qi, Z.Q.; He, Z.; Cao, J. Numerical study on simultaneous propagation of multiple fractures: A method to design nonuniform perforation and in-stage diversion. SPE J. 2023, 28, 2514–2533. [Google Scholar] [CrossRef]
- He, X.; Li, W.G.; Dang, L.R.; Huang, S.; Wang, D.X.; Zhang, C.L.; Zhang, R.Q.; Chen, Y. Key technical challenges and research directions for deep shale gas development. Nat. Gas Ind. 2021, 41, 118–124. [Google Scholar]
- Yang, H.Z.; Zhao, S.X.; Xia, Z.Q. Target selection of tridimensional development of deep shale gas in the Luzhou region, South Sichuan Basin. Nat. Gas Ind. 2022, 42, 162–174. [Google Scholar]
- Tang, H.Y.; Wang, S.H.; Zhang, R.H. Analysis of stress interference among multiple hydraulic fractures using a fully three-dimensional displacement discontinuity method. J. Petrol. Sci. Eng. 2019, 179, 378–393. [Google Scholar] [CrossRef]
- Zeng, F.; Gong, G.; Zhang, Y.; Guo, J.; Jiang, J.; Hu, D. Fracability evaluation of shale reservoirs considering rock brittleness, fracture toughness, and hydraulic fracturing-induced effects. Geoener. Sci. Eng. 2023, 229, 212069. [Google Scholar] [CrossRef]
- Zhang, H.; Sheng, J. Optimization of horizontal well fracturing in shale gas reservoir based on stimulated reservoir volume. J. Petrol. Sci. Eng. 2020, 190, 107059. [Google Scholar] [CrossRef]
- Yang, X.F.; Huang, H.Y.; Wang, S.R. Mechanism analysis and countermeasures research on the shale gas well interference in Changning Block. In Proceedings of the 33rd National Natural Gas Academic Annual Conference, Chengdu, China, 28–30 November 2023; pp. 39–46. [Google Scholar]
- Lei, Y.; Shan, W.; Ke, G.; Shen, L. Simultaneous propagation of hydraulic fractures from multiple perforation clusters in layered tight reservoirs: Non-planar three-dimensional modelling. Energy 2022, 254 Pt C, 124483. [Google Scholar]
- Bing, H.; Zhang, Q.; Liu, X.; Pang, H.; Zeng, Y. Integration analysis of 3D fractures network reconstruction and frac hits response in shale wells. Energy 2022, 260, 124906. [Google Scholar] [CrossRef]
- Zhang, Y.; Zeng, F.; Guo, J.; Hu, D.; Bai, X.S.; Gong, G.B.; Cheng, Z.X. Mult-objective optimization of perforation design with mechanism learning to increase the stimulated reservoir volume of unconventional reservoirs. Geoener. Sci. Eng. 2025, 246, 213550. [Google Scholar] [CrossRef]
- Taghavinejad, A.; Brown, C.; Ostadhassan, M.; Liu, B.; Hadavimoghaddam, F.; Sharif, M. A real-world impact of offset frac-hits by rate transient analysis in the Bakken and Three Forks, North Dakota, USA. J. Petrol. Sci. Eng. 2022, 208, 109710. [Google Scholar] [CrossRef]
- Qin, J.Z.; Zhong, Q.H.; Tang, Y.; Yu, W.; Sepehrnoori, K. Well interference evaluation considering complex fracture networks through pressure and rate transient analysis in unconventional reservoirs. Petrol. Sci. 2023, 20, 337–349. [Google Scholar] [CrossRef]
- Zhang, B.; Guo, T.; Chen, M.; Xue, L.; Zhang, Y.; Hu, Z.P.; Qu, Z.Q. Experimental research on hydraulic fracture evolution characteristics of multi-well pad fracturing in a tight conglomerate reservoir. Eng. Frac. Mech. 2024, 312, 110609. [Google Scholar] [CrossRef]
- Qin, Y.; Guo, T.K.; Ding, H.F.; Liu, T.Y.; Chen, M.; Zhang, M.W.; Feng, Y. Mechanism of inter-well hydraulic fracture interference in the primary horizontal well pattern. Geoenergy Sci. Eng. 2024, 241, 213165. [Google Scholar] [CrossRef]
- Cai, Y.; Dahi Taleghani, A. Using pressure changes in offset wells for interpreting fracture driven interactions (FDI). J. Petrol. Sci. Eng. 2022, 219, 111111. [Google Scholar] [CrossRef]
- Guo, J.C.; Zhang, Y.; Zeng, F.H. Research progress and prospect of intelligent fracturing technology for unconventional oil and gas reservoirs. Nat. Gas Ind. 2024, 44, 13–26. [Google Scholar]
- Han, H.; Liu, Y.; Hou, Y.; Qiao, J. Multi-modal multi-objective particle swarm optimization with self-adjusting strategy. Inf. Sci. 2023, 629, 580–598. [Google Scholar] [CrossRef]
- He, Q.; Wang, Z.; Liu, C. Identifying nonuniform distributions of rock properties and hydraulic fracture trajectories through deep learning in unconventional reservoirs. Energy 2024, 291, 130329. [Google Scholar] [CrossRef]
- Li, Y.; Deng, J.; Liu, W.; Wei, Y.; Hou, Y. Numerical simulation of limited-entry multi-cluster fracturing in horizontal well. J. Petrol. Sci. Eng. 2017, 152, 443–455. [Google Scholar] [CrossRef]
- Yuan, Y.; Ong, Y.S.; Gupta, A.; Xu, H. Objective reduction in many-objective optimization: Evolutionary multiobjective approaches and comprehensive analysis. IEEE Trans. Evol. Comput. 2017, 22, 189–210. [Google Scholar] [CrossRef]
- Zeng, F.; Zhang, Y.; Guo, J.; Qu, Z.; Hu, Z.; Cao, J.; Weng, D. Optimized completion design for triggering a fracture network to enhance horizontal shale well production. J. Petrol. Sci. Eng. 2020, 190, 107043. [Google Scholar] [CrossRef]
- Li, Q.; Li, Q.C.; Wu, J.; Li, X.; Li, H.; Cheng, Y. Wellhead Stability During Development Process of Hydrate Reservoir in the Northern South China Sea: Evolution and Mechanism. Processes 2025, 13, 40. [Google Scholar] [CrossRef]
- Han, W.G.; Cui, Z.D.; Zhang, J.Y. Fracture path interaction of two adjacent perforations subjected to different injection rate increments. Comput. Geotech. 2020, 122, 103500. [Google Scholar] [CrossRef]
- Wang, L.C.; Duan, K.; Zhang, Q.Y.; Li, X.; Jiang, R.; Zheng, Y. Stress interference and interaction between two fractures during their propagation: Insights from SCDA test and XFEM simulation. Int. J. Rock Mech. Min. Sci. 2023, 169, 105431. [Google Scholar] [CrossRef]
- Zhao, J.Z.; Chen, X.Y.; Li, Y.M.; Fu, B.; Xu, W. Numerical simulation of multistage fracturing and optimization of perforation in a horizontal well. Petrol. Explor. Dev. 2017, 44, 119–126. [Google Scholar] [CrossRef]
- Saber, E.; Qu, Q.D.; Sarmadivaleh, M.; Aminossadati, S.; Chen, Z. Propagation of multiple hydraulic fractures in a transversely isotropic shale formation. Int. J. Rock Mech. Min. Sci. 2023, 170, 105510. [Google Scholar] [CrossRef]
- Chen, M.; Zhang, S.C.; Xu, Y.; Ma, X.; Zou, Y. A numerical method for simulating planar 3D multi-fracture propagation in multi-stage fracturing of horizontal wells. Petrol. Explor. Dev. 2020, 47, 163–174. [Google Scholar] [CrossRef]
- Wang, B.; Zhang, G.C.; Zhang, L.; Liu, J.; Zhou, F. Promoting the uniform propagation of multifracture through adjusting the injection rate and perforation parameter: A numerical study. Phys. Fluids 2023, 35, 143–158. [Google Scholar] [CrossRef]
- Settgast, R.; Izadi, G.; Hurt, R.; Jo, H.; Ryerson, F. Optimized cluster design in hydraulic fracture stimulation. In Proceedings of the SPE/AAPG/SEG Unconventional Resources Technology Conference, San Antonio, TX, USA, 20–22 July 2015; p. URTEC-2172691. [Google Scholar]
- Guo, J.; Lu, Q.; Zhu, H.; Wang, Y.; Ma, L. Perforating cluster space optimization method of horizontal well multi-stage fracturing in extremely thick unconventional gas reservoir. J. Nat. Gas Sci. Eng. 2015, 26, 1648–1662. [Google Scholar] [CrossRef]
- Lu, Y.; Li, H.T.; Lu, C.; Wu, K.; Chen, Z. The effect of completion strategy on fracture propagation from multiple cluster perforations in fossil hydrogen energy development. Int. J. Hydrogen Energy 2019, 44, 7168–7180. [Google Scholar] [CrossRef]
- Sobhaniaragh, B.; Mansur, W.J.; Peters, F.C. The role of stress interference in hydraulic fracturing of horizontal wells. Int. J. Rock Mech. Min. Sci. 2018, 106, 153–164. [Google Scholar] [CrossRef]
- Wu, K.; Olson, J.; Balhoff, M.T.; Yu, W. Numerical analysis for promoting uniform development of simultaneous multiple-fracture propagation in horizontal wells. SPE Prod. Oper. 2016, 32, 41–50. [Google Scholar] [CrossRef]
- Wu, K. Numerical Modelling of Complex Hydraulic Fracture Development in Unconventional Reservoirs. Ph.D. Thesis, The University of Texas at Austin, Austin, TX, USA, 2014. [Google Scholar]
- Wang, B. Research on Optimization Method of Heterogeneous Clustering Perforation in Heterogeneous Shale Rock. Ph.D. Thesis, China University of Petroleum, Beijing, China, 2021. [Google Scholar]
- Peirce, A.; Bunger, A. Interference fracturing: Nonuniform distributions of perforation clusters that promote simultaneous growth of multiple hydraulic fractures. SPE J. 2015, 20, 384–395. [Google Scholar] [CrossRef]
- Schlichting, H.; Shapiro, A.H. Boundary-layer theory, sixth edition. J. Appl. Mech. 1968, 35, 846. [Google Scholar] [CrossRef]
- Cheng, W.; Jiang, G.S.; Tian, H.; Zhu, Q. Numerical investigations of the fracture geometry and fluid distribution of multistage consecutive and alternative fracturing in a horizontal well. Comput. Geotech. 2017, 92, 41–56. [Google Scholar] [CrossRef]
- Tong, S.K.; Gao, D.L. Analysis of pressure and tip stress in hydraulic fracture under unstable fluid injection condition. China Pet. Mach. 2018, 46, 65–71. [Google Scholar]
- Wang, H.X. Principle of Hydraulic Fracturing; Petroleum Industry Press: Beijing, China, 1987; pp. 15–30. [Google Scholar]
- Hu, Z.X. Numerical Simulation Study and Application of Hydraulic Stimulation Process in Fractured Hot Dry Rocks. Ph.D. Thesis, Jilin University, Changchun, China, 2022. [Google Scholar]
- Liu, Y.; Xu, H.; Tang, D.; Mathews, J.P.; Zhai, Y.; Hou, W.; Li, S.; Tao, S.; Xiong, X.Y.; Wang, W. The impact of the coal macrolithotype on reservoir productivity, hydraulic fracture initiation and propagation. Fuel 2019, 239, 471–483. [Google Scholar] [CrossRef]


| Parameter | Value | Parameter | Value |
|---|---|---|---|
| σH | 95 MPa | H | 80 m |
| σh | 85 MPa | μ | 3 mPa·s |
| E | 51 GPa | n | 1 |
| V | 0.25 | Q | 18 m3/min |
| T | 10 MPa | CL | 0.03 cm/min0.5 |
| Category | Parameter | Value | Unit |
|---|---|---|---|
| Mechanical parameters | Density, D | 2500 | kg/m3 |
| Tensile strength, TO | 6.0 | MPa | |
| Cohesion, c | 12 | MPa | |
| Friction angle, φ | 35 | ° | |
| Young’s modulus, E | 45.6 | GPa | |
| Poisson’s ratio | 0.24 | ||
| Friction coefficient, μ | 0.21 | ||
| Reservoir parameters | Reservoir temperature | 112 | °C |
| Pore pressure | 72.5 | MPa | |
| Porosity | 4.6 | % | |
| In-situ stress | Maximum horizontal principal, SH | 95 | MPa |
| Minimum horizontal principal, Sh | 85 | MPa | |
| Vertical principal, Sv | 90 | MPa |
| Scheme Number | Simulation Scheme | Number of Perforations | Diameter/m | Number of Perforations from Toe to Heel | |
|---|---|---|---|---|---|
| 1 | Perforation method | Uniform perforations | 48 | 0.01 | 8-8-8-8-8-8 |
| 2 | Spindle-shaped perforations | 48 | 0.01 | 5-8-11-11-8-5 | |
| 3 | Trapezoidal perforations | 48 | 0.01 | 13-11-9-7-5-3 | |
| Well Number | Fracturing Stage | Pressure Increase/MPa | FDI Types |
|---|---|---|---|
| M507H10-2 | 1 | 2.71 | Stress-Dominated |
| 3 | 14.95 | NF–Stress Synergy | |
| 7 | 6.8 | NF-Dominated | |
| 12 | 6.23 | NF-Dominated | |
| 16 | 5.6 | NF-Dominated | |
| 17 | 2.8 | Stress-Dominated |
Disclaimer/Publisher’s Note: The statements, opinions and data contained in all publications are solely those of the individual author(s) and contributor(s) and not of MDPI and/or the editor(s). MDPI and/or the editor(s) disclaim responsibility for any injury to people or property resulting from any ideas, methods, instructions or products referred to in the content. |
© 2025 by the authors. Licensee MDPI, Basel, Switzerland. This article is an open access article distributed under the terms and conditions of the Creative Commons Attribution (CC BY) license (https://creativecommons.org/licenses/by/4.0/).
Share and Cite
Wen, G.; Zhao, W.; Zou, H.; Huang, Y.; Liu, Y.; Liu, Y.; Zhao, Z.; Wang, C. Optimizing Multi-Cluster Fracture Propagation and Mitigating Interference Through Advanced Non-Uniform Perforation Design in Shale Gas Horizontal Wells. Processes 2025, 13, 2461. https://doi.org/10.3390/pr13082461
Wen G, Zhao W, Zou H, Huang Y, Liu Y, Liu Y, Zhao Z, Wang C. Optimizing Multi-Cluster Fracture Propagation and Mitigating Interference Through Advanced Non-Uniform Perforation Design in Shale Gas Horizontal Wells. Processes. 2025; 13(8):2461. https://doi.org/10.3390/pr13082461
Chicago/Turabian StyleWen, Guo, Wentao Zhao, Hongjiang Zou, Yongbin Huang, Yanchi Liu, Yulong Liu, Zhongcong Zhao, and Chenyang Wang. 2025. "Optimizing Multi-Cluster Fracture Propagation and Mitigating Interference Through Advanced Non-Uniform Perforation Design in Shale Gas Horizontal Wells" Processes 13, no. 8: 2461. https://doi.org/10.3390/pr13082461
APA StyleWen, G., Zhao, W., Zou, H., Huang, Y., Liu, Y., Liu, Y., Zhao, Z., & Wang, C. (2025). Optimizing Multi-Cluster Fracture Propagation and Mitigating Interference Through Advanced Non-Uniform Perforation Design in Shale Gas Horizontal Wells. Processes, 13(8), 2461. https://doi.org/10.3390/pr13082461