
Geochemical Characteristics and Controlling Factors of Lower Cretaceous Lacustrine Hydrocarbon Source Rocks in the Erdengsumu Sag, Erlian Basin, NE China

 ,
,
Abstract
1. Introduction
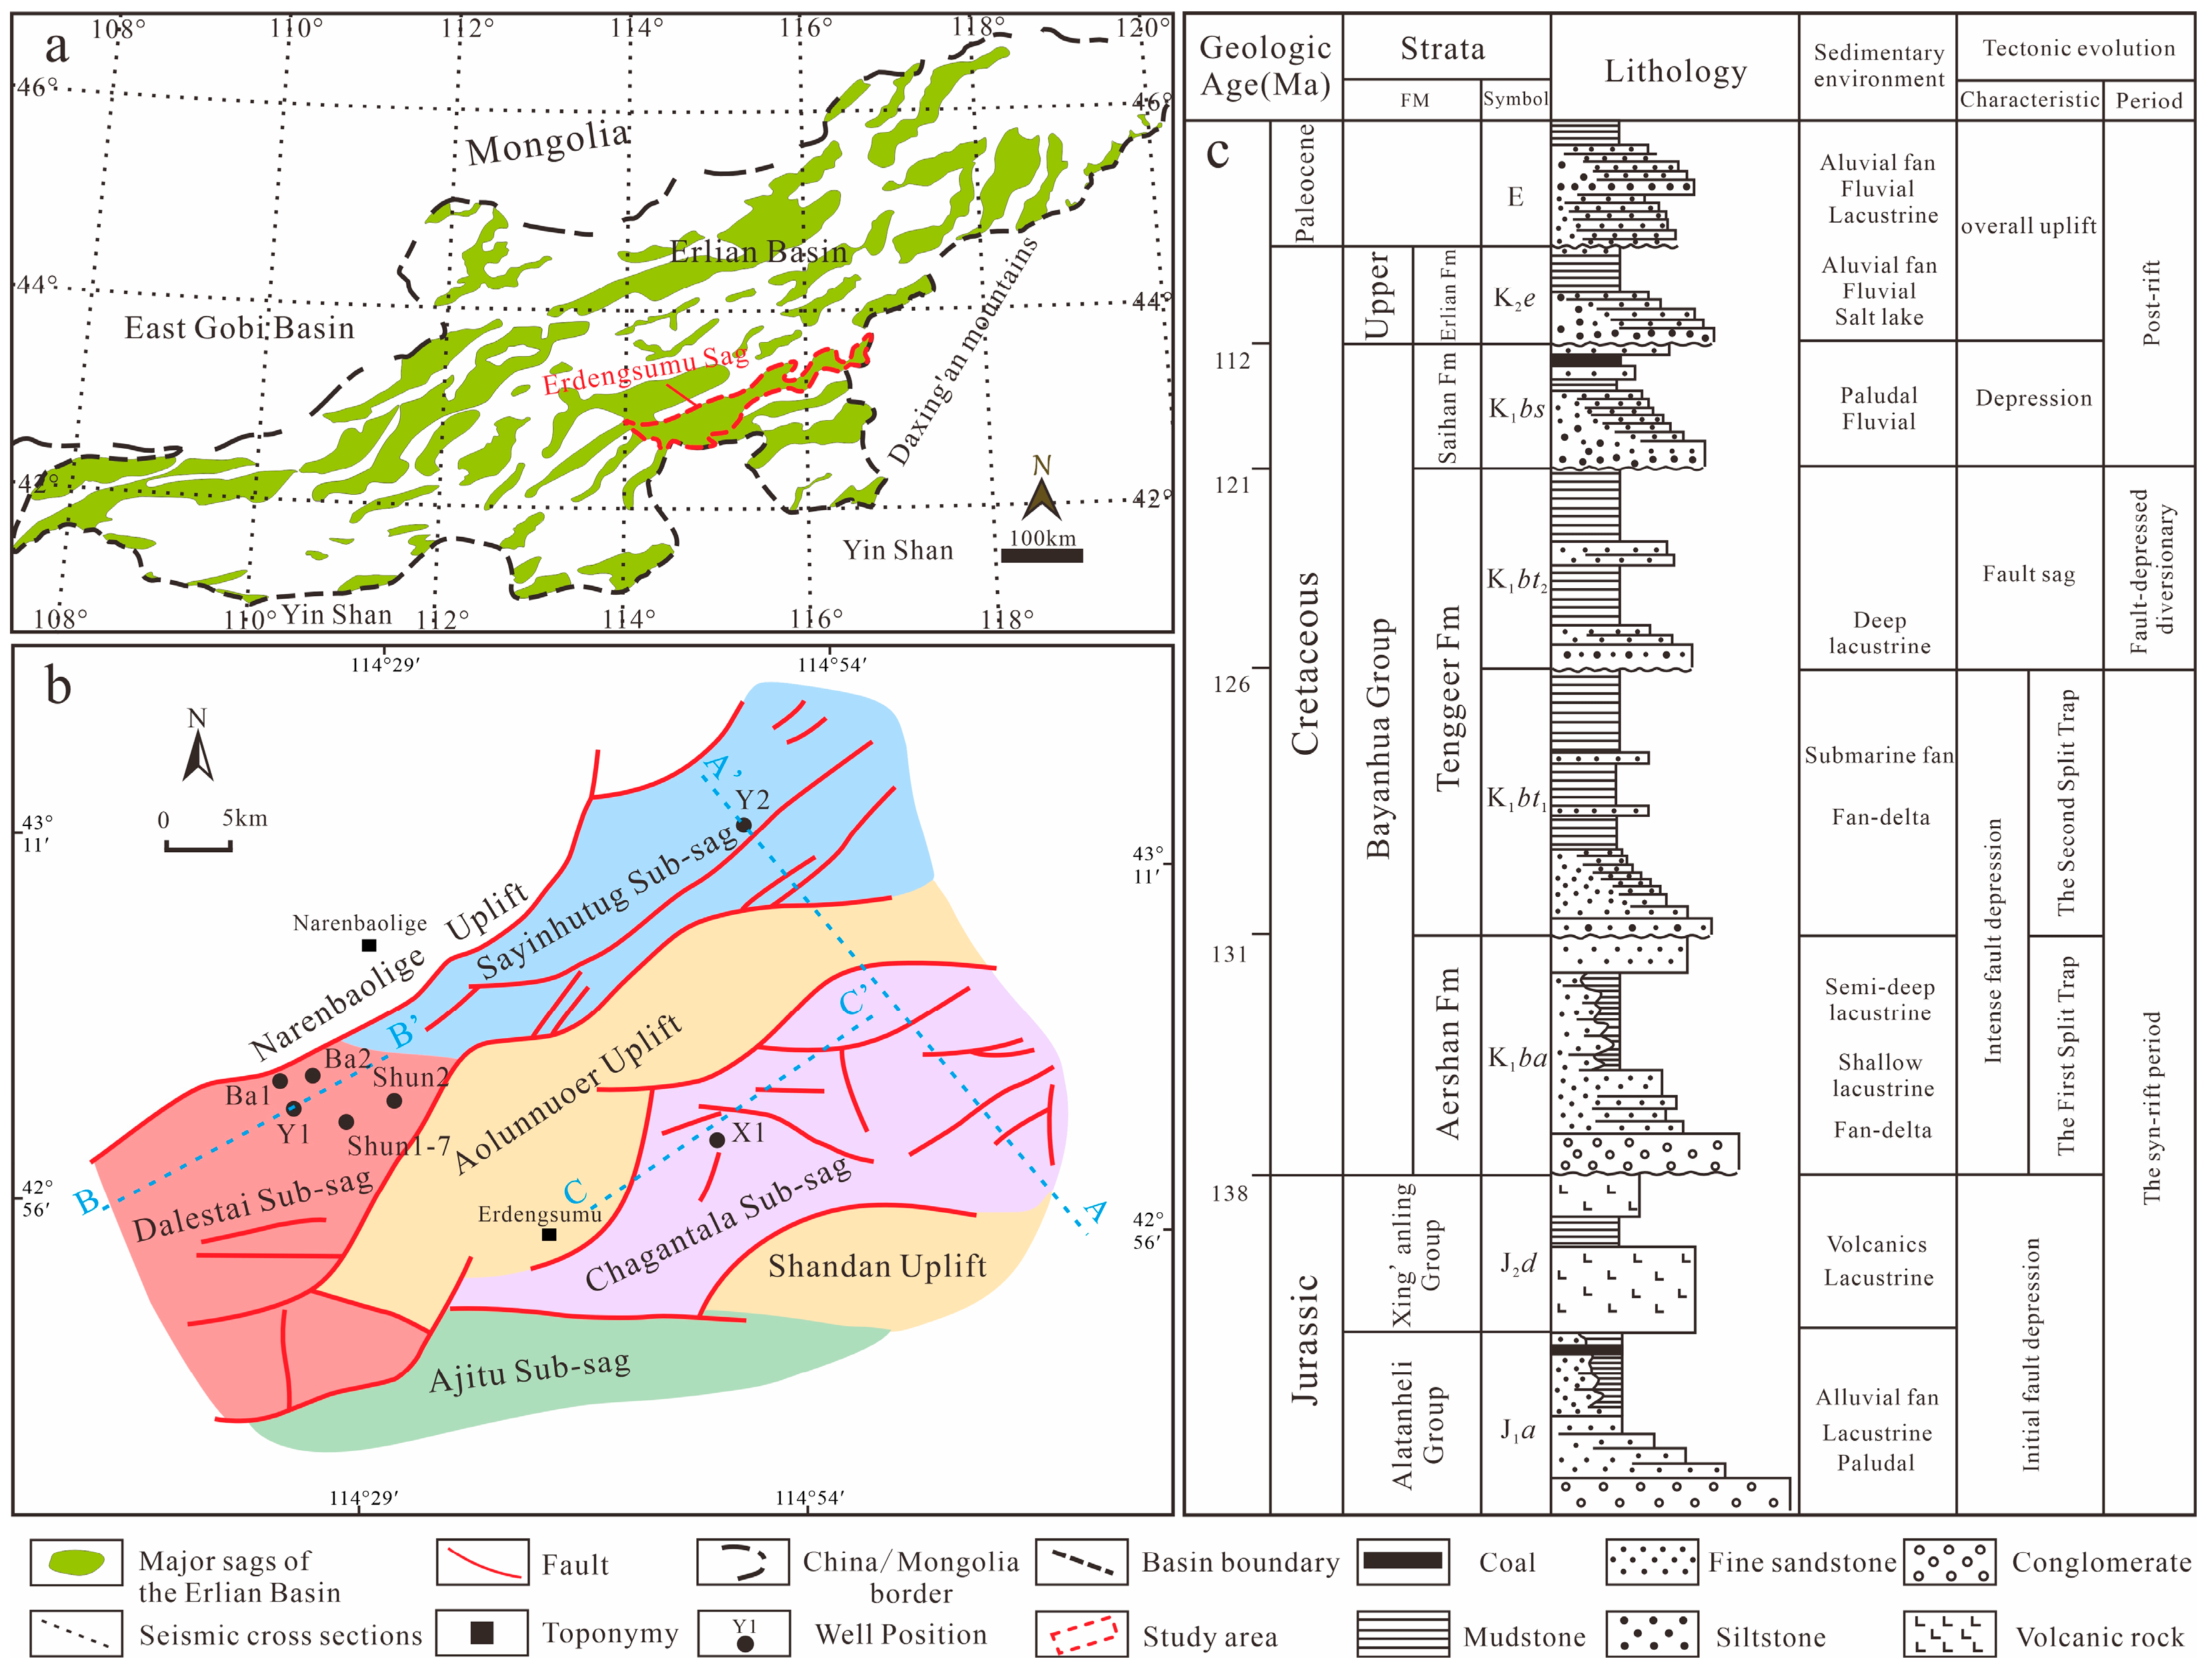
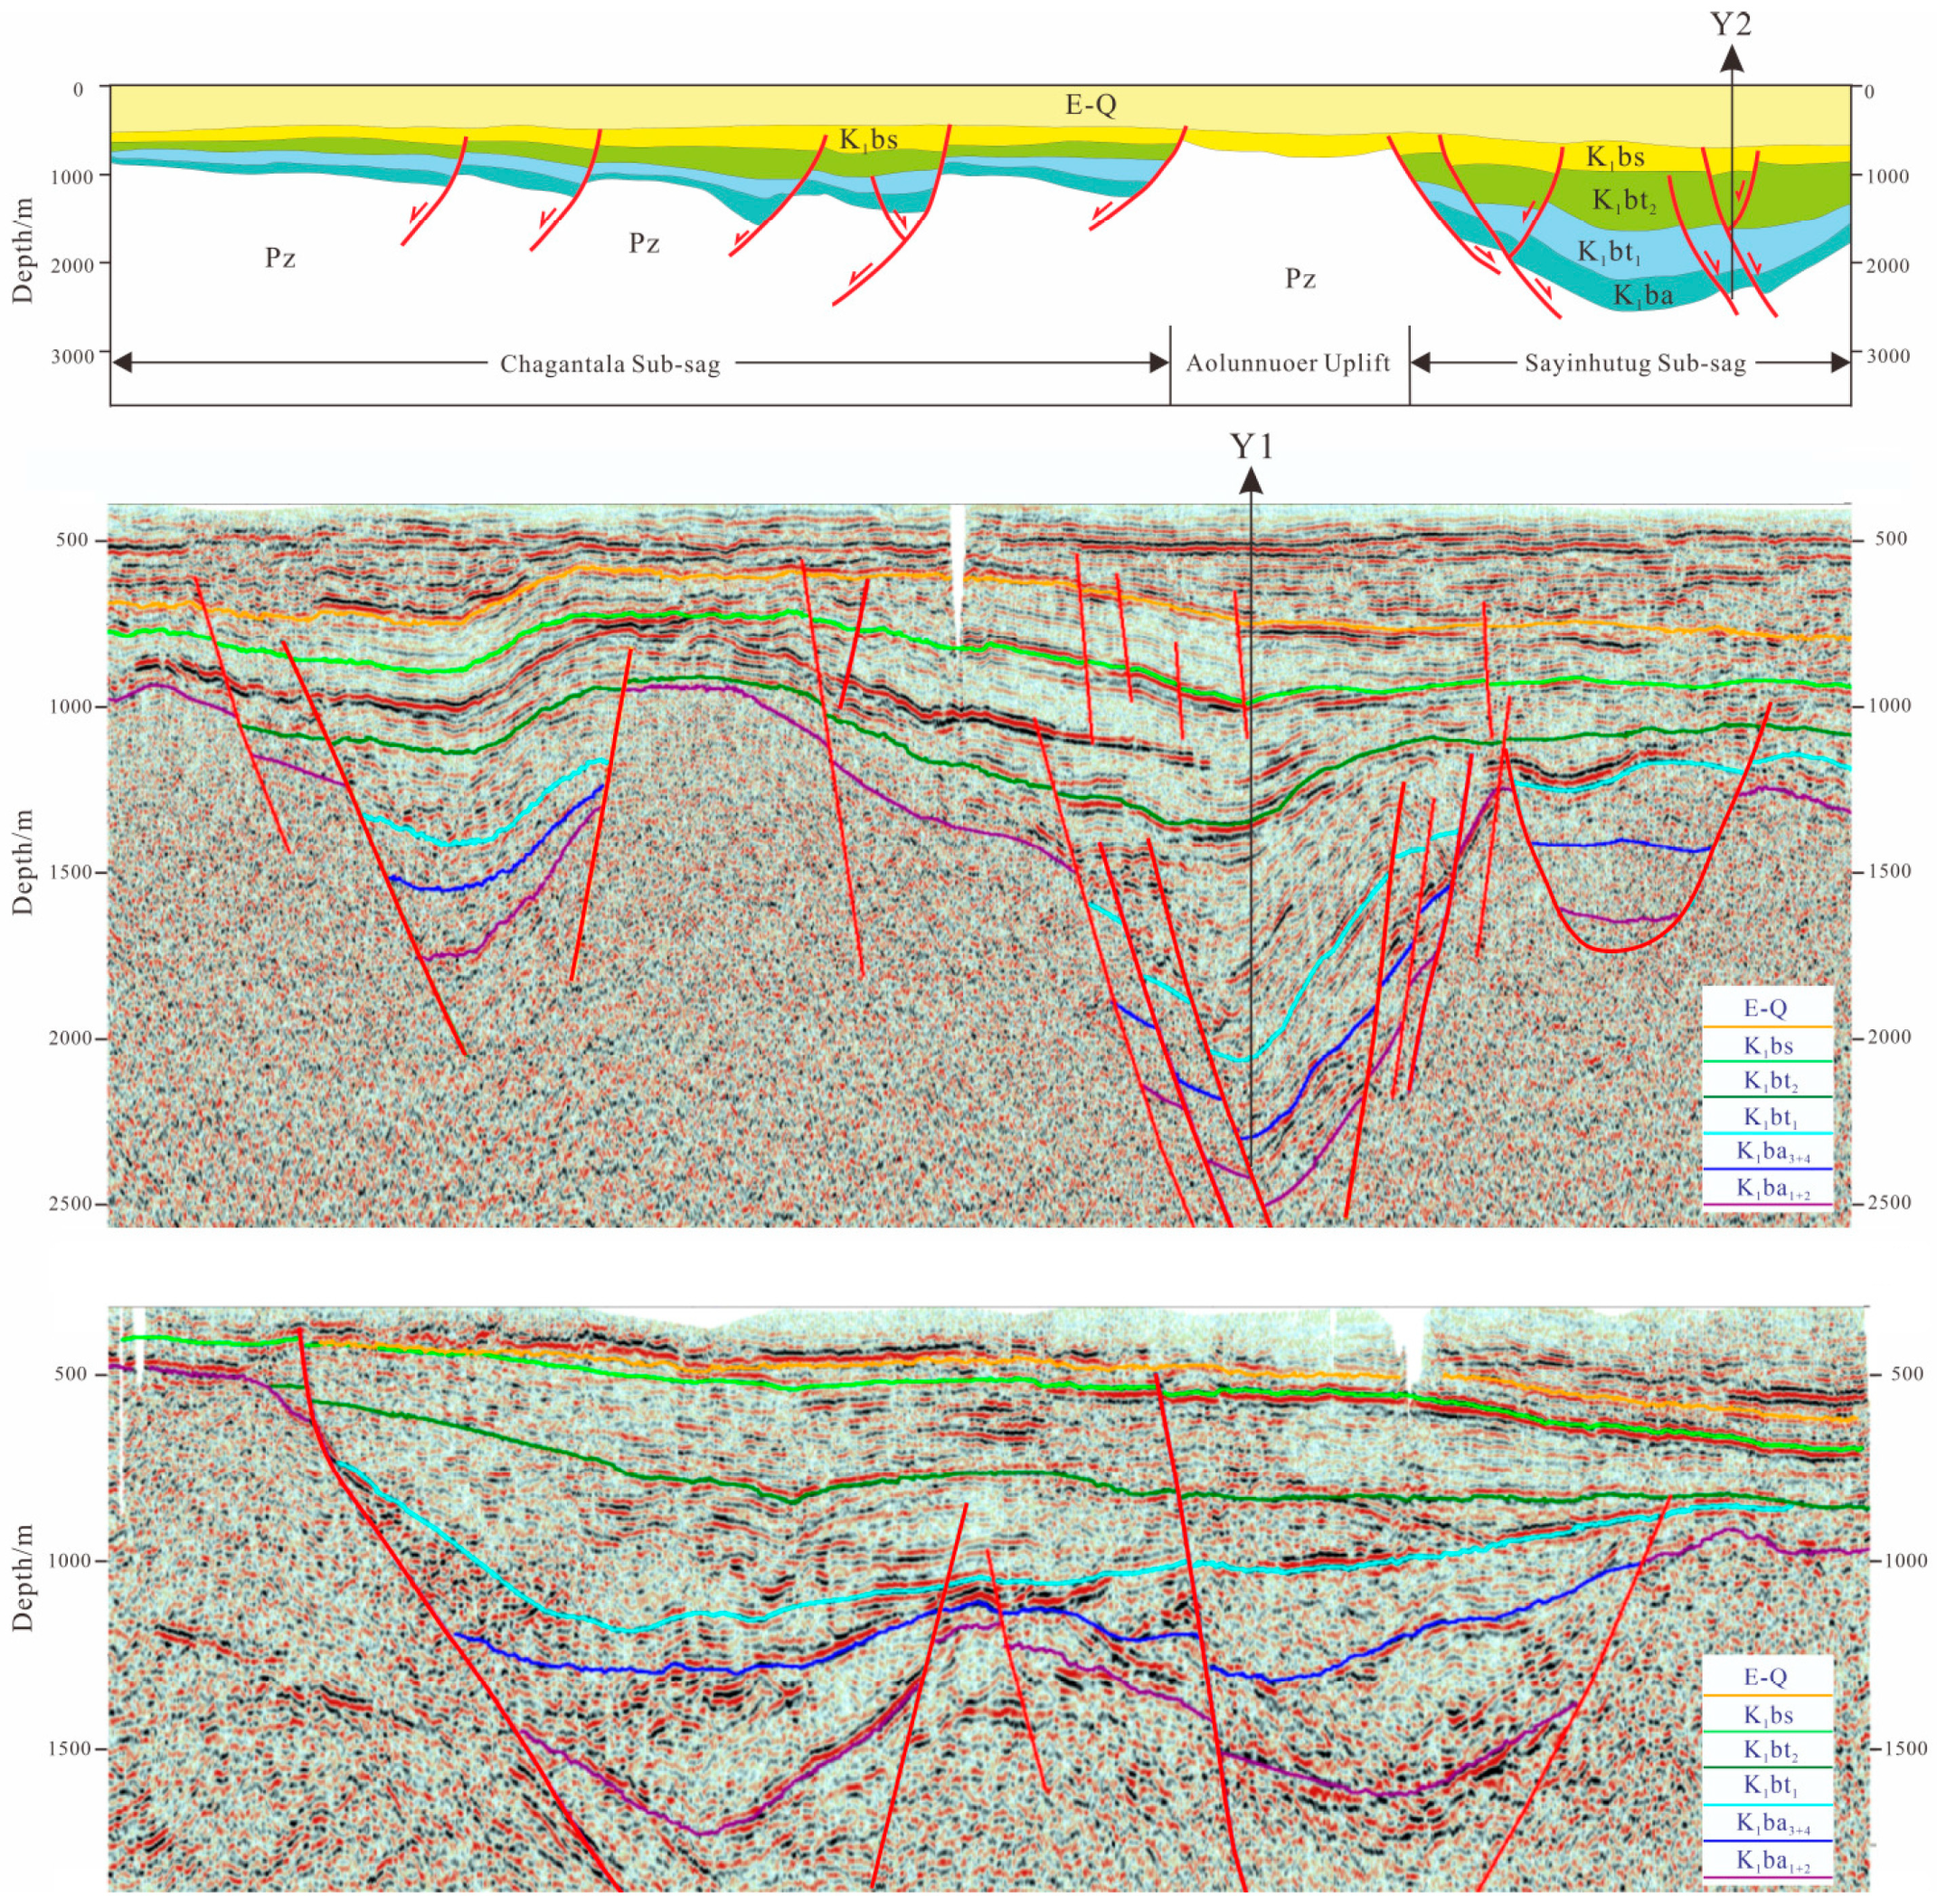
2. Geological Setting
3. Materials and Methods
4. Results
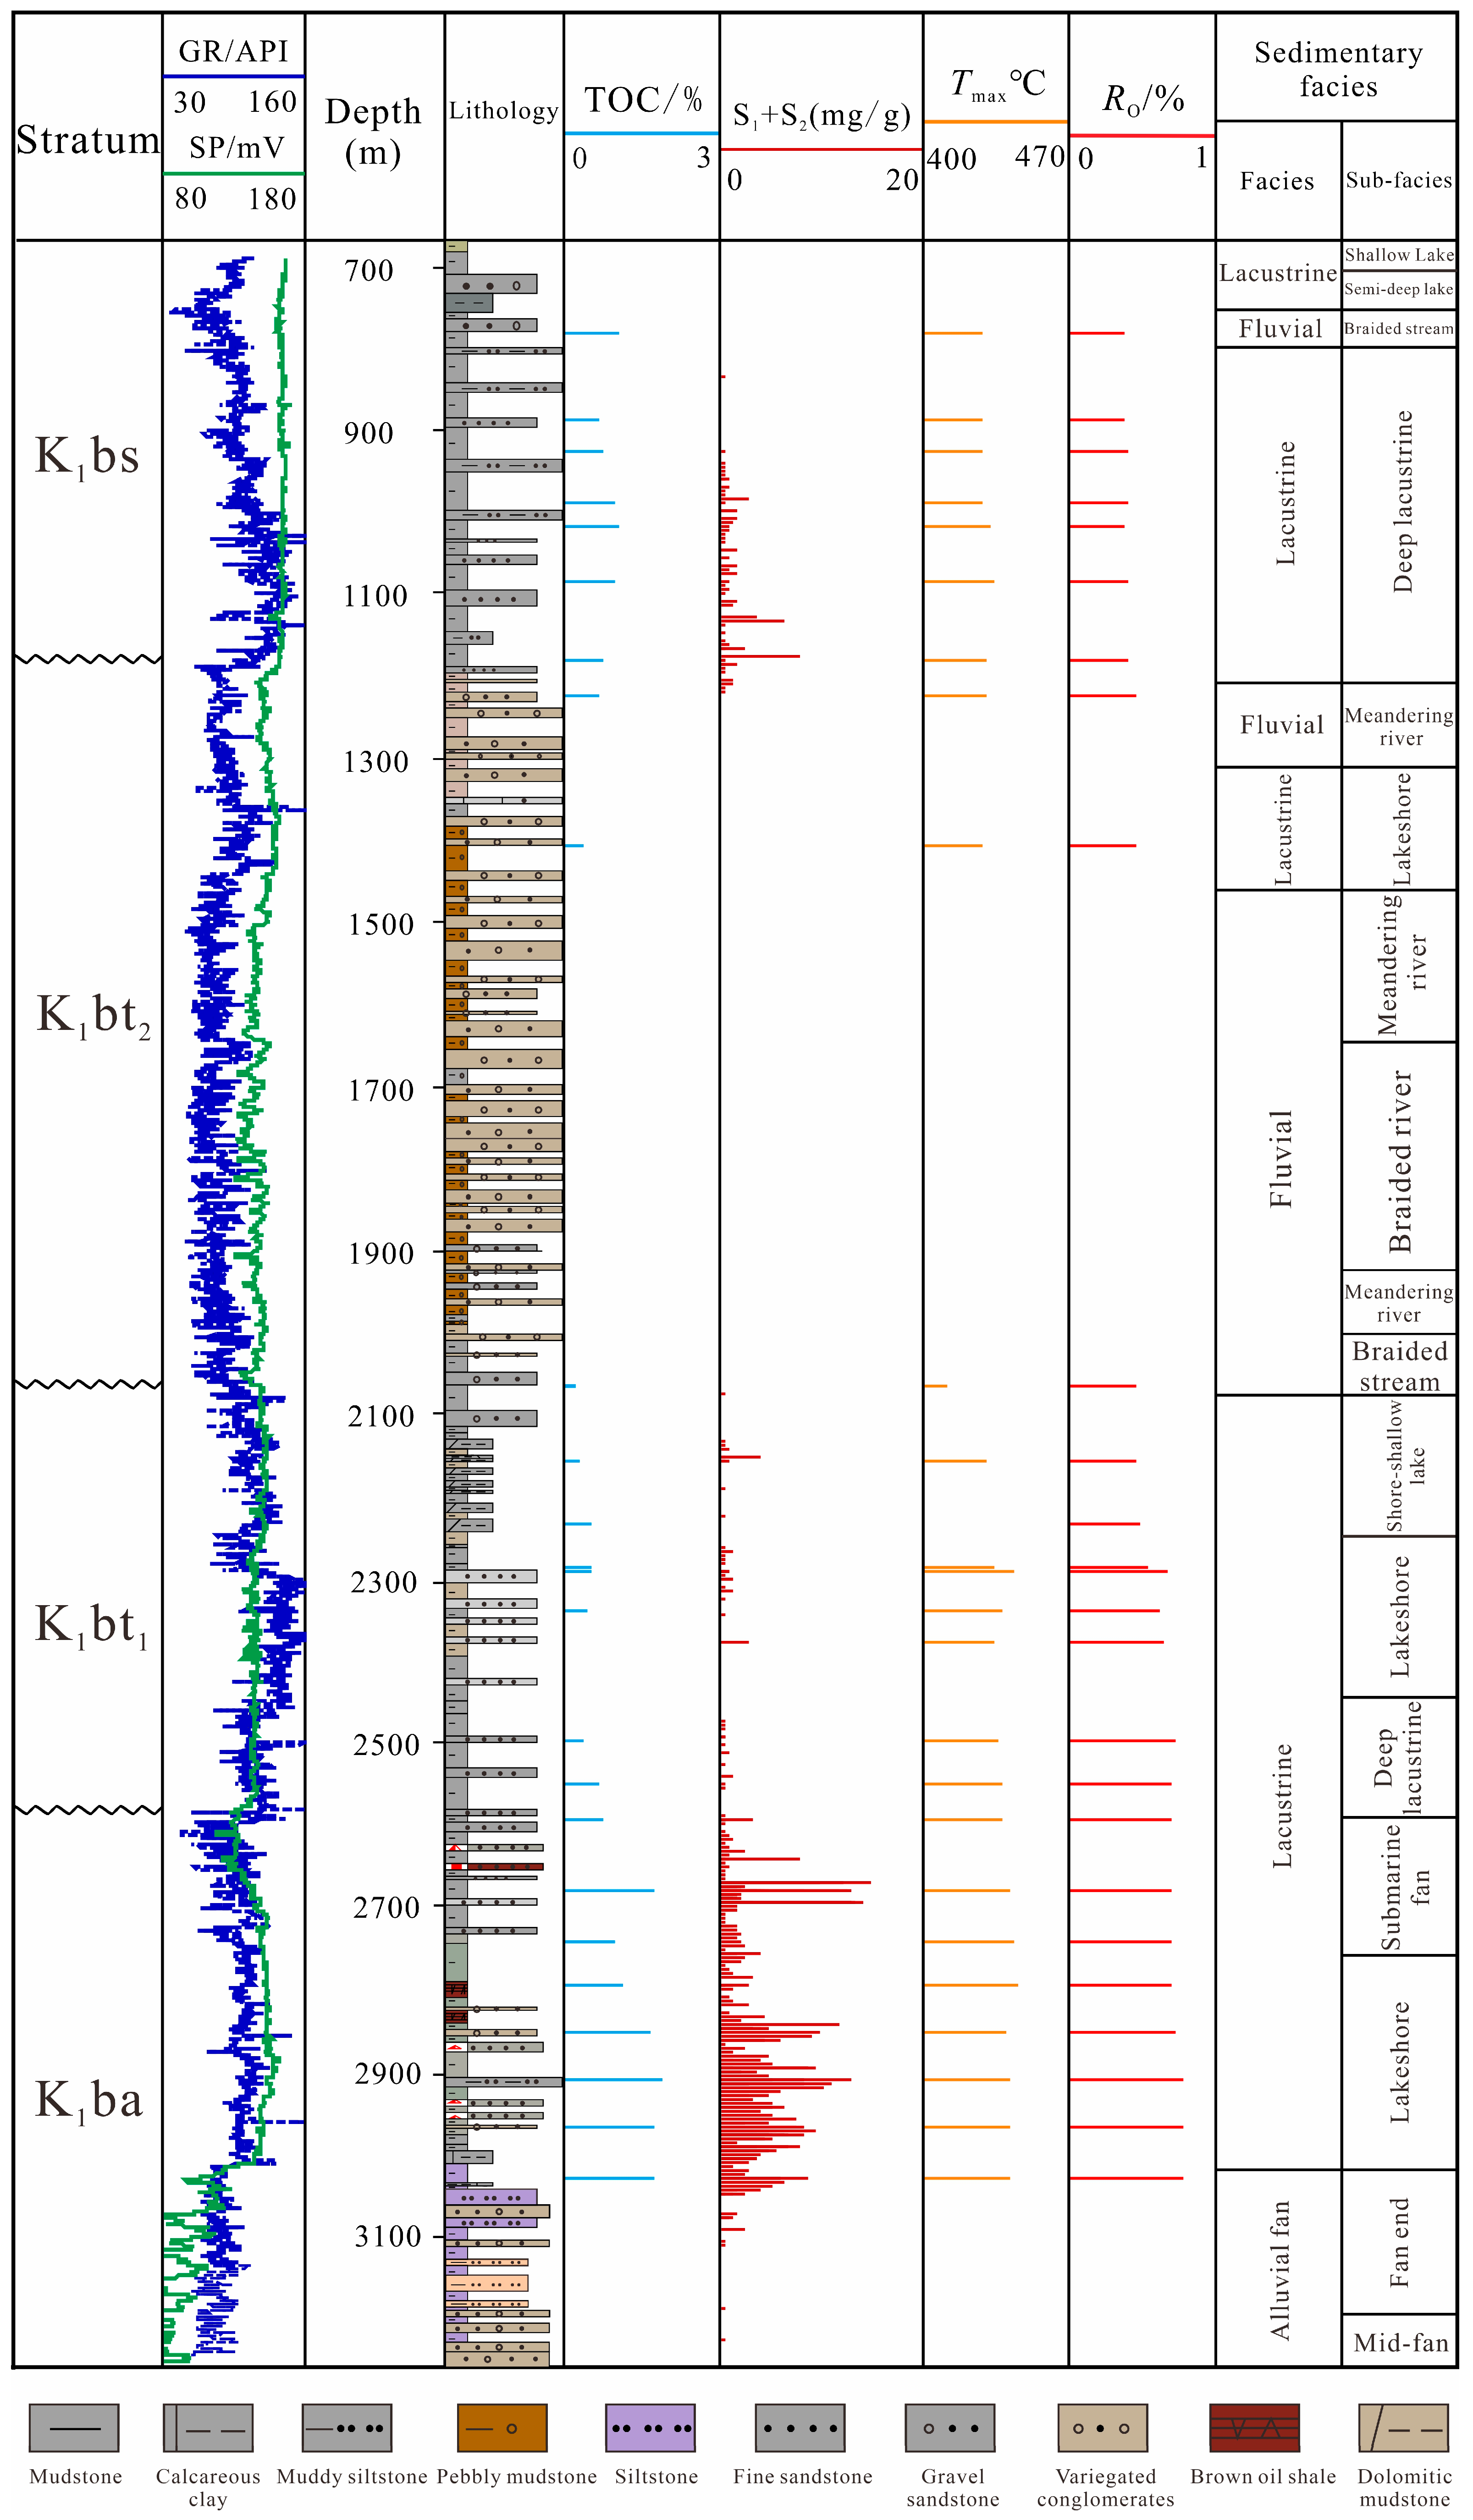
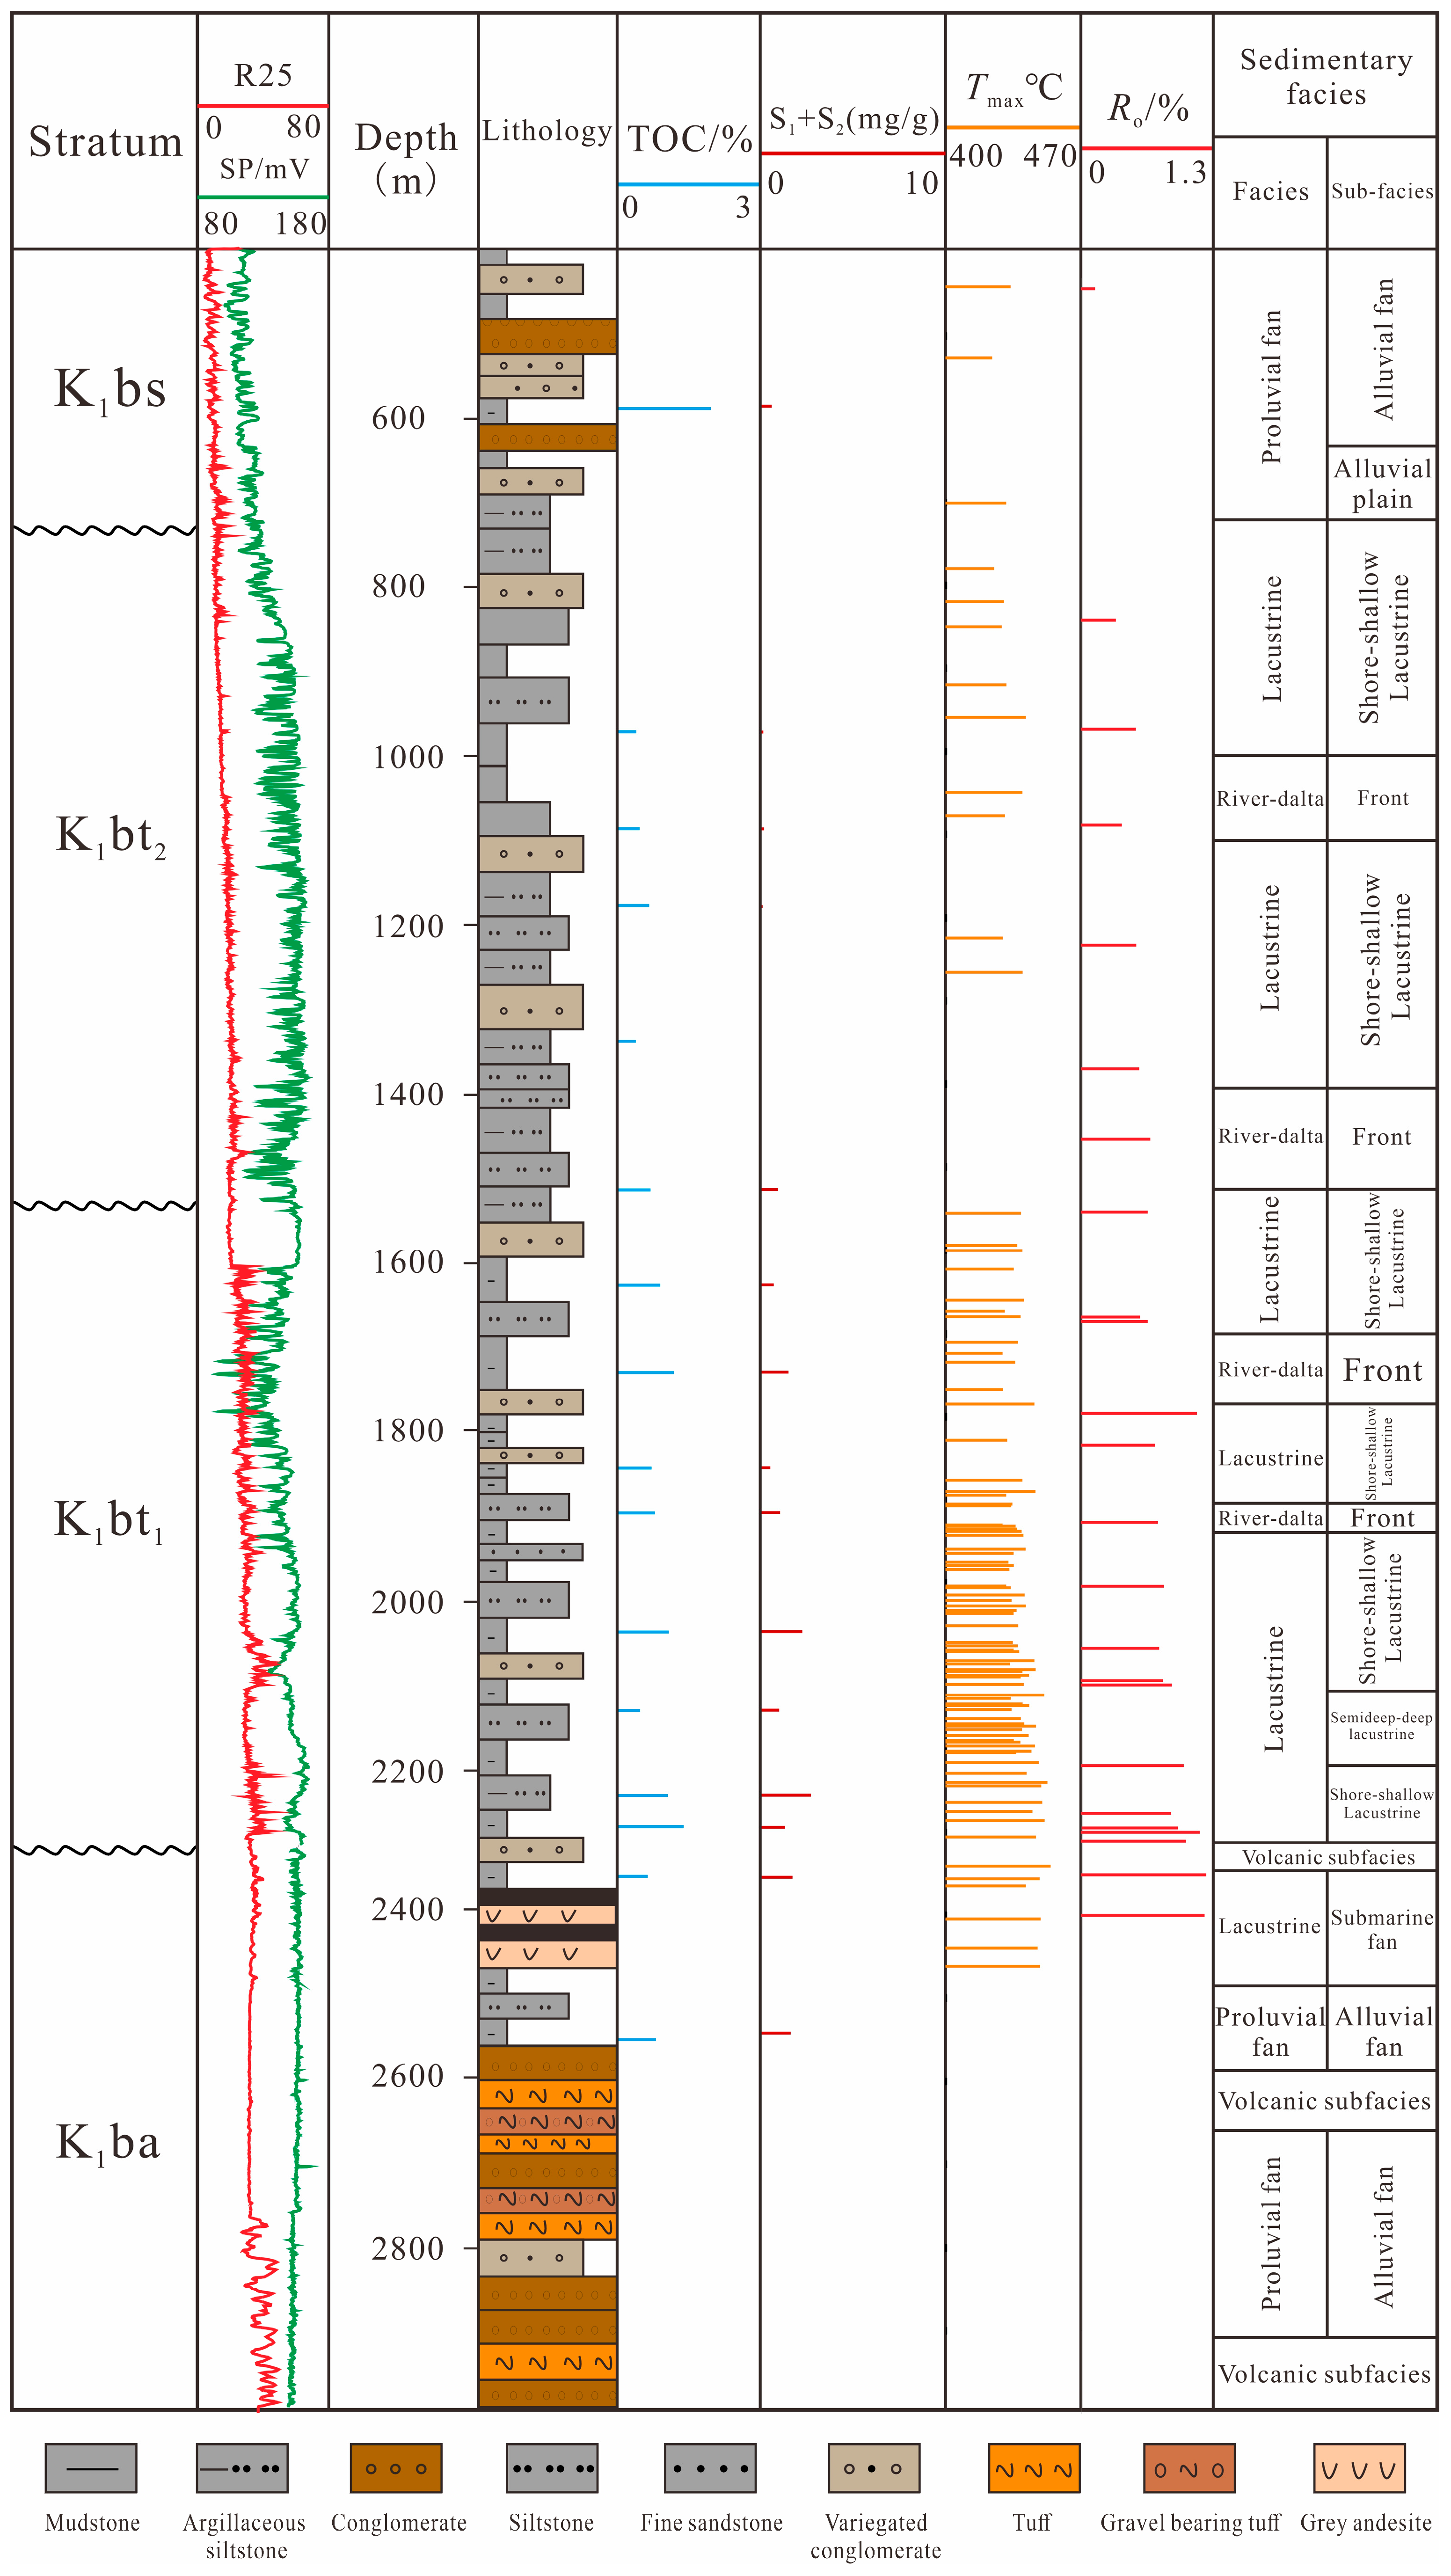
4.1. Source Rock Geology
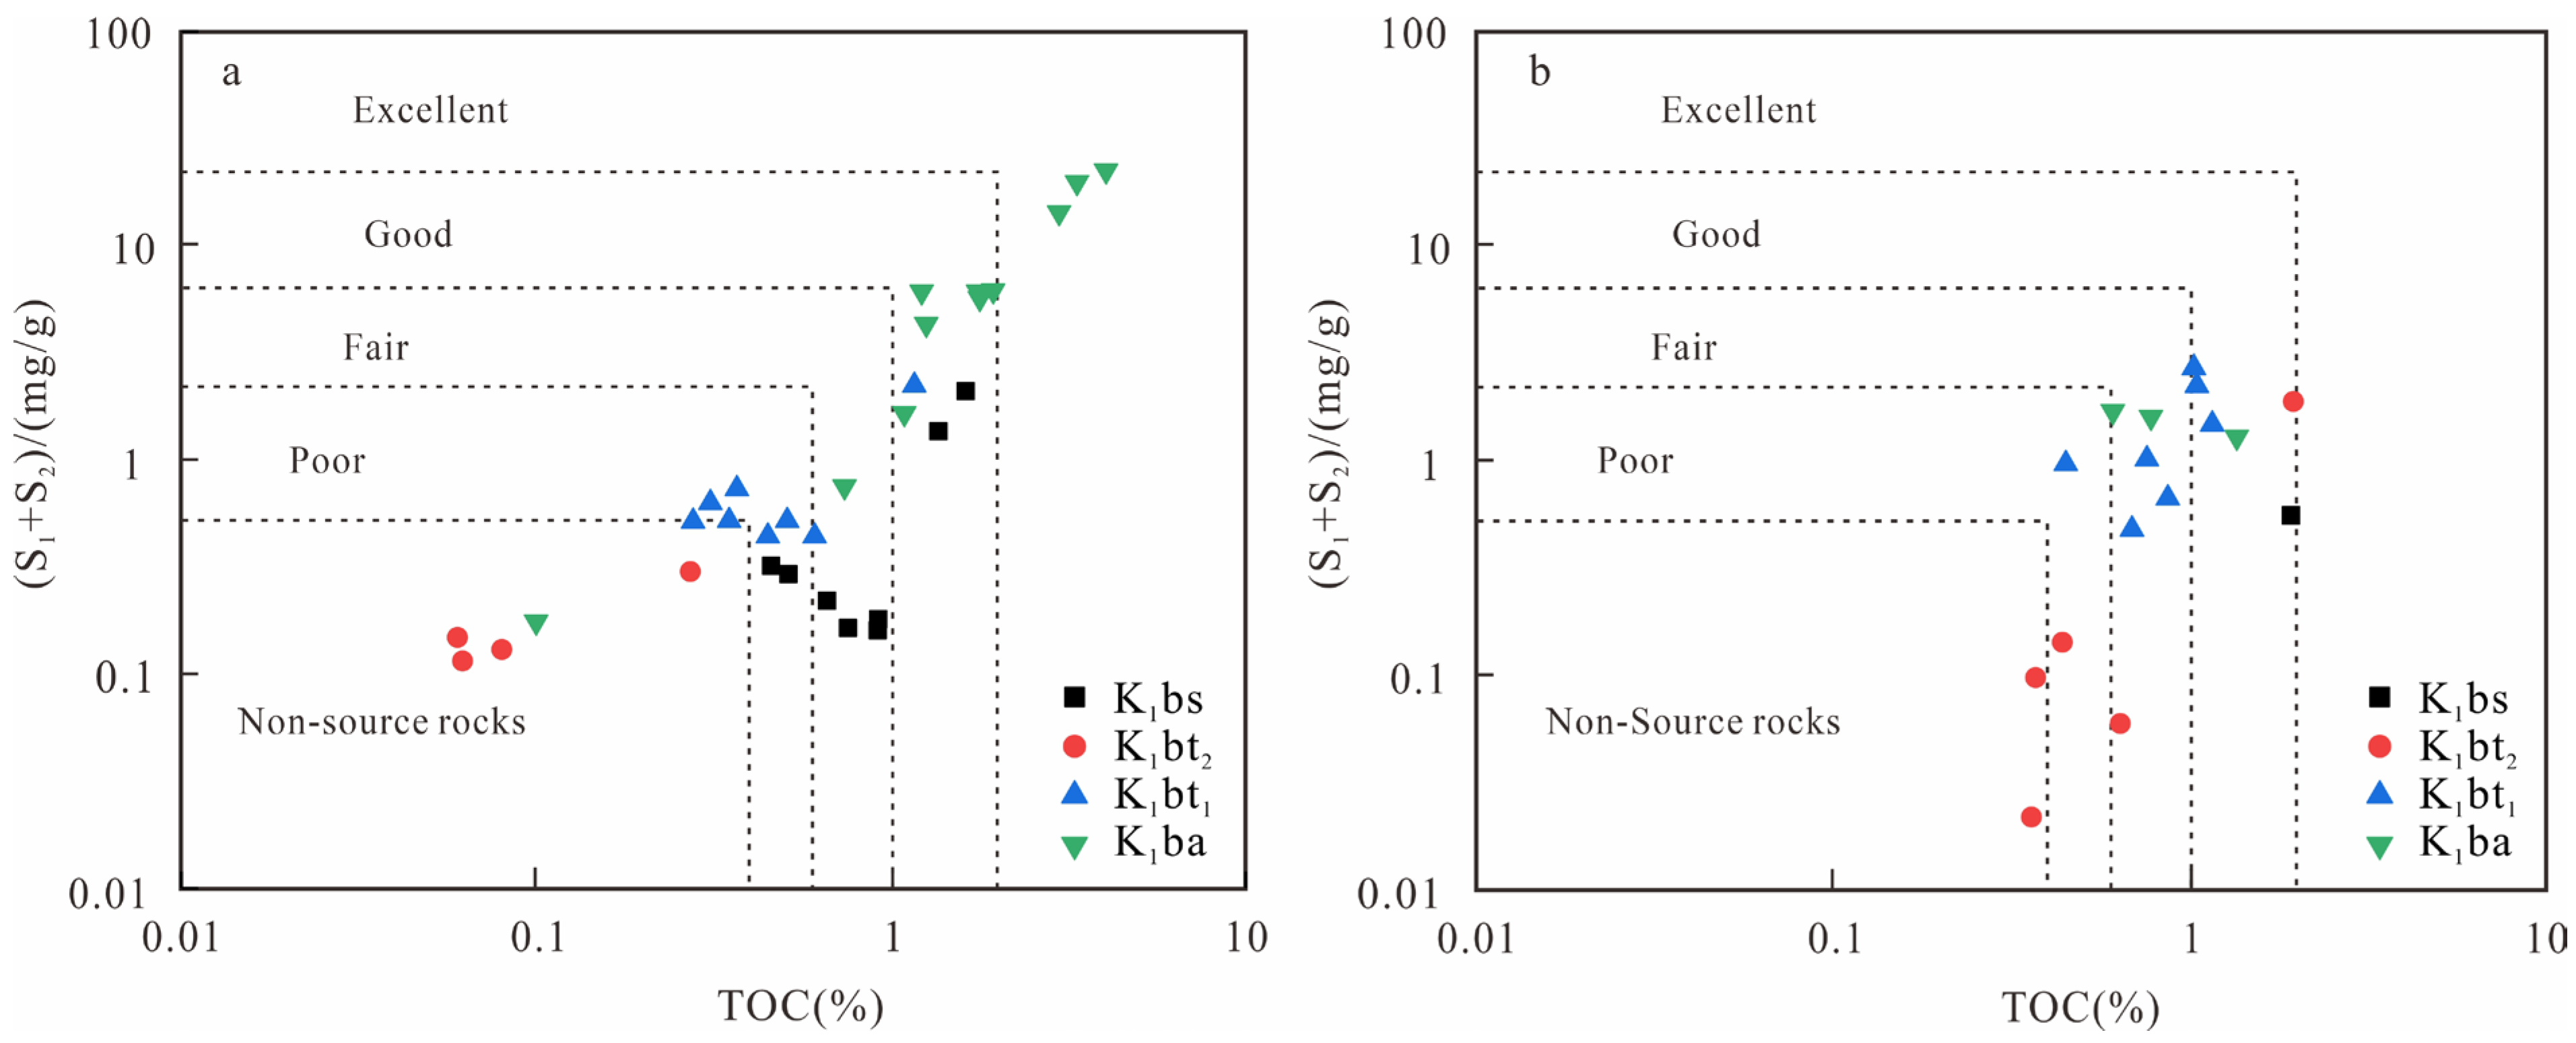
4.2. TOC and “S1 + S2”
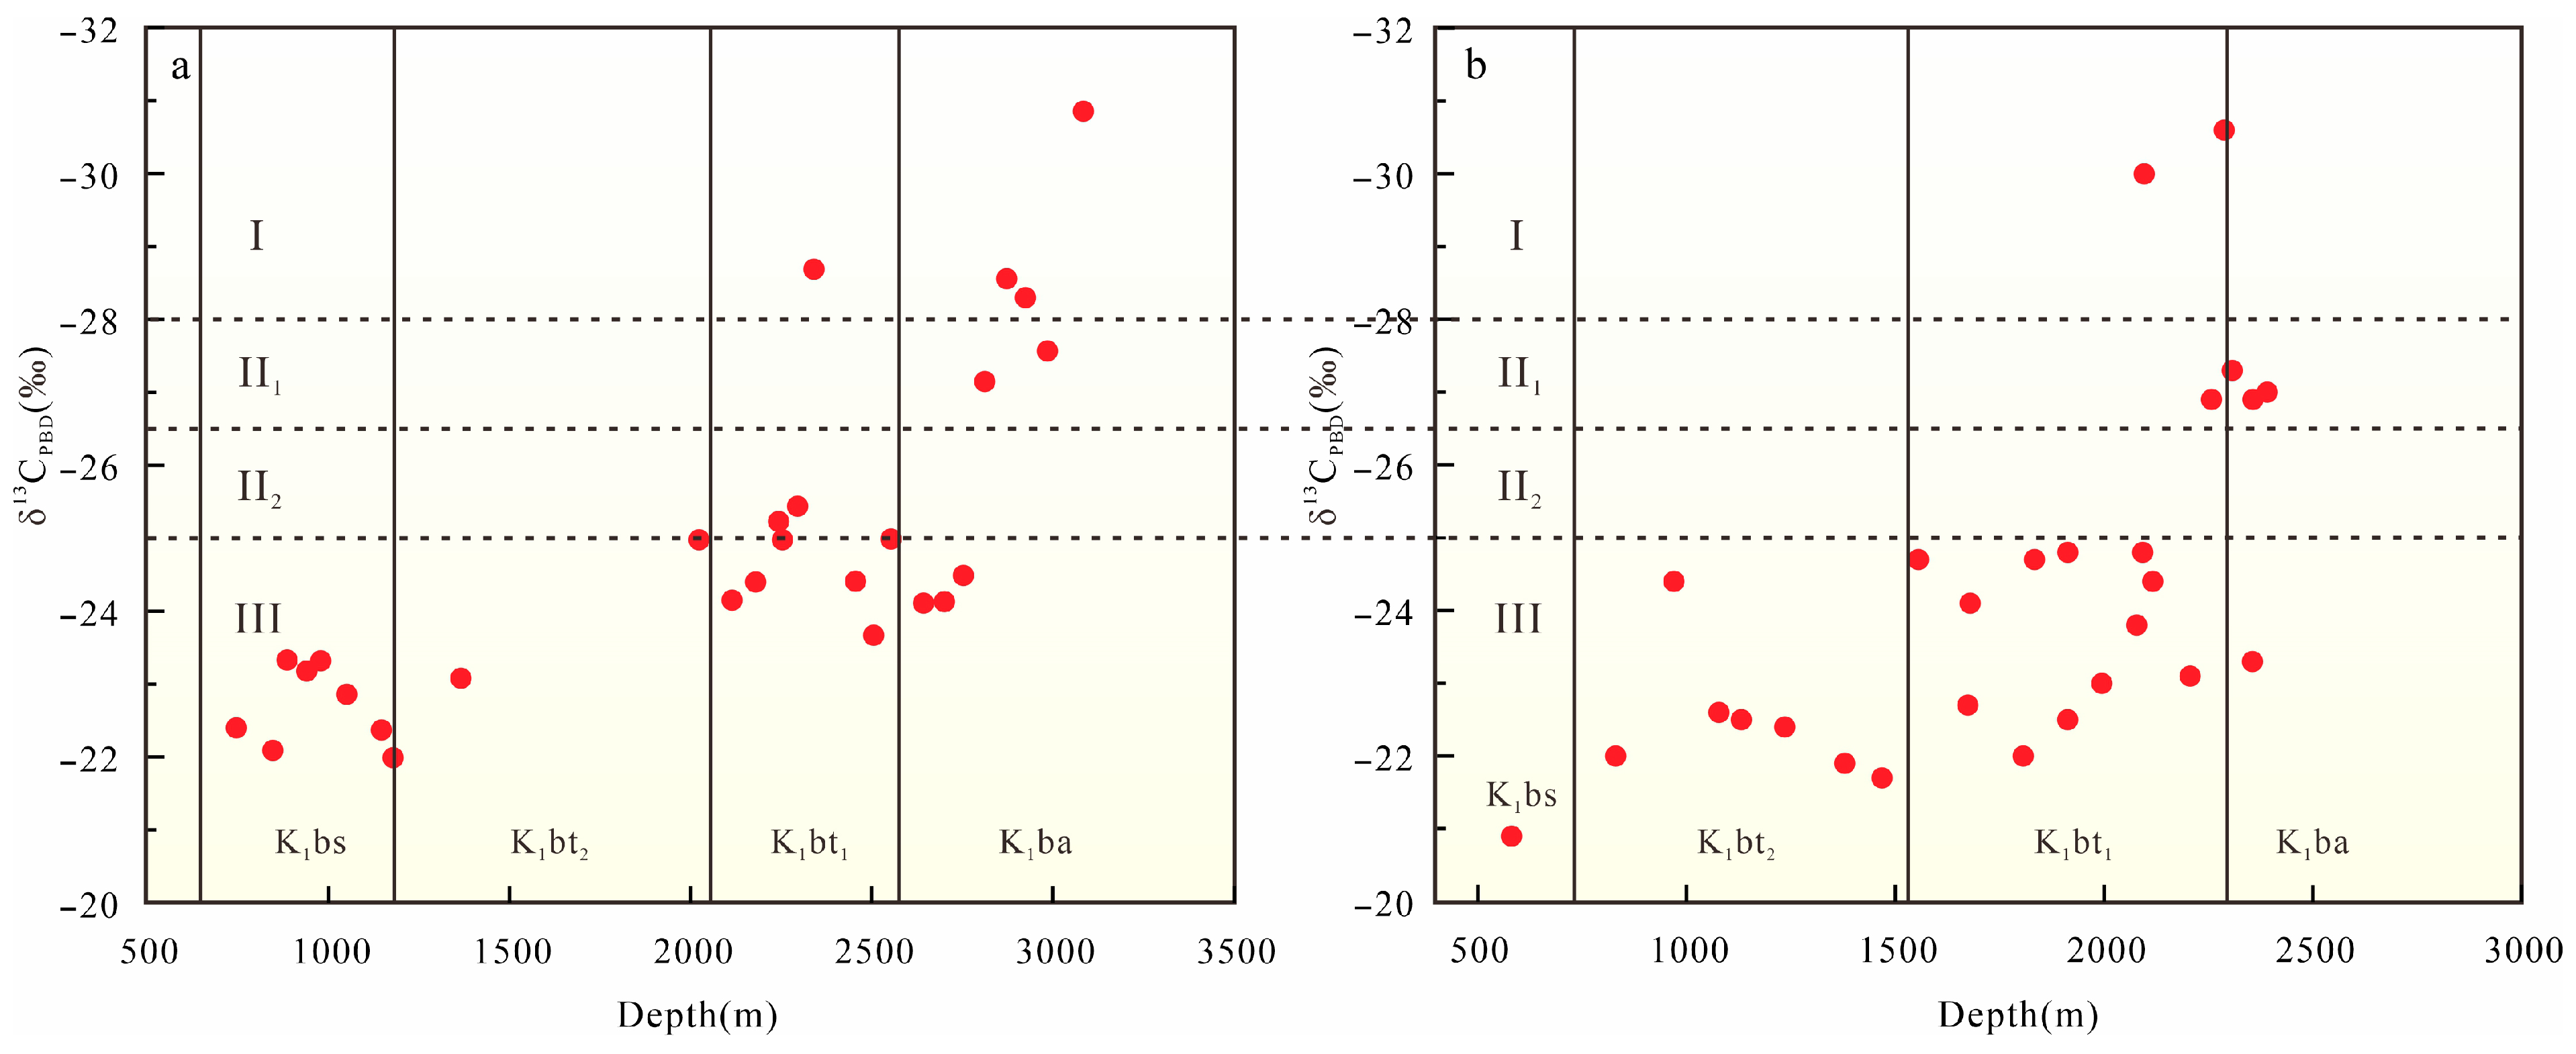
4.3. Results of δ13CPDB
4.4. Rock-Eval Pyrolysis and Kerogen Type
4.5. Organic Matter Maturity
4.6. Molecular Geochemistry of Organic Matter
4.6.1. n-Alkanes
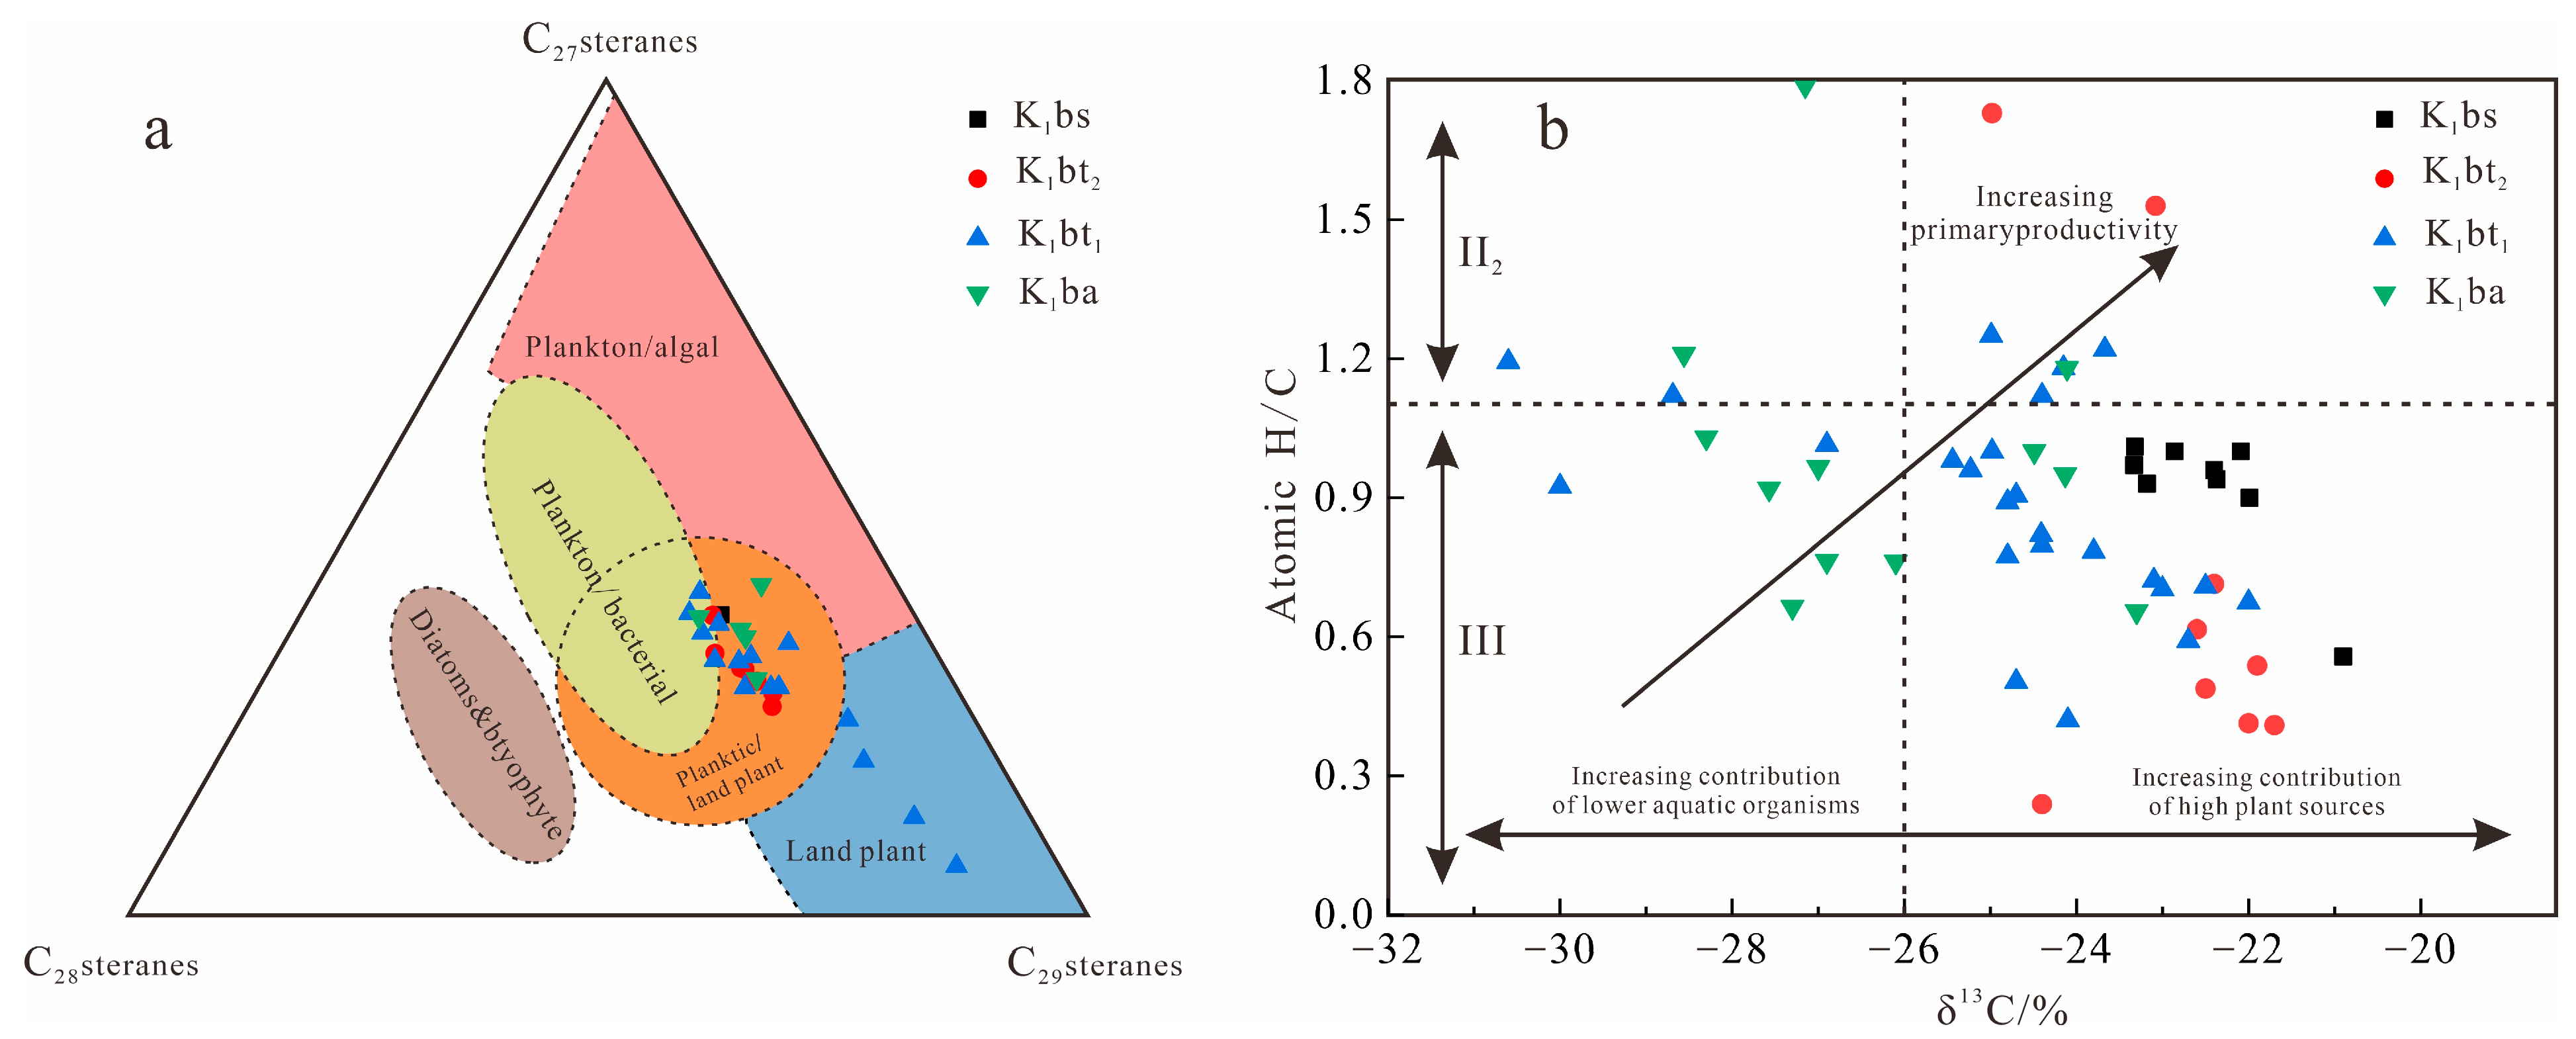
4.6.2. Steranes
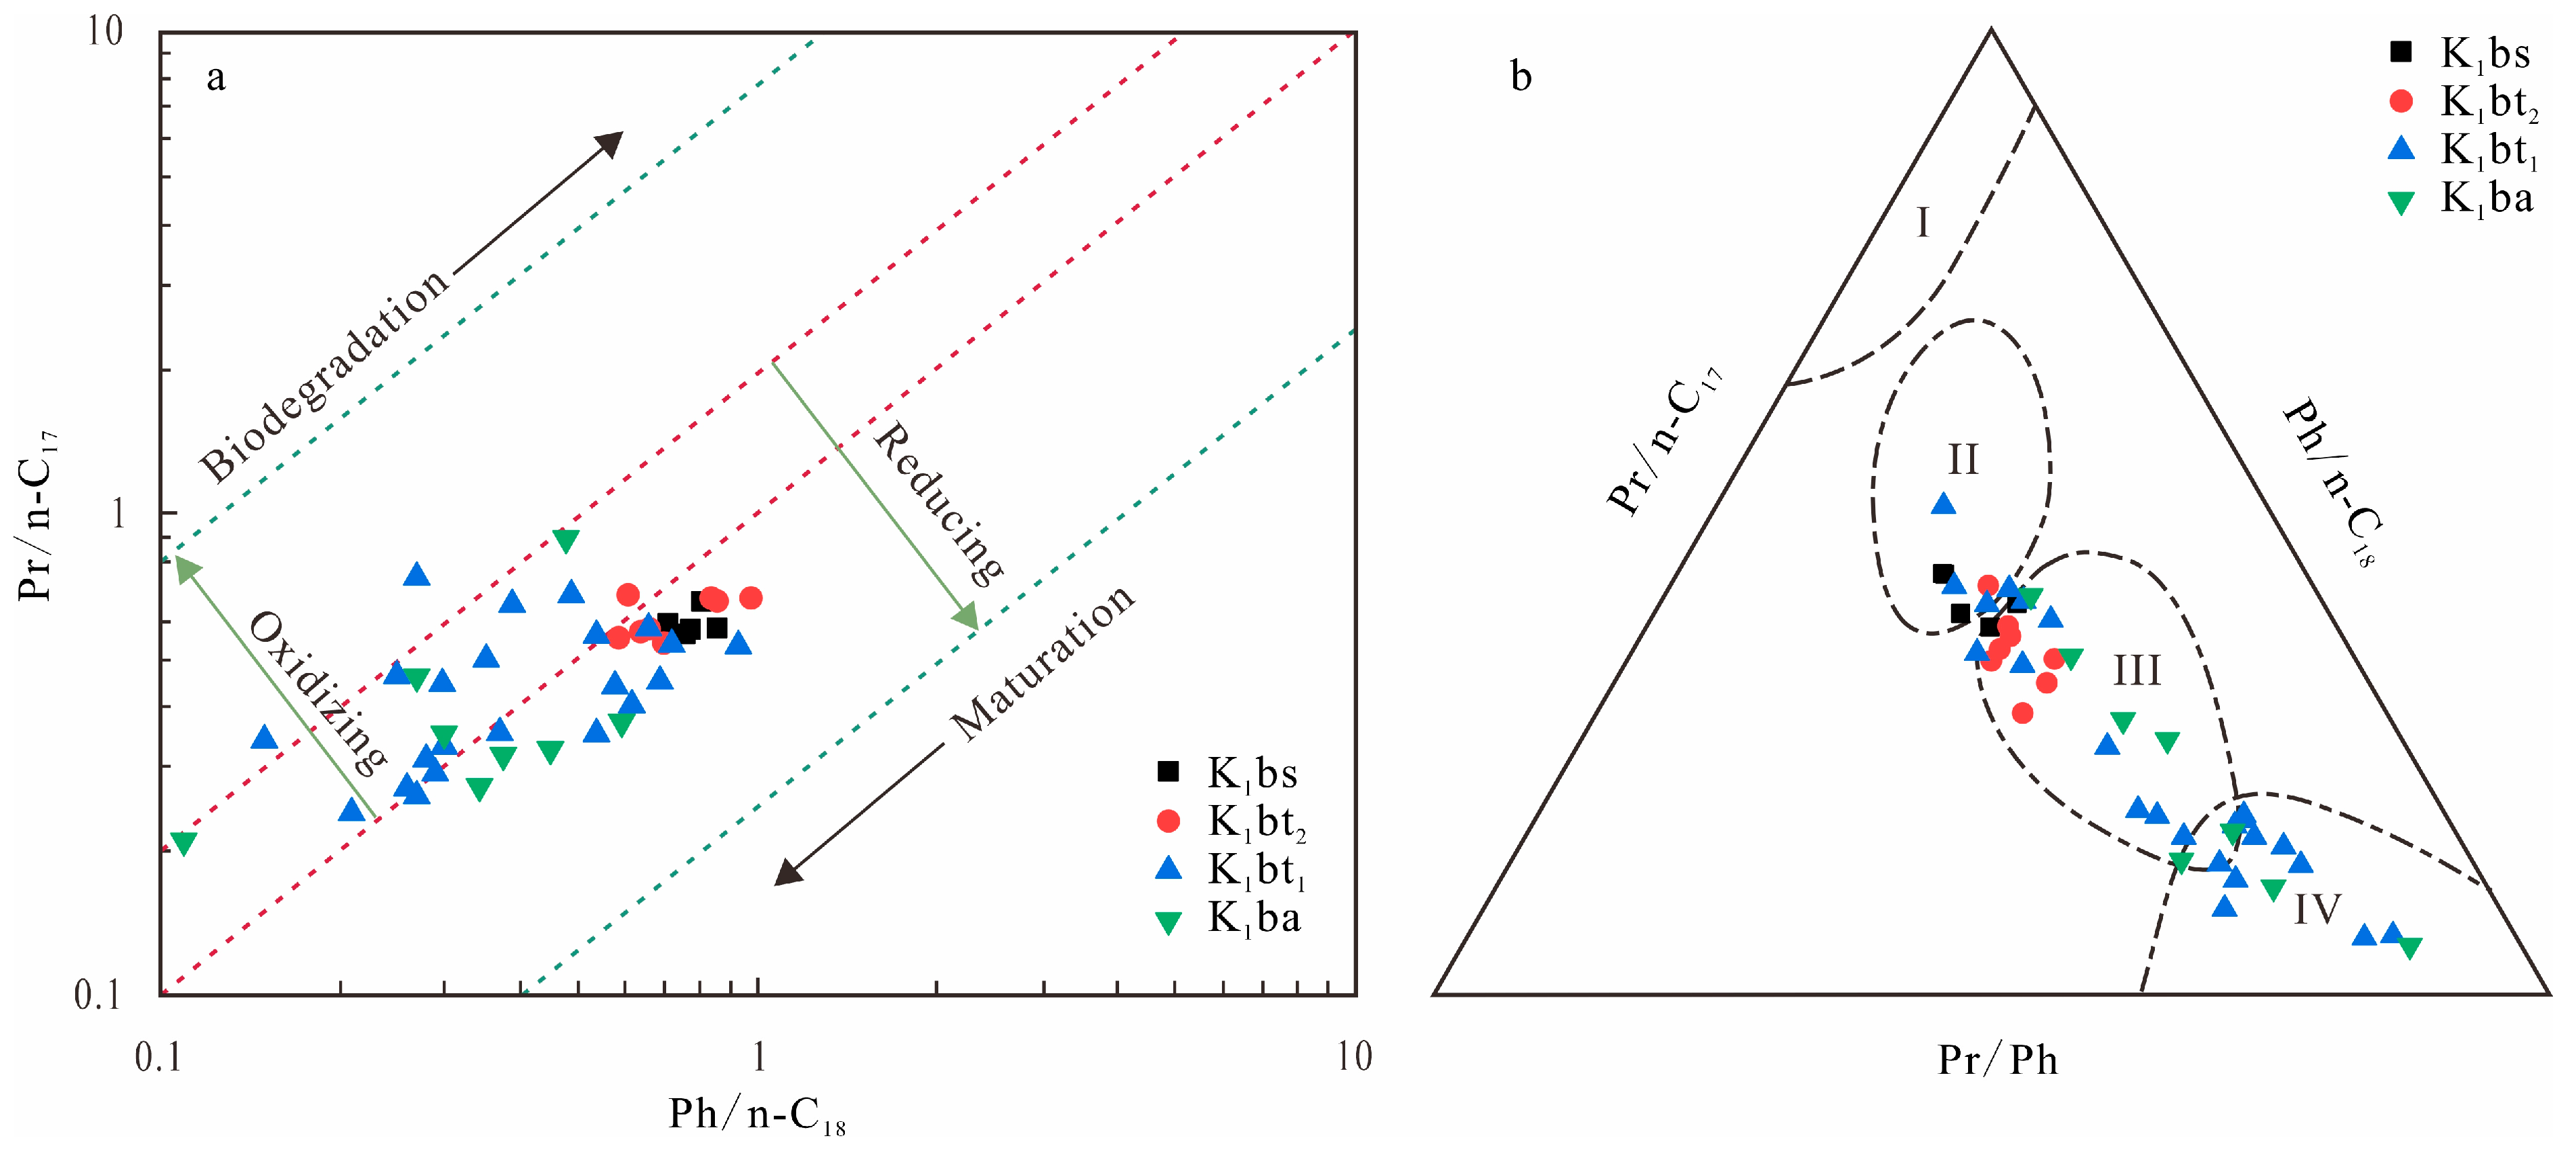
4.6.3. Isoprenoids
4.7. Trace Element Th/U
5. Discussion
5.1. The Minimum Threshold of TOC
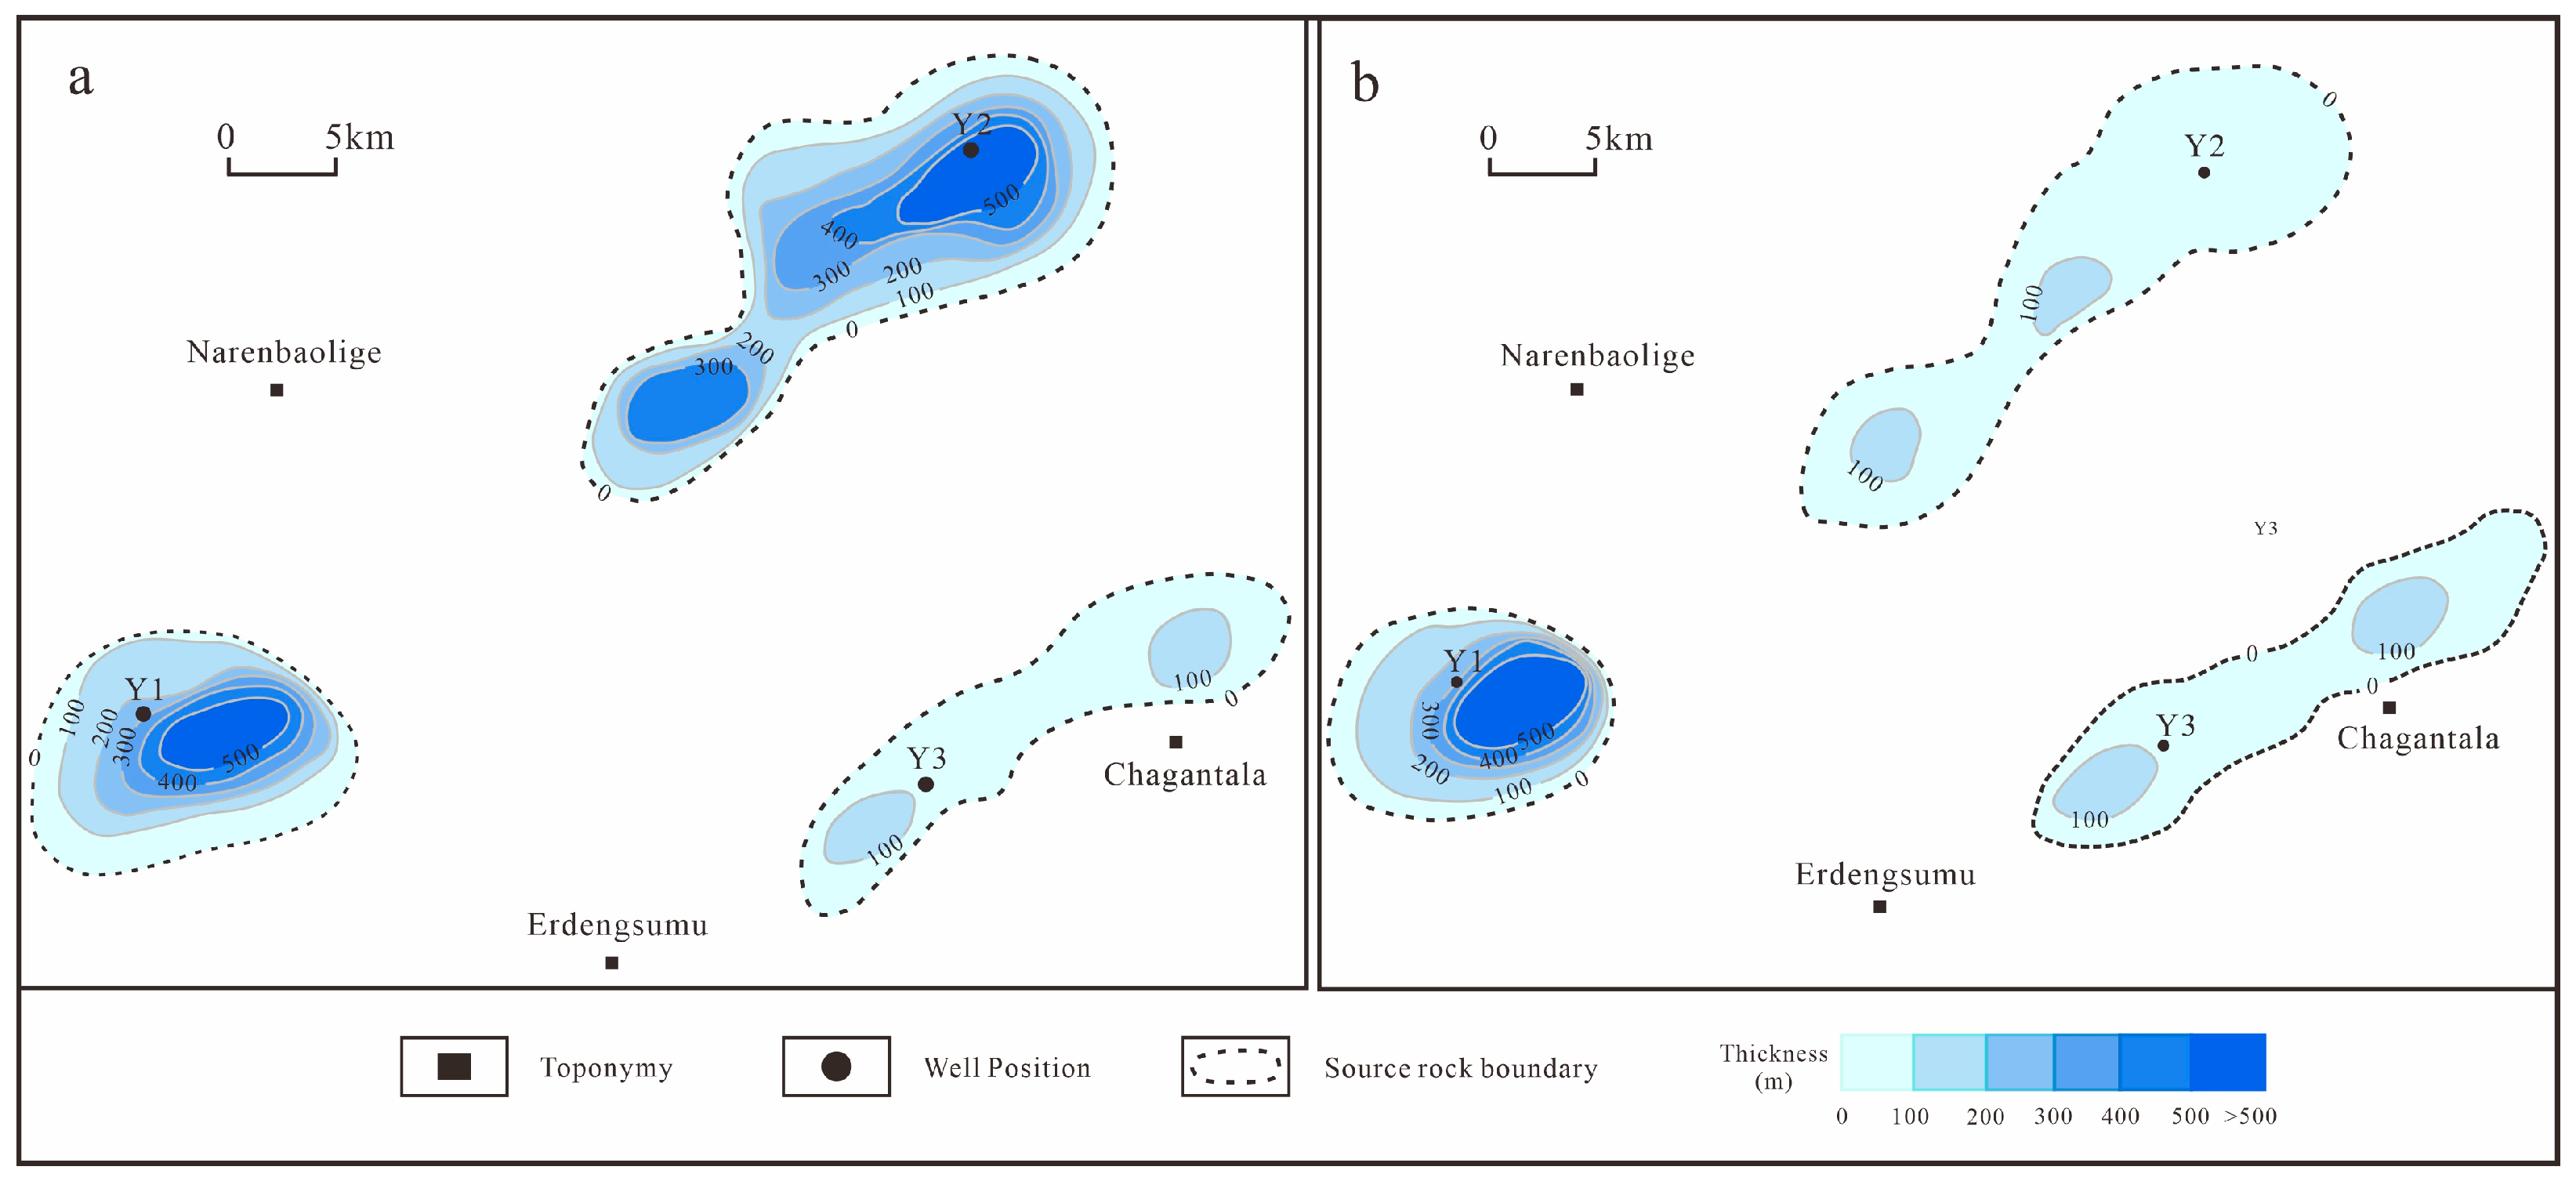
5.2. Distribution of Productive Hydrocarbon Source Rocks
5.3. Main Control Factors for Source Rock Formation
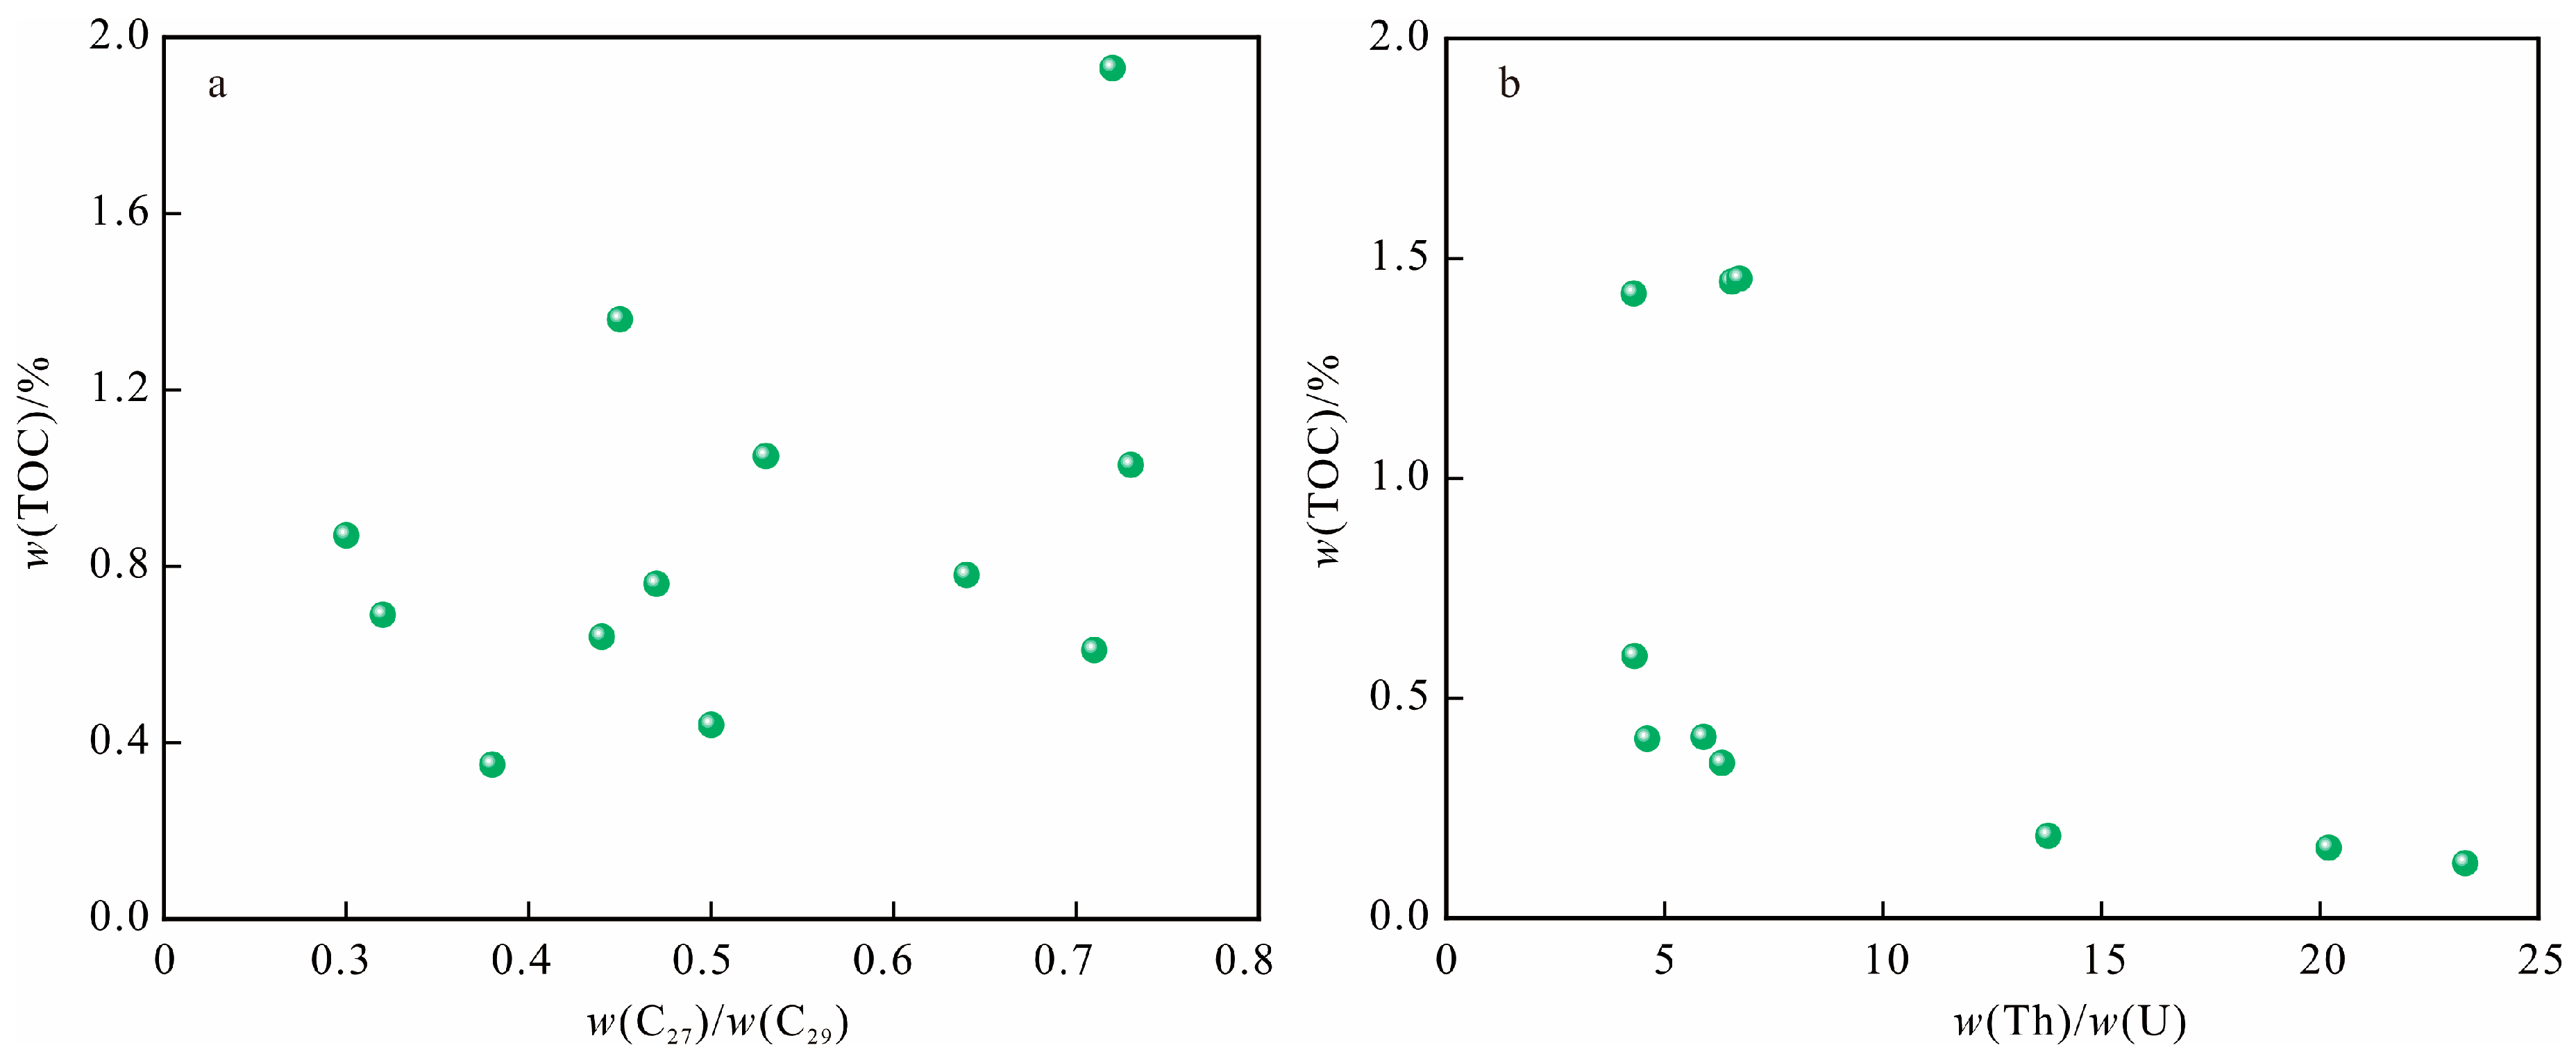
5.3.1. Source of Material Input
5.3.2. Sedimentary Environment
5.3.3. Rate of Sedimentation
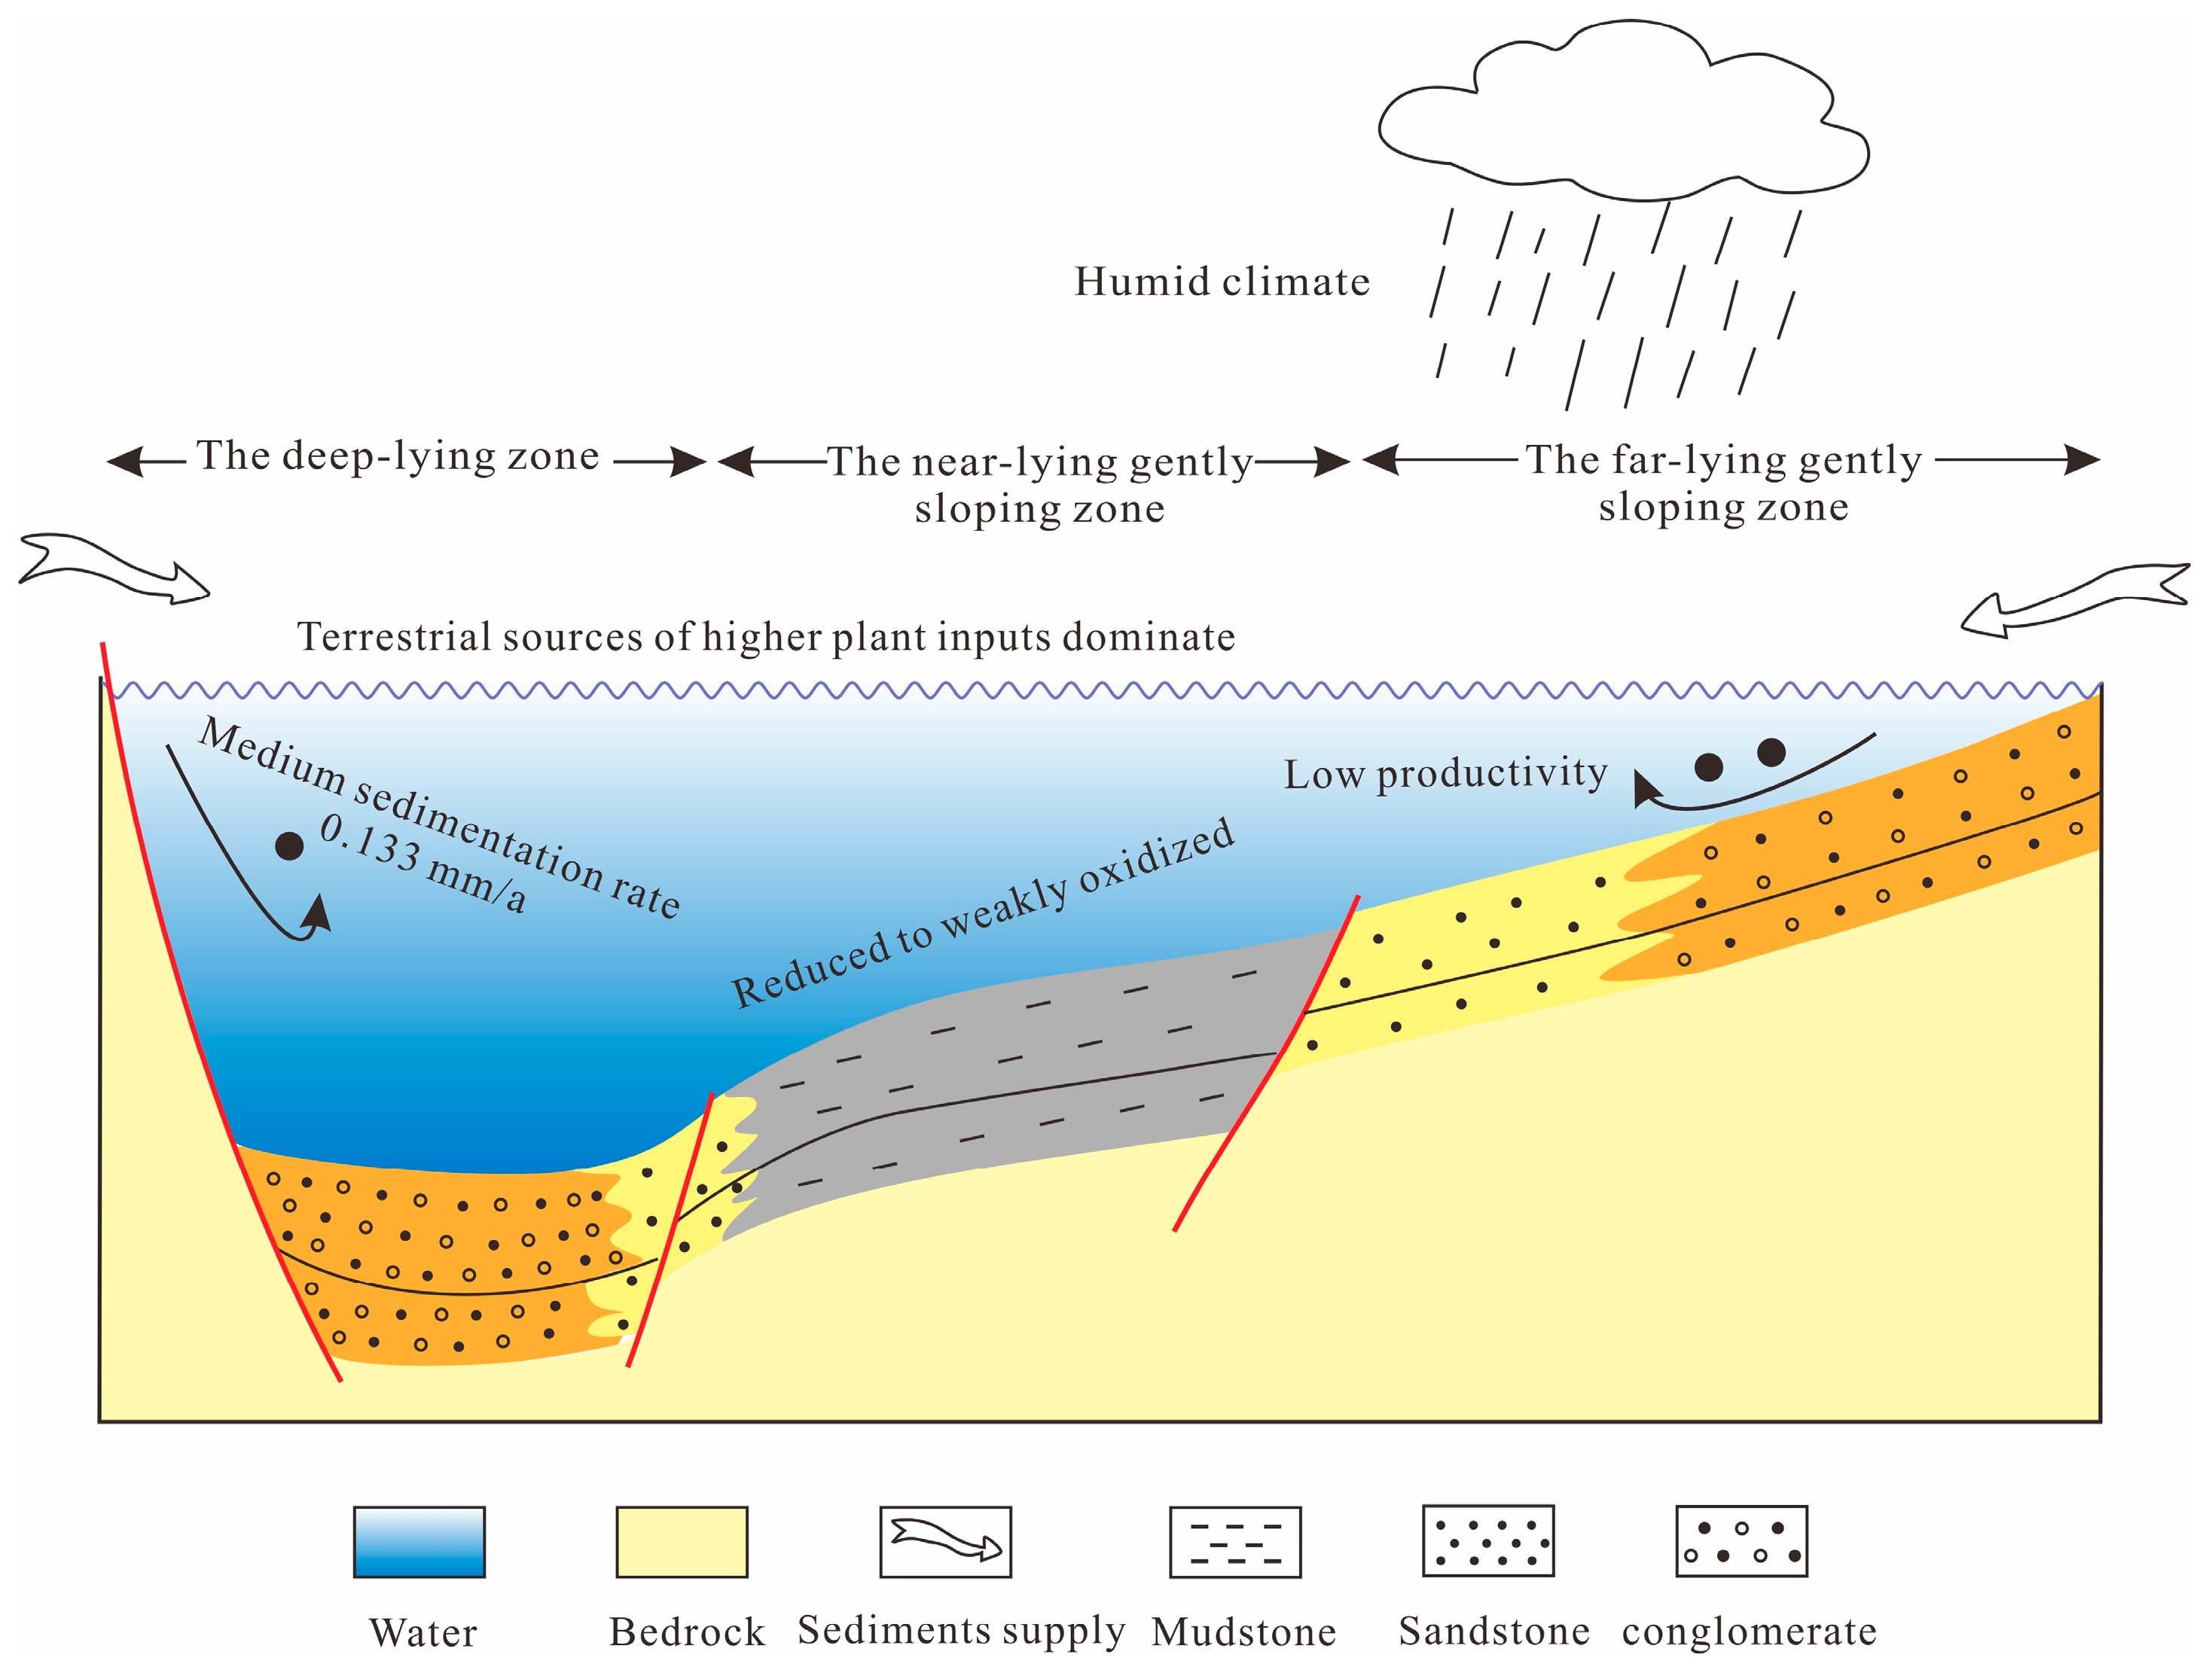
5.4. Hydrocarbon Source Rock Sedimentation Model
6. Conclusions
- The Aershan Formation (K1ba), which is the main source rock of the Dalestai sub-sag, has a high level of maturity, a large thickness, and good kerogen type (Type I-II1) and abundance. The total hydrocarbon generation intensity is 486 × 104 t/km2. The lower Tengger Member (K1bt1), the principal hydrocarbon source rock of the Sayinhutuge sub-sag, is substantial; nonetheless, its limited abundance and inferior kerogen type (Type III-II2), together with poorer maturity compared to the Aershan Formation, are notable drawbacks. The total hydrocarbon generation intensity is only 26 × 104 t/km2. It indicates that the Dalestai sub-sag has significant petroleum potential. The Aershan Formation in the Chagantala sub-sag reaches a maximum burial depth of only 1800 m, inadequate to achieve the critical depth required for oil generation, hence lacking the necessary conditions for oil generation.
- The lower threshold of TOC for effective hydrocarbon source rocks of the mudstone type in the study area is 0.95%. The productive hydrocarbon source rocks are predominantly found in K1bt1 and K1ba, characterized primarily by dark-gray mudstone lithology. On the plane, the effective hydrocarbon source rock thickness in the Dalestai sub-sag exceeds 200 m across an area of 42.48 km2, while in the Sayinhutuge sub-sag, it also surpasses 200 m over 88.71 km2. Additionally, the northern sub-sag is thicker than the southern.
- The Lower Cretaceous hydrocarbon source rocks have different paleosedimentary environments for each stratum; the K1bs and K1bt2 hydrocarbon source rocks formed in a reduced semi-saline to freshwater lake environment, while the K1bt1 and K1ba hydrocarbon source rocks formed in a reduced to weakly oxidized brackish to saline lake environment. The parent source is characterized as “mixed sources of higher plants and plankton as a whole, with the input of higher plants dominating.”
- The redox conditions primarily govern the creation of the Erdengsumu sag lacustrine hydrocarbon source rocks, but terrestrial organic matter input also exerts a significant influence on their formation. Effective source rocks are predominantly located in the near-depression gentle slope zone. Petroleum exploration in the Erdengsumu sag of the Erlian Basin should concentrate on the diminishing sedimentary environments of the lower Tengger Member and the upper section of the Aershan Formation.
Author Contributions
Funding
Data Availability Statement
Conflicts of Interest
References
- Qi, J.F.; Li, X.G.; Yu, F.S.; Yu, T.C. Cenozoic structural deformation and expression of the “Tan-Lu Fault Zone” in the West Sag of Liaohe Depression, Bohaiwan basin province, China. Sci. China Earth Sci. 2013, 56, 1707–1721. [Google Scholar] [CrossRef]
- Jiang, F.J.; Chen, D.; Wang, Z.F.; Xu, Z.Y.; Chen, J.; Liu, L.; Huyan, Y.Y.; Liu, Y. Pore characteristic analysis of a lacustrine shale: A case study in the Ordos Basin, NW China. Mar. Pet. Geol. 2016, 73, 554–571. [Google Scholar] [CrossRef]
- Ren, Z.L.; Yu, Q.; Cui, J.P.; Qi, K.; Chen, Z.J.; Cao, Z.P.; Yang, P. Thermal history and its controls on oil and gas of the Ordos Basin. Earth Sci. Front. 2017, 24, 137–148. [Google Scholar]
- Ren, Z.L.; Qi, K.; Liu, R.C.; Cui, J.P.; Chen, Z.P.; Zhang, Y.Y.; Yang, G.L.; Ma, Q. Dynamic background of Early Cretaceous tectonic thermal events and its control on various mineral accumulations such as oil and gas in the Ordos Basin. Acta Petrol. Sin. 2020, 36, 1213–1234. [Google Scholar]
- Guo, Z.X.; Shi, Y.P.; Yang, Y.T.; Jiang, S.Q.; Li, L.B.; Zhao, Z.G. Inversion of the Erlian Basin (NE China) in the Early Late Cretaceous: Implications for the collision of the Okhotomorsk Block with East Asia. J. Asian Earth Sci. 2018, 154, 49–66. [Google Scholar] [CrossRef]
- Qi, K.; Ren, Z.L.; Chen, Z.P.; Cui, J.P. Characteristics and controlling factors of lacustrine source rocks in the Lower Cretaceous, Suhongtu depression, Yin–E Basin, Northern China. Mar. Pet. Geol. 2021, 127, 104943. [Google Scholar] [CrossRef]
- Adegoke, A.K.; Abdullah, W.H.; Hakimi, M.H.; Yandoka, B.M.S. Geochemical characterisation of Fika Formation in the Chad (Bornu) Basin, northeastern Nigeria: Implications for depositional environment and tectonic setting. Appl. Geochem. 2014, 43, 1–12. [Google Scholar] [CrossRef]
- Powell, T.G. Petroleum geochemistry and depositional setting of lacustrine source rocks. Mar. Pet. Geol. 1986, 3, 200–219. [Google Scholar] [CrossRef]
- Erdenetsogt, B.O.; Hong, S.K.; Choi, J.; Lee, I. Depositional environment and petroleum source rock potential of Mesozoic lacustrine sedimentary rocks in central Mongolia. Mar. Pet. Geol. 2022, 140, 105646. [Google Scholar] [CrossRef]
- Wei, W.; Zhu, X.M.; He, M.W.; Wang, M.W.; Liu, X.B. Original sediment composition of the Lower Cretaceous lacustrine tight–oil mudstone and influences on diagenesis and organic matter content, the Erennaoer Sag in Erlian Basin, NE China. Mar. Pet. Geol. 2018, 94, 131–143. [Google Scholar] [CrossRef]
- Guo, Z.X.; Yang, Y.T.; Zhao, X.Z.; Dan, W.N.; Wang, X.; Du, L. Early Cretaceous tectonostratigraphic evolution of the Erlian Basin, NE China: A record of Late Mesozoic intraplate deformation in East Asia. Mar. Pet. Geol. 2019, 110, 539–564. [Google Scholar] [CrossRef]
- Si, W.; Hou, D.J.; Wu, P.; Zhao, Z.; Ma, X.X.; Zhou, H.F.; Cao, L.Z. Geochemical characteristics of lower cretaceous lacustrine organic matter in the southern sag of the Wuliyasitai depression, Erlian Basin, China. Mar. Pet. Geol. 2020, 118, 104404. [Google Scholar] [CrossRef]
- Jiang, T.; Zhang, R.F.; Xiang, X.; Xie, P.Y.; Zhang, Y.F.; Han, Q.; Li, B.; Xu, J. Favorable accumulation conditions and patterns in trough area of oil-rich sag in Erlian Basin: Taking the southern sag of Wuliyasitai Sag as an example. Nat. Gas Geosci. 2022, 33, 1409–1420. [Google Scholar]
- Feng, W.P.; Wang, F.Y.; Shi, Y.L.; Jiang, T.; Wang, Y.F.; Zhou, H.F.; Ma, X.F.; Ma, Y.; Pang, Q.J. Oil properties variation among the China Erlian Rift Basin petroleum systems: Correlation with organofacies and maturity. Mar. Pet. Geol. 2021, 127, 104960. [Google Scholar] [CrossRef]
- Xiang, X.; Dan, W.N.; Lu, S.F.; Zhang, P.F.; Li, B.; Cao, L.Z.; Wei, Y.; Li, X.W.; Fan, J.; Wang, J.J.; et al. Insight into fluid occurrence and pore structure of lacustrine shale from the Cretaceous Tengger Formation, A’nan Sag, Erlian Basin, China. Energy Fuels 2024, 38, 12960–12977. [Google Scholar] [CrossRef]
- Ding, X.J.; Liu, G.D.; Zha, M.; Gao, C.H.; Huang, Z.L.; Qu, J.X.; Lu, X.J.; Wang, P.G.; Chen, Z.L. Geochemical characterization and depositional environment of source rocks of small fault basin in Erlian Basin, northern China. Mar. Pet. Geol. 2016, 69, 231–240. [Google Scholar] [CrossRef]
- Ma, X.X.; Hou, D.J.; Wu, P.; Cheng, X.; Ding, W.J.; Cao, L.Z.; Wei, X.L.; Zheng, R.H. Organic geochemistry and organic matter enrichment mechanisms of the lacustrine source rocks from a small-faulted Basin: A case study of the Bayindulan, A’er and Wuliyasitai sags in the Erlian Basin, Northern China. Geoenergy Sci. Eng. 2023, 225, 211638. [Google Scholar] [CrossRef]
- Pan, C.C.; Tan, Y.M.; Feng, J.H.; Jin, G.X.; Zhang, Y.X.; Sheng, G.Y.; Fu, J.M. Mixing and biodegradation of hydrocarbons in the Daerqi oilfield, Baiyinchagan Depression, northern China. Org. Geochem. 2007, 38, 1479–1500. [Google Scholar] [CrossRef]
- Luo, Q.Y.; Yu, S.J.; Liu, Y.; Zhang, Y.Q.; Han, H.; Qi, L.; Zhong, N.N. Existence and implications of hop-17(21)-enes in the lower Cretaceous of the Saihantala Sag, Erlian Basin, China. Pet. Sci. 2012, 9, 154–160. [Google Scholar] [CrossRef]
- Zuo, Y.H.; Wang, C.C.; Tang, S.L.; Hao, Q.Q. Mesozoic and Cenozoic thermal history and source rock thermal evolution of the Baiyinchagan sag, Erlian Basin, northern China. J. Pet. Sci. Eng. 2016, 139, 171–184. [Google Scholar] [CrossRef]
- Liu, H.; Ren, J.L.; Lyu, J.F.; Lyu, X.Y.; Feng, Y.L. Hydrocarbon source rock evaluation of the Lower Cretaceous system in the Baibei Depression, Erlian Basin. Energy Explor. Exploit. 2018, 36, 355–372. [Google Scholar] [CrossRef]
- Chen, Z.J.; Wang, Z.W.; Zhang, S.Q.; Gao, Y.W.; Han, C.C.; Li, K.S. Biomarker characteristics of source rocks and oil source correlation in Baolegentaohai sag, Erlian Basin. Acta Sedimentol. Sin. 2020, 38, 451–462. [Google Scholar]
- Si, W.; Hou, D.J.; Cao, L.Z. Characterization of crude oil, formation water, and fluid inclusions of hydrocarbon-bearing strata and their hydrocarbon geological significance in the Wuliyasitai southern sub-sag of the Erlian Basin, China. ACS Omega 2023, 8, 29060–29082. [Google Scholar] [CrossRef]
- Liu, H.C.; Li, B.Q.; Liu, J.D.; Zhang, S.Q.; Wang, W.H.; Gao, Y.W.; Chen, Z.J.; Han, C.C. Hydrocarbon source rock characteristics and petroleum resource potential of Baolegentaohai Sag in Erlian Basin. J. Xi’an Shiyou Univ. (Nat. Sci. Ed.) 2019, 34, 10–18. [Google Scholar]
- Ding, X.J.; Liu, G.D.; Zha, M.; Huang, Z.L.; Gao, C.H.; Wang, P.G.; Qu, J.X.; Liu, X.J.; Chen, Z.L. Characteristics and origin of lacustrine source rocks in the Lower Cretaceous, Erlian Basin, Northern China. Mar. Pet. Geol. 2015, 66, 939–955. [Google Scholar] [CrossRef]
- Li, Z.J.; Ma, X.F.; Luo, Q.; Xiao, Y.; Wang, Q.; Pang, Q.J.; Wu, X.M.; Shao, Y.R.; Jin, J.J.; Zhong, X.M.; et al. Characteristics and hydrocarbon generation mechanism of early low-mature oil in Baoding sag, Bohai Bay Basin. Acta Petrol. Sin. 2024, 45, 500. [Google Scholar]
- Chen, Z.J.; Gao, Y.W.; Li, K.S.; He, Y.H.; Liu, H.C.; Yu, J. Characteristics of Lower Cretaceous Source Rock and Its Effects onHydrocarbon Distribution in Erlian Basin. Sci. Technol. Rev. 2014, 32, 46–53. [Google Scholar]
- Dou, L.R.; Zhu, Y.H.; Yang, T.; Xu, S.B.; Ping, X.C. Origins of heavy oils in the Erlian Basin, NE China. Mar. Pet. Geol. 1998, 15, 769–781. [Google Scholar] [CrossRef]
- Fu, S.; Liu, Z.; Zhang, Y.M.; Jiang, S.Q.; Wang, X.; Wang, H.L.; Tian, N.; Yang, H.L. Erosion thickness estimate and hydrocarbon accumulation period of relic basins: A case study of the Wulan-Hua Sag in southern Erlian Basin, NE China. Geol. J. 2020, 55, 3430–3450. [Google Scholar] [CrossRef]
- Wu, P.; Hou, D.J.; Cao, L.Z.; Zheng, R.H.; Wei, X.L.; Ma, X.X.; Zhao, Z.; Chen, J.W. Paleoenvironment and organic characterization of the lower Cretaceous lacustrine source rocks in the Erlian Basin: The influence of hydrothermal and volcanic activity on the source rock quality. ACS Omega 2023, 8, 1885–1911. [Google Scholar] [CrossRef]
- Ren, Z.L.; Feng, J.H.; Liu, C.Y.; Pu, R.H.; Ge, Y.D.; Wang, Y. Organic geochemical feature of Lower Cretaceous source rock in Bayindulan Depression of Erlian Basin. J. Northwest Univ. (Nat. Sci. Ed.) 2000, 30, 328–331. [Google Scholar]
- Fu, S.; Liu, Z.; Zhang, Y.M.; Wang, X.; Tian, N.; Yao, N.; Xiong, Y.; Chen, P.; Lei, L.; Wang, H.L. Depositional systems and sequence stratigraphy of mesozoic lacustrine rift basins in NE China: A case study of the WulanHua sag in the southern Erlian Basin. J. Asian Earth Sci. 2019, 174, 68–98. [Google Scholar] [CrossRef]
- Xiang, X.; Huang, C.Y.; Cao, L.Z.; Cao, Q.; Jiang, T.; Zhang, Y.F.; Song, Y.; Xu, J. Enrichment model and exploration potential for unconventional oil and gas in troughs, Erlian Basin. Earth Sci. Front. 2023, 30, 462. [Google Scholar]
- Zhang, Y.M.; Liu, Z.; Fu, S.; Jiang, S.Q.; Yao, N.; Wang, X. New understandings of the basement characteristics and evolution process of Erlian Basin. Oil Geophys. Prospect. 2019, 54, 404–416. [Google Scholar]
- Bonnetti, C.; Cuney, M.; Bourlange, S.; Deloule, E.; Poujol, M.; Liu, X.; Peng, Y.B.; Yang, J.X. Primary uranium sources for sedimentary-hosted uranium deposits in NE China: Insight from basement igneous rocks of the Erlian Basin. Miner. Depos. 2017, 52, 297–315. [Google Scholar] [CrossRef]
- Su, S.M.; Jiang, Y.L. Hydrocarbon supply characteristics and quantitative evaluation of hydrocarbon charging capacity for Buried-hill Reservoirs in the Erlian Basin, China. Arab. J. Geosci. 2021, 14, 2103. [Google Scholar] [CrossRef]
- Zhao, X.Z.; Jin, F.M.; Qi, J.F.; Wang, Q.; Yang, M.H.; Shi, Y.P.; Dong, X.Y. The structural types and petroleum geological significance of Early Cretaceous complex faulted sag in Erlian Basin. Nat. Gas Geosci. 2015, 26, 1289–1298. [Google Scholar]
- Huang, H.P.; Jin, G.X.; Lin, C.S.; Zheng, Y.B. Origin of an unusual heavy oil from the Baiyinchagan depression, Erlian basin, northern China. Mar. Pet. Geol. 2003, 20, 1–12. [Google Scholar] [CrossRef]
- Zhao, W.Z.; Fang, J. Hydrocarbon migration characteristics of the Lower Cretaceous in the Erlian Basin. Acta Geochim. 2007, 26, 1–7. [Google Scholar] [CrossRef]
- GB/T 18602-2012; Rock Pyrolysis Analysis. National Standards of People’s Republic of China: Beijing, China, 2012.
- Chen, Z.J.; Wen, Z.G.; Liu, H.C.; Zhang, C.M.; Gao, Y.W.; Bai, X.Y.; Wang, X.D.; Han, C.C.; Li, Z.L.; Li, K.S. Geochemical characteristics and hydrocarbon generation potential of source rocks in Yihewusu Sag, Erlian Basin. J. China Univ. Pet. Ed. Nat. Sci. 2022, 46, 34–43. [Google Scholar]
- Chen, Z.J.; Zhang, C.M.; He, Y.H.; Wen, Z.G.; Ma, F.X.; Li, W.; Gao, Y.W.; Chen, Y.G.; Zhang, H.Y.; Wei, D.T. Characteristics and geochemical indication of over-mature source rocks in the Paleozoic, Yingen–Ejinaqi Basin. Oil Gas Geol. 2022, 43, 682–695. [Google Scholar]
- Gao, Y.W.; Hao, S.Y.; Wang, Q.; Wang, W.B.; Jiang, S.J.; Fan, Q.X.; Chen, Z.J.; Zhou, Y. Geochemical characteristics and hydrocarbon resources potential of source rocks in Babei Sag, Yingen–Ejinaqi Basin. Oil Gas Geol. 2022, 43, 1445–1458. [Google Scholar]
- Chen, Z.L.; Liu, G.D.; Huang, Z.L.; Lu, X.J.; Luo, Q.; Ding, X.J. Controls of oil family distribution and composition in nonmarine petroleum systems: A case study from Inner Mongolia Erlian basin, Northern China. J. Asian Earth Sci. 2014, 92, 36–52. [Google Scholar] [CrossRef]
- Katz, B.J. A survey of rift basin source rocks. In Geological Society; Special Publications: London, UK, 1995; Volume 80, pp. 213–240. [Google Scholar]
- Li, S.M.; Pang, X.Q.; Li, M.W.; Jin, Z.J. Geochemistry of petroleum systems in the Niuzhuang South Slope of Bohai Bay Basin—Part 1: Source rock characterization. Org. Geochem. 2003, 34, 389–412. [Google Scholar] [CrossRef]
- El Diasty, W.S.; El Beialy, S.Y.; Mahdi, A.Q.; Peters, K.E. Geochemical characterization of source rocks and oils from northern Iraq: Insights from biomarker and stable carbon isotope investigations. Mar. Pet. Geol. 2016, 77, 1140–1162. [Google Scholar] [CrossRef]
- Gao, G.; Zhang, W.W.; Xiang, B.L.; Liu, G.D.; Ren, J.L. Geochemistry characteristics and hydrocarbon-generating potential of lacustrine source rock in Lucaogou Formation of the Jimusaer Sag, Junggar Basin. J. Pet. Sci. Eng. 2016, 145, 168–182. [Google Scholar] [CrossRef]
- Yu, Q.; Zhang, T.; Wang, Z.D.; Tuo, J.C.; Zhang, M.F.; Wu, C.J.; Tian, C.T. Organic geochemical characteristics and generating potential of source rocks from the Lower–Middle Jurassic coal–bearing strata in the East Junggar Basin, NW China. Mar. Pet. Geol. 2018, 93, 113–126. [Google Scholar]
- Radke, M.; Welte, D.H.; Willsch, H. Maturity parameters based on aromatic hydrocarbons: Influence of the organic matter type. Org. Geochem. 1986, 10, 51–63. [Google Scholar] [CrossRef]
- Shalaby, M.R.; Hakimi, M.H.; Abdullah, W.H. Geochemical characteristics and hydrocarbon generation modeling of the Jurassic source rocks in the Shoushan Basin, north Western Desert, Egypt. Mar. Pet. Geol. 2011, 28, 1611–1624. [Google Scholar] [CrossRef]
- Zhang, T.W.; Ellis, G.S.; Ruppel, S.C.; Milliken, K.; Yang, R.S. Effect of organic-matter type and thermal maturity on methane adsorption in shale-gas systems. Org. Geochem. 2012, 47, 120–131. [Google Scholar] [CrossRef]
- Márquez, G.; Morato, A.; Guzmán, M.A.; Boente, C.; Witt, C. Geochemical characterization of crude oils and potential source rocks from southern coastal Ecuador: Hypothetical petroleum systems. Mar. Pet. Geol. 2022, 138, 105545. [Google Scholar] [CrossRef]
- Cheng, B.; Liu, H.; Cao, Z.C.; Wu, X.; Chen, Z.H. Origin of deep oil accumulations in carbonate reservoirs within the north Tarim Basin: Insights from molecular and isotopic compositions. Org. Geochem. 2020, 139, 103931. [Google Scholar] [CrossRef]
- Dong, T.; He, S.; Yin, S.Y.; Wang, D.X.; Hou, Y.G.; Guo, J.G. Geochemical characterization of source rocks and crude oils in the Upper Cretaceous Qingshankou Formation, Changling Sag, southern Songliao Basin. Mar. Pet. Geol. 2015, 64, 173–188. [Google Scholar] [CrossRef]
- He, F.G.; Tian, H.; Gai, H.F.; Liu, W.; Qian, Z.; Jiang, T.; Han, Q.; Fan, J.; Zhang, J.; Yang, X.X.; et al. Geochemical characteristics and organic matter enrichment of the lower Cretaceous dolomite-rich interval in the Bayindulan Sag, Erlian Basin, northern China. Geoenergy Sci. Eng. 2023, 228, 211970. [Google Scholar] [CrossRef]
- Bray, E.E.; Evans, E.D. Distribution of n-paraffins as a clue to recognition of source beds. Geochim. Cosmochim. Acta. 1961, 22, 2–15. [Google Scholar] [CrossRef]
- Volkman, J.K. A review of sterol markers for marine and terrigenous organic matter. Org. Geochem. 1986, 9, 83–99. [Google Scholar] [CrossRef]
- Volkman, J.K. Sterols in microorganisms. Appl. Microbiol. Biotechnol. 2003, 60, 495–506. [Google Scholar] [CrossRef]
- Didyk, B.M.; Simoneit, B.R.T.; Brassell, S.C.; Eglinton, G. Organic geochemical indicators of palaeoenvironmental conditions of sedimentation. Nature 1978, 272, 216–222. [Google Scholar] [CrossRef]
- Zhang, S.C.; Huang, H.P. Geochemistry of Palaeozoic marine petroleum from the Tarim Basin, NW China: Part 1. Oil family classification. Org. Geochem. 2005, 36, 1204–1214. [Google Scholar] [CrossRef]
- Al-Areeq, N.M.; Maky, A.F. Organic geochemical characteristics of crude oils and oil–source rock correlation in the Sunah oilfield, Masila Region, Eastern Yemen. Mar. Pet. Geol. 2015, 63, 17–27. [Google Scholar] [CrossRef]
- Gao, P.; Liu, G.D.; Jia, C.Z.; Ding, X.J.; Chen, Z.L.; Dong, Y.M.; Zhao, X.; Jiao, W.W. Evaluating rare earth elements as a proxy for oil–source correlation. A case study from Aer Sag, Erlian Basin, northern China. Org. Geochem. 2015, 87, 35–54. [Google Scholar] [CrossRef]
- Luo, Q.Y.; Zhong, N.N.; Liu, Y.; Qu, Y.S.; Ma, L. Organic geochemical characteristics and accumulation of the organic matter in the Jurassic to Cretaceous sediments of the Saihantala Sag, Erlian Basin, China. Mar. Pet. Geol. 2018, 92, 855–867. [Google Scholar] [CrossRef]
- Xu, J.J.; Jiang, J.C.; Wang, D.Y.; Xu, P.; Wang, F.L.; Li, H.Y.; Cheng, X.G.; Wu, Q.L.; Cheng, F.Q.; Lin, L.M.; et al. Main controlling factors evolution on high-quality source rocks development in the Shanan Sag, Bohaibay Basin, NE China: Implication from structure, depositional environment, and organic matter. J. Asian Earth Sci. 2024, 263, 106020. [Google Scholar] [CrossRef]
- Fu, J.H.; Li, S.X.; Xu, L.M.; Niu, X.B. Paleo-sedimentary environmental restoration and its significance of Chang 7 Member of Triassic Yanchang Formation in Ordos Basin, NW China. Petroleum Explor. Dev. 2018, 45, 998–1008. [Google Scholar] [CrossRef]
- Toyin, A.; Zhong, N.N.; Idris, F.O.; Adekeye, O.; Shi, S.B. Geochemical evidences linking the Lower Cretaceous source rocks to the biodegraded bitumen seeps and tar sands in the Gulf of Guinea Basin. Org. Geochem. 2024, 197, 104866. [Google Scholar] [CrossRef]
- Zhao, X.Z.; Liu, G.D.; Jin, F.M.; Huang, Z.L.; Lu, X.J.; Sun, M.L.; Ding, X.J.; Chen, Z.L. Distribution features and pattern of effective source rock in small faulted lacustrine basin: A case study of the Lower Cretaceous in Erlian Basin. Acta Petrol. Sin. 2015, 36, 641–652. [Google Scholar]
- Ding, X.J.; Liu, G.D.; Zhao, L.M.; Gao, D.K.; Zhang, K.; Kuang, D.Q. Organic matter enrichment and hydrocarbon source rock forming mechanism in small-scale faulted lacustrine basins: A case from the first member of lower Cretaceous Tenger formation in the Erlian basin. Xinjiang Pet. Geol. 2017, 38, 1. [Google Scholar]
- Ding, X.J.; Liu, G.D.; Zha, M.; Huang, Z.L.; Gao, C.H.; Lu, X.J.; Sun, M.L.; Chen, Z.L.; Liuzhuang, X.X. Relationship between total organic carbon content and sedimentation rate in ancient lacustrine sediments, a case study of Erlian basin, Northern China. J. Geochem. Explor. 2015, 149, 22–29. [Google Scholar] [CrossRef]
- Katz, B.J. Controlling factors on source rock development—A review of productivity, preservation, and sedimentation rate. In The Deposition of Organic Carbon Rich Sediments: Models, Mechanisms, and Consequences; Harris, N.B., Ed.; Society of Sedimentary Geology: Claremore, OK, USA, 2005; pp. 7–16. [Google Scholar]
- Hedges, J.I.; Keil, R.G. Sedimentary organic matter preservation: An assessment and speculative synthesis. Mar. Chem. 1995, 49, 81–115. [Google Scholar] [CrossRef]
- Wu, Z.J.; Han, X.Z.; Lin, Z.X.; Li, Z.N.; Ji, H.; Yin, D.F.; Hu, H. Tectonic, sedimentary, and climate evolution of Meso-Cenozoic basins in North China and its significance of coal accumulation and uranium mineralization. Geotecton. Metallog. 2020, 44, 710–724. [Google Scholar]


| Element | Geological Characteristics | Key Evaluation Parameters |
|---|---|---|
| Source Rock | Organic-rich fine-grained rocks (mudstone, shale, carbonate) | TOC content (>0.5%) |
| Kerogen type (I/II/III) | ||
| Maturity (Ro value) | ||
| Hydrocarbon potential (S1 + S2) | ||
| Reservoir | Porous/permeable rocks (sandstone, carbonate, fractured basement) | Porosity (>8%) |
| Permeability (>1 mD) | ||
| Pore structure (mercury injection) | ||
| Seal/Cap Rock | Low-permeability rocks (evaporites, tight mudstone) | Breakthrough pressure (>5 MPa) |
| Thickness (>10 m) | ||
| Lateral continuity | ||
| Migration Pathway | Faults/fractures/unconformities/permeable layers | Migration capacity index |
| Migration direction (fluid inclusions) | ||
| Migration distance | ||
| Trap | Structural/stratigraphic/lithologic traps | Closure height |
| Effective volume | ||
| Timing (match with migration) | ||
| Timing | Trap formation period ≤ main hydrocarbon migration period | Burial-thermal history modeling |
| Fluid inclusion homogenization temperature | ||
| Preservation | Structural stability/intact seal/stable fluid environment | Formation pressure coefficient |
| Water chemistry (salinity) | ||
| Biomarker degradation |
| Well | Strata | Lithology | Thicknesss (m) | TOC (%) | Chloroform Bitumen “A” (%) | Rock Pyrolysis Parameters | Ro (%) | ||
|---|---|---|---|---|---|---|---|---|---|
| S1 + S2 (mg/g) | HI (mg/g) | Tmax (°C) | |||||||
| Y1 | K1bs | Dark-gray mudstone | 407.1 | 0.19~3.77 1.05 | 0.0063~0.0169 0.0094 | 0.13~10.7 0.88 | 31.43~60.64 42.51 | 429~434 430 | 0.39~0.47 0.40 |
| Coal | 4.5 | 23.4 | 42.03 | 32.84 | 430 | 0.39 | |||
| K1bt2 | Brown mudstone | 55.6 | 0.03~0.38 0.08 | 0.0105~0.0128 0.0117 | 0.09~0.81 0.13 | 31.43~36.84 34.14 | 424~438 432 | 0.46~0.48 0.47 | |
| K1bt1 | Gray mudstone | 311.3 | 0.03~1.54 0.52 | 0.0030~0.0257 0.0129 | 0.09~5.51 0.50 | 3.92~60 25.07 | 430~439 437 | 0.47~0.74 0.63 | |
| K1ba | Dark-gray mudstone | 359.3 | 0.03~4.35 0.98 | 0.0305~0.1753 0.1113 | 0.04~27.65 4.58 | 137.6~315.7 234.02 | 442~446 443 | 0.71~0.79 0.74 | |
| Y2 | K1bs | Brown mudstone | 92.5 | 0.26~4.13 1.93 | 0.0175 | 0.02~1.15 0.56 | 3.85~38.46 22.29 | 422~433 427 | 0.13 |
| K1bt2 | Dark-gray mudstone | 279 | 0.25~1.96 0.44 | 0.0046~0.0086 0.0066 | 0.01~1.89 0.14 | 0.00~93.23 9.58 | 402~454 434 | 0.33~0.68 0.51 | |
| K1bt1 | Dark-gray mudstone | 599 | 0.09~1.54 0.76 | 0.0038~0.0279 0.0128 | 0.02~6.61 1.02 | 4.55~594.12 116.6 | 428~453 440.81 | 0.57~1.14 0.81 | |
| K1ba | Dark-gray mudstone | 35 | 0.17~1.79 0.78 | 0.0036~0.0656 0.024 | 0.06~6.60 1.60 | 9.68~507.23 148.69 | 424~467 447 | 1.03~1.23 1.16 | |
| Well | Depth (m) | Statra | H/C | O/C | δ13CPDB (‰) | Well | Depth (m) | Statra | H/C | O/C | δ13CPDB (‰) |
|---|---|---|---|---|---|---|---|---|---|---|---|
| Y1 | 751.4 | K1bs | 0.96 | 0.38 | –22.4 | Y2 | 580.5 | K1bs | 0.56 | 0.17 | –20.9 |
| Y1 | 857.1 | K1bs | 1.00 | 0.45 | –22.1 | Y2 | 830 | K1bt2 | 0.41 | 0.15 | –22.0 |
| Y1 | 893.7 | K1bs | 0.97 | 0.38 | –23.3 | Y2 | 969.8 | K1bt2 | 0.24 | 0.17 | –24.4 |
| Y1 | 956.5 | K1bs | 0.93 | 0.33 | –23.2 | Y2 | 1077.5 | K1bt2 | 0.62 | 0.18 | –22.6 |
| Y1 | 986.7 | K1bs | 1.01 | 0.38 | –23.3 | Y2 | 1235 | K1bt2 | 0.71 | 0.19 | –22.4 |
| Y1 | 1056.6 | K1bs | 1.00 | 0.41 | –22.9 | Y2 | 1379 | K1bt2 | 0.54 | 0.16 | –21.9 |
| Y1 | 1155.9 | K1bs | 0.94 | 0.37 | –22.4 | Y2 | 1468.1 | K1bt2 | 0.41 | 0.16 | –21.7 |
| Y1 | 1187.8 | K1bs | 0.90 | 0.31 | –21.9 | Y2 | 1555.4 | K1bt1 | 0.50 | 0.21 | –24.7 |
| Y1 | 1376.2 | K1bt2 | 1.53 | 0.89 | –23.1 | Y2 | 1673.7 | K1bt1 | 0.59 | 0.16 | –22.7 |
| Y1 | 2025.6 | K1bt2 | 1.73 | 1.25 | –24.9 | Y2 | 1679.4 | K1bt1 | 0.42 | 0.17 | –24.1 |
| Y1 | 2124.2 | K1bt1 | 1.18 | 0.73 | –24.2 | Y2 | 1806.4 | K1bt1 | 0.67 | 0.13 | −22.0 |
| Y1 | 2194.1 | K1bt1 | 1.12 | 0.73 | –24.4 | Y2 | 1833.5 | K1bt1 | 0.91 | 0.15 | –24.7 |
| Y1 | 2245 | K1bt1 | 0.96 | 0.50 | –25.2 | Y2 | 1912.7 | K1bt1 | 0.71 | 0.09 | –22.5 |
| Y1 | 2255.3 | K1bt1 | 1.00 | 0.30 | –24.9 | Y2 | 1994.6 | K1bt1 | 0.7 | 0.13 | –23.0 |
| Y1 | 2302.2 | K1bt1 | 0.98 | 0.46 | –25.4 | Y2 | 2079 | K1bt1 | 0.78 | 0.14 | –23.8 |
| Y1 | 2342.8 | K1bt1 | 1.12 | 0.54 | –28.7 | Y2 | 2092.5 | K1bt1 | 0.89 | 0.09 | –24.8 |
| Y1 | 2458 | K1bt1 | 0.82 | 0.29 | –24.4 | Y2 | 2096.2 | K1bt1 | 0.92 | 0.09 | –30.0 |
| Y1 | 2507.3 | K1bt1 | 1.22 | 0.66 | –23.7 | Y2 | 2116.5 | K1bt1 | 0.80 | 0.14 | –24.4 |
| Y1 | 2554.2 | K1bt1 | 1.25 | 0.53 | –24.9 | Y2 | 2206.2 | K1bt1 | 0.72 | 0.17 | –23.1 |
| Y1 | 2644.0 | K1ba | 1.18 | 0.53 | –24.1 | Y2 | 2257.5 | K1bt1 | 1.01 | 0.08 | –26.9 |
| Y1 | 2705.2 | K1ba | 0.95 | 0.39 | –24.1 | Y2 | 2288 | K1bt1 | 1.19 | 0.06 | –30.6 |
| Y1 | 2759.3 | K1ba | 1.00 | 0.42 | –24.5 | Y2 | 2307 | K1ba | 0.66 | 0.12 | –27.3 |
| Y1 | 2811.8 | K1ba | 1.79 | 1.14 | –27.2 | Y2 | 2355.4 | K1ba | 0.65 | 0.10 | –23.3 |
| Y1 | 2871.4 | K1ba | 1.21 | 1.82 | –28.6 | Y2 | 2356.5 | K1ba | 0.76 | 0.11 | –26.9 |
| Y1 | 2925.4 | K1ba | 1.03 | 0.45 | –28.3 | Y2 | 2391 | K1ba | 0.97 | 0.09 | –27.0 |
| Y1 | 2995.4 | K1ba | 0.92 | 0.25 | –27.6 |
| No. | Well | Depth (m) | Strata | MPC | ∑nC21− | nC21+22 | Pr/Ph | Pr/n-C17 | Ph/n-C18 | CPI | OEP |
|---|---|---|---|---|---|---|---|---|---|---|---|
| ∑nC22+ | nC28+29 | ||||||||||
| 1 | Y2 | 437.5 | K1bs | C23 | 0.61 | 1.30 | 0.68 | 0.58 | 0.86 | 1.51 | 1.58 |
| 2 | Y1 | 852.1 | K1bs | C23 | 0.30 | 2.62 | 0.42 | 0.58 | 0.78 | 1.66 | 1.24 |
| 3 | Y1 | 949.3 | K1bs | C25 | 0.25 | 1.64 | 0.50 | 0.59 | 0.71 | 2.03 | 1.79 |
| 4 | Y1 | 1051.7 | K1bs | C27 | 0.26 | 1.26 | 0.66 | 0.65 | 0.81 | 2.20 | 2.36 |
| 5 | Y2 | 830 | K1bt2 | C27 | 0.53 | 0.72 | 0.73 | 0.66 | 0.86 | 1.54 | 1.61 |
| 6 | Y2 | 969.8 | K1bt2 | C18 | 1.08 | 4.13 | 0.77 | 0.54 | 0.70 | 1.54 | 0.96 |
| 7 | Y2 | 1077.5 | K1bt2 | C27 | 0.51 | 0.63 | 0.75 | 0.67 | 0.84 | 1.61 | 1.52 |
| 8 | Y1 | 1188.3 | K1bt2 | C25 | 0.23 | 1.42 | 0.42 | 0.56 | 0.76 | 2.17 | 1.81 |
| 9 | Y2 | 1235 | K1bt2 | C27 | 0.65 | 1.41 | 0.66 | 0.67 | 0.98 | 1.13 | 1.20 |
| 10 | Y1 | 1372.5 | K1bt2 | C23 | 0.22 | 1.43 | 0.56 | 0.55 | 0.59 | 2.07 | 1.32 |
| 11 | Y2 | 1379 | K1bt2 | C29 | 0.47 | 0.66 | 0.80 | 0.68 | 0.61 | 1.36 | 1.69 |
| 12 | Y2 | 1468.1 | K1bt2 | C27 | 0.43 | 0.89 | 0.77 | 0.57 | 0.64 | 1.49 | 1.44 |
| 13 | Y2 | 1555.4 | K1bt1 | C25 | 0.54 | 0.85 | 1.47 | 0.68 | 0.49 | 1.77 | 1.74 |
| 14 | Y2 | 1673.7 | K1bt1 | C29 | 0.39 | 0.6 | 1.00 | 0.56 | 0.54 | 1.28 | 1.52 |
| 15 | Y2 | 1679.4 | K1bt1 | C27 | 0.34 | 0.57 | 0.69 | 0.58 | 0.66 | 1.19 | 1.19 |
| 16 | Y2 | 1725 | K1bt1 | C25 | 0.70 | 1.35 | 1.12 | 0.31 | 0.28 | 2.18 | 1.99 |
| 17 | Y2 | 1806.4 | K1bt1 | C25 | 0.55 | 4.15 | 0.35 | 0.44 | 0.58 | 1.12 | 1.09 |
| 18 | Y2 | 1833.5 | K1bt1 | C27 | 0.56 | 0.91 | 1.16 | 0.27 | 0.26 | 2.71 | 2.72 |
| 19 | Y2 | 1836.5 | K1bt1 | C27 | 0.59 | 1.27 | 1.08 | 0.33 | 0.30 | 2.31 | 2.62 |
| 20 | Y2 | 1912.7 | K1bt1 | C23 | 0.57 | 0.17 | 2.01 | 0.74 | 0.27 | 1.79 | 1.72 |
| 21 | Y2 | 1994.6 | K1bt1 | C18 | 0.54 | 0.71 | 0.50 | 0.35 | 0.54 | 1.16 | 0.92 |
| 22 | Y2 | 2079 | K1bt1 | C23 | 0.82 | 2.00 | 0.92 | 0.26 | 0.27 | 1.71 | 1.26 |
| 23 | Y2 | 2092.5 | K1bt1 | C25 | 0.89 | 2.68 | 2.04 | 0.34 | 0.15 | 1.47 | 1.48 |
| 24 | Y2 | 2096.2 | K1bt1 | C25 | 0.26 | 3.13 | 1.08 | 0.14 | 0.08 | 1.53 | 1.30 |
| 25 | Y1 | 2112.5 | K1bt1 | C23 | 0.31 | 3.01 | 0.61 | 0.58 | 0.67 | 1.40 | 1.10 |
| 26 | Y2 | 2116.5 | K1bt1 | C27 | 0.71 | 1.16 | 1.02 | 0.29 | 0.29 | 2.11 | 2.05 |
| 27 | Y2 | 2206.2 | K1bt1 | C27 | 0.27 | 0.31 | 0.55 | 0.45 | 0.69 | 1.16 | 1.10 |
| 28 | Y1 | 2246.3 | K1bt1 | C23 | 0.44 | 2.01 | 0.38 | 0.53 | 0.94 | 1.14 | 1.08 |
| 29 | Y2 | 2257.5 | K1bt1 | C19 | 1.12 | 2.76 | 1.11 | 0.24 | 0.21 | 1.35 | 1.03 |
| 30 | Y2 | 2288 | K1bt1 | C17 | 0.89 | 0.73 | 1.83 | 0.65 | 0.39 | 1.23 | 0.99 |
| 31 | Y1 | 2299.5 | K1bt1 | C23 | 0.41 | 2.12 | 0.53 | 0.54 | 0.72 | 1.33 | 1.18 |
| 32 | Y1 | 2455.5 | K1bt1 | C23 | 0.42 | 2.68 | 0.33 | 0.35 | 0.37 | 1.40 | 1.10 |
| 33 | Y1 | 2550.9 | K1bt1 | C23 | 0.43 | 3.39 | 0.45 | 0.40 | 0.63 | 1.15 | 1.12 |
| 34 | Y2 | 2307 | K1ba | C19 | 1.04 | 3.36 | 1.12 | 0.35 | 0.30 | 1.32 | 1.03 |
| 35 | Y2 | 2355.4 | K1ba | C21 | 1.89 | 2.48 | 1.83 | 0.21 | 0.11 | 1.28 | 1.07 |
| 36 | Y2 | 2356.5 | K1ba | C21 | 1.21 | 3.04 | 1.69 | 0.46 | 0.27 | 1.41 | 1.14 |
| 37 | Y2 | 2391 | K1ba | C16 | 1.07 | 0.71 | 2.07 | 0.89 | 0.48 | 1.29 | 0.91 |
| 38 | Y1 | 2642.9 | K1ba | C23 | 0.4 | 1.86 | 1.08 | 0.45 | 0.30 | 1.58 | 1.30 |
| 39 | Y1 | 2705.4 | K1ba | C23 | 0.41 | 3.15 | 0.99 | 0.50 | 0.35 | 1.42 | 1.18 |
| 40 | Y1 | 2755.3 | K1ba | C23 | 0.54 | 2.63 | 1.39 | 0.46 | 0.25 | 1.38 | 1.16 |
| 41 | Y1 | 2812 | K1ba | C23 | 0.65 | 3.22 | 0.69 | 0.27 | 0.35 | 1.39 | 1.25 |
| 42 | Y1 | 2872.5 | K1ba | C23 | 0.59 | 3.18 | 0.47 | 0.37 | 0.59 | 1.23 | 1.18 |
| 43 | Y1 | 2927 | K1ba | C23 | 0.55 | 2.74 | 0.51 | 0.33 | 0.46 | 1.36 | 1.18 |
| 44 | Y1 | 2989.9 | K1ba | C23 | 0.59 | 2.80 | 0.63 | 0.32 | 0.38 | 1.37 | 1.18 |
| Strata | Statistical Well Sections (m) | Maximum Values | Minimum Value | Average Value |
|---|---|---|---|---|
| K1bs | 646–925 | 21.828 | 0.662 | 4.311 |
| 925–1181 | 8.158 | 3.145 | 6.54 | |
| K1bt2 | 1181–1497 | 80.75 | 2.012 | 13.78 |
| 1497–2055.5 | 80.267 | 4.67 | 23.327 | |
| K1bt1 | 2055.5–2263 | 7.65 | 2.45 | 5.89 |
| 2263–2420 | 8.478 | 2.68 | 4.6 | |
| 2420–2575 | 54.23 | 2.36 | 6.31 | |
| K1ba4 | 2575–2743 | 10.15 | 2.21 | 6.71 |
| K1ba3 | 2743–3008 | 8.259 | 0.37 | 4.29 |
| K1ba2 | 3008–3250 | 36.58 | 2.46 | 20.20 |
| Well | Depth (m) | TOC (%) | Tmax (℃) | HI (mg/g) | S1 (mg/g) | S2 (mg/g) | S1 + S2 (mg/g) | Organic Matter Type | Evaluation |
|---|---|---|---|---|---|---|---|---|---|
| Shun1–7 | 2200–2250 | 1.58 | 439 | 350 | 0.22 | 5.53 | 5.75 | II1 | fair |
| Shun1–7 | 2270–2290 | 1.98 | 440 | 423 | 0.42 | 8.37 | 8.79 | II1 | good |
| Shun1–7 | 2290–2310 | 1.89 | 439 | 410 | 0.27 | 7.75 | 8.02 | II1 | good |
| Shun2 | 1300–1342 | 2.05 | 434 | 483 | 0.17 | 9.9 | 10.07 | II1 | good |
| Shun2 | 1340 | 5.35 | 433 | 710 | 0.82 | 37.97 | 38.79 | I | good |
| Shun2 | 1466–1491 | 2.29 | 432 | 523 | 0.24 | 11.98 | 12.22 | II1 | good |
| Shun2 | 1469–1479 | 2.51 | 433 | 337 | 0.15 | 8.47 | 8.62 | II1 | good |
| Shun2 | 1480–1490 | 3.78 | 435 | 544 | 0.48 | 20.58 | 21.06 | I | good |
| Ba2 | 1865 | 2.55 | 437 | 722 | 0.18 | 18.41 | 18.6 | I | good |
| Ba2 | 1880 | 2.37 | 437 | 603 | 0.13 | 14.32 | 14.46 | I | good |
| Ba1 | 1355 | 1.16 | 438 | 341 | 0.02 | 3.94 | 3.96 | III | fair |
| Ba1 | 1365 | 0.17 | 428 | 74 | 0.00 | 0.13 | 0.13 | III | poor |
| Ba1 | 1376 | 1.49 | 436 | 377 | 0.02 | 5.62 | 5.64 | II1 | fair |
| Ba1 | 1385 | 1.90 | 433 | 493 | 0.05 | 9.37 | 9.42 | II1 | good |
| Ba1 | 1396 | 0.73 | 440 | 193 | 0.01 | 1.41 | 1.41 | II2 | non |
| Ba1 | 1406 | 1.50 | 434 | 429 | 0.03 | 6.42 | 6.45 | II1 | good |
| Ba1 | 1416 | 1.73 | 434 | 520 | 0.04 | 9.02 | 9.05 | II1 | good |
| Ba1 | 1426 | 1.72 | 436 | 385 | 0.02 | 6.63 | 6.66 | II1 | good |
| Ba1 | 1436 | 1.57 | 436 | 350 | 0.02 | 5.50 | 5.52 | II1 | fair |
| Ba1 | 1446 | 1.20 | 438 | 280 | 0.02 | 3.36 | 3.38 | II1 | fair |
| Ba1 | 1456 | 1.18 | 437 | 190 | 0.01 | 2.24 | 2.25 | II2 | fair |
| Ba1 | 1466 | 1.76 | 434 | 377 | 0.04 | 6.63 | 6.67 | II1 | good |
| Ba1 | 1476 | 1.24 | 436 | 287 | 0.02 | 3.56 | 3.58 | II1 | fair |
| Ba1 | 1486 | 1.46 | 434 | 272 | 0.03 | 5.43 | 5.46 | II1 | fair |
| Ba1 | 1496 | 1.48 | 438 | 343 | 0.04 | 5.06 | 5.09 | II1 | fair |
| Ba1 | 1506 | 1.54 | 435 | 364 | 0.05 | 5.62 | 5.66 | II1 | fair |
| Ba1 | 1516 | 0.85 | 438 | 211 | 0.00 | 1.80 | 1.80 | II2 | poor |
| Ba1 | 1526 | 1.58 | 435 | 433 | 0.04 | 6.84 | 6.88 | II1 | good |
| Ba1 | 1536 | 1.29 | 439 | 389 | 0.01 | 5.02 | 5.02 | II1 | fair |
| Ba1 | 1546 | 2.77 | 434 | 749 | 0.03 | 20.71 | 20.73 | I | excellent |
| Ba1 | 8706 | 1.30 | 436 | 426 | 0.00 | 5.55 | 5.55 | II1 | fair |
| Ba1 | 1566 | 1.52 | 436 | 570 | 0.01 | 8.67 | 8.68 | II1 | good |
| Ba1 | 1576 | 2.10 | 437 | 657 | 0.01 | 13.77 | 13.78 | I | good |
| Ba1 | 1586 | 2.63 | 432 | 679 | 0.02 | 17.84 | 17.86 | I | good |
| Ba1 | 1596 | 2.06 | 435 | 649 | 0.01 | 13.38 | 13.38 | I | good |
| Ba1 | 1605 | 2.75 | 432 | 723 | 0.03 | 19.85 | 19.88 | I | good |
| Ba1 | 1686 | 1.63 | 435 | 569 | 0.00 | 9.28 | 9.28 | II1 | good |
| Ba1 | 1725 | 1.63 | 432 | 625 | 0.00 | 10.17 | 10.17 | I | good |
| Ba1 | 1736 | 1.72 | 433 | 577 | 0.00 | 9.91 | 9.91 | II1 | good |
| Ba1 | 1746 | 2.35 | 436 | 725 | 0.03 | 17.04 | 17.07 | I | good |
| Ba1 | 1846 | 2.72 | 435 | 702 | 0.00 | 19.09 | 19.10 | I | good |
| Ba1 | 1855 | 2.52 | 434 | 680 | 0.03 | 17.14 | 17.17 | I | good |
| Ba1 | 1880 | 3.32 | 439 | 768 | 0.01 | 25.51 | 25.52 | I | excellent |
| Ba1 | 1891 | 4.15 | 434 | 378 | 0.05 | 15.70 | 15.75 | II1 | good |
| Ba1 | 1901 | 3.40 | 438 | 776 | 0.06 | 26.34 | 26.39 | I | excellent |
| Ba1 | 1910 | 3.47 | 437 | 772 | 0.04 | 26.81 | 26.84 | I | excellent |
Disclaimer/Publisher’s Note: The statements, opinions and data contained in all publications are solely those of the individual author(s) and contributor(s) and not of MDPI and/or the editor(s). MDPI and/or the editor(s) disclaim responsibility for any injury to people or property resulting from any ideas, methods, instructions or products referred to in the content. |
© 2025 by the authors. Licensee MDPI, Basel, Switzerland. This article is an open access article distributed under the terms and conditions of the Creative Commons Attribution (CC BY) license (https://creativecommons.org/licenses/by/4.0/).
Share and Cite
Yao, J.; Ren, Z.; Qi, K.; Liu, J.; Guo, S.; Xing, G.; Liu, Y.; Jia, M. Geochemical Characteristics and Controlling Factors of Lower Cretaceous Lacustrine Hydrocarbon Source Rocks in the Erdengsumu Sag, Erlian Basin, NE China. Processes 2025, 13, 2412. https://doi.org/10.3390/pr13082412
Yao J, Ren Z, Qi K, Liu J, Guo S, Xing G, Liu Y, Jia M. Geochemical Characteristics and Controlling Factors of Lower Cretaceous Lacustrine Hydrocarbon Source Rocks in the Erdengsumu Sag, Erlian Basin, NE China. Processes. 2025; 13(8):2412. https://doi.org/10.3390/pr13082412
Chicago/Turabian StyleYao, Juwen, Zhanli Ren, Kai Qi, Jian Liu, Sasa Guo, Guangyuan Xing, Yanzhao Liu, and Mingxing Jia. 2025. "Geochemical Characteristics and Controlling Factors of Lower Cretaceous Lacustrine Hydrocarbon Source Rocks in the Erdengsumu Sag, Erlian Basin, NE China" Processes 13, no. 8: 2412. https://doi.org/10.3390/pr13082412
APA StyleYao, J., Ren, Z., Qi, K., Liu, J., Guo, S., Xing, G., Liu, Y., & Jia, M. (2025). Geochemical Characteristics and Controlling Factors of Lower Cretaceous Lacustrine Hydrocarbon Source Rocks in the Erdengsumu Sag, Erlian Basin, NE China. Processes, 13(8), 2412. https://doi.org/10.3390/pr13082412