Abstract
Petal-shaped distribution networks are receiving increasing attention due to their enhanced reliability. However, the integration of distributed generators (DGs) significantly alters the fault characteristics during single-phase to ground faults. Traditional short-circuit calculation methods become inadequate due to the unmodeled effects of negative sequence current control in DGs. To address this challenge, this study establishes, for the first time, a mathematical model for single-phase to ground faults in a petal-shaped network with DG integration under both positive and negative sequence control. It explicitly derives the DGs’ output current under three control goals: maintaining constant active power, maintaining constant reactive power, and injecting a symmetric three-phase current. Utilizing the symmetrical component method, a composite sequence network incorporating the DGs’ negative sequence current output is developed. Based on the node–voltage relationships, an analytical short-circuit current calculation method suitable for multiple control goals is proposed. Validation via MATLAB R2022a simulations demonstrates high-fidelity accuracy: in Case 1 with different fault locations, the maximum relative error is 0.31%, while in Case 2, it is 2.04%. These results quantify the critical impact of the negative sequence current—reaching up to 14.78% of the DG output during severe voltage sags—providing theoretical support for the protection design of a petal-shaped distribution network with high DG integration.
1. Introduction
A distribution network typically adopts a radial structure with a “closed-loop design, open-loop operation.” Compared to a traditional radial distribution network that may cause extensive impacts and prolonged outage durations during faults, a closed-loop petal-shaped distribution network offers advantages including a maintained power supply during maintenance, flexible operational control strategies, and high economic efficiency [1,2,3]. Currently, countries around the world are conducting research on petal-shaped distribution networks. Zhao [4] introduced the wiring modes of power distribution systems in international metropolises such as Paris, Tokyo, and Singapore. Singapore’s 20 kV petal network sets the global benchmark for dual-source closed-loop operation within petals and hot standby interconnection between petals. Paris employs a multi-layer ring structure (outer/middle/inner rings) for flexible expansion. However, due to the looped structure of petal-shaped networks, they exhibit the characteristic of dual-terminal fault current contribution during faults, imposing higher requirements on the relay protection configuration.
On the other hand, driven by the “carbon peak” and “carbon neutrality” goals, new energy power technologies have experienced rapid development [5,6,7]. Vigorously developing photovoltaics and constructing a new power system dominated by new energy are critical pathways to achieving these targets [8,9,10]. With the rapid growth of renewables like photovoltaics, distribution networks are undergoing a transformative shift from traditional unidirectional supply to multi-source cooperative operation modes, accompanied by increasingly complex fault characteristics. Against this backdrop, the integration of DGs with petal-shaped distribution networks further complicates short-circuit current calculation. Therefore, research on short-circuit current analysis and calculation for DG-integrated petal-shaped networks holds significant importance for building security frameworks for new power systems.
Given the simple structure and widespread application of radial distribution networks, numerous scholars have conducted research on the short-circuit current in radial distribution networks with DG integration. Reference [11] proposed an optimal voltage support method for the point of common coupling during grid faults. Reference [12] developed a short-circuit current calculation method integrating modern fault ride-through (FRT) standards, addressing protection equipment timing errors in distribution networks with high-penetration DGs. Reference [13] developed an improved triangle circuit method for accurate short-circuit current calculation in isolated AC microgrids with DG virtual impedance current limiters (VICLs). Reference [14] deployed trained artificial intelligence (AI) models to map a short-circuit current to distribution grid features, accelerating the computations in high-DG-penetration networks. Reference [15] developed a robust microgrid short-circuit current calculation method applicable to grid-connected, islanded, and public-grid-integrated operations, overcoming traditional methodological limitations. Reference [16] proposed converting negative and zero sequence networks to positive sequence equivalents to derive the DG contributions under balanced grid conditions.
In contrast, a petal-shaped distribution network employs multi-loop structures, offering higher power supply reliability than a radial network, introducing greater complexity. Several studies have investigated petal-type networks. Reference [17] proposed a feeder automation solution for a closed-loop petal-shaped distribution network using fiber-optic longitudinal differential protection to isolate faults within 200 ms. Reference [18] proposed a voltage-prediction-error-based relay protection principle for a dual petal-shaped distribution network, demonstrating high sensitivity across diverse fault scenarios. Reference [19] proposed a multi-strategy fault location method for a petal-shaped distribution network with inverter-interfaced distributed generation, addressing asymmetric and symmetric faults through tailored electrical parameter analyses. Reference [20] addressed fault isolation in a petal-shaped distribution network by proposing a dual-criteria backup protection scheme combining multi-terminal differential protection and active power trend analysis. Reference [21] demonstrated DG-induced zero-sequence network modifications and the distinct “decrease-then-increase” pattern of positive/zero sequence current along DG downstream lines with fault location movement. Reference [22] proposed a three-level intelligent protection strategy based on an artificial neural network (ANN) to address the protection challenges of a petal-shaped distribution network with high DG penetration. Reference [23] used digital twins to verify the petal-shaped distribution network protection, revealing islanding-mode directional overcurrent relay failure due to a short-circuit current drop. Reference [24] solved the petal-shaped distribution network directional overcurrent relay coordination, dynamically adjusting parameters via hybrid optimization to adapt to DG/EV/FACTS-introduced fault characteristic changes. Reference [25] proposed a neural network fusion algorithm to address the special challenges of fault detection in petal microgrids, and verified its superiority in the IEEE-5 ring testing system. Reference [26] pioneered differential evolution for 35 kV petal-shaped distribution network planning, solving ring-network dynamic adaptation via combined economy-reliability metrics and load density optimization. Reference [27] identified the “high voltage quality, low stability margin” contradiction in the petal-shaped distribution network, proving closed-loop structures’ susceptibility to LC resonance, necessitating high-frequency oscillation suppression.
Existing research on DG-integrated petal-shaped networks fails to adequately address the impact of negative sequence control strategies. When DGs connect via inverters, fault currents exhibit strong nonlinear characteristics: during asymmetrical faults, negative sequence control significantly alters the DG output, making modeling of positive/negative sequence interactions challenging.
Considering the typicality of single-phase to ground faults in distribution networks, this paper focuses on single-phase to ground faults in petal-shaped distribution networks with negative sequence current control. Firstly, the topology of a petal-shaped distribution network was presented, detailing the underlying control principles and strategic methodologies of DGs under asymmetric fault conditions. Building upon this foundation, the core analytical framework was introduced: it constructed a comprehensive composite sequence network model explicitly incorporating DG grid-interconnection dynamics, followed by a rigorous mathematical derivation of both positive sequence and negative sequence current expressions for DGs operating under distinct control objectives. The analytical developments ultimately yielded a validated methodology for the precise assessment of fault current magnitudes at the fault location. Finally, rigorous validation was provided through simulations. These simulations quantitatively verified the operational efficacy of the proposed method while establishing a definitive correlation between PCC voltage sag severity and the magnitude of DG-generated negative sequence current.
The main contributions of this work are as follows:
- (1)
- A DG grid-connected mathematical model covering positive and negative dual sequence control was constructed through the grid-connected structure of DGs in a petal-shaped distribution network. A composite sequence network model considering the DG negative sequence current output was established based on the symmetrical component method.
- (2)
- An analytical short-circuit current calculation method based on nodal–voltage relationships, adaptable to multiple control goals (e.g., constant active power, constant reactive power, and symmetrical current output) was proposed, with demonstrated computational efficiency.
- (3)
- The effectiveness of the proposed method was verified in the two petal-shaped distribution network simulation models constructed, and the different performances of DGs’ output current under different voltage sag scenarios were also analyzed.
2. Topology of Petal-Shaped Distribution Network with DG Integration and Asymmetric Fault Control of DG
2.1. Topology of Petal-Shaped Distribution Network with DG Integration
The petal-shaped distribution network model is shown in Figure 1 [1].
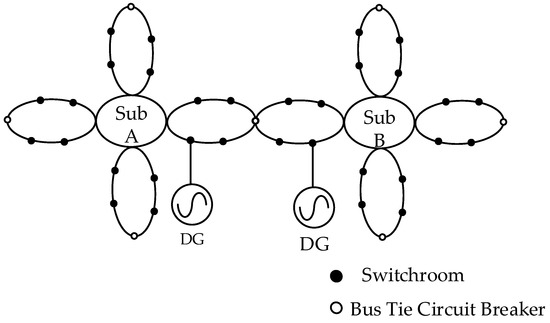
Figure 1.
Petal-shaped distribution network model.
In Figure 1, multiple feeder lines from the same substation interconnect to form a closed-loop trunk line, with each closed-loop trunk constituting a “petal”. Petals from different substations can either interconnect for closed-loop operation or operate independently in an open-loop mode. This configuration enables rapid isolation of faults within any single petal while maintaining a continuous power supply to users through adjacent petals, thereby minimizing outage impacts. The petal structure facilitates seamless expansion and accommodates new DG connections. After DGs’ integration, reliability is significantly enhanced; during faults, DGs serve as a backup power source, providing uninterrupted support to critical loads and strengthening the “N-1” power supply mode. However, the short-circuit current output from DGs during faults is constrained by inverter control strategies, increasing the computational complexity for asymmetrical faults in ring-structured petal networks. Figure 2 [21] illustrates a single-petal distribution network with DG integration: ES denotes the system power source, T1 is the main transformer, T2 is the DG grid connected transformer, and T3 is the system grounding transformer, where one outgoing line from the same substation’s busbar loops through multiple switchrooms and returns to another busbar of the same substation, forming the petal structure.
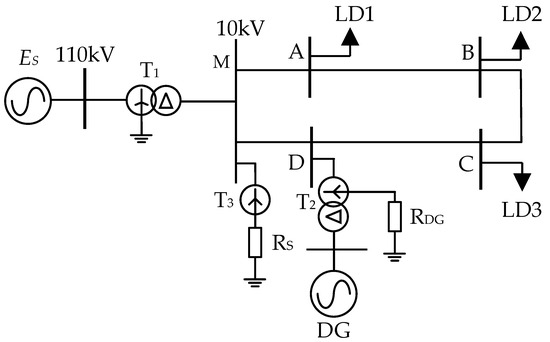
Figure 2.
Structure of a single-petal distribution network unit.
2.2. DG Control Principles Under Asymmetric Faults
During asymmetrical short-circuit faults, the emergence of negative sequence components induces current asymmetry and double-frequency oscillations in active/reactive power. To address this problem, a DG can adopt a dual-current control strategy in the positive/negative sequence dq rotating coordinate frames. This approach enables independent regulation of the positive and negative sequence components of the DG grid-connected current, thereby suppressing double-frequency power fluctuations and asymmetrical current. The grid-tied topology of the DGs is illustrated in Figure 3 [11], where the DC-side control circuit is omitted. The inverter connects to the point of common coupling (PCC) via filtering components and interfaces with the grid.
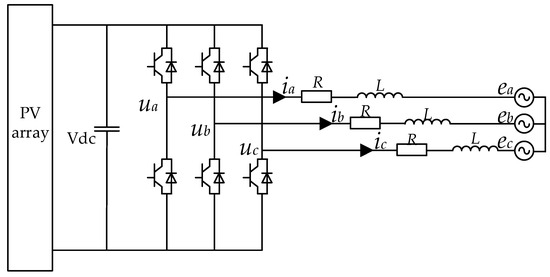
Figure 3.
Grid-tied DG topology.
Based on the topology in Figure 3, the mathematical model for the grid-connected inverter in the three-phase abc coordinate frame is derived as follows:
where uabc represents the AC-side output voltage of the inverter; iabc denotes the AC-side output current of the inverter; eabc is the voltage at the PCC; and R and L are the equivalent resistance and the filter inductance, respectively. By sequentially applying Clarke transformation and Park transformation to Equation (1), the mathematical model of the DG in the synchronous rotating dq coordinate frame is derived as follows:
where ud+, uq+, ud−, uq− represent the positive/negative sequence dq-axis components of the inverter output voltage, respectively; id+, iq+, id−, iq− denote the positive/negative sequence dq-axis components of the inverter output current, respectively; ed+, eq+, ed−, eq− are the positive/negative sequence dq-axis components of the grid voltage, respectively; and is the grid angular frequency.
Based on the independent control of positive/negative sequence components, the expressions for the instantaneous active power Pg and reactive power Qg output by a DG are derived as follows:
In the expressions, Pg0 and Qg0 are the reference values for the active/reactive power output of the DG; Pgc2 and Pgs2 represent the amplitudes of the double-frequency oscillating components in the DG’s active power output; and Qgc2 and Qgs2 denote the amplitudes of the double-frequency oscillating components in the DG’s reactive power output. The specific expressions are derived as follows:
Based on the expressions in Equations (3) and (4), it can be observed that under asymmetric grid voltage conditions, the instantaneous power output of a DG contains double-frequency oscillations. By controlling the positive/negative sequence dq-axis current components id+, iq+, id−, and iq−, the DG’s output power can be regulated to suppress these double-frequency power fluctuations.
Figure 4 illustrates the principle of dual-sequence independent control in a DG. Here, id+*, iq+*, id−*, and iq−* represent the reference values for the dq-axis positive/negative sequence current of the inverter.
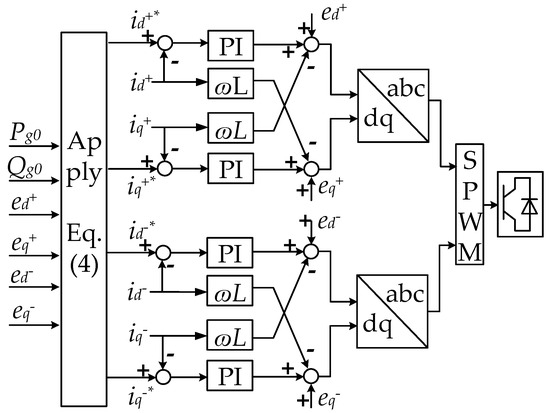
Figure 4.
Schematic of dual-sequence independent control.
2.3. DG Output Characteristics Under Asymmetric Faults
Equation (4) indicates that asymmetric components can be suppressed by setting different control goals. The common control goals include the following [28,29]: Maintain constant active power output (Goal 1); maintain constant reactive power output (Goal 2); and output symmetrical three-phase current (Goal 3). These three goals are mutually constrained. For instance, achieving a symmetrical current (Goal 3) requires suppressing a negative sequence current, which inevitably causes oscillations in the active and reactive power. Therefore, all three goals cannot be simultaneously satisfied. In Equation (4), a phase-locked loop (PLL, which is an electronic closed-loop control system that synchronizes an output signal’s phase and frequency to a reference input) dynamically tracks the grid voltage phase to align the d-axis with the voltage vector, resulting in eq+ = eq− = 0 (eliminating q-axis voltage components). Simultaneously, the d-axis voltages are set as ed+ = V+, ed− = V−, where V+ and V− denote the amplitudes of the positive/negative sequence grid voltages.
Under Goal 1, the double-frequency oscillating components of active power are suppressed to zero, meaning Pgc2 = Pgs2 = 0. Consequently, active power contains no fluctuating components, and the DG output current is given by the following:
where A = (V+)2 − (V−)2; B = (V+)2 + (V−)2.
Under Goal 2, the double-frequency oscillating components of reactive power are suppressed to zero, meaning Qgc2 = Qgs2 = 0. This control strategy facilitates voltage recovery in the main grid by providing dynamic reactive power support. The DG output current is given by the following:
Under Goal 3, DG is controlled to suppress negative sequence current output. Consequently, the DG output current is given by the following:
This section presents the topology and mathematical model of a DG integrated into a petal-shaped distribution network. The subsequent analysis will combine the short-circuit output current formulas under different control goals with this specific network model to perform calculations for single-phase to ground faults. This approach aims to reveal the impact of the DG’s negative sequence current output on the short-circuit characteristics of the petal-shaped network, thereby providing theoretical support for fault analysis and protection design in such systems.
3. Single-Phase to Ground Fault Current Calculation in Petal Networks with DGs
3.1. Network Analysis for Single-Phase to Ground Fault
The petal-shaped distribution network structure proposed in reference [21] employs a low-resistance grounding scheme for both the grid side and the DG grid-connection transformer. To simplify the analysis, this study adopts the DG grid-connection model shown in Figure 5. In this figure, ZMF represents the impedance from Bus M to Fault Point F; ZFD denotes the impedance from Fault Point F to Bus D; and ZDM equals the impedance from Bus D to Bus M.
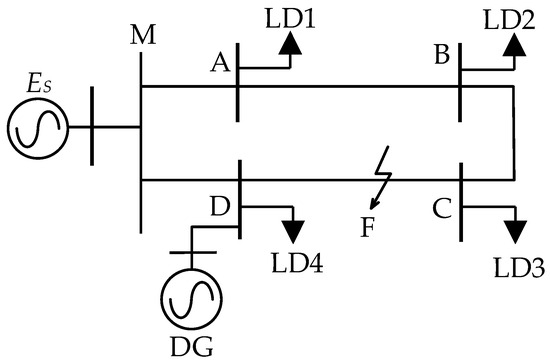
Figure 5.
Topology of the DG-integrated petal-shaped distribution network.
Based on the boundary conditions of a single-phase to ground fault—where the fault phase voltage is zero and the non-faulted phase currents are negligible—the positive sequence, negative sequence, and zero sequence networks at the fault point are series-connected with equal sequence current. In the positive sequence network, the DG is modeled as a voltage-controlled current source (IS+) governed by the PCC voltage (V+). In the negative sequence network, the DG acts as a voltage-controlled current source (IS−) regulated by the negative sequence voltage (V−) [30]. Assume a single-phase to ground fault occurs at point F. Using the symmetrical component method, the composite sequence network for the DG-integrated petal-shaped distribution network is derived, as illustrated in Figure 6, in which I is the amplitude of the positive sequence current at the short-circuit point, and subscripts 1, 2 and 0 represent the positive and negative zero sequence components, respectively. Zf represents the grounding impedance at the fault location.
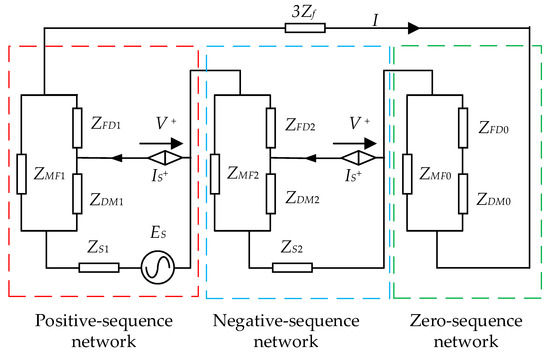
Figure 6.
Composite sequence network.
To facilitate analytical calculations, the star-delta transformation method is applied to simplify the composite sequence network. The result of the simplified composite sequence network is illustrated in Figure 7.
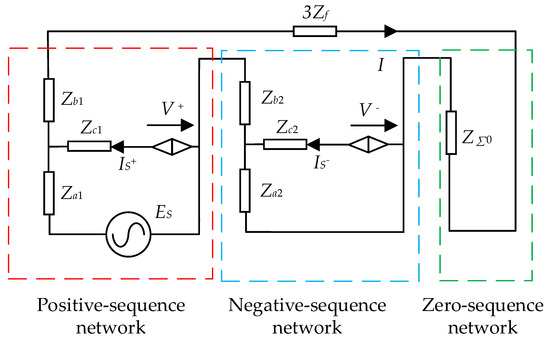
Figure 7.
Simplified composite sequence network.
Depending on the node voltage equations derived from Figure 7, Equation (8) is obtained as follows:
Based on Equation (8), the magnitude of the short-circuit current at the fault point is primarily determined by two key components: the short-circuit current injected by the system power source and the positive/negative sequence current contributed by the DG. Consequently, the total fault current can be fully quantified by solving for IS+ and IS−, the positive sequence and negative sequence current output of the DG. This analytical approach decouples the system-source contribution from the DG-dependent components, enabling precise fault current calculations under varying DG control strategies and network asymmetry conditions.
3.2. DG Output Current Calculation Under Asymmetric Faults
3.2.1. Calculation of DG Output Positive Sequence Current
During the asymmetrical single-phase to ground fault period, the DG must maintain low-voltage ride-through (LVRT) capability as specified in [31]. Under such fault scenarios, the expression for the positive sequence reactive current iq+ output by the DG is given in Equation (9) as follows:
where KV represents the regulation coefficient for positive sequence reactive current control, V∗ denotes the reference value for positive sequence voltage, and IN indicates the per-unit rated current of the DG.
For the primary control goal of maintaining constant active power output, Pg0 is established as a known predefined value, while the reactive power reference Qg0 remains undetermined during fault conditions. According to Equation (5), the expression for the positive sequence active current id+ generated by the DG is formulated as Equation (10).
By combining Equations (9) and (10), the expression for the DG’s output positive sequence current under Control Goal 1 is derived as follows:
3.2.2. Calculation of DG Output Negative Sequence Current
Analogous to the determination of the positive sequence active current id+ output by the DG, the negative sequence active current id− can be directly determined using Equation (5), as shown in Equation (12).
The DG’s output negative sequence reactive current iq− can also be solved according to Equation (5). It should be noted that Qg0 in Equation (5) is unknown and requires simultaneous solving. By combining Equation (9) and the expression for iq+ in Equation (5), the expression for Qg0 is derived as Equation (13).
Subsequently, substituting Qg0 into the expression for iq− provided in Equation (7) yields the revised expression for iq− as Equation (14).
By combining Equations (12) and (14), the expression for the DG output negative sequence current under Control Goal 1 is obtained as Equation (15).
3.2.3. Short-Circuit Current Calculation Method and Flowchart
For Control Goal 2, Qg0 is unknown and must be solved according to Equation (13). Consequently, its output current expression is given by the following:
For Control Goal 3, the DG output current contains no negative sequence component, and its output current expression is given by the following:
Based on the positive and negative sequence current expressions for the DG output described in Equations (11), (15)–(17), it is evident that the sequence current contributed by the DG depends on V+ and V−. Within Equations (11) and (15)–(17), the variables IS+, IS−, V+, and V− all remain unknown. Therefore, two additional equations are required to solve the system simultaneously. Incorporating Figure 7 and applying the node voltage equations of the petal-shaped network yields Equations (18) and (19).
In Equations (18) and (19), the meaning of Zm and Zn is shown below.
Equations (18) and (19) describe the relationship between the positive and negative sequence voltages at the PCC and the DG’s output positive and negative sequence currents. For the goal of maintaining constant active power output, the simultaneous solution of Equations (11), (15), (18) and (19) resolves the four unknowns IS+, IS−, V+, and V−. Substituting these results into Equation (8) then calculates the magnitude of the short-circuit current.
The short-circuit current calculation procedure for the petal-shaped distribution network proposed in this study is illustrated in Figure 8. Firstly, parameters are initialized by assigning critical control parameters such as the distribution network impedance and the reactive current regulation coefficient of renewable energy converters. Secondly, since different control strategies for DGs lead to distinct output characteristics in the power system, it is necessary to establish corresponding equations specific to the selected control goal. As described in Section 2.3, this involves defining equations that characterize the DG’s positive and negative sequence voltage–current relationships. Subsequently, based on the fault type and incorporating boundary conditions, a composite sequence network is constructed. Node voltage equations are then employed to determine the expressions for the short-circuit current and the functional relationship between the DG’s sequence voltages and current. Finally, the equations derived through these steps are assembled into a complete system of simultaneous equations. Solving this system yields the exact numerical value of the short-circuit current.
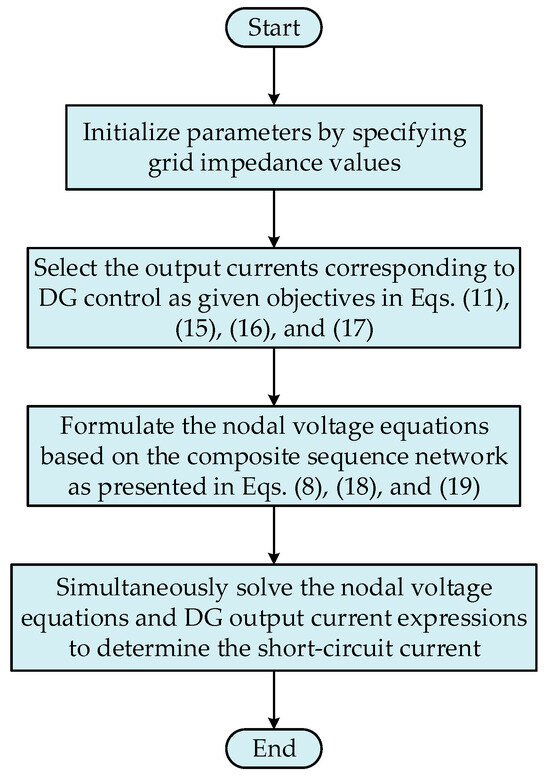
Figure 8.
Flowchart of the short-circuit current calculation.
4. Simulation Results and Discussion
4.1. Case 1
To validate the effectiveness of the calculation method proposed in Section 2, a simulation model corresponding to Figure 5 was established in Simulink R2022a. This model represents a single-petal 10 kV network, where the impedance between each bus is identical. The specific parameters are shown in Table 1.

Table 1.
Simulation parameters of Case 1.
By using MATLAB R2022a to solve the aforementioned equation, the short-circuit current can be obtained. The accuracy of the proposed method from Section 3 was verified by comparing the MATLAB R2022a-computed theoretical values with the Simulink simulation results. The outcomes for single-phase to ground faults occurring at various buses under different control goals are summarized in Table 2 and Table 3.

Table 2.
Short-circuit current under single-phase to ground faults with different control goals.

Table 3.
Voltage magnitudes during a single-phase to ground fault.
As demonstrated in Table 2, the theoretically calculated values of short-circuit currents align consistently with the simulation results across faults occurring at different buses. The theoretical values were obtained by solving simultaneous equations in MATLAB R2022a. The maximum absolute error is 8A (absolute error refers to the difference between theoretical and simulation values), while the maximum relative error stands at 0.31% (relative error refers to the absolute error divided by the theoretical value). This agreement validates the method’s precision in calculating fault currents for DG integration within petal-shaped networks.
The results are presented in Table 3, using the constant active power control goal as an example, further displaying the voltage and current magnitudes during a single-phase to ground fault. The data in Table 3 indicates that the three-phase voltages become asymmetrical but do not fall below 0.9 times the rated voltage. Therefore, low-voltage ride-through characteristics need not be considered under these operating conditions.
Figure 9, Figure 10, Figure 11 and Figure 12 display the power and current waveforms output by the inverter during the simulation. In Figure 9, the active power output of the inverter is 0.5 MW, and the reactive power output is close to zero. The P/W in Figure 9 refers to the active power output by the inverter and its unit watts, while Q/Var refers to the reactive power output by the inverter and its unit volt-amperes. Figure 10 depicts the positive and negative sequence current waveforms from the inverter. When the voltage drop at the PCC was minimal, the inverter output predominantly comprised the positive sequence current, with the negative sequence current being essentially negligible. Under these conditions, the contribution to the short-circuit current originated mainly from the positive sequence current output by the inverter, while the negative sequence current exerted negligible influence on the short-circuit current magnitude. Figure 11 and Figure 12 specifically illustrate the dq-axis current waveforms of the inverter output. As shown in Figure 13, throughout the simulation, since the voltage did not drop below 0.9 times the rated voltage, the DG did not inject reactive power, resulting in the q-axis positive and negative sequence current remaining at zero. Consequently, the DG output current primarily consisted of a d-axis current, with the d-axis positive sequence current maintained at 16.28 A and the d-axis negative sequence current consistently at zero.
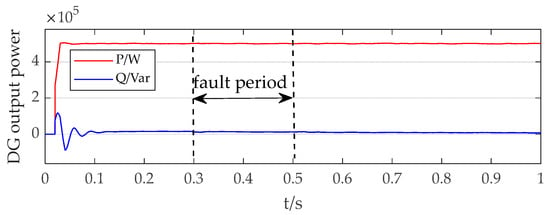
Figure 9.
Inverter output power.
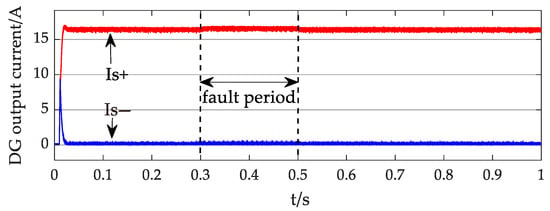
Figure 10.
Positive and negative sequence currents of the inverter output.
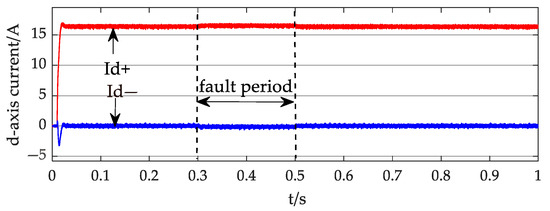
Figure 11.
The d-axis current of the inverter output.
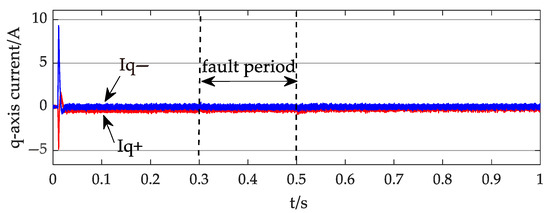
Figure 12.
The q-axis current of the inverter output.
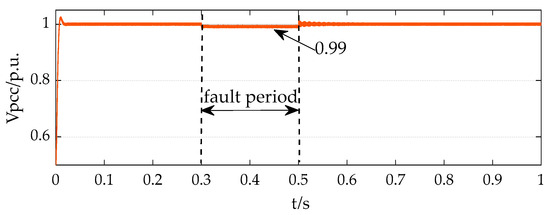
Figure 13.
PCC voltage per unit value.
Given that the d-axis current represents the active power output and the q-axis current denotes the reactive power output of the inverter, these observations align with the power output characteristics presented in Figure 9. The active power remained constant at 0.5 MW, while the reactive power consistently measured zero.
4.2. Case 2
Case 2 adopted the modified IEEE 33-bus dual-petal network system model for testing. The network structure is depicted in Figure 14. The system operates at a rated voltage of 10 kV, with DG units integrated at Nodes 22 and 18, respectively. The simulation results obtained for this configuration are summarized in Table 3.
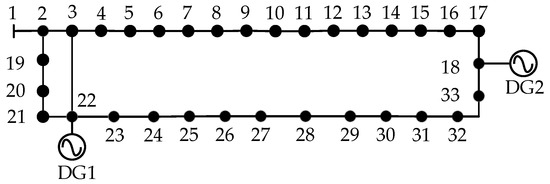
Figure 14.
Modified IEEE 33-bus dual-petal ring network.
As indicated in Table 4, the maximum absolute error between the theoretical and simulated values is approximately 14 A, with a maximum relative error of 2.04%. Furthermore, as shown in Figure 15, the variations in the electrical distance between the fault point and the main power source (Node 1) reveal a distinct symmetry in the short-circuit current distribution within the petal-shaped network. Specifically, the short-circuit current gradually decreases from Node 1 to Node 18, while increasing from Node 33 to Node 22, as the fault point moves closer to the main power source.

Table 4.
Short-circuit current under a single-phase to ground fault at different nodes.
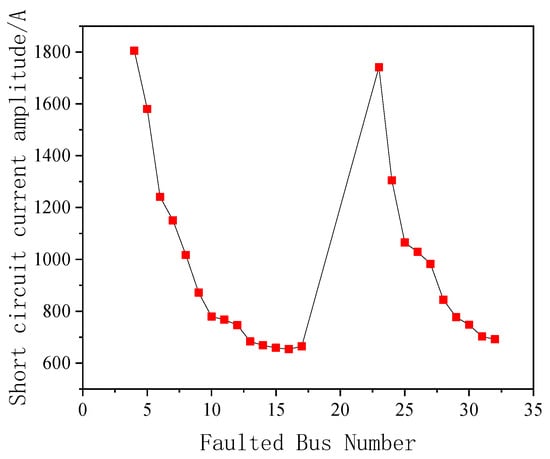
Figure 15.
Short-circuit current at different fault nodes.
Figure 16, Figure 17, Figure 18, Figure 19 and Figure 20 display the d-axis and q-axis current waveforms output by DG1 and DG2 during a single-phase to ground fault at Node 28. As depicted in Figure 16, during the fault, the per-unit voltage at DG1 drops to 0.97 while the per-unit voltage at DG2 decreases to 0.86. For DG1, since its PCC voltage does not fall below 0.9 per unit during the fault, the q-axis current remains at zero, indicating no reactive power injection for voltage support. In contrast, DG2 experiences a per-unit PCC voltage drop below 0.9, triggering its LVRT strategy. Consequently, the q-axis current increases to a notable extent, as evidenced in Figure 18, Figure 19 and Figure 20.
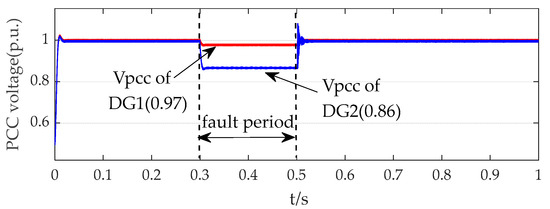
Figure 16.
Per-unit voltage at the DG connection point.
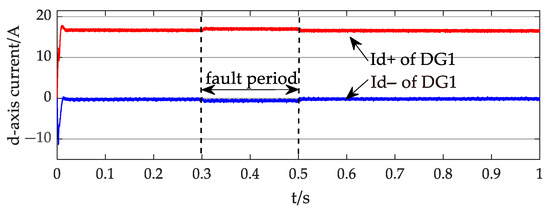
Figure 17.
The d-axis current of the DG1 output.
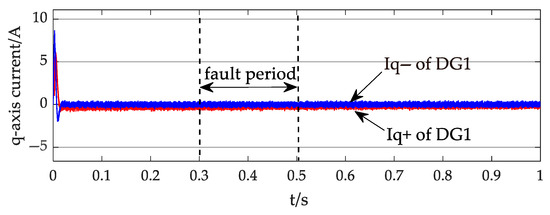
Figure 18.
The q-axis current of the DG1 output.
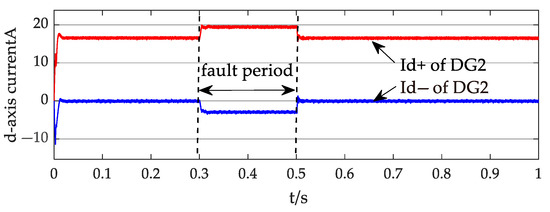
Figure 19.
The d-axis current of the DG2 output.
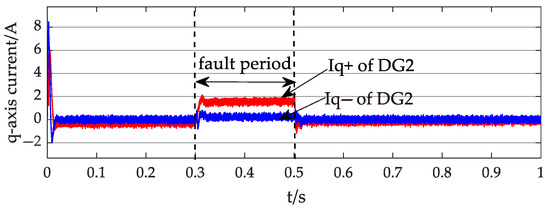
Figure 20.
The q-axis current of the DG2 output.
Based on the waveforms in Figure 16, Figure 17, Figure 18, Figure 19 and Figure 20, during the fault period, DG2 exhibits significantly more pronounced fluctuations in its d-axis current compared to DG1. This primarily occurs because the integration point of DG2 is closer to the fault location, resulting in a more severe voltage sag at its PCC than that experienced by DG1. Consequently, DG2 must increase its d-axis current to maintain constant active power output. As shown in Figure 19, the d-axis positive sequence current rises from the pre-fault value of 16.4 A to 19.9 A during the fault.
Simultaneously, DG2 injects a substantial reactive current to support voltage stability, causing corresponding fluctuations in its q-axis current. The three-phase output current waveforms and sequence components of DG2 are separately illustrated in Figure 21 and Figure 22.
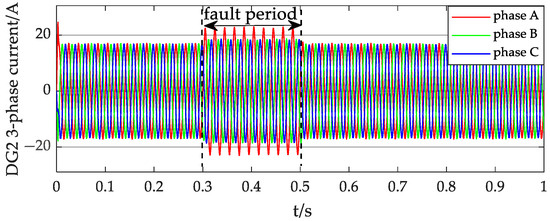
Figure 21.
Three-phase current of the DG2 output.
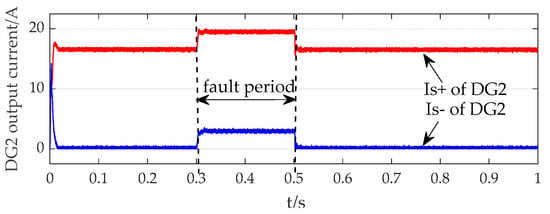
Figure 22.
Positive and negative sequence currents of the DG2 output.
Figure 21 and Figure 22 demonstrate that the peak fault-phase current of DG2 reaches approximately 23 A, with the positive sequence current measuring 19.96 A and the negative sequence current 3.4 A. The negative sequence current constitutes 14.78% of DG2’s total output current. Consequently, when the per-unit voltage at the DG’s PCC voltage drops below 0.9, the contribution of negative sequence current to the short-circuit current cannot be disregarded.
From Table 5, it can be seen that reference [21] assumes that the power output by the DG does not change with the drop in voltage, only considers PQ control, and assumes that the voltage only slightly drops during a fault, thus ignoring the influence of the negative sequence current. At this time, its maximum relative error is 6A. However, this study considers three different control goals, and the power output by the DG is not constant under different control goals. Meanwhile, in Case 2, when the voltage drops below 0.9, the LVRT control strategy will be triggered, and the negative sequence current accounts for 14.78% of the DG output current.

Table 5.
Comparison between this study and reference [21].
5. Conclusions
This paper investigates a calculation method for short-circuit currents in petal-shaped distribution networks integrated with DGs. Through theoretical analysis and case validation, the conclusions are as follows:
- (1)
- A comprehensive mathematical model for DG grid interconnection was established, incorporating both positive and negative sequence control strategies to accurately capture the inverter output characteristics during single-phase to ground faults, and the detailed mathematical formulations under various control goals were presented.
- (2)
- A composite sequence network model that integrates the negative sequence current output from DGs was developed, leveraging the symmetrical component method to enable precise analysis of fault currents in a petal-shaped distribution network, making up for the shortcomings of traditional methods that do not consider negative sequence control in a petal-shaped network.
- (3)
- An analytical short-circuit current calculation method based on the nodal–voltage relationships was proposed, adaptable to multiple control goals. The proposed method accurately calculates the short-circuit currents at fault locations, with maximum relative errors of only 0.31% in Case 1 and 2.04% in the modified IEEE 33-bus, demonstrating high computational precision that provides reliable theoretical support for fault analysis and protection design in petal networks. When the per-unit voltage at the DG’s PCC remains above 0.9, the negative sequence current minimally influences the distribution network’s short-circuit current, where the primary contributions originate from the DG’s positive sequence current. However, when the voltages drop below 0.9 per unit, negative sequence currents constitute 14.78% of the DG output current, making their impact non-negligible.
The method proposed in this article has high accuracy, but it relies on three pre-defined control goals and omits other control goals. In addition, this method does not consider the parameters of the machines, load and other components, and future research can consider extending the fault modeling to improve the computational performance under deep voltage sag.
Author Contributions
Conceptualization, F.G. (Fei Guo); Methodology, Y.K.; Software, H.Q.; Validation, R.L.; Formal analysis, X.D.; Writing—original draft, X.Y.; Writing—review & editing, C.C. and F.G. (Fang Guo). All authors have read and agreed to the published version of the manuscript.
Funding
This research received no external funding.
Data Availability Statement
The original contributions presented in this study are included in the article. Further inquiries can be directed to the corresponding author.
Conflicts of Interest
Authors Yilong Kang, Huanruo Qi, Xiangyang Yan, Chen Chen, Fei Guo, Fang Guo were employed by the Economic and Technological Research Institute of State Grid Henan Electric Power Company. The remaining authors declare that the research was conducted in the absence of any commercial or financial relationships that could be construed as a potential conflict of interest.
References
- Shao, C.; Yan, X.W.; Jia, J.X.; Wu, W.L. Two-Stage Speed-Power Control Strategy for Rotating Power Flow Controller in “Petal-Shaped” Distribution Networks. Trans. China Electrotech. Soc. 2025, 1, 25–63. [Google Scholar] [CrossRef]
- Chen, J.F.; Ren, H.T. Failure Study of DC Distribution System with all Converters Resistance-Grounded. In Proceedings of the 2024 6th Asia Energy and Electrical Engineering Symposium, Chengdu, China, 28–31 March 2024. [Google Scholar] [CrossRef]
- Kamberi, K.; Shaliu, D.; Çelo, M.; Bualoti, R. Hosting capacity calculation of photovoltaic penetration in a closed-loop distribution network: A case study. IET Conf. Proc. 2025, 29, 113–118. [Google Scholar] [CrossRef]
- Zhao, S.J.; Yang, P.; Hao, P.F. Load Partition and Planning Research of Distribution Networks. Electr. Power Syst. Clean Energy 2016, 8, 79–85. [Google Scholar]
- Villa-Ávila, E.; Ochoa-Correa, D.; Arévalo, P. Advancements in Power Converter Technologies for Integrated Energy Storage Systems: Optimizing Renewable Energy Storage and Grid Integration. Processes 2025, 6, 1819. [Google Scholar] [CrossRef]
- Alanazi, M. Optimal Integration of Distributed Generators and Soft Open Points in Radial Distribution Networks: A Hybrid WCA-PSO Approach. Processes 2025, 6, 1775. [Google Scholar] [CrossRef]
- Parsadust, H.; Lotfi, H.; Hajiabadi, M.E. A Dual-Objective Approach to Load Management: Telecommunication Switch Optimization with Distributed Generation Integration. Processes 2025, 3, 716. [Google Scholar] [CrossRef]
- Das, S.S.; Kumar, J.; Dawn, S.; Salata, F. Existing Stature and Possible Outlook of Renewable Power in Comprehensive Electricity Market. Processes 2023, 6, 1849. [Google Scholar] [CrossRef]
- Yang, J.Z.; Fu, B.B.; Peng, J.Q.; Wang, G.B.; Yao, H. Integration of a salt cavern for large-scale hydrogen storage into a solar-wind-storage power system: Technical and economic advantages. Appl. Energy 2025, 9, 126073. [Google Scholar] [CrossRef]
- Ahang, M.; Granado, P.C.; Tomasgard, A. Investments in green hydrogen as a flexibility source for the European power system by 2050: Does it pay off? Appl. Energy 2025, 1, 124656. [Google Scholar] [CrossRef]
- Peng, X.; Jiang, F.; Tu, C.M.; Guo, Q. Optimal Voltage Support Strategy for Photovoltaic Inverters Under Asymmetric Faults. Power Syst. Technol. 2021, 11, 4259–4268. [Google Scholar]
- Pompodakis, E.E.; Katsigiannis, Y.; Karapidakis, E.S. Incorporating Modern Fault Ride-Through Standards into the Short-Circuit Calculation of Distribution Networks. Sensors 2023, 21, 8868. [Google Scholar] [CrossRef] [PubMed]
- Evangelos, E.P.; Strezoski, L.; Simic, N. Short-Circuit Calculation of Droop-Controlled Islanded AC Microgrids With Virtual Impedance Current Limiters. Electr. Power Syst. Res. 2023, 218, 109184. [Google Scholar]
- Ye, R.K.; Wang, H.F.; Zhang, S. Data-Driven Multi-Output Model for Short Circuit Current Calculation in Distribution Network with IIDGs. Electr. Power Autom. Equip. 2022, 9, 119–125+132. [Google Scholar]
- Strezoski, L.V.; Simic, N.G.; Loparo, K.A. A Robust Short-circuit Calculation Method for Islanded, Grid-connected, and Utility Microgrids. J. Mod. Power Syst. Clean Energy 2025, 1, 325–337. [Google Scholar] [CrossRef]
- Kim, I. A Calculation Method for the Short-Circuit Current Contribution of Current-Control Inverter-Based Distributed Generation Sources at Balanced Conditions. Electr. Power Syst. Res. 2021, 190, 106839. [Google Scholar] [CrossRef]
- Liu, M.X.; Shan, R.R.; Feng, S.Y. A Feeder Automation Solution for Petal-Shaped Distribution Networks. Autom. Instrum. 2015, 11, 68–69. [Google Scholar]
- Li, T.C.; Guo, S.F.; Wang, X.Z. Principle of Relay Protection for Petal-shape Distribution Network Based on Voltage Prediction Error. Proc. CSU-EPSA 2022, 6, 79–88. [Google Scholar]
- Gu, D.D.; Xiao, J.; Wei, M.L. Research on Fault Location Strategy for Petal-Shaped Distribution Network with Inverter-Interfaced Distributed Generation. Electr. Meas. Instrum. 2023, 11, 53–57. [Google Scholar]
- Guo, S.F.; Li, T.C.; Duan, J. Backup Protection for Tie Lines in a Petal Distribution Network. Power Syst. Clean Energy. 2022, 4, 10–18. [Google Scholar]
- Chen, X.L.; Yuan, S.; Li, Y.L. Analysis of Single-Phase Grounding Fault Characteristics in Petal-Shaped Distribution Network with Inverter-Interfaced Distributed Generator. Electr. Power Autom. Equip. 2022, 4, 129–137. [Google Scholar]
- Bakkar, M.; Bogarra, S.; Córcoles, F. Three-Level Secure Smart Protection for Ring Grid-Connected Distributed Generation. Energies 2024, 17, 3188. [Google Scholar] [CrossRef]
- Gómez-Luna, E.; De La Cruz, J.; Vasquez, J.C. New Approach for Validation of a Directional Overcurrent Protection Scheme in a Ring Distribution Network with Integration of Distributed Energy Resources Using Digital Twins. Energies 2024, 17, 1677. [Google Scholar] [CrossRef]
- Alamshah, A.; Ramli, S.P.; Mansor, N.N. Recent Developments of Directional Overcurrent Relay Coordination in Ring Distribution Network Based on Hybrid Optimization Techniques. IEEE Access 2025, 13, 14961–14982. [Google Scholar] [CrossRef]
- Cano, A.; Arévalo, P.; Benavides, D. Integrating discrete wavelet transform with neural networks and machine learning for fault detection in microgrids. Int. J. Electr. Power Energy Syst. 2024, 155, 109616. [Google Scholar] [CrossRef]
- Yang, Z.; Yang, F.; Liu, Y. The Intelligent Sizing Method for Renewable Energy Integrated Distribution Networks. Energies 2024, 17, 5763. [Google Scholar] [CrossRef]
- Silveira, R.D.; Silva, S.A.O.; Sampaio, L.P. Full-order models and dynamic assessment of droop-controlled grid-connected and off-grid DC microgrids. Sustain. Energy Technol. Assess. 2024, 64, 103685. [Google Scholar] [CrossRef]
- Tan, Q.; Xu, Y.H.; Huang, H. A Control Strategy for Peak Output Current ff PV Inverter Under Unbalanced Voltage Sags. Power Syst. Technol. 2015, 3, 601–608. [Google Scholar]
- Pawar, V.S.; Gaidhane, P. A resilient approach for optimizing power quality in grid integrated solar photovoltaic with asymmetric 15-level inverter. Comput. Electr. Eng. 2024, 116, 109211. [Google Scholar] [CrossRef]
- Zhou, N.C.; Ye, L.; Wang, Q.G. Asymmetric Short-Circuit Current Calculation for Inverter Interfaced Distributed Generators with Negative Sequence Current Injection Integrated in Power Systems. Proc. CSEE 2013, 36, 41–49. [Google Scholar]
- Tan, H.Z.; Li, Y.L.; Chen, X.L. Influence of Inverter-Interfaced Distributed Generator with Low-Voltage Ride Through Capability on Short Circuit Current of Distribution Network. Electr. Power Autom. Equip. 2015, 8, 31–37. [Google Scholar] [CrossRef]
Disclaimer/Publisher’s Note: The statements, opinions and data contained in all publications are solely those of the individual author(s) and contributor(s) and not of MDPI and/or the editor(s). MDPI and/or the editor(s) disclaim responsibility for any injury to people or property resulting from any ideas, methods, instructions or products referred to in the content. |
© 2025 by the authors. Licensee MDPI, Basel, Switzerland. This article is an open access article distributed under the terms and conditions of the Creative Commons Attribution (CC BY) license (https://creativecommons.org/licenses/by/4.0/).