Article

CFD Analysis of a Falling Film Evaporator Using the Low-GWP Refrigerant R1336mzz(Z) in High-Temperature Heat Pump Applications

1
Institute of Engineering Design & Technology (IEDT), Kyungpook National University, Daegu 41566, Republic of Korea
2
Abu Dhabi Maritime Academy, Abu Dhabi P.O. Box 54477, United Arab Emirates
3
U.S.-Pakistan Center for Advanced Studies in Energy, National University of Sciences and Technology (NUST), H-12 Sector, Islamabad 44000, Pakistan
4
Department of Mechanical Engineering, University of Engineering and Technology, Peshawar 25000, Pakistan
*
Author to whom correspondence should be addressed.
Processes 2025, 13(8), 2398; https://doi.org/10.3390/pr13082398
Submission received: 4 June 2025 / Revised: 18 July 2025 / Accepted: 24 July 2025 / Published: 28 July 2025
(This article belongs to the Special Issue Application of Refrigeration and Heat Pump Technology)

Abstract

High-temperature heat pump systems are essential for industrial processes that usually require high-temperature and high-pressure steam. An efficient design of these systems is critical for minimizing fossil fuel consumption, thereby contributing to a significant reduction in carbon emissions. One of the key components of these systems is the horizontal falling film evaporator, which is commonly employed due to its high thermal efficiency and low refrigerant charge. This study presents a preliminary design of a falling film evaporator to meet the target of the heat duty value of 2.2 MW. The phase-change dynamics inherent to the falling film evaporation process were critically analyzed using ANSYS Fluent (2024 R2). The low-global warming potential refrigerant R1336mzz(Z) was incorporated as a refrigerant on the shell side, while hot water was used in the tubes. The study identified key regions of film flow to maximize vapor production and design optimizations. The discussed performance parameters and operational mechanisms of the evaporator are prevailing features, particularly with the adoption of environmental regulations. Overall, the simulation results offer valuable insights into heat transfer mechanisms and evaporator effectiveness for advancing heat pump technologies in industrial applications.

1. Introduction

High-temperature heat pump (HTHP) systems are used in diverse industrial applications, including pulp, paper, food, and beverage industries. These systems are essential for decarbonization, as they minimize the use of fossil fuels. A key component of these systems is the evaporator; the falling film evaporator is preferred over the flooded evaporator due to its higher efficiency and lower refrigerant charge. Flooded evaporators require a large refrigerant charge, which is challenging to achieve when high-global warming potential (GWP) refrigerants, e.g., R-134a, are used. Moreover, to achieve net-zero emissions by 2050 and mitigate worsening global warming, the industry is shifting toward using low-GWP refrigerants and compact refrigerant systems. Consequently, compared to flooded evaporators, falling film evaporators offer a solution by reducing about 30% refrigerant charge and are being increasingly used in refrigeration [1].
The primary mechanism of heat transfer in falling film evaporators involves both nucleate boiling and convective heat transfer, where nucleate boiling becomes the prevailing mechanism at higher fluxes, while convective heat transfer dominates at lower fluxes, as explored in refrigerants such as R1234ze(E) and R245fa [2]. The ability of these refrigerants to achieve uniform evaporation and handle high heat fluxes makes them valuable in wide-ranging industries, from refrigeration to process engineering [3,4]. The basic working mechanism of a falling film evaporator is its flow due to gravity on the heated tubes, where it absorbs heat from the tube surface and evaporates accordingly [4]. The factors affecting the performance of falling film evaporators include flow regimes, fluid properties, tube design, and the interplay of convective and nucleate boiling heat transfer mechanisms [5].
Various researchers have explored the design and performance optimization of falling film evaporators. The predictive model for the regions of jet impingement and thermal development in heat exchanger efficiency was investigated by Chyu and Bergles (1987) [4], which was further extended by Alhusseini et al. (1998) [6], who examined single-component liquids with high Prandtl numbers. Being a critical area of study, the role of nucleate boiling in enhancing heat transfer in falling film evaporators was studied by Chien and Cheng (2006) [3] by introducing a model incorporating a nucleate boiling correction factor, which was neglected in previous investigations. The improved accuracy of the system design with wide-ranging operating conditions and refrigerants was studied recently with general correlations for heat transfer and predicting dry-out [7,8].
In recent studies, the emphasis has shifted to the optimization of the tube design to enhance the efficiency of falling film evaporators. For instance, upon a comparison of finned, smooth, and boiling-enhanced mesh tubes for their heat transfer performance, the mesh and finned tubes showed significant improvements [9,10]. Liang et al. (2011) worked on R-245fa and observed that the choice of tube surface significantly affects the overall heat transfer coefficient [5]. Similarly, Wieland Gewa-B5 and the Wolverine Turbo-B5 have been investigated for maintaining superior heat transfer performance across various flow conditions, thus ensuring efficient thermal management and minimizing the risk of dry-out [10]. Thermal spray coatings are used in various experiments for surface enhancements with refrigerants such as R1233zd(E) and R134a, resulting in coated tubes achieving a higher heat transfer coefficient compared to smooth tubes. [11].
The behavior of falling film evaporators and their impact on heat transfer have been further explored by computational fluid dynamics (CFD) [12]. The CFD models developed by Onan et al. (2014) [13] and Hassan et al. (2017) [14] offer insights into the effects of flow regimes, tube spacing, and evaporation efficiency, allowing a precise prediction of film behavior and the optimization of evaporator designs for industrial applications. For instance, a closer tube spacing and a higher Reynolds number have been found to result in thinner films, which, in turn, improve heat transfer rates [14,15]. CFD models have shown that increasing the spray density leads to thicker films; however, this may reduce heat transfer efficiency [16]. Moreover, an investigation on the impact of cross-vapor streams on falling film evaporation over tube bundles was carried out. The discovery was that high vapor velocities weaken heat transfer due to increased shear forces between the vapor and liquid film [17]. To enhance the overall heat transfer and prevent dry patches, perforated baffle plates and curly top surfaces were used to ensure a more uniform flow over the evaporator and pave the way for an innovative distributor design [18].
Numerical and experimental studies have identified various flow regimes [19], where the effectiveness of falling film evaporators is significantly influenced by the flow patterns of the liquid film over the tubes. Due to the emerging trend of the adoption of low-GWP refrigerants in HTHP systems, recent technological advancements and environmental regulations, such as the Kigali Amendment, have further spurred interest in optimizing falling film evaporators [20]. Technological advancements and current research, including the use of surface enhancements, CFD simulations, and improved predictive correlations, are crucial for optimizing these systems for industrial applications.
Although falling film evaporators and CFD modeling of phase-change phenomena have been studied previously, investigations involving the low-GWP refrigerant R1336mzz(Z) remain limited, especially under high-temperature and high-pressure conditions relevant to heat pump systems. To the best of the authors’ knowledge, no prior 3D CFD studies have analyzed the falling film evaporation of R1336mzz(Z) under such operating conditions. This study addresses this research gap by integrating MATLAB-based preliminary thermal design with detailed 3D CFD simulations to explore the heat and mass transfer behavior of R1336mzz(Z) in a falling film evaporator. The refrigerant was selected for its favorable combination of low GWP (2), zero ODP, high critical temperature (171.4 °C), and excellent safety classification (A1), making it a strong candidate for next-generation high-temperature heat pump applications.
R1336mzz(Z) exhibits a relatively high boiling point and moderate latent heat, which support stable film formation and efficient phase change at elevated temperatures. Its lower saturated vapor pressure, along with higher liquid viscosity and surface tension compared to many conventional refrigerants, may result in thicker and more stable liquid films, influencing wetting behavior and heat transfer uniformity. Additionally, differences in density ratio and vapor shear effects at high temperatures are expected to affect interfacial dynamics and local evaporation rates. These distinctive thermophysical properties motivate the detailed analysis of R1336mzz(Z) in falling film configurations, as undertaken in this study. Three-dimensional CFD simulations capture the complex flow dynamics and heat and mass transfer mechanisms, aiming to optimize falling film evaporator designs for enhanced environmental sustainability and operational efficiency.

2. MATLAB-Based Design Framework

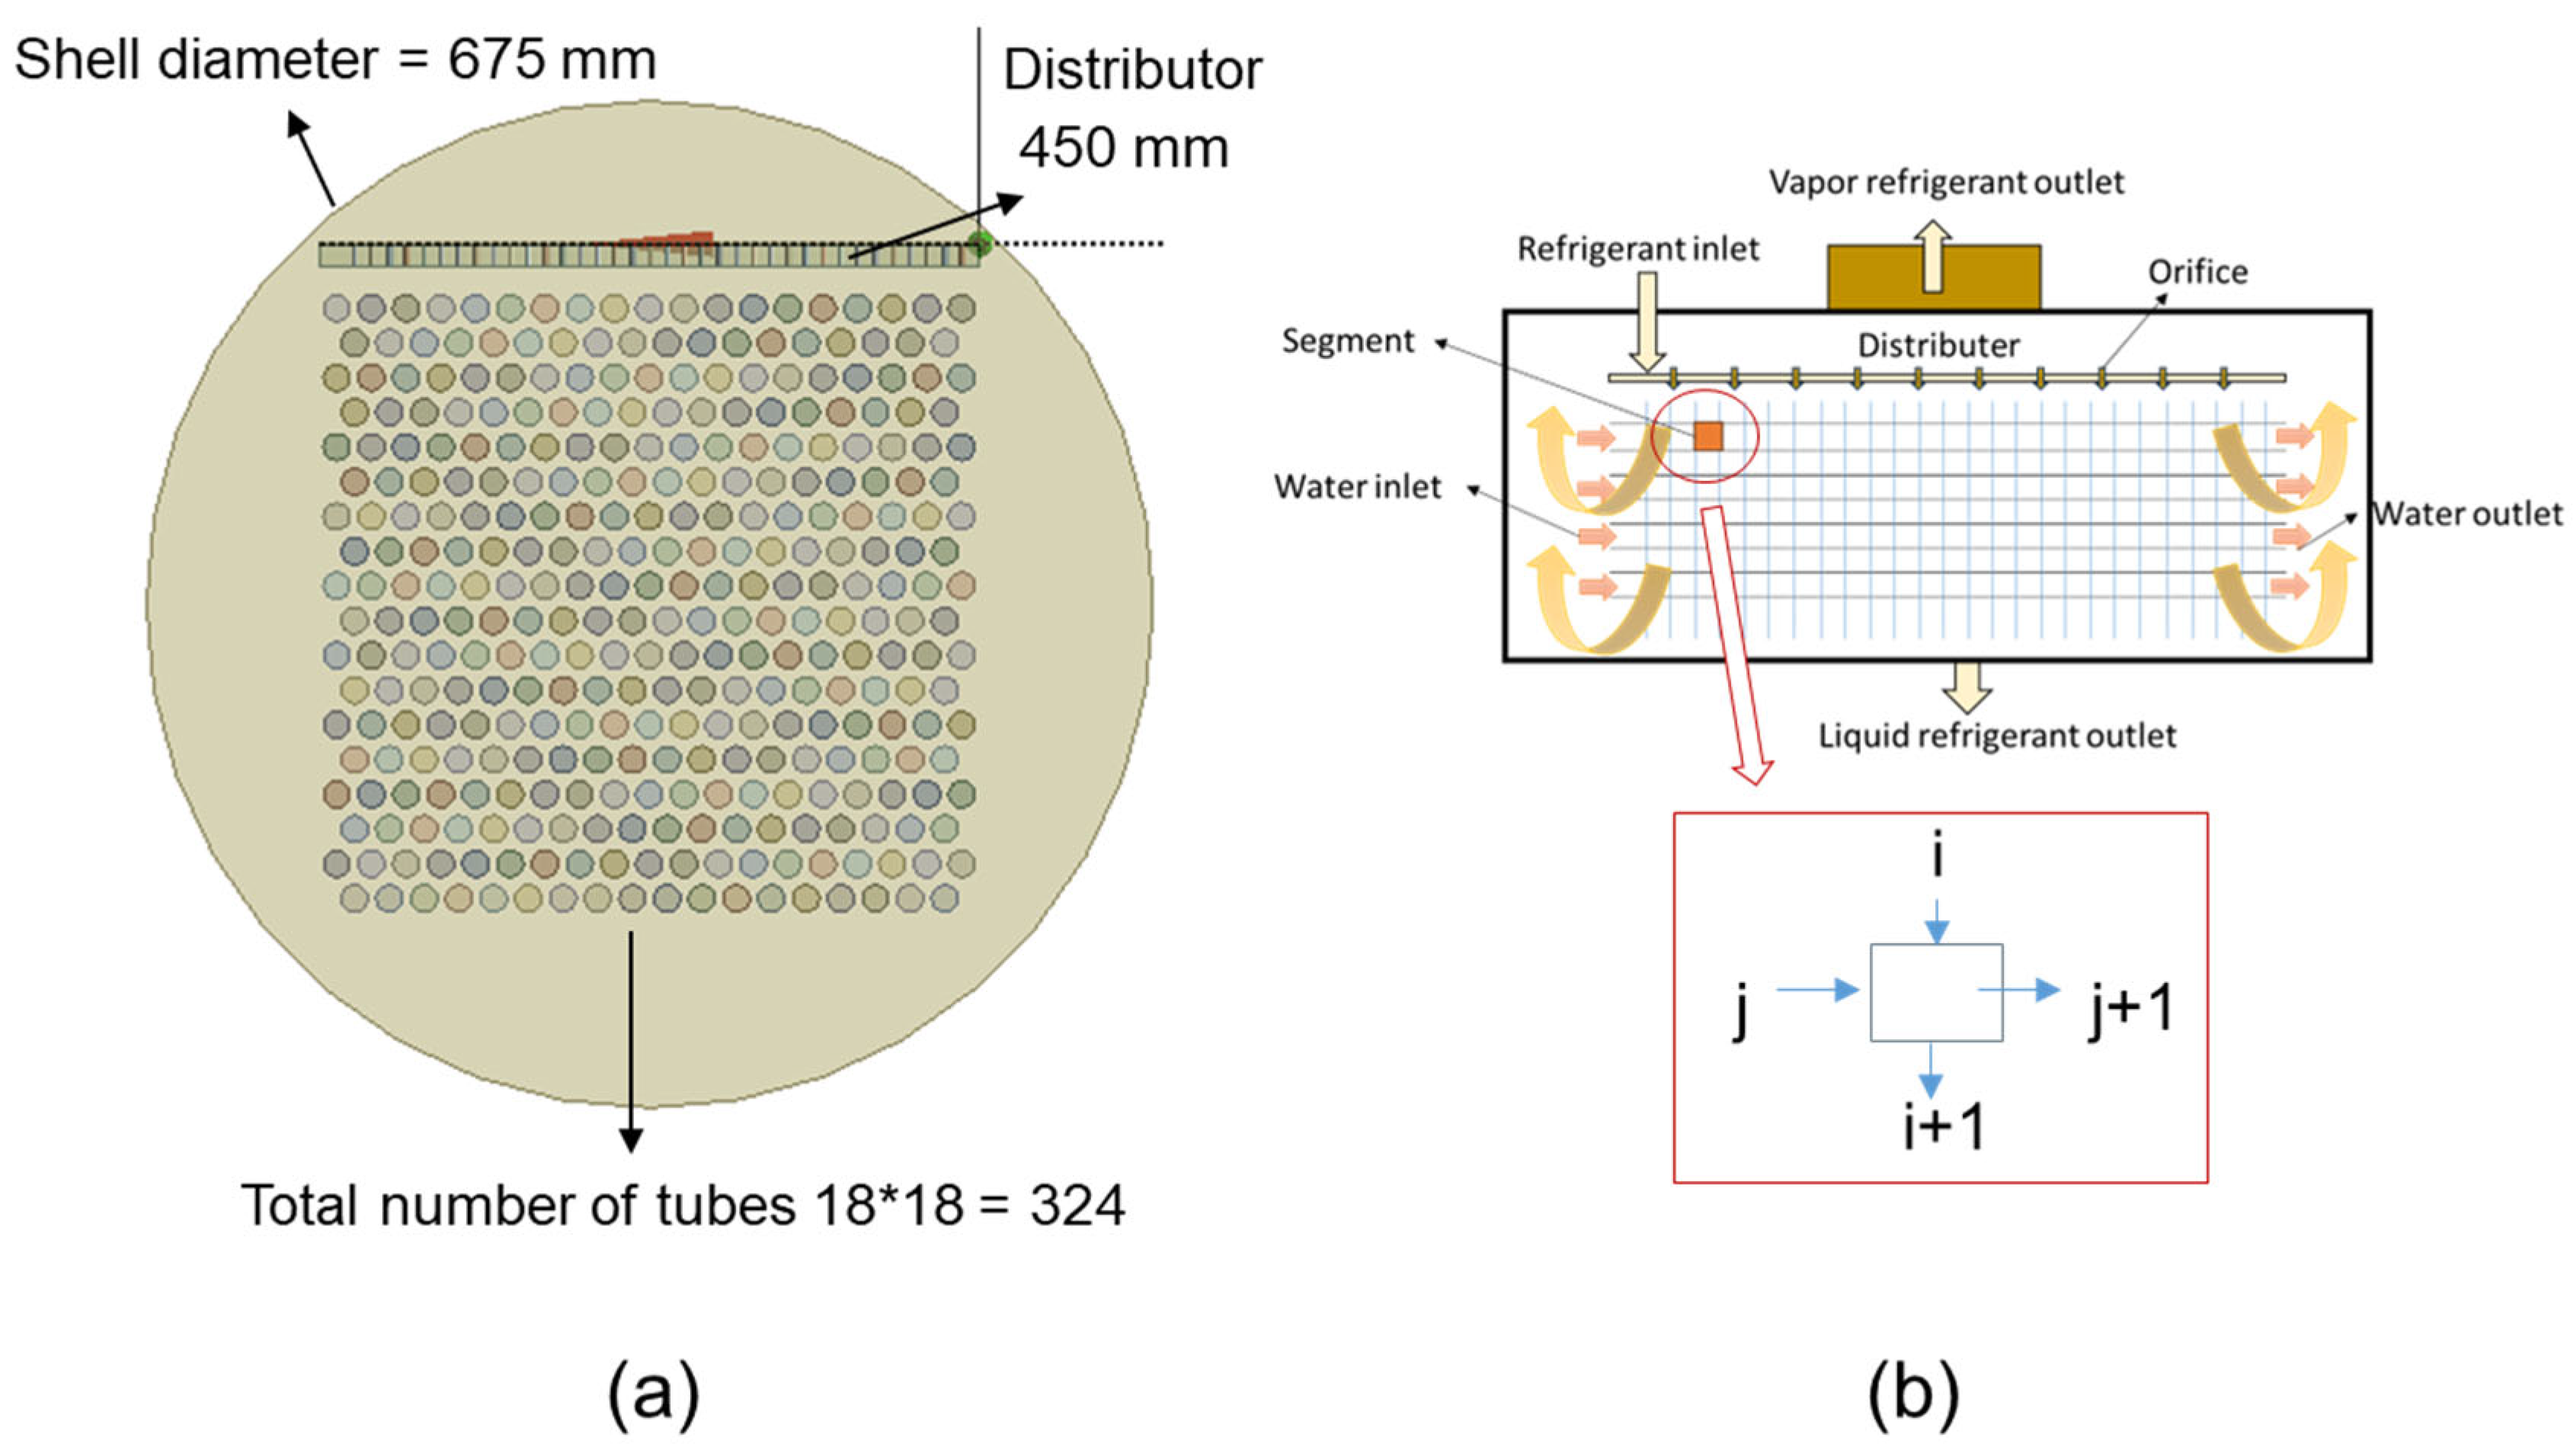
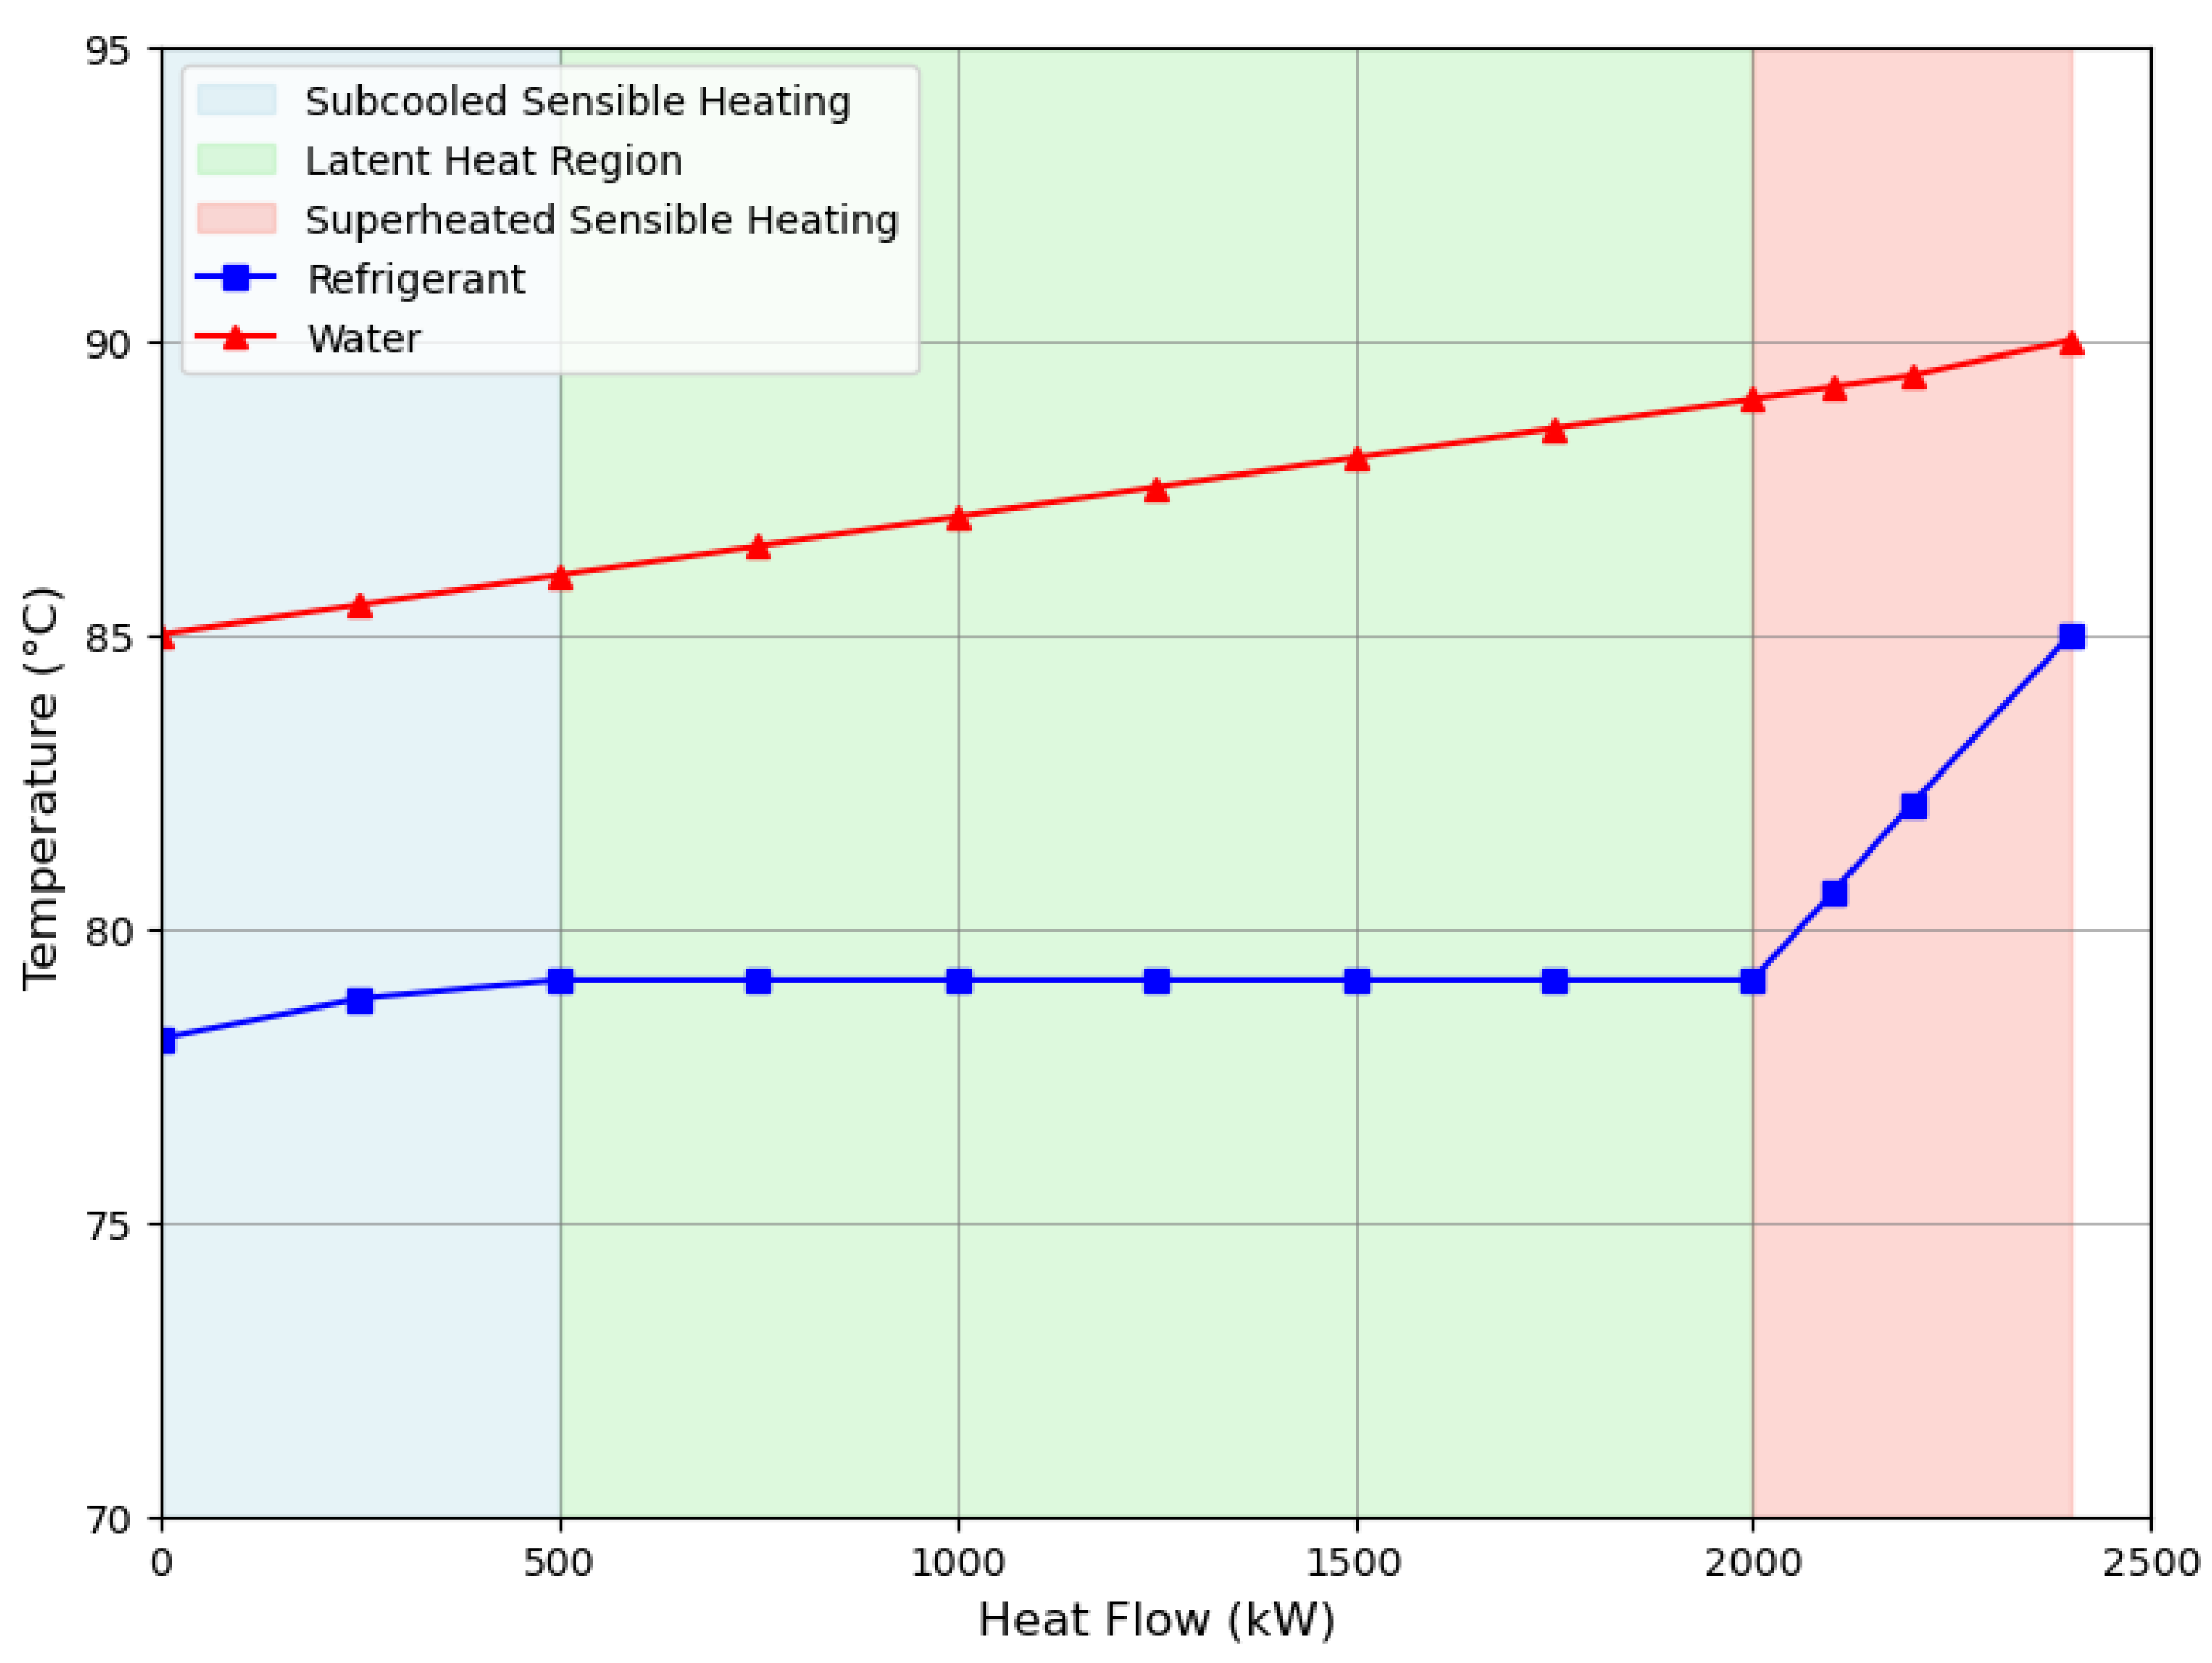
2.1. Design Specifications and Operating Conditions

To establish a reliable foundation for computational fluid dynamics (CFD) modeling and ensure accurate system sizing, a MATLAB-based design framework was developed for the preliminary thermal design of the falling film evaporator using R1336mzz(Z) as the working fluid. This analytical tool integrates fundamental heat transfer principles, thermodynamic property evaluation through REFPROP (v10.0), and empirical heat transfer correlations applicable to falling film evaporation. The primary objective of this framework is to rapidly assess key design parameters such as required heat transfer area, number of tubes, film Reynolds number, and overall heat transfer coefficient (U) based on specified operating conditions. Additionally, the MATLAB R2024b codegenerates boundary conditions that serve as essential inputs for the detailed CFD simulations presented in Section 3.
The operating conditions for the falling film evaporator were defined to meet a target heat duty of 2.2 MW, which aligns with the thermal load requirements for the evaporator stage of a high-temperature heat pump cycle utilizing R1336mzz(Z). These conditions were selected to ensure effective heat transfer while maintaining realistic temperature and pressure levels on both the refrigerant and water sides. The specific inlet and outlet temperatures, pressures, and mass flow rates for both fluids are summarized in Table 1.
To achieve this thermal capacity, several key geometric and design parameters were carefully selected during the preliminary sizing process. These included tube diameter, tube length, number of tubes, tube material, number of tube passes, and the overall tube arrangement within the evaporator shell. The chosen geometric configuration aimed to balance heat transfer area, flow distribution, and manufacturability while providing suitable boundary conditions for the subsequent CFD modeling phase. The full set of geometric specifications is presented in Table 2.
Table 3 summarizes the key thermophysical properties of R1336mzz(Z) at the operating saturation pressure and temperature, as obtained from REFPROP 10 [21]. These properties were used in both the MATLAB-based design tool and CFD simulations for calculating heat transfer coefficients and flow characteristics.

2.2. Numerical Methodology

A segment-by-segment [22] numerical approach was implemented to model the thermal performance of the falling film evaporator. The computational domain was discretized both axially along the tube length and laterally across the tube columns, enabling a detailed two-dimensional analysis of the heat transfer process. In each control volume, the local heat transfer between the water flowing inside the tubes and the refrigerant falling on the shell side was evaluated. REFPROP was used throughout the simulation to obtain accurate thermophysical properties of both fluids at each local temperature and pressure condition. Figure 1a,b shows the preliminary design and modeling approach, respectively.
For the refrigerant side, the local heat transfer coefficient was determined based on the flow regime. The model distinguished between single-phase liquid, two-phase evaporation, and superheated vapor regions by tracking the local vapor quality. Empirical correlations for falling film evaporation were employed [19] to calculate the refrigerant-side heat transfer coefficient (Equations (1)–(3)), with adjustments for dry-out conditions at higher vapor qualities. The water-side heat transfer coefficient was computed using the Dittus–Boelter correlation, appropriate for turbulent flow inside smooth circular tubes.
N u r = 23.3 × R e eff 0.8174 × B o r 0.6331 × P r r 0.0864
N u r = 11.7 × R e eff 0.8931 × B o r 0.5278 × P r r 0.0287
h r = N u r × k r d outer
U = 1 1 h w + 1 h r + R f
In Equation (4) U represents the overall heat transfer coefficient; h r is the refrigerant side heat transfer coefficient, h w is the water-side heat transfer coefficient, and Rf is the fouling resistance.
Energy balance calculations were performed segment-by-segment, updating the local temperatures, enthalpies, pressures, and vapor qualities of the refrigerant, as well as the water outlet temperatures and pressures along the flow direction. The overall heat transfer coefficient, local heat transfer rate, and thermal effectiveness were evaluated at each segment. Finally, cumulative results, such as total heat transfer rate and average overall heat transfer coefficient, were obtained by integrating the segmental outputs across the entire heat exchanger.

2.3. Preliminary Design Results

The MATLAB-based preliminary design of the falling film evaporator provided valuable insights into key parameters and assisted in selecting appropriate boundary conditions for the detailed CFD modeling, which is presented in the subsequent section. The preliminary design results are discussed in this section.
Figure 2 shows the temperature profiles of refrigerant R1336mzz(Z) and water as a function of heat flow (kW) during the heating process. The refrigerant undergoes three distinct regions: subcooled sensible heating (light blue), two-phase latent heat region (light green), and superheated sensible heating (light red). During the latent heat region, the refrigerant temperature remains nearly constant around 79 °C while absorbing a large amount of heat, while the water temperature increases steadily from 85 °C to 90 °C across all regions. Figure 3 presents a 2D contour plot showing how the refrigerant vapor quality changes across both the axial segments and tube columns in the evaporator. The x-axis represents the number of axial segments along the tube length, while the y-axis represents the tube columns in the crossflow direction. The color scale indicates the vapor quality, ranging from 0 (saturated liquid) to 1 (saturated vapor). The plot shows that the refrigerant progressively evaporates as it moves down the columns and along the segments, with vapor quality increasing from blue (liquid) to yellow (vapor) regions.
Figure 4 illustrates the distribution of the overall heat transfer coefficient (U) across the evaporator’s tube columns and axial segments. The x-axis represents the axial segments along the tube length, while the y-axis shows the tube columns in the crossflow direction. The color scale ranges from 3000 to 8000 W/m2·K. Higher U-values are observed in the upper columns (red zones), where the refrigerant is predominantly in the two-phase region, while lower U-values appear near the bottom (blue-green zones), corresponding to superheated regions. The average U across the entire domain is approximately 7107.5 W/m2·K, as displayed at the center. Figure 5 shows the segmental distribution of heat duty (Q) across the tube columns and axial segments in the evaporator. The x-axis represents the number of axial segments along the tube length, while the y-axis corresponds to the tube columns. The color scale indicates local heat duty, with higher heat transfer rates shown in yellow and lower values in dark red to black. The upper columns and early segments show higher heat duties, mainly due to greater temperature differences and dominant phase change. The total heat duty for the entire evaporator is approximately 2235.35 kW, as displayed in the center of the plot.

3. CFD Modeling

3.1. Computational Domain

A 20 mm segment of the falling film evaporator was created in ANSYS (2024) Design Modeler as illustrated in Figure 6a to simulate fluid dynamics and heat transfer around the two copper tubes, each with an outer diameter of 19.05 mm. The computational domain, representing the evaporator’s shell, measures 48 mm in width and 84 mm in height; it is designed to capture a precise section of the shell flow. For effective refrigerant flow, the geometry includes an inlet with a diameter of 2 mm to allow the entry of R1336mzz(Z) refrigerant and an outlet with a diameter of 8 mm to maintain the desired flow rate and pressure drop. This configuration offered an accurate basis for CFD analysis by replicating the critical flow and heat transfer conditions within a falling film evaporator section.

3.2. Mesh Generation

The mesh generation process plays a crucial role in ensuring the accuracy, convergence rate, and computational efficiency of CFD simulations. To accurately simulate the complex 3D flow in the falling film evaporator, ANSYS ICEM CFD meshing was employed for mesh generation, as shown in Figure 6b. ICEM CFD is particularly advantageous for creating high-quality structured meshes, which are essential for capturing the fine details of intricate flow patterns. In ICEM CFD, the following key steps were followed to generate a mesh for a cylindrical geometry. First, an initial block was created around the cylindrical domain using a multiblock structured grid, which is beneficial for capturing the cylinder’s geometric features. Adjustments were then made to these blocks to match the curved surfaces of the cylinders, ensuring smooth transitions across the mesh. Next, node distribution and edge sizing were refined, with a focus on increasing mesh density near the cylinder surfaces to capture boundary layer effects accurately, while coarser mesh regions were applied farther from the surface for computational efficiency. The final structured hexahedral mesh was verified for quality, ensuring smooth transitions, minimal skewness, and orthogonality, especially near the cylinder walls.

3.3. Grid Independence Study

Mesh sensitivity analysis was carried out using four mesh densities, i.e., coarse, medium, fine, and very fine mesh sizes. Figure 7 illustrates the grid convergence trend for the simulated temperature as a function of mesh density. As the number of nodes increases, the predicted temperature approaches a stable value, indicating mesh independence. The fine mesh case (1.0 million nodes and 364.2 K) is highlighted, showing minimal change compared to the very fine mesh, with a difference of less than 0.4%. This demonstrates that the fine mesh provides an adequate balance between accuracy and computational cost. The scatter points and trend line clearly show the diminishing returns in accuracy with further mesh refinement.

3.4. Governing Equations

The flow dynamics and heat transfer in a falling film are governed by three fundamental equations: the conservation of mass (Equation (5)), the conservation of momentum (Equation (6)), and the conservation of energy (Equation (7)). These equations collectively describe how mass, motion, and heat are distributed and conserved within the film flow, providing a complete framework for analyzing the behavior of falling films in fluid systems.

3.4.1. VOF Model

The VOF method is employed to simulate evaporation; the volume fraction α is used to track the interface within fixed Eulerian grids. The tracking of the interface can be achieved by solving the continuity equation for the volume fraction of the i t h phase.
α i t + . u α i = S m , i ρ i
where S m , i is the volumetric mass source term, and ρ i is the density of the i th phase.
The momentum and energy equations are essential to describing the forces and heat transfer occurring within the falling film. The momentum (Equation (17)) explains how momentum changes over time within the film, factoring in pressure gradients, viscous stresses, gravitational forces, and the surface tension force F c s f .
The momentum and energy equations are as follows:
( ρ u ) t + . ρ u u = P + . μ u + u T + ρ g + F c s f
( ρ E ) t + . u ρ E = . k T + S e
ρ = ρ v α v + ρ l ( 1 α v )
The density in each cell at the interface is the volume-average density (Equation (8)):

3.4.2. Continuum Surface Model (CSF)

The continuum surface force (CSF) model is used in a falling film in conjunction with the VOF model to incorporate surface tension force and better characterize the liquid/gas phase interface. F c s f (surface tension force) can be obtained using the continuum surface force model (Equation (9)):
F c s f = σ α l ρ l K l α v + α v ρ v K v α l 0.5 ( ρ l + ρ v )
where σ is the surface tension coefficient, and K is the interface curvature defined as follows (Equation (10)):
K = . α α
The energy Equation (11) describes how energy is transported through the film. It accounts for heat conduction, the temperature gradient, and source terms representing latent heat from phase change. The total energy is calculated as a weighted average of the liquid and vapor phase energies using the following equation:
E = α l ρ l E l + α v ρ v E v α l ρ l + α v ρ v
The energy for each phase is given by (Equation (12)):
E l = C p l ( T T r e f ) ,

3.4.3. Evaporation and Condensation Model

The mechanistic model for evaporation and condensation can be coupled with the VOF model by a source term. Based on this model, the mass source term can be defined as follows (Equation (13)):
S m , v = S m , l = L α v ρ v T T s a t T s a t
where Tsat is the saturation temperature, i = l for evaporation, i = g for condensation, and L is the mass transfer time relaxation factor. The required heat transfer for phase change can be evaluated by the energy source term. The volumetric energy source term S e can be obtained by multiplying the mass source term S m by the latent heat h f g (Equation (14)):
S e = S m . h f g
where h f g represents the latent heat of vaporization or energy released/absorbed due to phase-change phenomena.
To generalize the experimental data, several correlations have been developed in the literature. These correlations can be used in conjunction with CFD modeling for comparison, developing boundary conditions, and saving computational effort. As film thickness around the tube is usually less than 1 mm, a fine grid is required to capture the hydrodynamics of a falling film with accuracy; this makes the VOF model quite computationally expensive. This is why a section of the tube(s) is considered for the numerical domain. A section of the tube can be computed for different conditions, and only the section equivalent to this length will suffice to generalize the flow around the tube using symmetric boundary conditions. Liquid flow and heat flux may be computed and used to investigate other parameters using empirical relations.

3.5. Solver Setting

The solver settings used for the VOF model during the CFD analysis are summarized in Table 4. A turbulent flow regime was employed based on calculated Reynolds numbers for both sides of the evaporator. The tube-side (water) Reynolds number is approximately 72,800, confirming fully turbulent internal flow. On the shell side, the refrigerant falling film has an estimated Reynolds number of about 3680, which, although below the conventional pipe-flow turbulence threshold, falls within the regime where interfacial waves and shear instabilities dominate in falling film flows [23]. Hence, turbulence modeling was justified for both phases. The k-ω SST (Shear Stress Transport) turbulence model was selected for this study due to its superior capability in capturing near-wall flow behavior, thin liquid film characteristics, and interfacial shear effects, all of which are critical in falling film evaporator simulations. This model offers a good balance between accuracy in the boundary layer region and stability in the free stream, making it well-suited for multiphase flows with surface tension effects. Surface tension was treated using the CSF model (volume fraction cut-off = 10−6), and a Courant number limit of ≤ 0.25 was used to ensure numerical stability. To assess the mesh resolution quality near the wall, the non-dimensional wall distance (y+) across the tube surface was monitored. The average y+ values in the liquid film region were below 1, ensuring that the near-wall flow physics were fully resolved within the viscous sublayer. This setup is essential for accurately capturing interfacial heat transfer and shear-driven film behavior.
The transient formulation uses a first-order implicit scheme, while pressure-velocity coupling was achieved through the coupled algorithm. Pressure interpolation was handled using the PRESTO scheme, and momentum and energy discretization were achieved using a second-order upwind method. The Geo-Reconstruct method was used for surface tracking and volume fraction calculations, and the Lee model was used to simulate phase change due to evaporation.
The simulation was carried out for a total physical time of 100 s, using a time-step size of 0.1 s, resulting in 1000 time steps. At each time step, a maximum of 20 iterations was performed to ensure convergence. To maintain numerical stability and improve the accuracy of interface tracking with the VOF model, the Courant number was limited to 0.25 throughout the simulation.

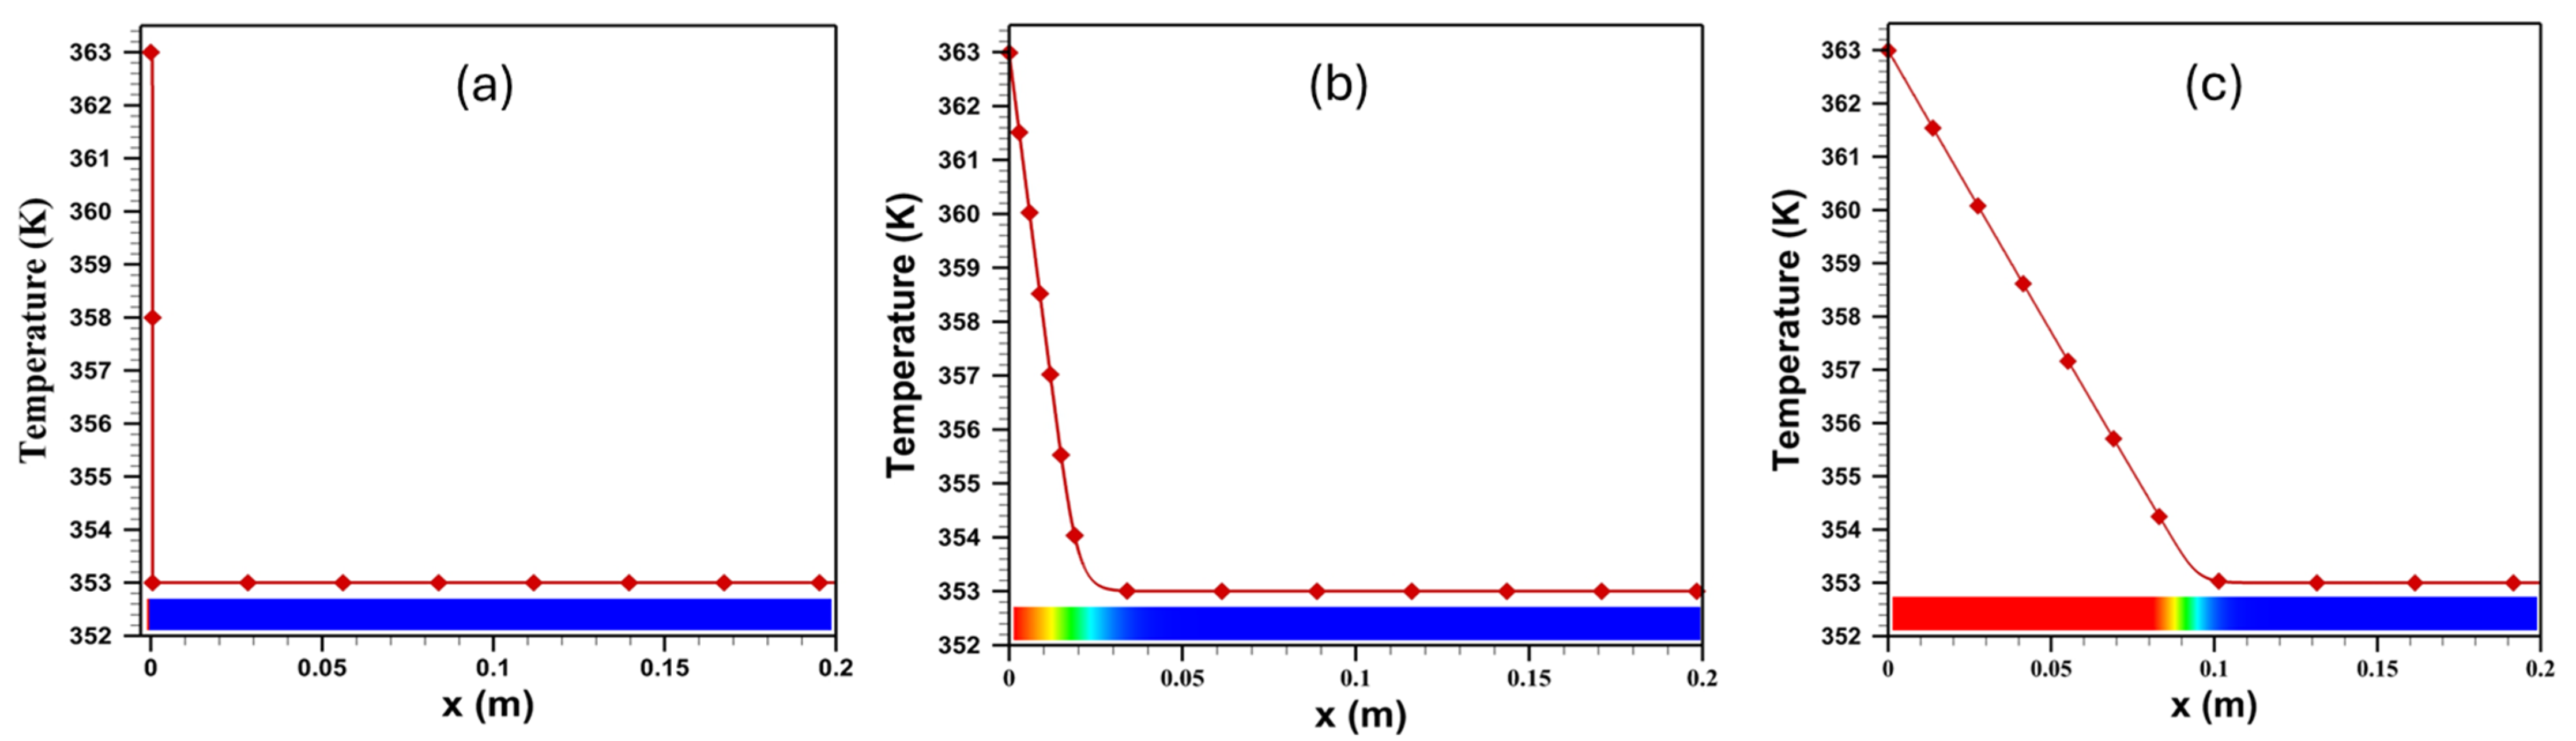
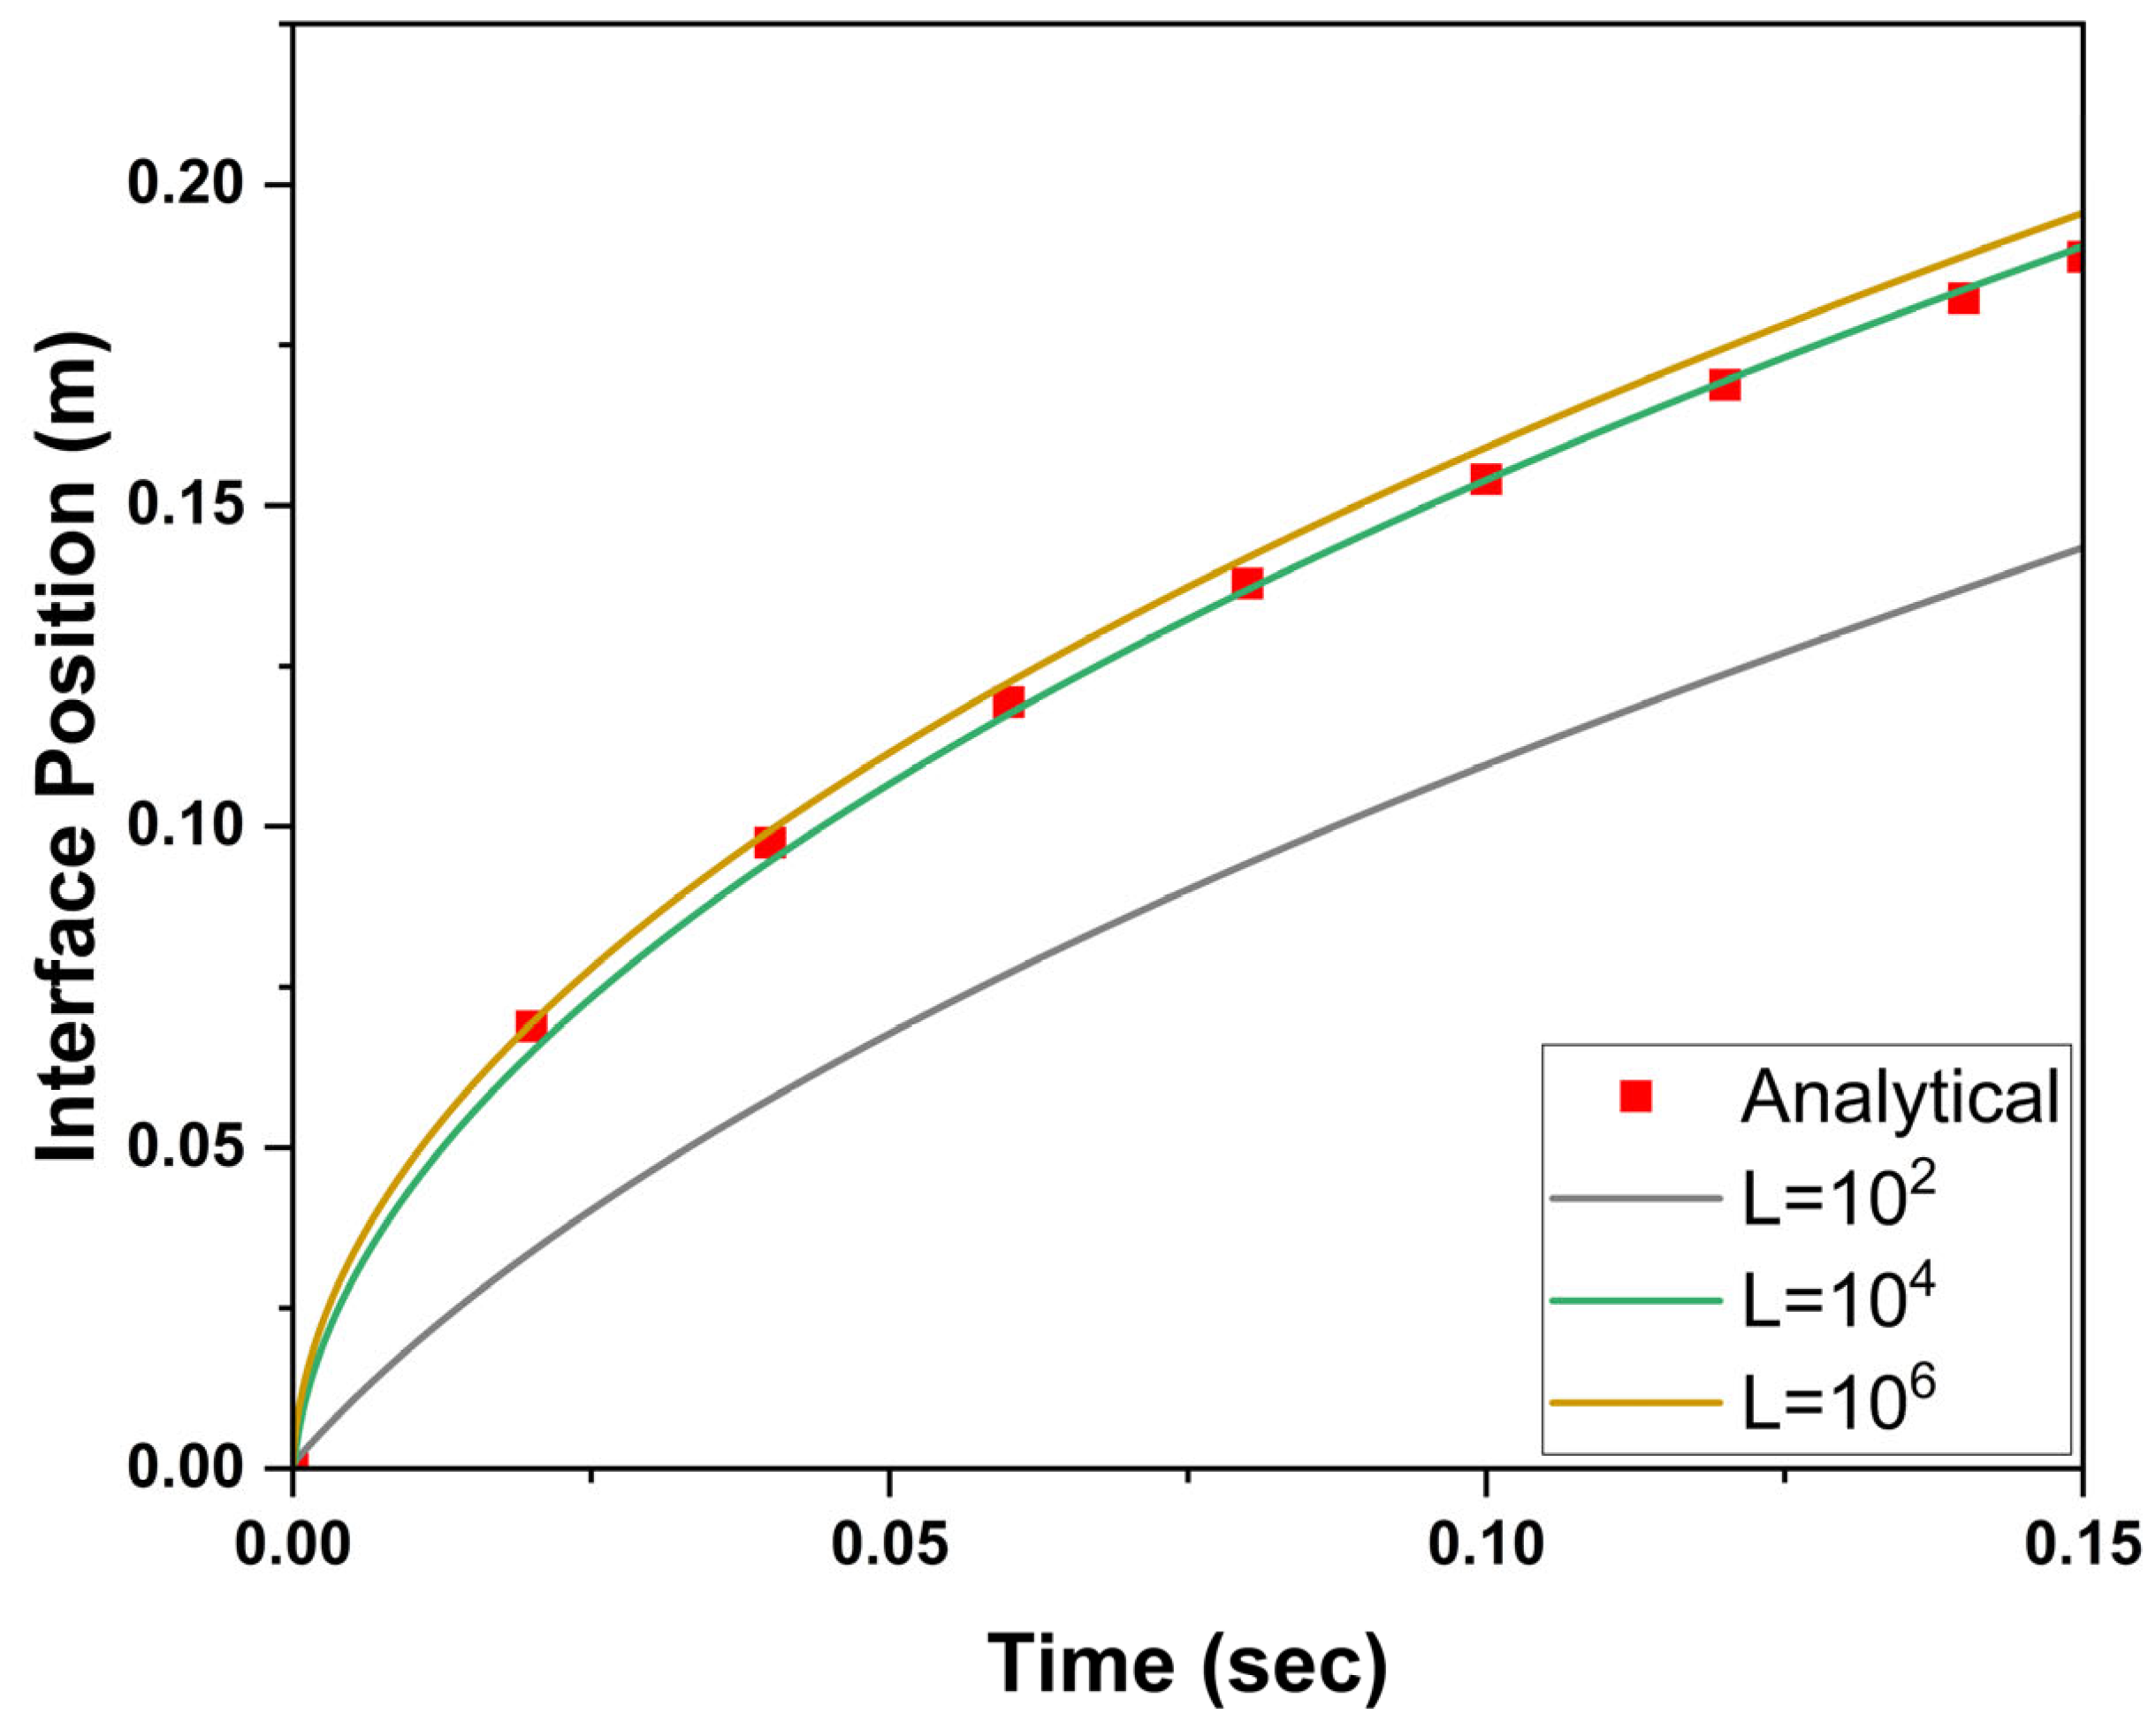
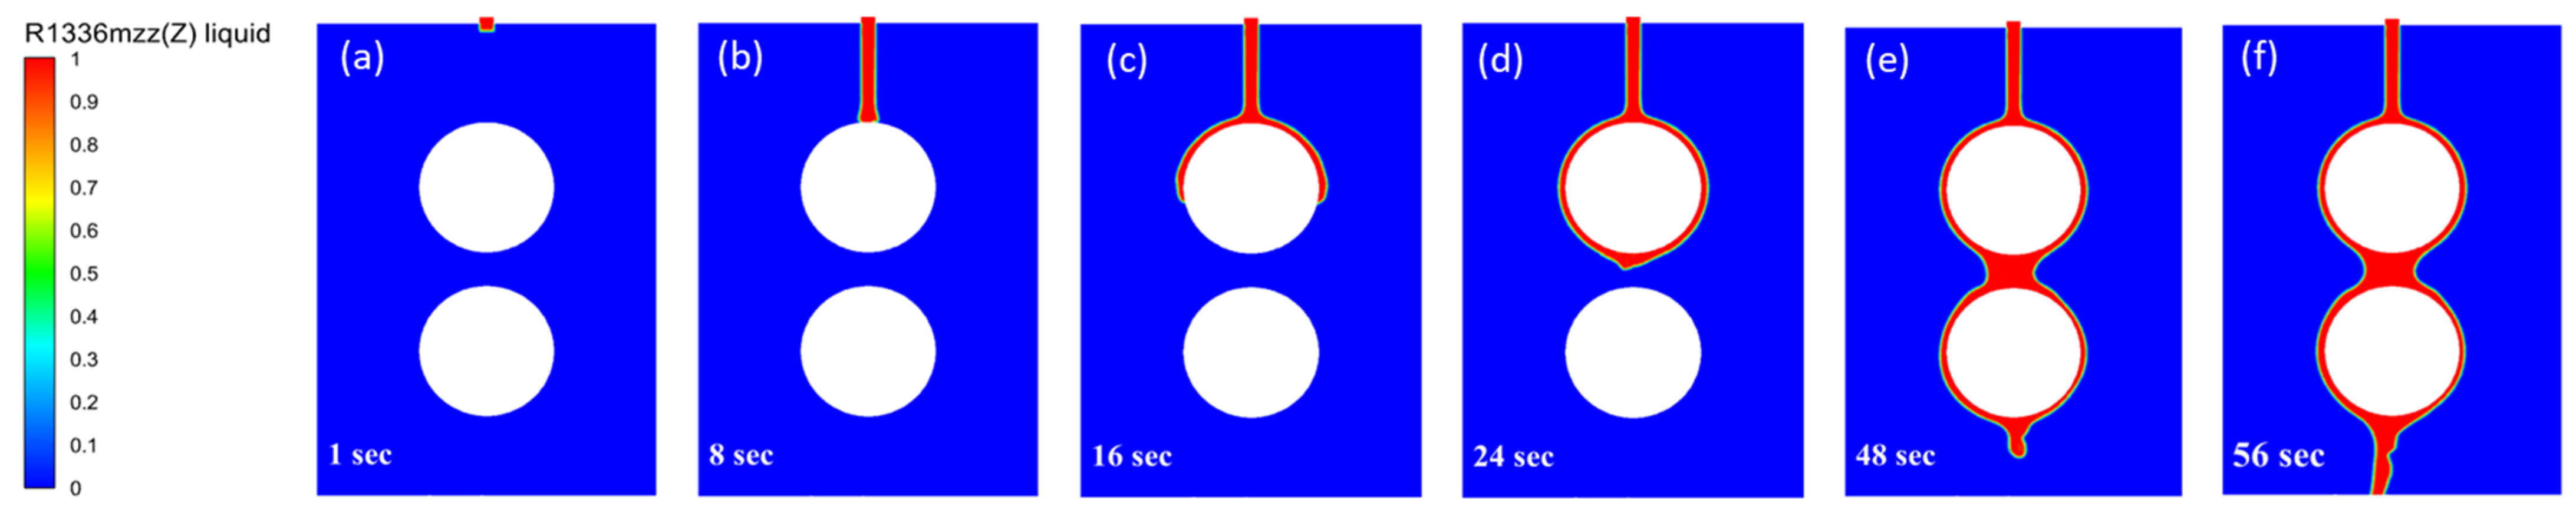
3.6. CFD Model Validation

To validate the implemented VOF-based evaporation model with the Lee mass transfer source term, the classical 1D Stefan problem was used as a benchmark [24]. The Stefan problem describes the transient motion of a phase-change interface in a semi-infinite domain due to conduction-dominated heat transfer.
In this validation case, a saturated liquid layer of refrigerant R1336mzz(Z) at T s a t = 352.27   K is exposed to a hotter wall at T w = 363   K , leading to unidirectional evaporation into a vapor domain. The interface recedes as the latent heat of vaporization is supplied by conduction from the wall. The analytical solution for the interface position as a function of time is given by (Equation (15)):
δ t = 2 ε λ v t h f g c p , v
ε e x p ε 2 e r f ε = c p , v T w T s a t h f g π
where ε is determined by solving the transcendental equation and e r f is an error function (Equation (16)). Using the refrigerant properties described in Table 3, the analytical interface position was computed over a simulation time of 0.16 s. The time step was set to 1 × 10 5   s , consistent with the transient settings used in Fluent.
The numerical model in ANSYS Fluent was configured using a two-phase volume of fluid (VOF) model with the Lee model for phase change. A user-defined function (UDF) was implemented to account for evaporation and condensation source terms based on local phase temperatures and volume fractions. In the present case, the liquid is initially at the saturation temperature T s a t = 352.27   K , while the wall is maintained at T w = 363   K .
The simulation domain in Fluent was defined as a 2D rectangle with a height of 1 mm and a length of 0.2 m. A structured grid of 4000 cells was used along the horizontal (x) direction to ensure grid independence. No-slip adiabatic wall conditions were applied, and the left wall was treated as a constant temperature wall ( T w ).
Figure 8 presents the numerical solution of the Stefan problem [25], demonstrating the movement of the phase-change interface while maintaining the interface temperature close to the saturation temperature. The results highlight the proper capture of latent heat effects and energy balance at the moving front, with a sharp temperature gradient forming ahead of the interface due to conductive heat transfer. As time progresses, the interface advances into the domain as expected, validating the accuracy of the phase-change modeling approach in representing transient evaporation phenomena.
Figure 9 presents a comparison between the analytical solution and the Fluent-predicted interface positions over time for the evaporation–condensation model using the VOF framework. The Fluent results closely follow the analytical solution throughout the simulation period, capturing the characteristic t growth trend of the interface position. To ensure that the selected Lee model constant (L) does not introduce artificial resistance to phase change, a sensitivity analysis was performed by varying L from 102 to 106. The results showed that lower L values, such as 102, significantly underpredicted interface movement due to limited mass transfer rates. In contrast, higher values of L, particularly 106 and above, resulted in interface positions that slightly overestimate the analytical solution. At L = 104, further increases had a negligible impact, indicating that the solution became independent of L and was more influenced by grid and time-step limitations. Based on this analysis, L = 104 was selected for all subsequent simulations to ensure both numerical stability and physical accuracy. This validation confirms the robustness and reliability of the evaporation–condensation model implemented in Fluent, providing confidence in its application to more complex geometries and operating conditions in the following sections.

4. Results and Discussion

The CFD simulations of the falling film evaporator revealed detailed insights into the various contours of refrigerant R1336mzz(Z), volume fraction, mass transfer, and temperature. This study extensively used CFD contours to visually represent the key flow parameters. These graphical outputs helped identify critical regions of heat transfer that are difficult to capture experimentally.
The falling film evaporation process over the horizontal tubes can be divided into several distinct flow regions based on the balance of gravitational, surface tension, and viscous forces. Initially, as the refrigerant exited the orifice or tube inlet, it moved downward under the influence of gravity and surface tension (Figure 10a). At low liquid loads, surface tension dominated, resulting in the formation of discrete droplets and a droplet flow regime. Conversely, at higher liquid loads, gravity became the dominant force, significantly increasing the downward velocity and leading to a continuous jet mode.
Upon striking the uppermost point of the tube surface (θ = 0°), the free-falling film experienced stagnation, with a sudden loss in vertical velocity and an increase in turbulence (Figure 10b). This impact created a highly turbulent zone, promoting enhanced heat transfer. As the film spread axially and downward, it entered the developing region (Figure 10c), where tangential gravitational forces drove the flow while viscous drag opposed it. Here, the velocity profile evolved, and the laminar sublayer thinned with increasing angular position, thereby reducing thermal resistance and enhancing heat transfer, particularly for small-diameter tubes and higher liquid loads.
Further along the tube surface, the flow reached a developed state (Figure 10d), characterized by a stable film thickness and higher conduction resistance. Asymmetry in film distribution stemmed from the differing roles of surface tension and gravitational forces on the upper and lower tube surfaces. Finally, in the detachment region (Figure 10e), the accumulated liquid film converged at the bottom (θ = 180°) and detached under the influence of gravity and surface tension. At lower liquid loads, surface tension gathered the liquid into near-spherical droplets, whereas higher loads produced a more continuous film. After detachment, the necking phenomenon (Figure 10f) was observed, where surface tension temporarily lifted the remaining film before it reformed or transitioned into steady jet or sheet modes, depending on the liquid load.
Figure 11 presents the 3D volume fraction of the liquid refrigerant R1336mzz(Z) as it fell from a small orifice and interacted with horizontal tubes. In the initial stage (a), the liquid underwent free fall before forming a stationary film at the stagnation point (b) on the tube surface. As gravity accelerated the film downward, it spread in both the axial and circumferential directions, with the contour colors shifting from red to light green, indicating the thinning of the film. At point (c), dry-out occurred due to low fluid flow, and as the droplets impacted the tube, the fluid dispersed in waves, as shown by point (d). Point (e) represents a region with no heat transfer, which is linked to dry-out regions caused by high heat flux, as seen in point (f).
Dry-out, where sections of the heated surface are no longer covered by liquid, occurs due to two primary mechanisms. First, when the critical heat flux is exceeded, the liquid film detaches from the heated surface, leading to dry-out, which is largely unaffected by the liquid flow rate. Second, when the film’s Reynolds number falls below a critical threshold, the uniform film breaks into rivulets, leaving areas uncovered and resulting in dry-out patches. Strong vapor flows or bursting nucleation bubbles further destabilize the film, causing it to rupture into suspension droplets that form a mist flow pattern. These effects illustrate the film’s vulnerability to dry-out under varying heat and fluid flow conditions.
Figure 12 depicts the vapor volume fraction of the refrigerant R1336mzz(Z) as it evolved over time in a 3D domain, with two horizontal tubes heated by hot water. As the refrigerant fell onto the upper tube, it formed a thin liquid film that spread across the surface of the tube. Initially, the heat transfer to the refrigerant was limited; while some evaporation began, much of the refrigerant remained in liquid form due to insufficient heat absorption from the upper tube. This is because the liquid film was relatively thick, offering higher thermal resistance and limiting the amount of heat that could be transferred.
When the refrigerant film reached the second, lower tube, it had already absorbed some heat, bringing it closer to its boiling point. Consequently, it became more susceptible to phase change, and as it interacted with the second tube, more heat was transferred, resulting in visible vapor formation. The vapor formation was notably more pronounced near the bottom of the lower tube for several physical reasons. First, the liquid film became thinner as it spread across the second tube, reducing its thermal resistance and allowing more efficient heat transfer. Secondly, gravity accelerated the downward flow of the refrigerant, which further thinned the film and increased the surface area available for evaporation. Finally, localized vortices near the bottom of the lower tube enhanced mixing and further promoted heat transfer by increasing the interaction between the liquid film and the tube surface. Vapor formation was more pronounced near the bottom of the second (lower) tube. This can also be observed in Figure 13, which shows the mass transfer rate. These factors—the thinner liquid film, gravity-induced acceleration, and enhanced mixing—worked together to facilitate more vigorous vapor formation near the bottom of the second tube, indicating that the lower region of the evaporator played a crucial role in the overall evaporation process, with more efficient heat transfer and vapor production occurring in this part of the system.
Figure 14 illustrates the temperature contours of the refrigerant R1336mzz(Z) as it formed a falling film over two horizontal tubes in a 3D domain, with the temperature evolution shown over time. The red-colored contours around the tubes represent the high temperature of the hot water flowing inside them. Before the refrigerant began flowing, the shell was filled with air at atmospheric temperature, which was lower than the temperature of the tubes. As a result, heat transfer occurred from the tubes to the air in the early stages, as seen in the first four frames.
Once the refrigerant, shown in blue contours, started flowing onto the upper tube, it absorbed heat from the tube since its temperature was lower than that of the hot water inside the tube. This heat transfer caused the upper tube to cool down, as indicated by the changing contour color from red to orange. As time progressed, more heat was absorbed by the refrigerant, which further cooled the upper tube, with its temperature dropping to yellow contours, signifying a continued reduction in temperature. When the refrigerant reached the lower tube, the temperature drop was less pronounced compared to the upper tube. This is because the refrigerant had already absorbed heat from the upper tube, raising its temperature. Consequently, the temperature difference between the refrigerant and the lower tube was smaller, leading to less heat transfer and a more gradual cooling effect on the lower tube. This behavior was reflected in the relatively stable temperature contours of the lower tube, which remained close to red or orange, indicating that the temperature of the lower tube was still high but decreasing at a slower rate compared to the upper tube.
Figure 15 illustrates the comparison between MATLAB-based design heat transfer coefficients (HTCs) and detailed CFD-based HTC distributions along the upper and lower tube surfaces of a falling film evaporator. The constant lines represent HTCs estimated from preliminary MATLAB calculations: approximately 5433 W/m2·K for the upper tube and 2735 W/m2·K for the lower tube. These values assume uniform film distribution and neglect local flow variations.
In contrast, the CFD results (scatter plots) capture significant spatial variations, particularly along the lower tube. The upper tube shows consistently higher HTCs due to thicker and more stable liquid film coverage near the inlet, where refrigerant is first introduced. Meanwhile, the lower tube exhibits reduced and fluctuating HTCs, reflecting film thinning, uneven distribution, and localized dry-out effects as the refrigerant flows downward and evaporates.
This comparison highlights the limitations of simplified design approaches and emphasizes the importance of CFD analysis in revealing local heat transfer behavior, especially in systems where gravity-driven film dynamics and surface wetting strongly affect performance. Incorporating such detailed insights is essential for improving the reliability and thermal efficiency of falling film evaporators.
Figure 16 illustrates the time-dependent evolution of the evaporated vapor mass for the full evaporator over an 80-s period. This estimation was derived by scaling up the CFD results obtained from a small modeled segment of the evaporator. The x-axis shows time in seconds, while the y-axis represents the cumulative vapor mass generated in kilograms. Initially, the vapor mass remains close to zero, reflecting the start of the evaporation process. As time progresses, the vapor mass increases steadily, reaching approximately 3.3 kg by the end of the simulation. The continuous and smooth rise in the curve indicates stable heat transfer and consistent operating conditions within the evaporator. This result provides a useful estimation of the total vapor generation over time, offering insight into the evaporator’s transient performance under the given thermal and flow conditions.

5. Conclusions

This study presents the preliminary design and analysis of a falling film evaporator intended to deliver a target heat duty of 2.2 MW. A numerical model was first developed in MATLAB using a segment-by-segment approach. Subsequently, a detailed CFD analysis was carried out on a falling film evaporator for high-temperature heat pump applications. The main conclusions drawn from this work are as follows:
  • A MATLAB-based preliminary design estimated that 324 tubes, each 2 m long, are needed to achieve a total heat duty of 2.2 MW with an overall heat transfer coefficient of 7000 W/m2 K.
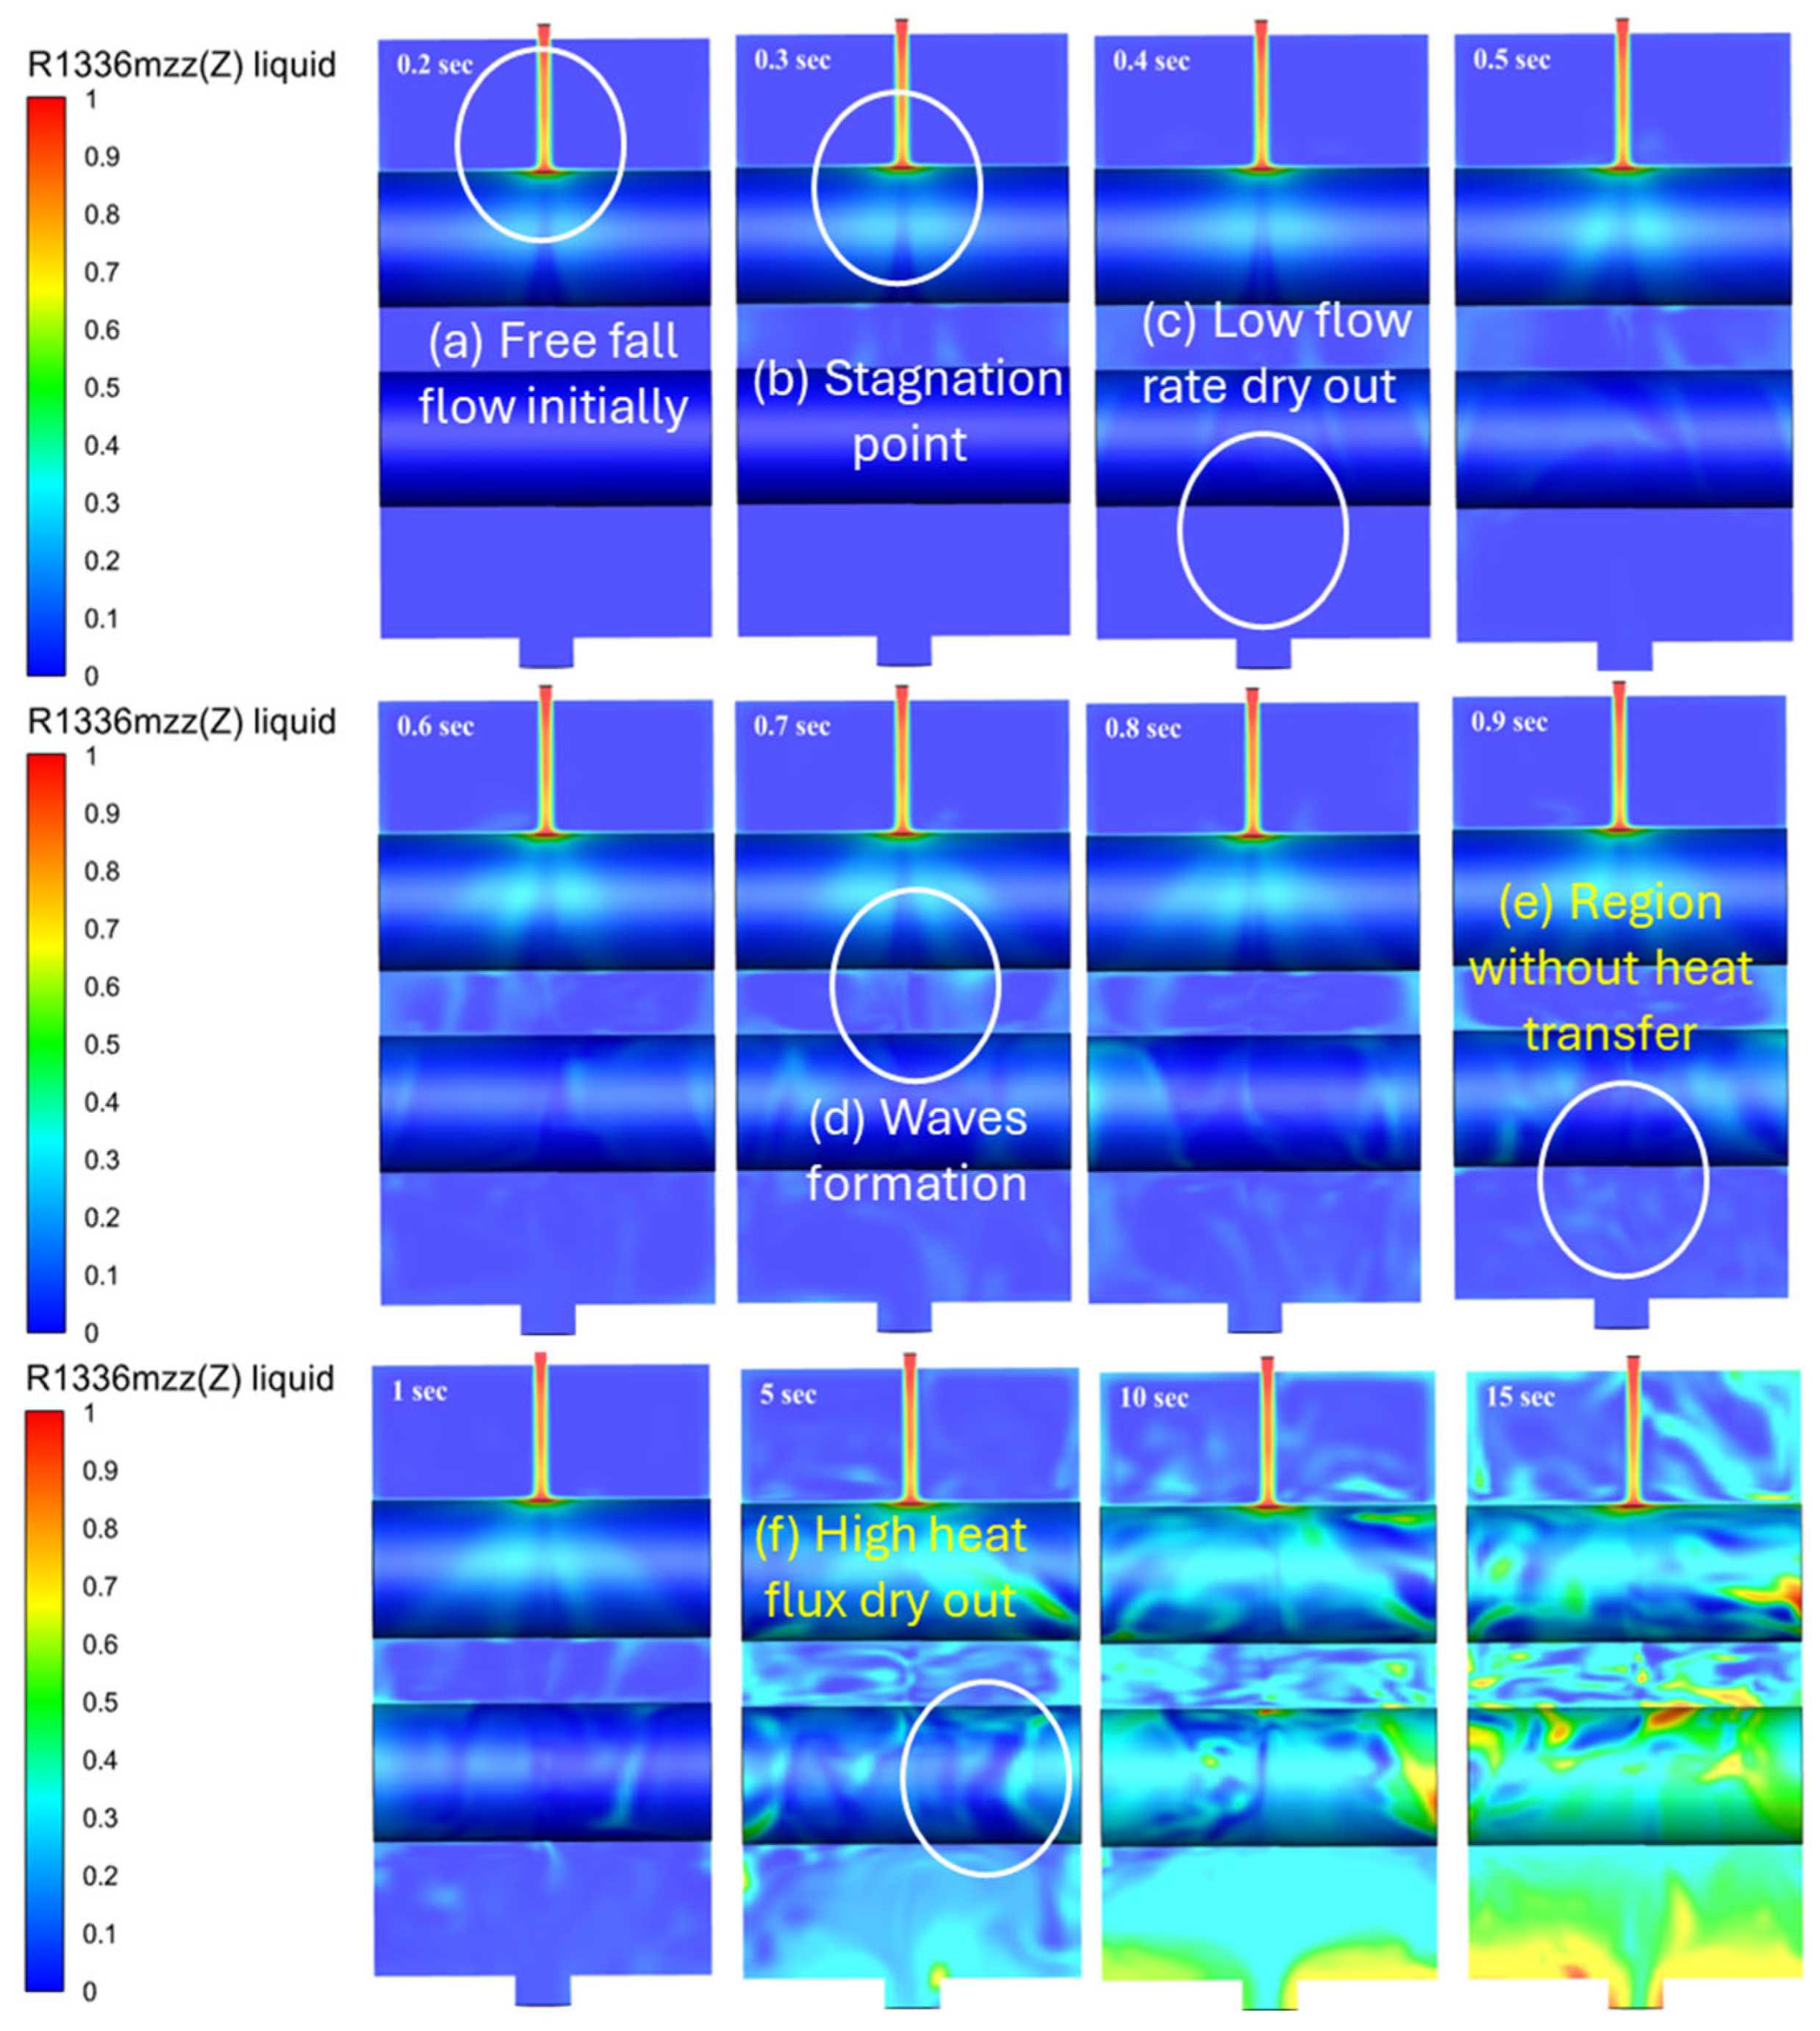
  • CFD analysis revealed key film flow regions, including low-flow dry-out at 0.4 s, high heat flux dry-out at 5 s, and wave formation at 0.7 s. These regions displayed distinct flow behaviors influenced by gravity, surface tension, and viscous forces.
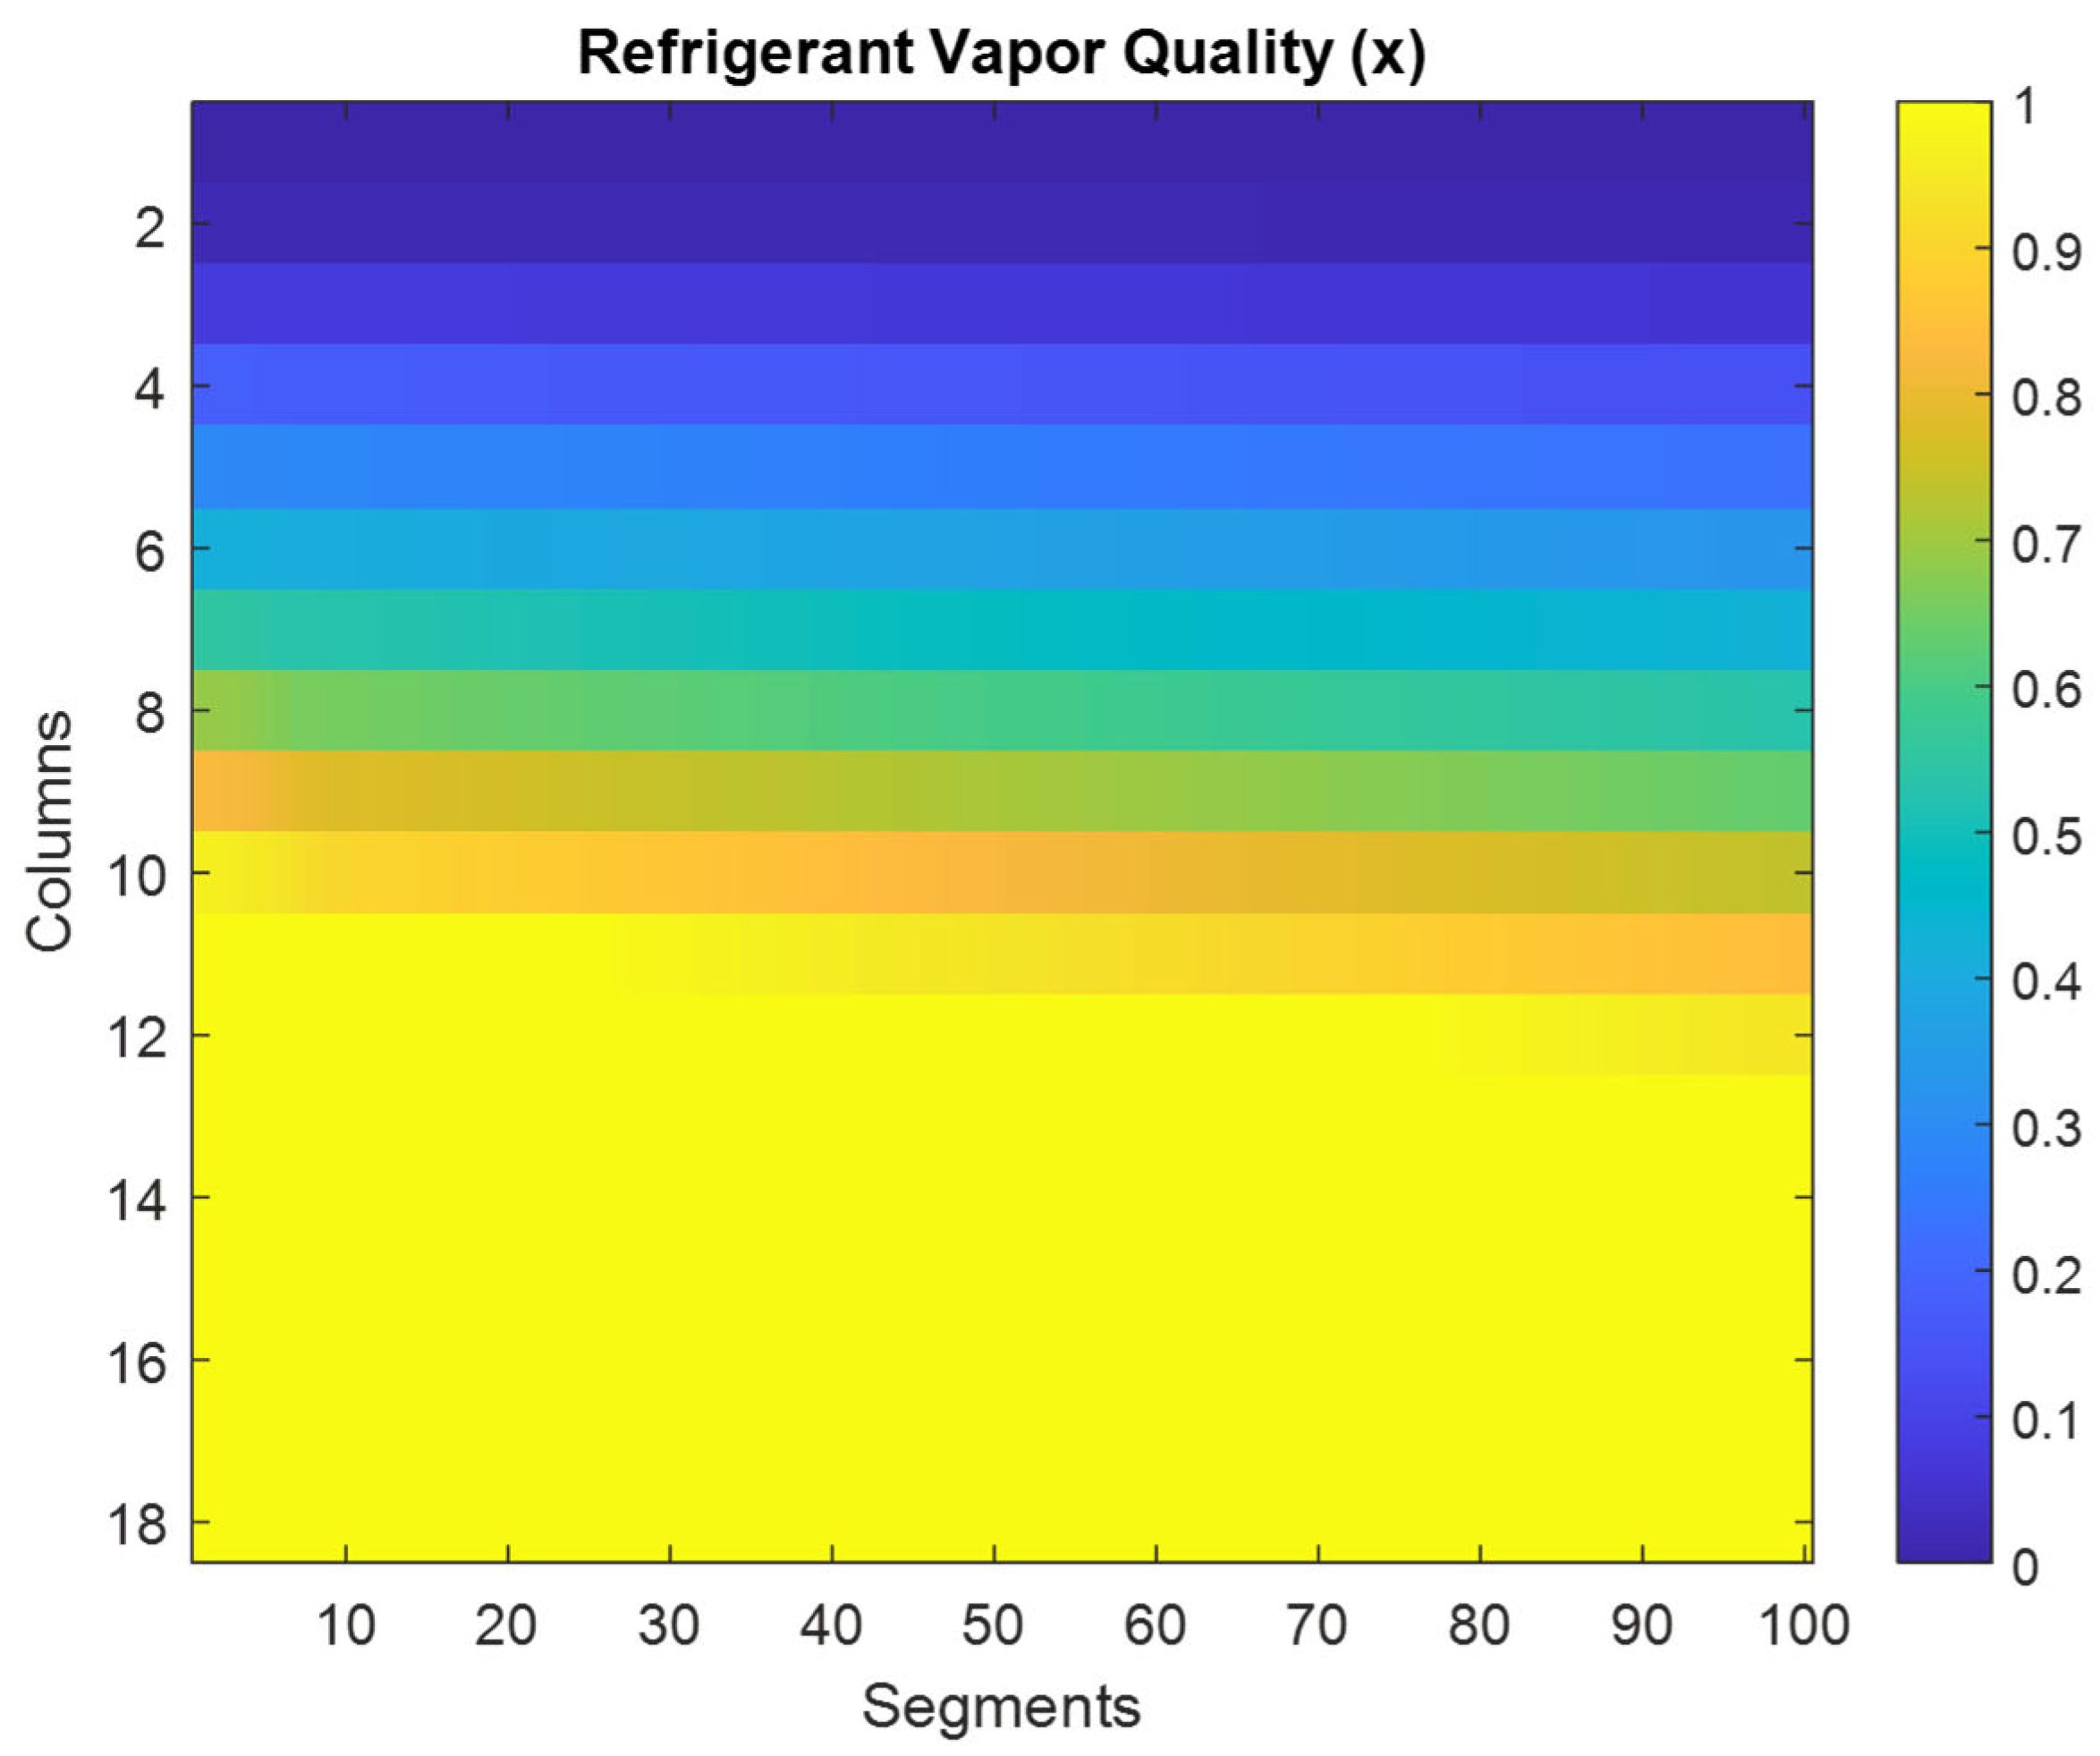
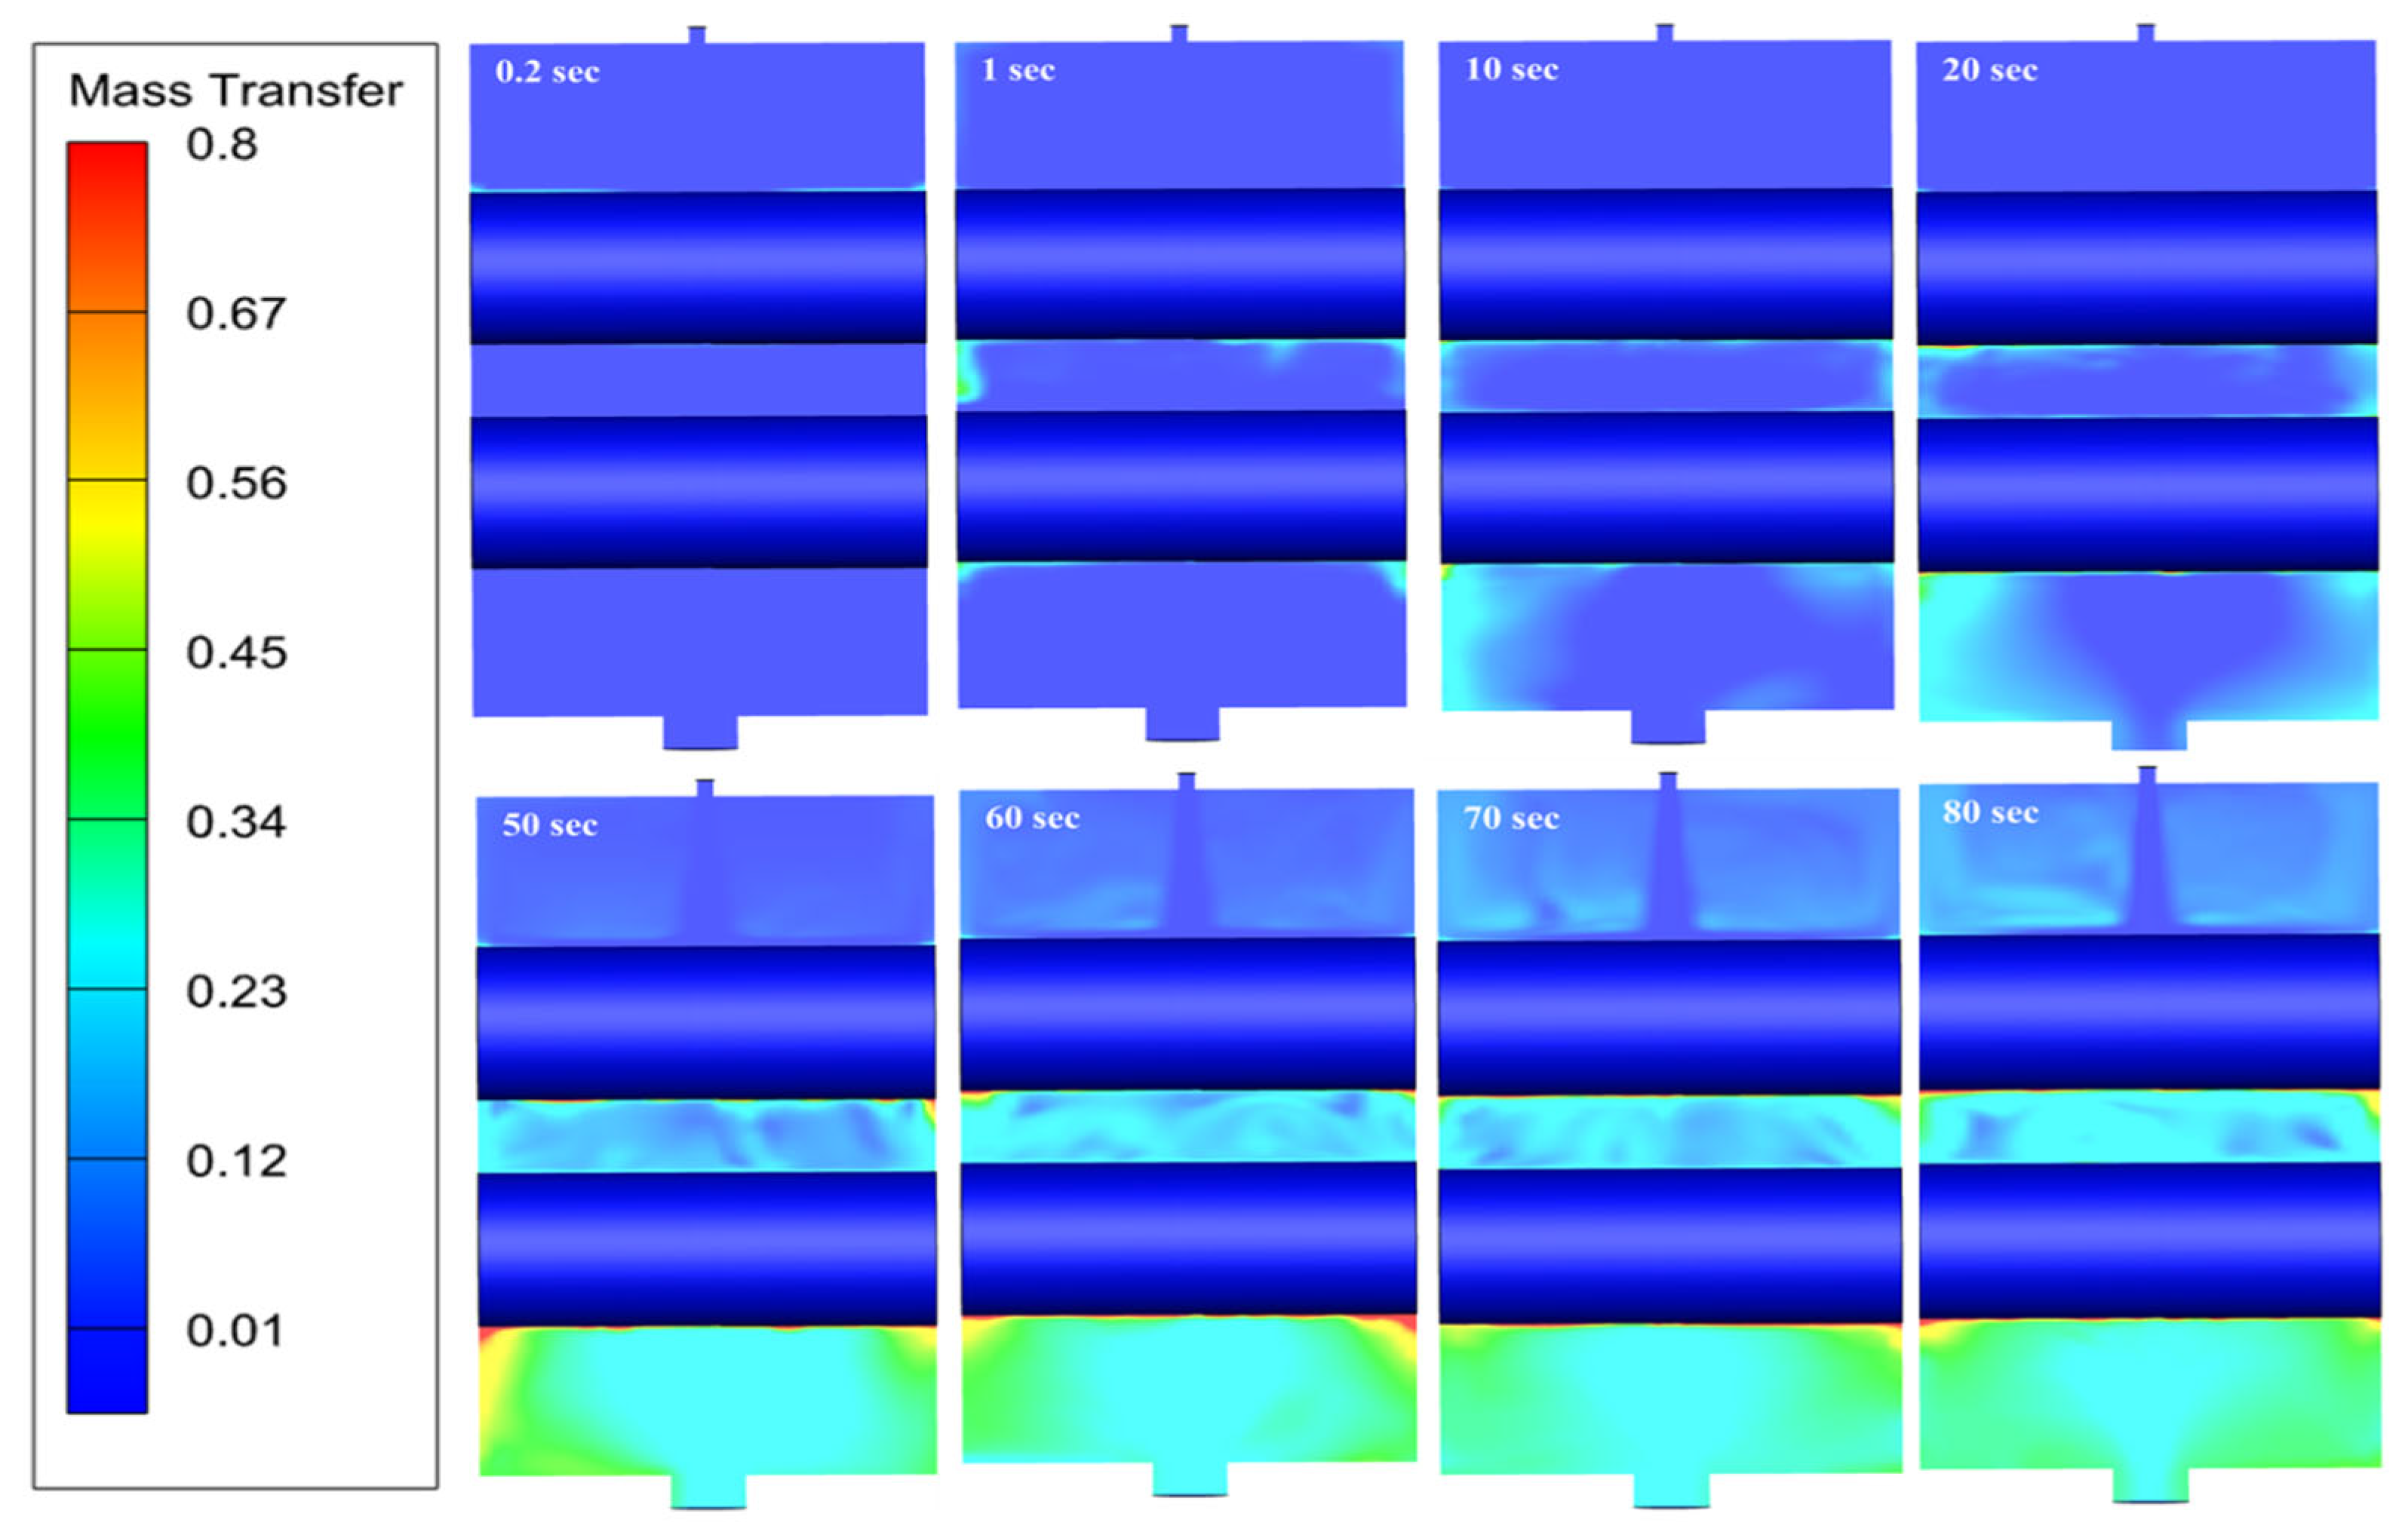
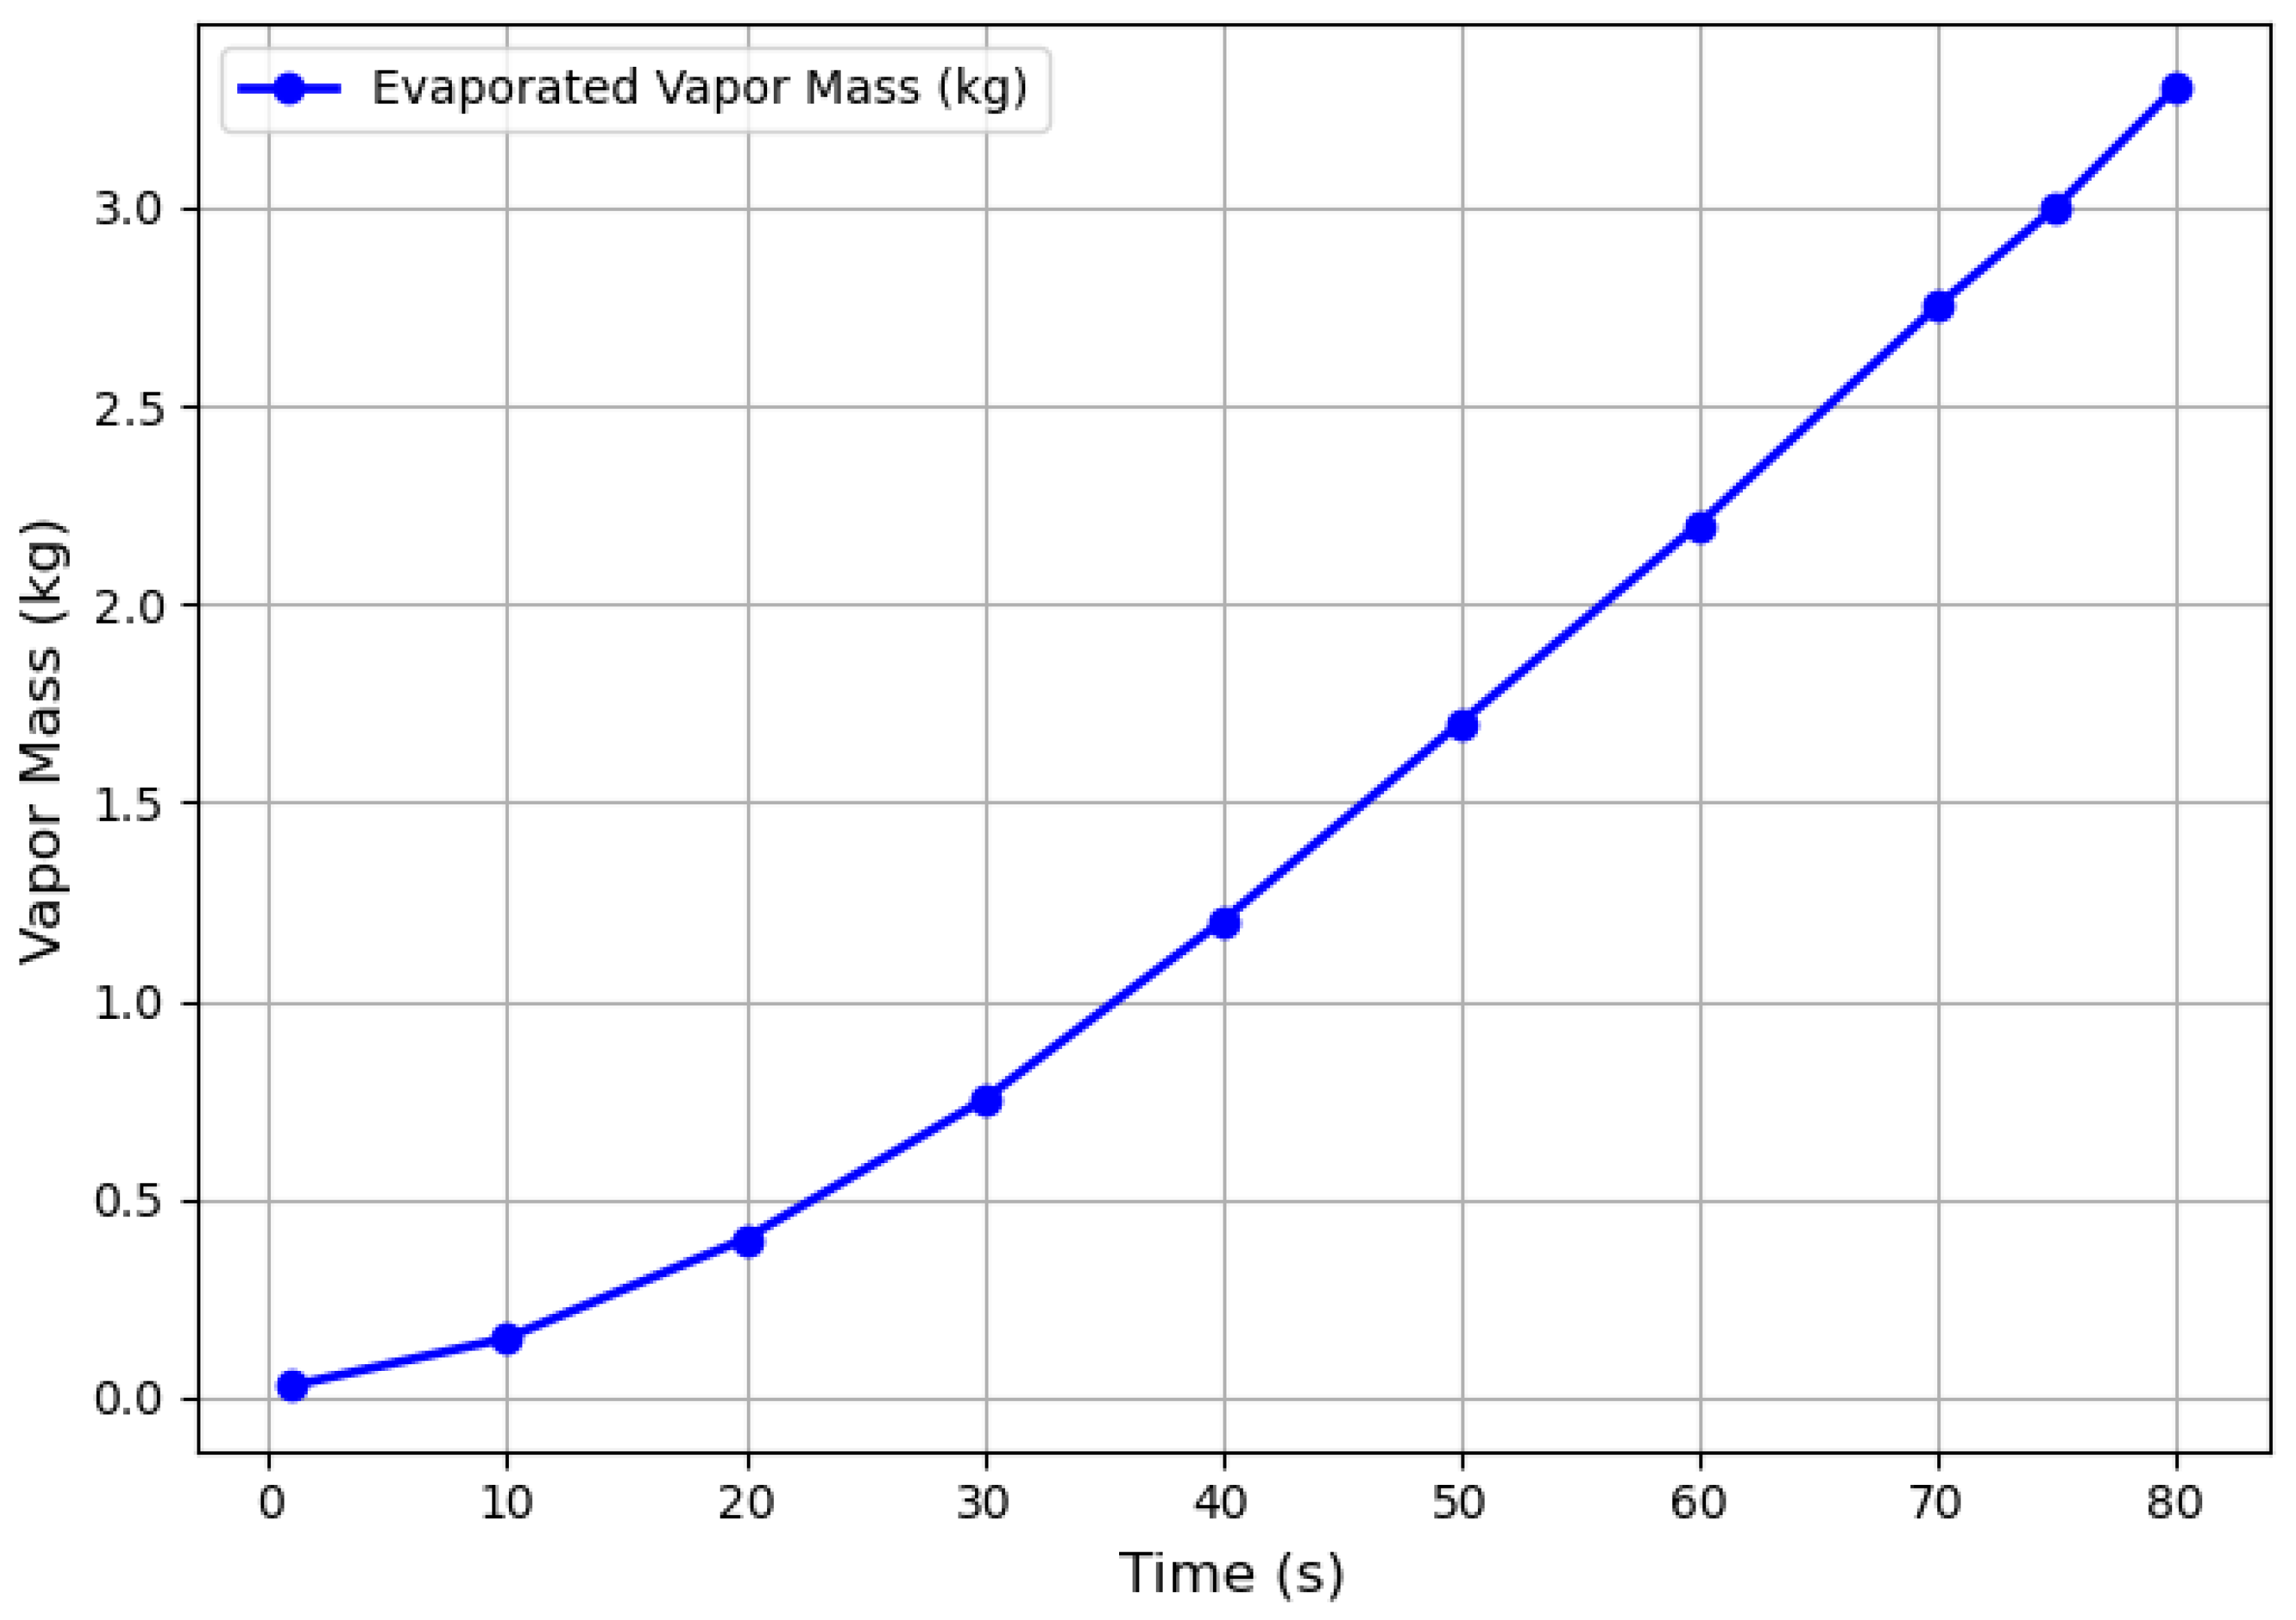
  • Simulations showed that the lower tube sections significantly contributed to vapor formation due to reduced temperature gradients, gravity-driven film thinning, and local vortices enhancing heat transfer.
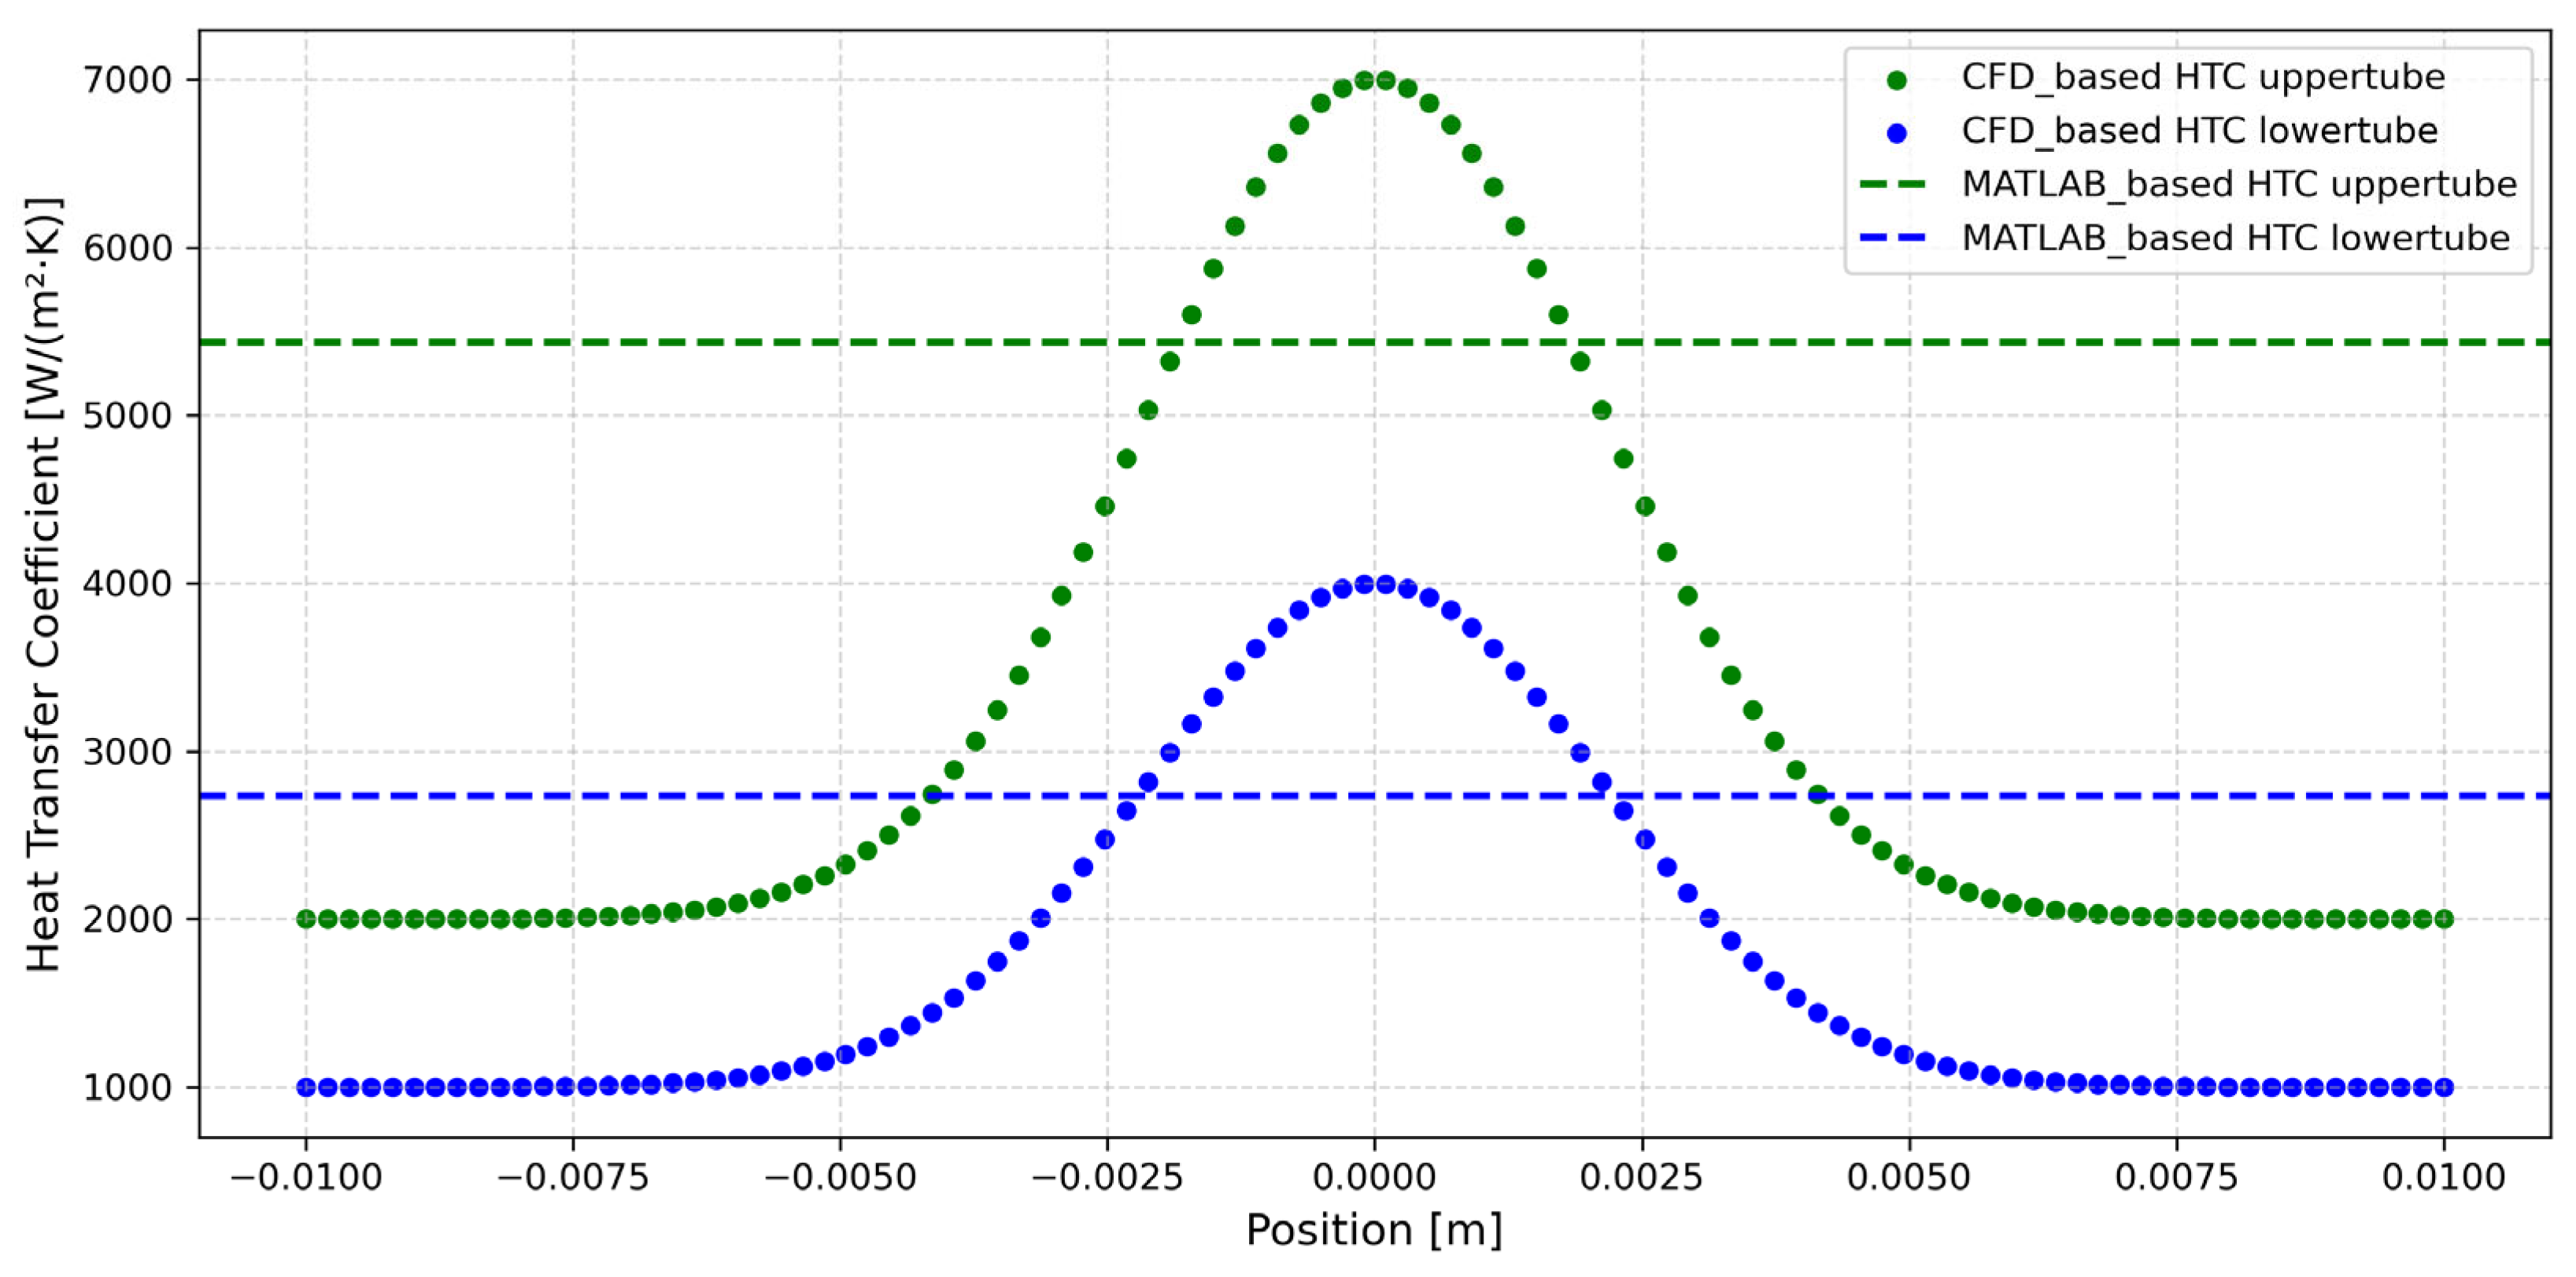
  • Comparing MATLAB-based and CFD-predicted heat transfer coefficients, the upper tube showed 2000–7000 W/m2 K (vs. 5433 W/m2 K from MATLAB), and the lower tube 1000–4000 W/m2 K (vs. 2735 W/m2 K). CFD captured critical local non-uniformities, especially in the lower rows, which are missed by simplified models, underscoring the value of CFD in improving thermal design accuracy.
Overall, this study provides a robust CFD framework to analyze and optimize falling film evaporators in HTHP applications. By examining the effects of fluid properties, geometric parameters, and boundary conditions, the findings serve as a foundational basis for introducing future improvements in evaporator designs. The study will be extended further by developing a lab-scale test facility for falling film evaporators and conducting in-depth analysis and comparisons with existing numerical results.

Author Contributions

Conceptualization, S.I. and M.-H.K.; methodology, S.I., M.S., Q.S.A. and N.U.; software, S.I., M.S., Q.S.A. and N.U.; validation, S.I. and M.S.; formal analysis, S.I. and M.S.; investigation, S.I., M.S., Q.S.A. and N.U.; resources, M.-H.K.; data curation, S.I. and J.C.J.; writing—original draft preparation, S.I. and M.S.; writing—review and editing, S.I., Q.S.A., N.U. and J.C.J.; visualization, S.I. and M.S.; supervision, M.-H.K.; project administration, M.-H.K.; funding acquisition, M.-H.K. All authors have read and agreed to the published version of the manuscript.

Funding

This work was partly supported by a Korea Institute of Energy Technology Evaluation and Planning (KETEP) grant funded by the Korea government (MOTIE) (Project number: RS-2024-00421963).

Data Availability Statement

Dataset available on request from the authors.

Conflicts of Interest

The authors declare no conflicts of interest.

References

  1. Lin, H.Y.; Muneeshwaran, M.; Yang, C.M.; Nawaz, K.; Wang, C.C. On falling film evaporator—A review of mechanisms and critical assessment of correlation on a horizontal tube bundle with updated development. Int. Commun. Heat Mass Transf. 2024, 150, 107165. [Google Scholar] [CrossRef]
  2. Jige, D.; Miyata, H.; Inoue, N. Falling film evaporation of R1234ze(E) and R245fa on a horizontal smooth tube. Exp. Therm. Fluid Sci. 2019, 105, 58–66. [Google Scholar] [CrossRef]
  3. Chien, L.H.; Cheng, C.H. A predictive model of falling film evaporation with bubble nucleation on horizontal tubes. HVAC R Res. 2006, 12, 69–87. [Google Scholar] [CrossRef]
  4. Chyu, M.-C.; Bergles, A.E. An Analytical and Experimental Study of Falling-Film Evaporation on a Horizontal Tube. J. Heat Transfer. 1987, 109, 983–990. Available online: http://heattransfer.asmedigitalcollection.asme.org/ (accessed on 13 March 2025). [CrossRef]
  5. Chien, L.H.; Tsai, Y.L. An experimental study of pool boiling and falling film vaporization on horizontal tubes in R-245fa. Appl. Therm. Eng. 2011, 31, 4044–4054. [Google Scholar] [CrossRef]
  6. Alhusseini, A.A.; Tuzla, K.; Chens, J.C. Falling film evaporation of single component liquids. Int. J. Heat Mass Transf. 1998, 41, 1623–1632. [Google Scholar] [CrossRef]
  7. Shah, M.M. A general correlation for heat transfer during evaporation of falling films on single horizontal plain tubes. Int. J. Refrig. 2021, 130, 424–433. [Google Scholar] [CrossRef]
  8. Shah, M.M. Prediction of dryout in evaporation of falling films on horizontal plain tubes. Chem. Eng. Res. Des. 2022, 179, 527–534. [Google Scholar] [CrossRef]
  9. Chien, L.H.; Chen, R.H. An experimental study of falling film evaporation on horizontal tubes using R-134a. J. Mech. 2012, 28, 319–327. [Google Scholar] [CrossRef]
  10. Christians, M.; Thome, J.R. Falling film evaporation on enhanced tubes, part 1: Experimental results for pool boiling, onset-of-dryout and falling film evaporation. Int. J. Refrig. 2012, 35, 300–312. [Google Scholar] [CrossRef]
  11. Ubara, T.; Asano, H.; Sugimoto, K. Falling film evaporation and pool boiling heat transfer of R1233zd(E) on thermal spray coated tube. Appl. Therm. Eng. 2021, 196, 117329. [Google Scholar] [CrossRef]
  12. Zhao, C.Y.; Qi, D.; Ji, W.T.; Jin, P.H.; Tao, W.Q. A comprehensive review on computational studies of falling film hydrodynamics and heat transfer on the horizontal tube and tube bundle. Appl. Therm. Eng. 2022, 202, 117869. [Google Scholar] [CrossRef]
  13. Onan, C.; Ozkan, D.B.; Erdem, S. CFD and experimental analysis of a falling film outside smooth and helically grooved tubes. Adv. Mech. Eng. 2014, 6, 915034. [Google Scholar] [CrossRef]
  14. Hassan, I.A.; Sadikin, A.; Isa, N.M. Numerical simulation of falling film thickness flowing over horizontal tubes. ARPN J. Eng. Appl. Sci. 2017, 12, 3046–3053. Available online: www.arpnjournals.com (accessed on 14 April 2025).
  15. Baru, P.A.; Hassan, I.A.; Sadikin, A.; Isa, N.M. The Computational Modeling of Falling Film Thickness Flowing Over Evaporator Tubes. J. Adv. Res. Fluid Mech. Therm. Sci. 2015, 14, 24–37. [Google Scholar]
  16. Tahir, F.; Nasser, A.; Mabrouk, A.; Mabrouk, A.; Koç, M. CFD Investigation of Falling Film Flow over Horizontal Tube. Available online: https://www.researchgate.net/publication/348909761 (accessed on 1 March 2025).
  17. Zhao, C.Y.; Ji, W.T.; Jin, P.H.; Li, A.G.; Fan, J.F.; Yoshioka, S.; Tao, W.Q. Falling film evaporation in a triangular tube bundle under the influence of cross vapor stream. Int. J. Refrig. 2020, 112, 44–55. [Google Scholar] [CrossRef]
  18. Liu, F.; Wang, D.; Wang, Q.; Ga, J. The optimum design of falling-film evaporator and numerical simulation of distributor. Procedia Eng. 2017, 205, 3867–3872. [Google Scholar] [CrossRef]
  19. Jin, P.H.; Zhang, Z.; Mostafa, I.; Zhao, C.Y.; Ji, W.T.; Tao, W.Q. Heat transfer correlations of refrigerant falling film evaporation on a single horizontal smooth tube. Int. J. Heat Mass Transf. 2019, 133, 96–106. [Google Scholar] [CrossRef]
  20. Kim, W.; Kim, H.S.; Kim, J.; Kim, D.H. An Experimental Study on The Themal Performance Measurement and Flow Visualization of Falling Film Evaporator Using R-1233ZD(E) Refrigerant. Korean J. Air-Cond. Refrig. Eng. 2024, 36, 9–17. [Google Scholar] [CrossRef]
  21. Lemmon, E.W.; Bell, I.H.; Huber, M.L.; McLinden, M.O. NIST Standard Reference Database 23: Reference Fluid Thermodynamic and Transport Properties-REFPROP, Version 10.0; National Institute of Standards and Technology: Gaithersburg, MD, USA, 2018. [Google Scholar]
  22. Ullah, N.; Ishaque, S.; Kim, M.H.; Choi, S. Modeling and Optimization of a Micro-Channel Gas Cooler for a Transcritical CO2 Mobile Air-Conditioning System. Machines 2022, 10, 1177. [Google Scholar] [CrossRef]
  23. Mascarenhas, N.; Mudawar, I. Study of the influence of interfacial waves on heat transfer in turbulent falling films. Int. J. Heat Mass Transf. 2013, 67, 1106–1121. [Google Scholar] [CrossRef]
  24. Sun, D.; Xu, J.; Chen, Q. Modeling of the evaporation and condensation phase-change problems with fluent. Numer. Heat Transf. Part B 2014, 66, 326–342. [Google Scholar] [CrossRef]
  25. Kim, D.G.; Jeon, C.H.; Park, I.S. Comparison of numerical phase-change models through Stefan vaporizing problem. Int. Commun. Heat Mass Transf. 2017, 87, 228–236. [Google Scholar] [CrossRef]
Figure 1. (a) Design of the falling film evaporator. (b) Segment-by-segment modeling approach.
Processes 13 02398 g001
Figure 2. Temperature variation vs. heat flow in subcooled, two-phase, and superheated regions.
Processes 13 02398 g002
Figure 3. Variation of refrigerant vapor quality in each segment along the tube columns.
Processes 13 02398 g003
Figure 4. Variation of overall heat transfer coefficient in each segment along the tube columns.
Processes 13 02398 g004
Figure 5. Variation of heat duty in each segment along the tube columns.
Processes 13 02398 g005
Figure 6. (a) 3D geometry and (b) 3D mesh models.
Processes 13 02398 g006
Figure 7. Mesh sensitivity analysis.
Processes 13 02398 g007
Figure 8. Comparison of interface staying near saturation at (a) 0 s, (b) 0.06 s, and (c) 0.1 s for the Stefan problem.
Processes 13 02398 g008
Figure 9. Comparison of analytical and numerical interface positions for the 1D Stefan evaporation problem.
Processes 13 02398 g009
Figure 10. Falling film formation: (a) free fall, (b) stagnation point and impingement zone, (c) developing region, (d) developed region, (e) film detachment, and (f) necking.
Processes 13 02398 g010
Figure 11. Liquid volume fraction of the refrigerant R1336mzz(Z) falling film flow over the horizontal tubes with respect to time in the 3D domain.
Processes 13 02398 g011
Figure 12. Vapor volume fraction of the refrigerant R1336mzz(Z) in the falling film over the horizontal tubes with respect to time in the 3D domain.
Processes 13 02398 g012
Figure 13. Contours for mass transfer rate of the refrigerant R1336mzz(Z) falling film over the horizontal tubes with respect to time in the 3D domain.
Processes 13 02398 g013
Figure 14. Temperature contours of the refrigerant R1336mzz(Z) falling film over the horizontal tubes with respect to time in the 3D domain.
Processes 13 02398 g014
Figure 15. Comparison of heat transfer coefficient along the segment length.
Processes 13 02398 g015
Figure 16. Time evolution of evaporated mass (Full evaporator estimated).
Processes 13 02398 g016
Table 1. Details of operating conditions.
DescriptionShell SideUnit
Shell side fluidRefrigerant R1336mzz(Z)-
Tube-side fluidWater-
Refrigerant inlet temperature78.12°C
Refrigerant Inlet pressure420kPa
Refrigerant saturation temperature79.12°C
Refrigerant mass flow rate26.34kg/s
Refrigerant inlet quality0 (subcooled)-
Water inlet temperature90°C
Water inlet pressure300kPa
Water mass flow rate112.3kg/s
Table 2. Details of design specifications.
DescriptionValueUnit
Number of tubes324-
Total heat transfer area required37.83m2
Heat transfer area per tube0.1197m2
Log mean temperature difference (LMTD)8.13°C
Total heat transfer rate (Q)2.2MW
Estimated shell diameter500mm
Transverse tube pitch25mm
Longitudinal tube pitch25mm
Tube length2000mm
Tube outer diameter19.05mm
Tube inner diameter17.05mm
Tube materialCopper-
Table 3. Thermophysical properties of R1336mzz(Z) at 79.12 °C and 420 kPa.
PropertyLiquid PhaseVapor PhaseUnit
Density (ρ)1209.927.29kg/m3
Specific heat capacity (Cp)1.34371.0441kJ/kg·K
Thermal conductivity (k)61.3315.71mW/m·K
Dynamic viscosity (μ)198.712.03μPa·s
Heat of vaporization (i_fg)-140.57kJ/kg
Table 4. Solver settings used for the VOF model.
ParameterInput Data/Setting
Flow regimeTurbulent
Turbulence modelk-ω SST (Shear Stress Transport)
Surface tension modelingCSF model
Volume fraction cut-off10−6
Courant number≤0.25
Transient formulationFirst-order implicit
Pressure-velocity couplingCoupled algorithm
Pressure interpolation schemePRESTO algorithm
DiscretizationSecond-order upwind (momentum and energy)
Surface tracking/volume fractionGeo-reconstruct
Evaporation modelLee model
Disclaimer/Publisher’s Note: The statements, opinions and data contained in all publications are solely those of the individual author(s) and contributor(s) and not of MDPI and/or the editor(s). MDPI and/or the editor(s) disclaim responsibility for any injury to people or property resulting from any ideas, methods, instructions or products referred to in the content.

