Abstract
In light of the persistent environmental degradation driven by fossil fuels, developing new energy sources is essential for achieving sustainability. The recent surge in electric vehicle adoption has underscored the significance of new energy batteries. However, the supply chains of new energy battery manufacturers face multiple sustainability risks, which impede sustainable practice adoption. To tackle these challenges, leanness philosophy is an effective tool, and Industry 5.0 enhances its efficacy significantly, further mitigating sustainability risks. This study integrates the supply chain, leanness philosophy, and Industry 5.0 by applying quality function deployment. A novel four-phase hybrid MCDM model integrating the fuzzy Delphi method, DEMATEL, AHP, and fuzzy VIKOR, identified five key sustainability risks five core leanness principles, and eight critical Industry 5.0 enablers. By examining a Chinese new energy battery manufacturer as a case study, the findings aim to assist managers and decision-makers in mitigating sustainability risks within their supply chains.
1. Introduction
With the substantial increase in energy consumption and the gradual depletion of traditional energy sources, the sustainable development of national economies necessitates the development and utilization of new energy sources [1]. Efficient management and rational energy resource utilization are essential for sustainable development [2]. However, new energy battery manufacturers face significant hurdles in establishing sustainable supply chains (SSCs) [3]. These challenges span operational, technological, economic, environmental, and social dimensions. Fundamentally, SSCs aim to manage activities across the entire supply chain to enhance profitability while simultaneously addressing social and ecological impacts [4]. Prioritizing supply chain sustainability without adequately managing associated risks can jeopardize business prospects [5]. This risk exposure is heightened in today’s global trade environment, which is characterized by numerous unstable factors making supply chains more vulnerable to disruptions than ever before [6]. Therefore, investigating risk issues within sustainable supply chains—sustainable supply chain risks (SSCRs)—is critically important.
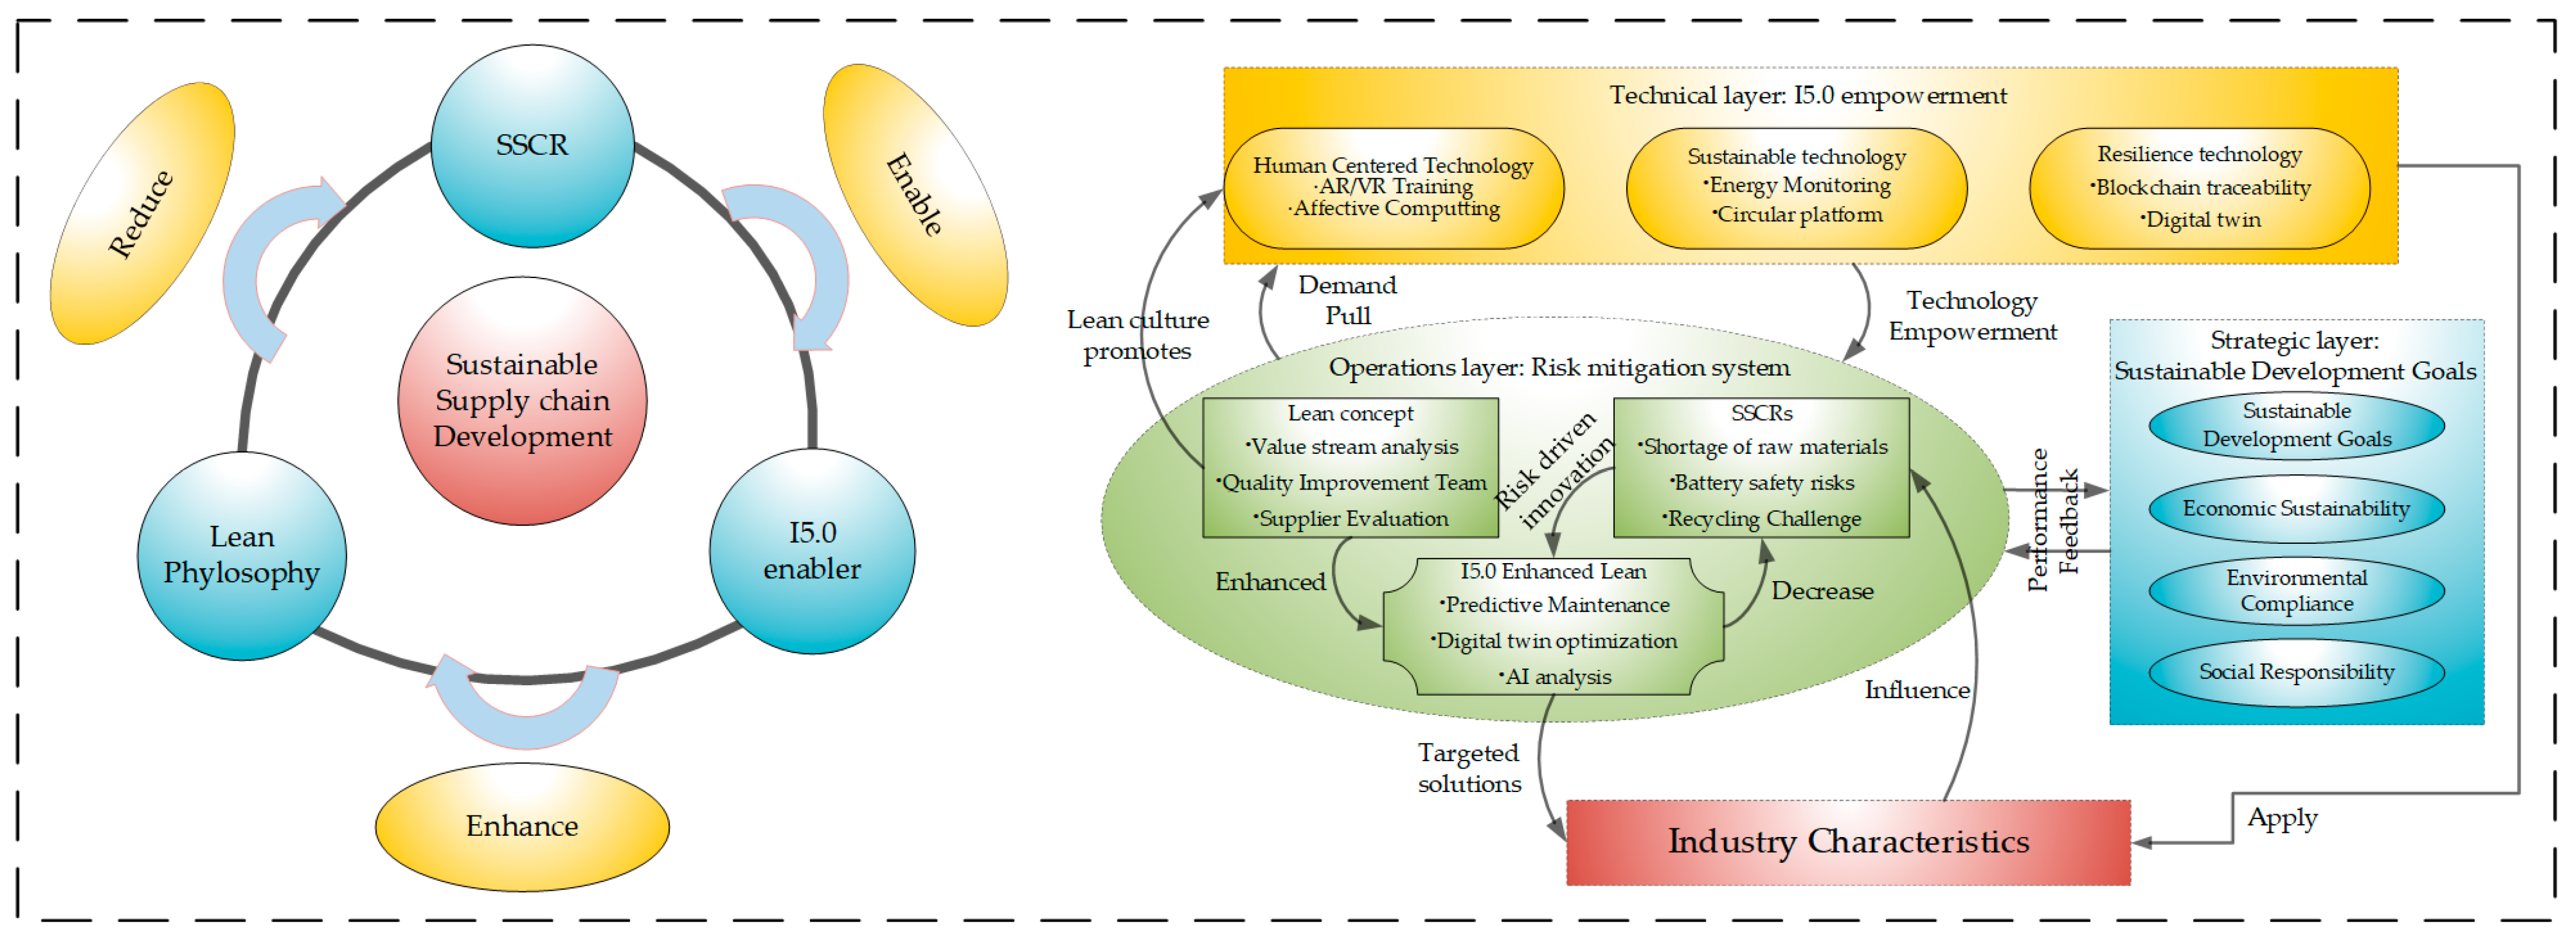
To address sustainable supply chain risks (SSCRs), organizations must respond quickly to uncertainties within the supply chain and leverage their capabilities to gain a competitive advantage [7]. As the pressure on organizations to address sustainability in economic, environmental, and social dimensions intensifies, integrating leanness-based tools and practices becomes a key driver for achieving this objective [8]. Adopting lean approaches in complex supply chains positively impacts their economic and environmental sustainability. A lean supply chain is a common strategy chosen by organizations in operational environments, and formulating a supply chain strategy can be considered the first step in mitigating disruptions and actively managing risks within the supply chain [9]. Lean practices contribute to reducing the sustainability risks of the supply chain, and with the assistance of Industry 4.0 (I4.0), the effectiveness of leanness philosophies can be further enhanced.
By applying I4.0 technologies to the production process, it will be possible to make lean production an effective system and overcome its limitations, such as demand variability and product customization, while making I4.0 technologies more efficient [10]. Today, the era of Industry 5.0 (I5.0) has arrived. I5.0 is considered the next industrial revolution, encompassing three core elements: human-centeredness, sustainability, and resilience. Its advantage lies in surpassing the social goals of employment and economic growth by ensuring that manufacturing respects the boundaries of the Earth and places the well-being of industrial workers at the center of the production process, thus becoming a provider of well-being. The concept of I5.0 complements and expands upon the iconic features of I4.0, indicating that technology-driven I4.0 and value-driven I5.0 should be considered concurrently [11]. Therefore, in the era of I5.0, leanness philosophies must also be combined with I5.0, enabling lean production to become a more efficient system. The core objective of this study was to provide decision recommendations for the sustainable development of the supply chain of new energy battery manufacturing enterprises. The key to advancing sustainable supply chain development lies in reducing SSCRs, which requires the support of I5.0 and leanness philosophies. As shown in Figure 1:

Figure 1.
Achieving the propagation of sustainability in supply chains (source: authors).
- I5.0 will be the next industrial revolution, and its improvement measures can enhance the role of leanness philosophies.
- Many different industries, including the industrial sector, have been positively influenced by leanness philosophies, which can effectively reduce the sustainability risks of enterprise supply chains.
- SSCRs will undergo changes in quantity and nature due to influences from society, economy, and the environment, which will also drive the progress of I5.0.
Within the supply chain ecosystem composed of I5.0 improvement measures, leanness philosophies, and SSCRs, the interaction among these three factors facilitates the propagation of sustainability within the supply chain and continuously promotes its sustainable development.
This study aims to develop two houses of quality by integrating MCDM and QFD to connect sustainable supply chains, leanness philosophies, and I5.0 while considering the specific context of China’s most representative new energy battery manufacturing enterprise. To the authors’ knowledge, this is the first empirical study to explore the use of I5.0 enablers to strengthen leanness philosophies and reduce SSCRs. The study focused on the following three questions:
- What are the key sustainable risks, leanness philosophies, and I5.0 enablers in the supply chain of new energy battery enterprises?
- How can quality function deployment be integrated with multi-criteria decision-making to connect the relationships among the three sets of variables and provide decision support for SSCRs in new energy battery enterprises?
- How can new energy battery enterprises effectively reduce SSCRs by utilizing the proposed framework and leveraging I5.0 enablers to strengthen leanness philosophies?
The structure of this paper is as follows. Section 2 describes the relevant research. Section 3 introduces the four methods used in the analysis model. Section 4 is a case study in which the methodology was applied. Section 5 discusses the analysis results. Section 6 is the conclusion. Section 7 discusses the research limitations and future research.
2. Literature Review
This section systematically reviews the literature on SSCRs, the relationship between leanness philosophies and SSCRs, and the integration of Industry 5.0 with leanness philosophies.
2.1. SSCRs
Sustainable development is typically characterized by three pillars, also known as the triple bottom line: environmental sustainability, social responsibility, and economic sustainability. Scholars define SSCRs from multiple perspectives. Based on the triple bottom line, risk factors are classified into three categories: environmental risk factors, economic risk factors, and social risk factors. Song et al. [12] added operational risk as an additional category. Rostamzadeh et al. [13] proposed a framework for SSCRs comprising environmental risk, organizational risk, sustainable supply risk, sustainable production risk, sustainable distribution risk, and sustainable recovery risk. SSCRs can also be categorized into internal risks and external risks. Studies by Nazam et al. [14] and Wieland and Wallenburg [15] note that internal risks include green design risk, production capacity risk, quality risk, machinery and equipment risk, green technology risk, and long delivery cycle caused by green products and materials. External risks are further divided into sustainable supply risk and sustainable demand risk. Amin et al. [16] identified sustainable supply risk as the risk associated with the upstream portion of the logistics chain, while sustainable demand risk relates to demand-related risks. The new energy battery industry’s distinctive technological characteristics, material dependencies, and stringent regulatory environment have given rise to a unique set of SSCRs. Foremost among these is the industry’s heavy reliance on geographically concentrated critical minerals (e.g., lithium, cobalt, nickel), which creates extreme supply chain fragility [17]. This dependence exposes manufacturers to three compounding threats—volatility in critical material supplies, procurement risks from geopolitical conflicts, and ethical sourcing challenges (including conflict minerals and exploitative labor practices)—all posing significant economic and reputational hazards [18]. Compounding these material risks is the industry’s breakneck technological evolution. The rapid pace of innovation means massive R&D and production investments risk obsolescence before cost recovery, while failure to keep pace with technological advancements directly endangers market competitiveness [19]. Beyond technological challenges, the sector faces increasingly stringent and evolving environmental, health, and safety regulations governing the entire life cycle of hazardous materials and processes. Insufficient end-of-life management systems and recycling infrastructure amplify compliance pressures, creating significant environmental regulatory risks [20,21]. The operational hazards posed by batteries containing flammable electrolytes and reactive lithium compounds are equally critical. Their transportation, storage, and handling present substantial fire, explosion, and leakage risks, creating immediate threats to worker safety, environmental integrity, and corporate liability [22]. Finally, the industry’s complex globalized supply chains present dual vulnerabilities: heightened exposure to disruptive events (pandemics, geopolitical conflicts) and extraordinary challenges in establishing end-to-end traceability systems [23].
Research on sustainable supply chain management is still developing [24]. It mainly focuses on assessing SSCRs through different MCDM approaches. The research covers various industries and dimensions of sustainability risks. For example, Reinerth et al. [25] provided insights into the emergence of sustainability risks at the national level related to the environment, society, and governance, showcasing their impact and application in sustainable supply chain management. Rahimi et al. [26] proposed a risk-averse sustainable multi-objective mathematical model for designing and planning supply chain networks under uncertainty. He et al. [27] utilized the Kano-QFD-DEMATEL method to design optimal resilient solutions that maximize customer satisfaction and risk mitigation while minimizing cost investment. Abadi and Darestani [28] evaluated SSCRs in three food industry companies using the best–worst method. Zhang and Song [29] identified and assessed sustainability risk factors for applying blockchain technology to sustainable supply chain management. Although research on SSCRs has covered various fields, there is currently a lack of studies specifically focusing on the new energy battery industry. This study aims to address the SSCRs in the new energy battery industry.
2.2. Leanness Philosophy and SSCR
Regarding lean and supply chain research, there is currently limited research on leanness and SSCR, mainly focusing on two aspects: the impact of leanness on supply chain sustainability and how leanness reduces non-sustainable risks in the supply chain. In terms of the first issue, Jakhar et al. [30] employed structural equation modeling to investigate the synergy between lean and sustainable supply chains, suggesting that lean implementation positively influences supplier selection and sustainable practices in production. Das [8] integrated lean systems into supply chain design and planning models to enhance overall business sustainability performance. Zhu et al. [31] proposed a multi-level decision model to integrate lean and sustainable supply chain dimensions with product obsolescence, facilitating product obsolescence decision-making for developing a leaner and more sustainable supply chain. Huo et al. [32], from a natural resource perspective, examined how lean and green processes in the manufacturer–customer (demand-side) and manufacturer–supplier (supply-side) interfaces within the supply chain influence the sustainability of environmental, social, and economic performance. In terms of the second issue, Ahmed and Huma [9] developed a conceptual model to study the drivers of supply chain strategies and the impact of supply chain strategies (i.e., lean and agile) on supply chain robustness and resilience to create a resilient and flexible supply chain. Essaber et al. [33] proposed a hybrid risk management approach that provides supply chain managers with guidance for successfully implementing lean and green practices. Senthil and Muthukannan [34] presented an approach that includes a multi-variant, large/small batch continuous management model, and lean construction project recommendations for managing risks in lean construction supply chains. Lean production contributes to the dissemination of sustainability in supply chains across environmental, economic, and social dimensions. From an environmental perspective, Zhan et al. [35] identified lean and green practices as emerging approaches in supply chain management for improving environmental sustainability and organizational performance. In the economic realm, José [36] suggested that lean practices be implemented across the entire supply chain to minimize waste and optimize processes, thereby enhancing business efficiency. In the social realm, Nath and Agrawal [37] emphasized that lean practices are essential prerequisites for social sustainability orientation and social sustainability performance. In conclusion, implementing lean practices in enterprises is beneficial for propagating sustainability in their supply chains.
2.3. I5.0 and Leanness
In 2021, the European Commission put forward the concept of I5.0, which includes three core goals: people-oriented, sustainable, and resilient. According to the European Commission, the adv38antages of I5.0 go beyond employment and economic growth, aiming to make the manufacturing industry respect the boundaries of the planet while placing the well-being of industrial workers at the center of the production process, becoming a provider of well-being and resilience [38]. I5.0 is not built solely on technology, but on principles such as human-centeredness, environmental management, and social benefits [39]. While I4.0 primarily focuses on applying technology to exclude humans from production, assigning them only supervisory and control functions, I5.0 encompasses the coexistence of technology, social aspects, and ecology [40]. In terms of their connection, Gladysz et al. [41] considered I5.0 an extension of I4.0, incorporating a sustainable mindset and emphasizing human workers. The focus of I5.0 will be built upon the foundations laid by I4.0, utilizing these developments to facilitate the next industrial revolution, with mutual benefits between the two.
Lean and I5.0 paradigms have been explored and recognized in the literature and practice. Some studies have made unique contributions to the interrelationship between the two. For example, Rahardjo [42] suggests that I5.0 technologies can leverage lean tools to achieve lean metrics, such as utilizing big data analytics and value stream mapping to obtain detailed data and information about the entire supply chain. Bandinelli et al. [43] explore the synergistic benefits between leanness and I5.0 principles and show how leanness’s focus on people enhances the implementation of I5.0, thus moving towards the Lean 5.0 paradigm. Rahardjo et al. [42] argue that in the context of I5.0, the performance of lean Six Sigma has been improved through new concepts and digital technologies, which ultimately contribute to promoting sustainable innovation.
Existing research confirms that I5.0 positively affects leanness, which strongly supports that I5.0 can positively impact leanness. However, gaps still emerge in fully integrating leanness and I5.0, especially in terms of how to synergize the unique roles of these two paradigms to reduce SSCRs. Therefore, this study developed an analytical framework to integrate leanness, I5.0, and sustainability supply chain risk, with a case study of a globally recognized new energy battery manufacturer. The results derived from the study will provide valuable insights for academics, practitioners, and policymakers interested in this area.
3. Method
This section introduces the construction of two quality houses that connect SSCRs, leanness philosophies, and I5.0 enablers. The structure of the two quality houses is depicted in Figure 2. Subsequently, an analytical framework incorporating the fuzzy Delphi method (FDM), analytic hierarchy process (AHP), decision laboratory, and fuzzy compromise method is proposed, and the analytical process for each method is described in detail. The detailed workflow of this framework is illustrated in Figure 2.
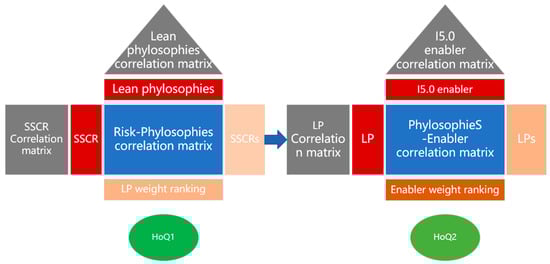
Figure 2.
Two HoQs (source: authors).
3.1. Two HoQs
QFD is a method used to improve the quality of products and services. It involves understanding consumer needs and linking these needs with the technical characteristics of the products or services throughout the manufacturing process. The QFD method has been employed to evaluate quality improvements and the development of new services in the energy industry, aiding in identifying appropriate technological capabilities [44]. House of quality (HoQ), a part of QFD, is a well-known tool for product development that transforms the voice of the customer into product specifications through a relationship matrix [45].
As depicted in Figure 2, this study establishes two quality houses to link SSCRs, leanness philosophies, and I5.0 enablers. Five types of correlation matrices reflect the relationships among themselves or with other factors. The first quality house is designed to connect SSCRs and leanness philosophies, with the risk weights crucial for establishing the connection. The aim is to prioritize the risk weights and the weights of leanness philosophies to identify key risks and leanness philosophies. The second quality house links leanness philosophies and I5.0 enablers, with the principal weights crucial for establishing the connection. After prioritizing the weights of enhancement measures, key enhancement measures are selected.
3.2. Analytical Framework
Building on the conceptual foundation of the two HoQs described in Section 3.1, an analytical framework is proposed to operationalize their construction and linkage. As shown in Figure 3, the framework consists of three stages and four components, employing FDM, DEMATEL, AHP, and fuzzy VIKOR methods for data analysis. In the first stage, the most relevant factors for the three themes are identified using FDM. In the second stage, the weights of risk factors are determined through DEMATEL and AHP. In the third stage, the weights of leanness philosophies and I5.0 enablers are determined using fuzzy VIKOR twice. The first, second, and third components form the first quality house, while the first and fourth components form the second quality house. The second and third components are crucial intermediate steps in both quality houses, providing the subsequent weight values.
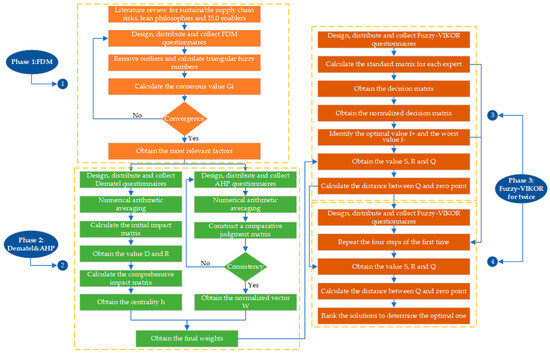
Figure 3.
Analytical framework (source: authors).
3.2.1. FDM
To identify the most relevant factors for the three themes (SSCRs, leanness philosophies, I5.0 enablers) to be incorporated into the HoQs, the FDM is employed in the first stage of the analytical framework. The FDM applies fuzzy theory to the Delphi method. Using statistical analysis and fuzzy operations, the FDM transforms expert opinions into quasi-objective data. Applying the FDM for factor selection considers the uncertainty and fuzziness inherent in expert subjective thinking, thus allowing researchers to achieve their objectives.
The steps are as follows.
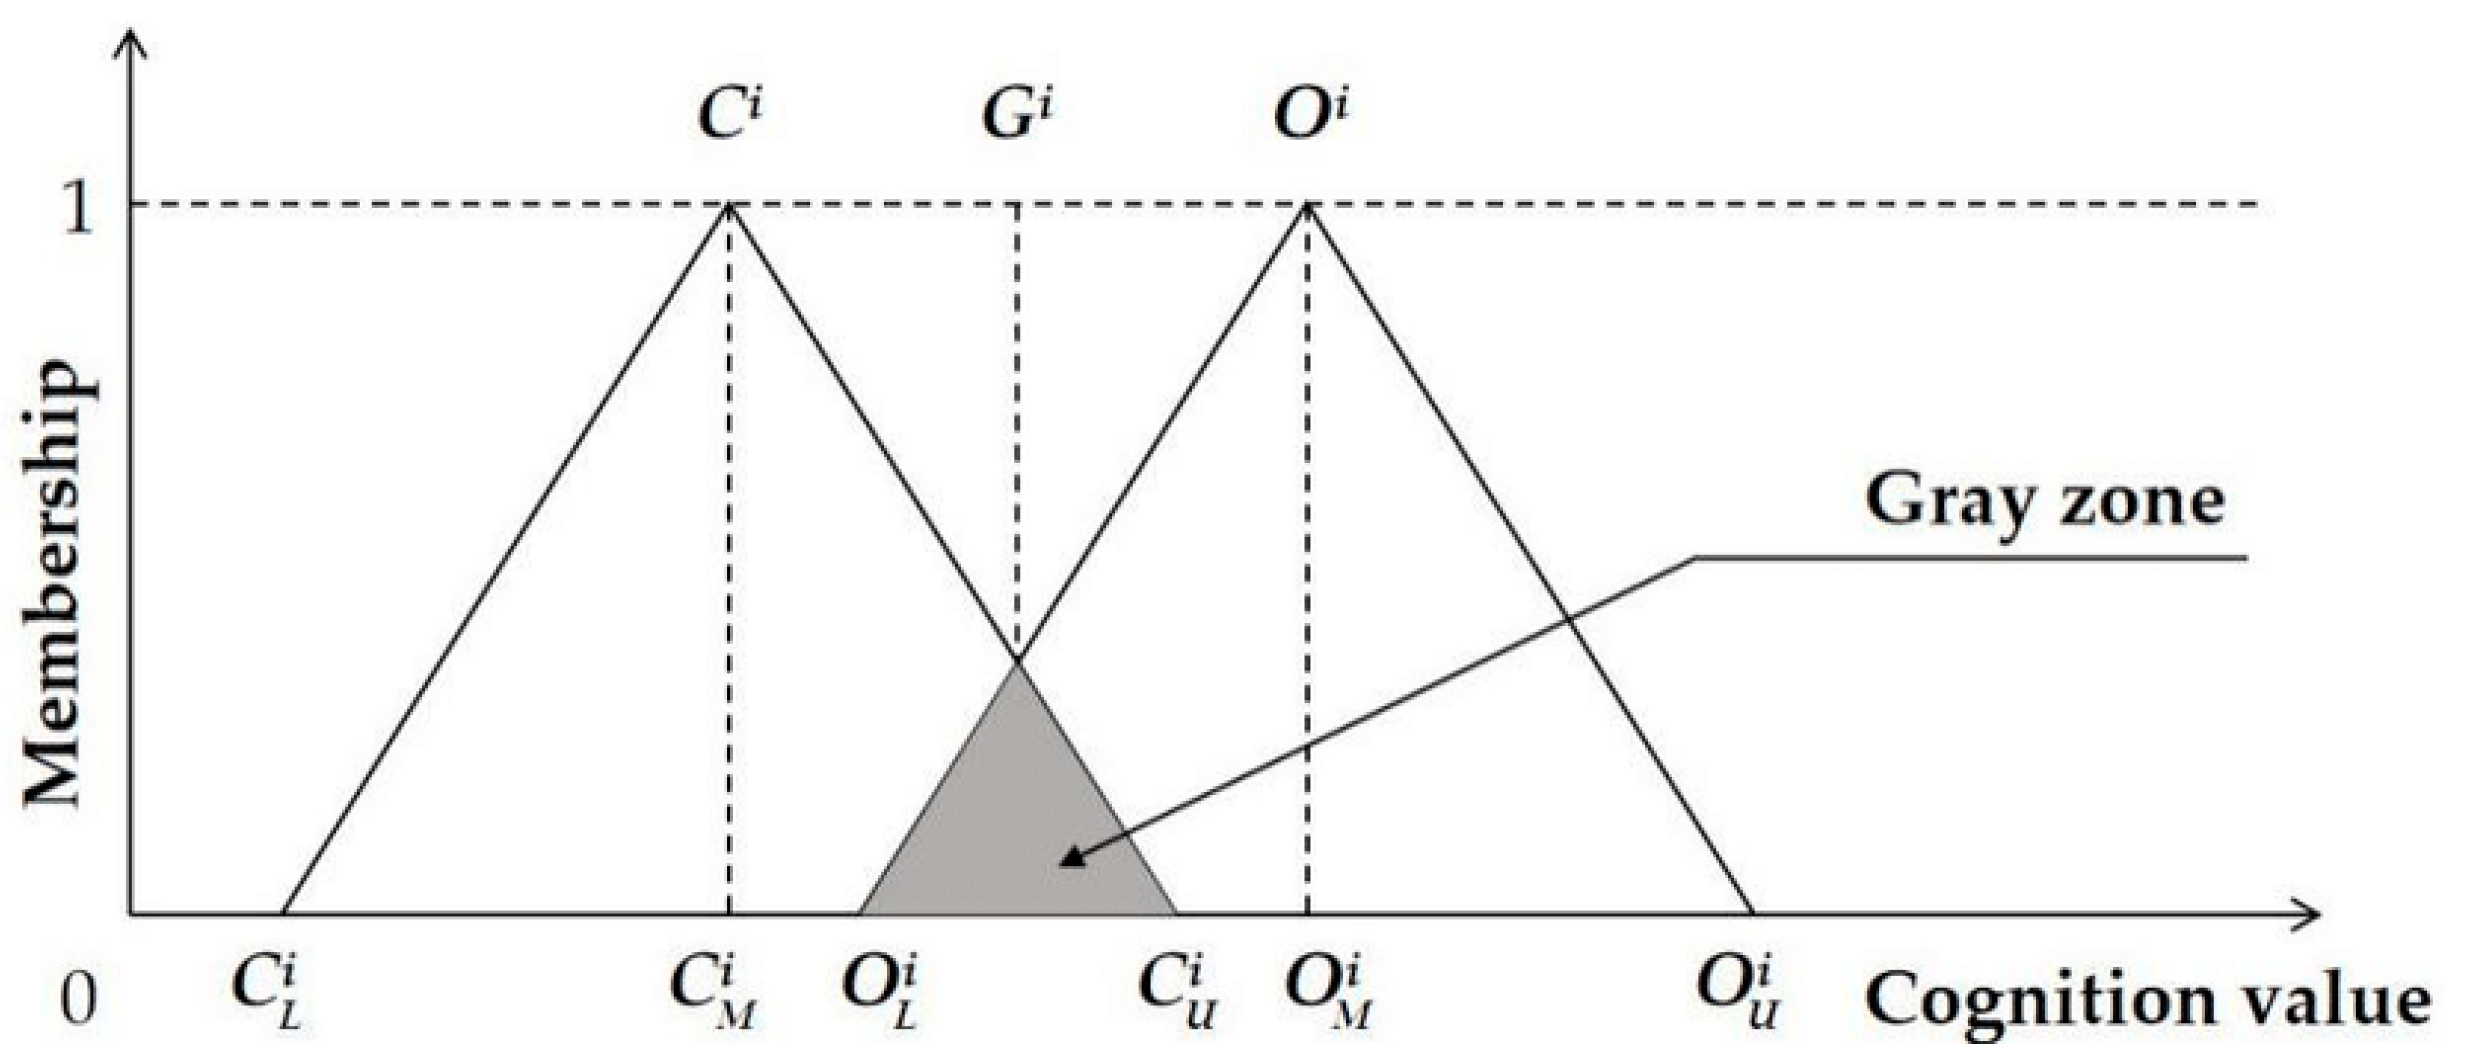
Step 1: Define the interval values for the evaluation criteria. The minimum value in the interval represents the experts’ conservative cognitive value for quantifying the score of the evaluation criterion, while the maximum value represents the expert’s optimistic cognitive value. A higher score indicates a higher importance of the criterion.
Step 2: Collect the experts’ conservative and optimistic cognitive values for each evaluation criterion i and eliminate extreme values outside two standard deviations. Calculate the minimum, geometric mean, and maximum values for the remaining conservative and optimistic cognitive values within the set of criteria.
Step 3: Determine the conservative triangular fuzzy number and optimistic triangular fuzzy number for each evaluation criterion i.
Step 4: Calculate the gray zone test value to assess whether the experts have reached a consensus on the evaluation criterion. The determination principle of the gray zone is shown in Figure 4. A positive value indicates that the expert opinions tend to be consistent and the evaluation criterion has converged. Conversely, further expert surveys are required if the experts fail to reach a consensus and the evaluation criterion does not converge. The results of the current questionnaire survey are provided to the experts as a reference until a consensus is reached and convergence is achieved for all criteria.
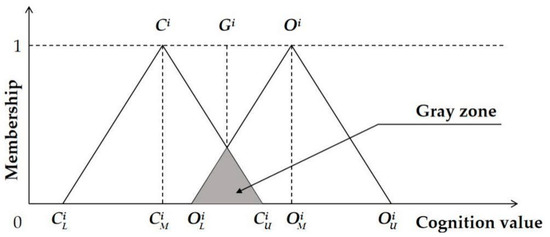
Figure 4.
Schematic diagram of double triangular fuzzy numbers (source: adapted from [46]).
Step 5: Calculate the experts’ consensus value and eliminate criteria with insufficient importance by setting a threshold value s. The threshold value can be determined based on expert opinions or relevant literature. Alternatively, the minimum, maximum, and single-value geometric mean of all evaluation criteria under consideration can be calculated again to obtain a new geometric mean, which is used to filter out an appropriate number of evaluation criteria considered important by the experts.
3.2.2. DEMATEL
The DEMATEL method observes the degree of mutual influence between pairwise risk factors affecting the sustainability of the supply chain. Using matrices and related mathematical theories, it calculates the structural relationships and influence strengths between factors, establishing a systematic structural model among them.
A Likert five-point scale (1 to 5) is selected to analyze the presence and strength of the direct relationships between the influencing factors. The evaluation scale and corresponding definitions are shown in Table 1.

Table 1.
Correlation evaluation scale (source: authors).
Data from the questionnaires were organized to construct the direct influence matrix .
In Equation (1), represents the row and column and denotes the degree of influence of factor i on factor j. After normalization, the elements of the direct influence matrix A will have values ranging between 0 and 1:
In Equation (2), represents the normalized direct influence matrix.
Construct the comprehensive influence matrix T, where denotes the identity matrix.
Calculate the influence degree D and the influenced degree R of each influencing factor.
In Equations (4) and (5), D represents the value of influence degree for influencing factor i and R represents the value of influenced degree for influencing factor j.
Calculate the causality degree for each influencing factor. If the causality degree of factor i is greater than 0, it is considered a causal factor affecting the sustainability of the supply chain. If the causality degree of factor i is less than 0, it is considered a resultant factor influenced by other factors. Resultant factors are the outcomes influenced by causal factors.
Calculate the centrality degree for each influencing factor. The centrality degrees are arranged in descending order, and higher values indicate a greater impact of the influencing factor on the sustainability of the supply chain.
The centrality degrees obtained from DEMATEL capture the network influence and prominence of each SSCR within the risk factor system. These values, as will be integrated later (Section 3.2.4), complement the strategic importance weights derived from AHP to provide a more comprehensive risk assessment for the first HoQ.
3.2.3. AHP
The basic idea of AHP is to identify the key risk factors that affect the sustainability of the supply chain and group these factors to form an ordered hierarchical structure. By pairwise comparisons, the relative importance of each influencing factor within the hierarchy is determined. Finally, the importance of the factors is assessed based on their weights.
The steps are as follows.
After averaging the collected questionnaire data, arrange them according to Equation (6) to form a pairwise comparison matrix .
In Equation (6), represents the importance of factor i relative to factor j. It is typically represented using a scale of 1 to 9 and possesses the following properties.
Multiply matrix by rows, then calculate it with the n-th root.
Equation (8) represents the unnormalized weight value of criterion i, which corresponds to the product of elements in each row of matrix . Normalize the vector by:
Equation (9) represents the weight value of criterion i, which is the sum of all elements in the vector. Obtain the weight vector and perform a consistency check: when matrix is consistent, the components of the weight vector represent the weights of the secondary criteria in the key risk factor system for a sustainable supply chain. If the consistency is not met, further adjustments to the matrix are required until consistency is achieved.
The weight values derived from AHP represent the strategic importance of each SSCR based on pairwise comparisons. However, to capture both strategic importance and network dynamics within the risk system, these weights will be combined with the DEMATEL centrality scores in the next step.
3.2.4. Calculation of Comprehensive Weight
Using AHP alone may ignore the dynamic interactions among risks, while using DEMATEL alone may overestimate those active in the network but have low actual strategic importance, or underestimate isolated but critical risks. Therefore, multiplying the centrality of DEMATEL with the weight of AHP to get the comprehensive weight (see Equation (10)) can capture the complementary dimensions of network influence and strategic importance of risks at the same time, identify those key risks that are at the core of causality and have high impact on sustainable goals, and provide a more robust risk priority ranking for subsequent analysis, which is more in line with the characteristics of complex systems.
3.3. Fuzzy VIKOR
The fuzzy VIKOR method is utilized to establish the linkages within the HoQ. This method is particularly suited for handling the fuzzy evaluation data collected from experts regarding the correlations between different factors. The trapezoidal fuzzy numbers are divided into seven levels, and their linguistic variables with corresponding crisp numbers and fuzzy numbers are shown in Table 2. The invited experts are requested to score each element in the questionnaire based on crisp numbers.
Table 2.
Linguistic variables and fuzzy numbers (source: authors).
A, B, and C represent SSCR, leanness philosophy, and I5.0 enabler, respectively. After organizing the questionnaire data into a matrix, the matrix categories are shown in Table 3.
Table 3.
Matrix category (source: authors).
Take the calculation process of the A&B decision matrix of the first quality house as an example. After collecting the questionnaire data from 8 experts, the matrices ①–③ for each expert are continuously multiplied, resulting in 8 matrices of size 12 × 16. To handle the different results obtained from the survey questionnaire, it is not sufficient to rely solely on the perspective of a single expert. These results need to be aggregated in a certain way to obtain the decision matrix, which enables further analysis and calculations. After converting the 8 precise number matrices of size 12 × 16 into fuzzy numbers as per Table 3, this study employs Equation (11) to aggregate the different results.
Determine the normalized decision matrix using Equations (12) and (13). For the benefit-based indicators:
For the cost-based indicators:
where, and represent the minimum and maximum values of the left and right boundaries, respectively, of the trapezoidal fuzzy number for attribute j.
Determine the best and worst values using Equations (14) and (15).
Determine and using Equations (16) and (17).
where represents the weighted sum of the relative optimal values of various measurement indicators for the i-th decision object and represents the comprehensive score of the relative worst values of the measurement indicators for the i-th decision object.
The optimal decision determined by can only be considered the optimal choice under the following two conditions.
Condition 1: , where m represents the number of alternative options, denotes the potential optimal choice, and signifies the potential suboptimal choice.
Condition 2: is also the foremost option in either sequence or sequence .
4. Case Study
4.1. Key Factors
Having established the analytical framework in Section 3, this section applies it to a real-world case study involving the new energy battery industry. Industry experts helped incorporate three highly relevant factors into the FDM questionnaire. Following a rigorous evaluation of professional business capabilities, the authors invited eight key technical personnel from enterprises to complete the survey. Given the novelty of I5.0, the authors patiently explained the questionnaire content to the respondents. After collecting the questionnaires, calculations were performed according to steps 1 to 5. The values for SSCRs and leanness philosophies were 6.68 and 5.97, respectively. The values for the four facets of I5.0 enablers were 6.52, 6.01, 6.33, and 7.25. Consequently, this identified 12 significant SSCRs, 16 leanness philosophies, and 20 I5.0 enablers, as shown in Table 4, Table 5 and Table 6.
Table 4.
Key factors of SSCRs (source: authors).
Table 5.
Key factors of leanness philosophy (source: authors).
Table 6.
Key enablers of I5.0 (source: authors).
4.2. The First HoQ
4.2.1. Composite Weight of Risks
Calculating the final risk weight is critical to link SSCRs within HoQ1 to the leanness concept. This value will be the weighted value of the first HoQ’s fuzzy VIKOR method. Before obtaining the final risk weight, it is necessary to calculate the DEMATEL centrality and AHP weights for SSCRs separately.
First, divide the SSCR factors, as shown in Table 7, into four second-level indicators from the initial twelve third-level indicators.
Table 7.
The hierarchical division of risk factors (source: authors).
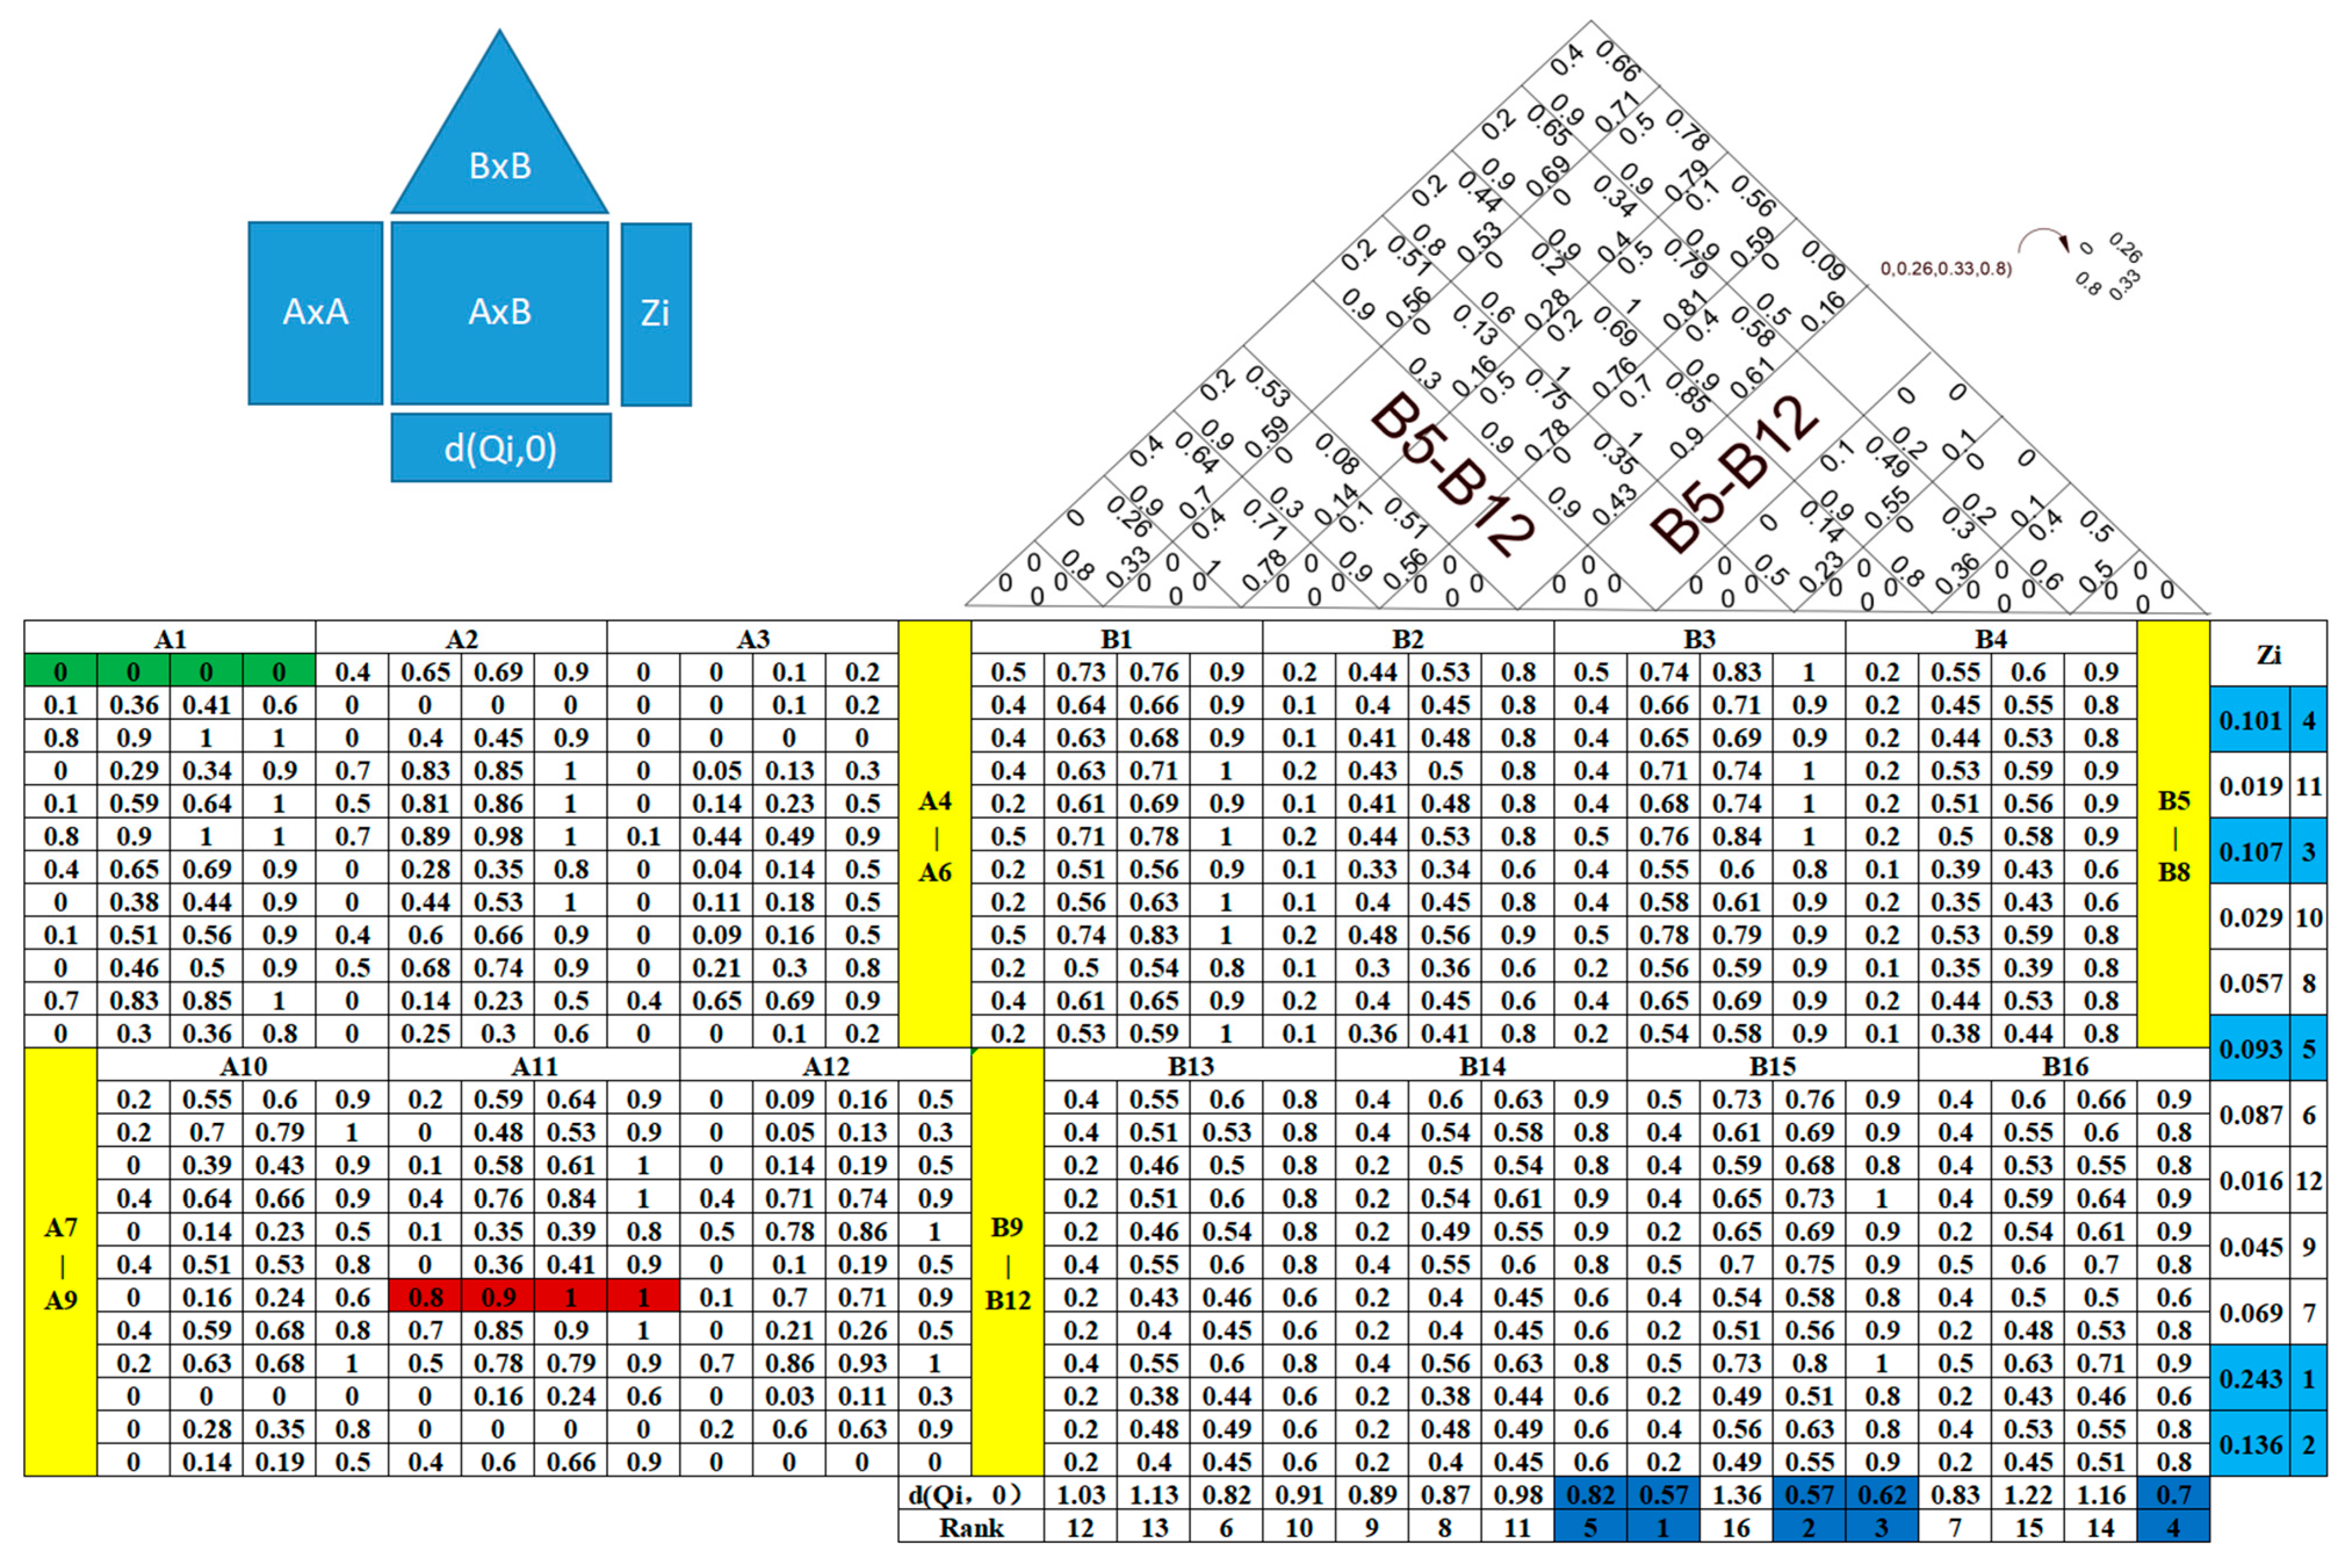
Based on the 12 identified SSCRs, design dual DEMATEL and AHP questionnaires. After being filled out by eight experts, collect the questionnaires for data analysis. First, calculate the numerical average of the two questionnaires. Then, calculate the DEMATEL centrality and AHP weights separately using Equations (1)–(5) and (6)–(9). Finally, calculate the composite weight based on Formula (10). DEMATEL centrality , AHP weights , and composite weights are shown in Table 8. In Section 4.2, this paper will focus on a detailed analysis of the top five risk factors based on the composite weights, which are A11, A12, A3, A1, and A6.
Table 8.
Weight values and rankings (source: authors).
4.2.2. Order of Leanness Philosophies
With the composite risk weights determined (as shown in Table 8), the next step involves establishing the relationship between these prioritized SSCRs and the leanness philosophies using the fuzzy VIKOR method. A fuzzy VIKOR questionnaire was designed and distributed with 12 SSCRs and 16 leanness philosophies. Following Equations (11)–(17), the values of and were calculated (Table 9).
Table 9.
The values of and for leanness philosophies (source: authors).
Take and then calculate the weight values for leanness philosophies based on Equation (18). This marks the end of the analysis process for the first quality house and the beginning of the connection between leanness philosophies and I5.0 improvement measures in the second quality house. The weight values for leanness philosophies will serve as the weighted values for HoQ2, the values in Equations (16) and (17). The weight values for leanness philosophies are shown in Table 10.
Table 10.
The values of for leanness philosophies (source: authors).
The final step is the decision-making process for the 16 leanness philosophies. First, calculate the values for each philosophy based on Equation (18), then sort the values in ascending order. The results are shown in Table 11.
Table 11.
The values of and their ranks for leanness philosophies (source: authors).
From this, it can be seen that the top three leanness philosophies are B11, B9, and B12. After verifying both conditions in Equation (18), these three leanness philosophies have all been validated.
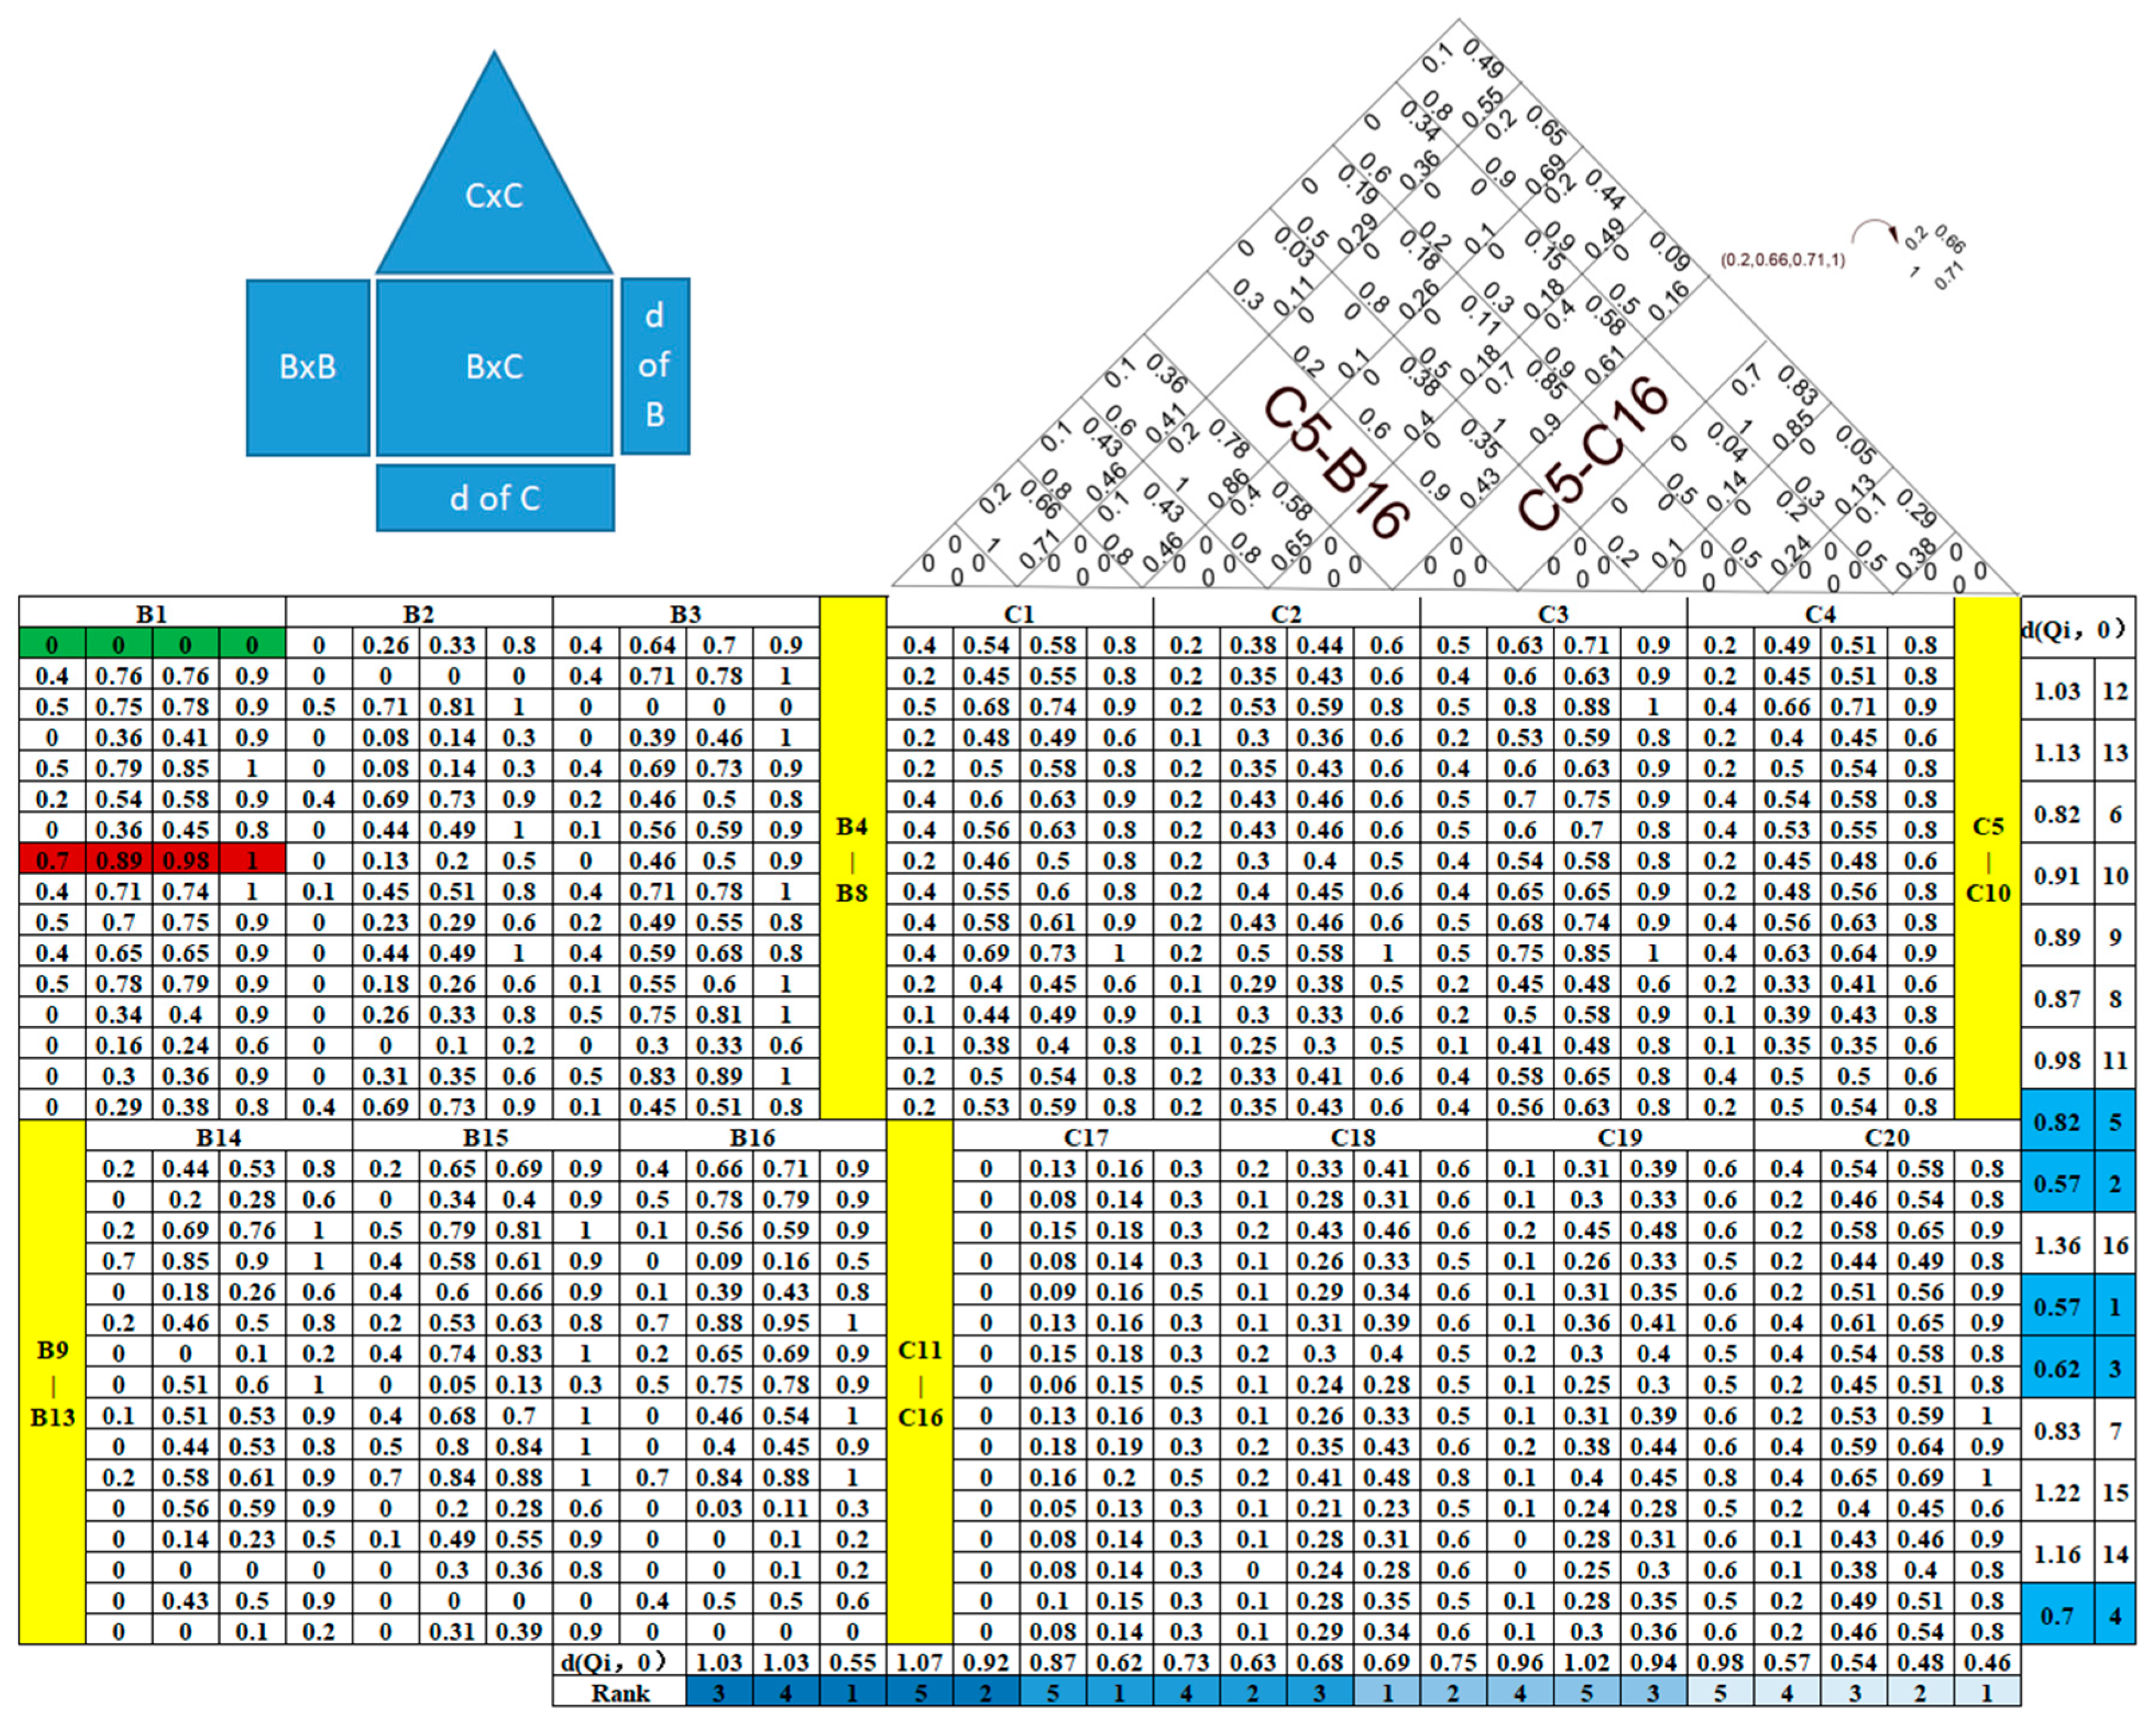
The key feature of a data house is its ability to reflect the interrelationships and the degree of mutual influence among various factors. On the other hand, it visually represents the importance of factors within the same category. The data house for HoQ1 is depicted in Figure 5. The green section represents the smallest numerical value in the data house, signifying that A1 has no impact on A1. In contrast, the red section indicates the highest degree of influence, where A7 has the greatest effect on A11. The blue section is divided into two parts, with the right side showing the composite risk weight values. According to the ascending-order principle, higher values are more significant. Thus, the top five critical risks are low employee competence (A11), lack of understanding of client needs (A12), equipment failure (A3), product safety and quality (A1), and supplier-induced risks (A6). Below are the weight values and ranking for leanness philosophies. According to the descending-order principle, smaller values are more important. The top five key leanness philosophies are drawing a supply chain value stream (B9), establishing a quality improvement team (B11), evaluating the proximity of each supplier (B12), providing after-sales service for clients (B16), and using a third-party logistics transportation system (B8).

Figure 5.
The first HoQ (source: authors).
4.3. The Second HoQ
The analysis process for HoQ2 is nearly identical to that of HoQ1, starting from the design and distribution of a fuzzy VIKOR method questionnaire containing 16 leanness philosophies and 20 I5.0 enablers, all the way to the final ranking of values. The data house for the second quality house is shown in Figure 6.
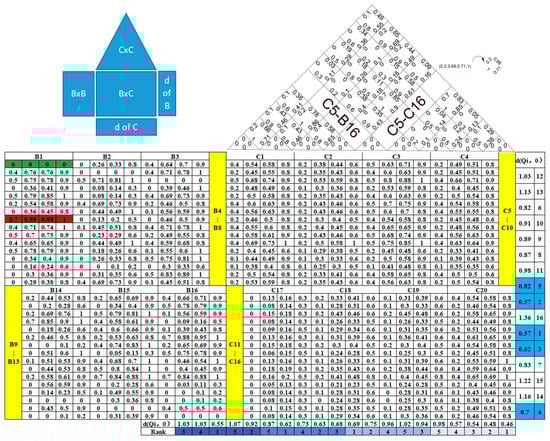
Figure 6.
The second HoQ (source: authors).
In Figure 6, the lower blue section displays the weight values of and their rankings of the I5.0 enablers, categorized into four dimensions: human-centric, sustainable, resilient, and technological and policy. The top two enablers in each dimension are considered key enablers. Human-centric: embracing and trusting technology (C3), prioritizing employee safety and management training (C5). Sustainable: Focusing on customers and value creation (C7), providing personalized products and services (C9). Resilient: improving work efficiency (C11) and implementing new operational management models (C12). Technological and policy: leadership and support from senior management (C20) and information sharing among supply chain members (C19).
5. Discussion
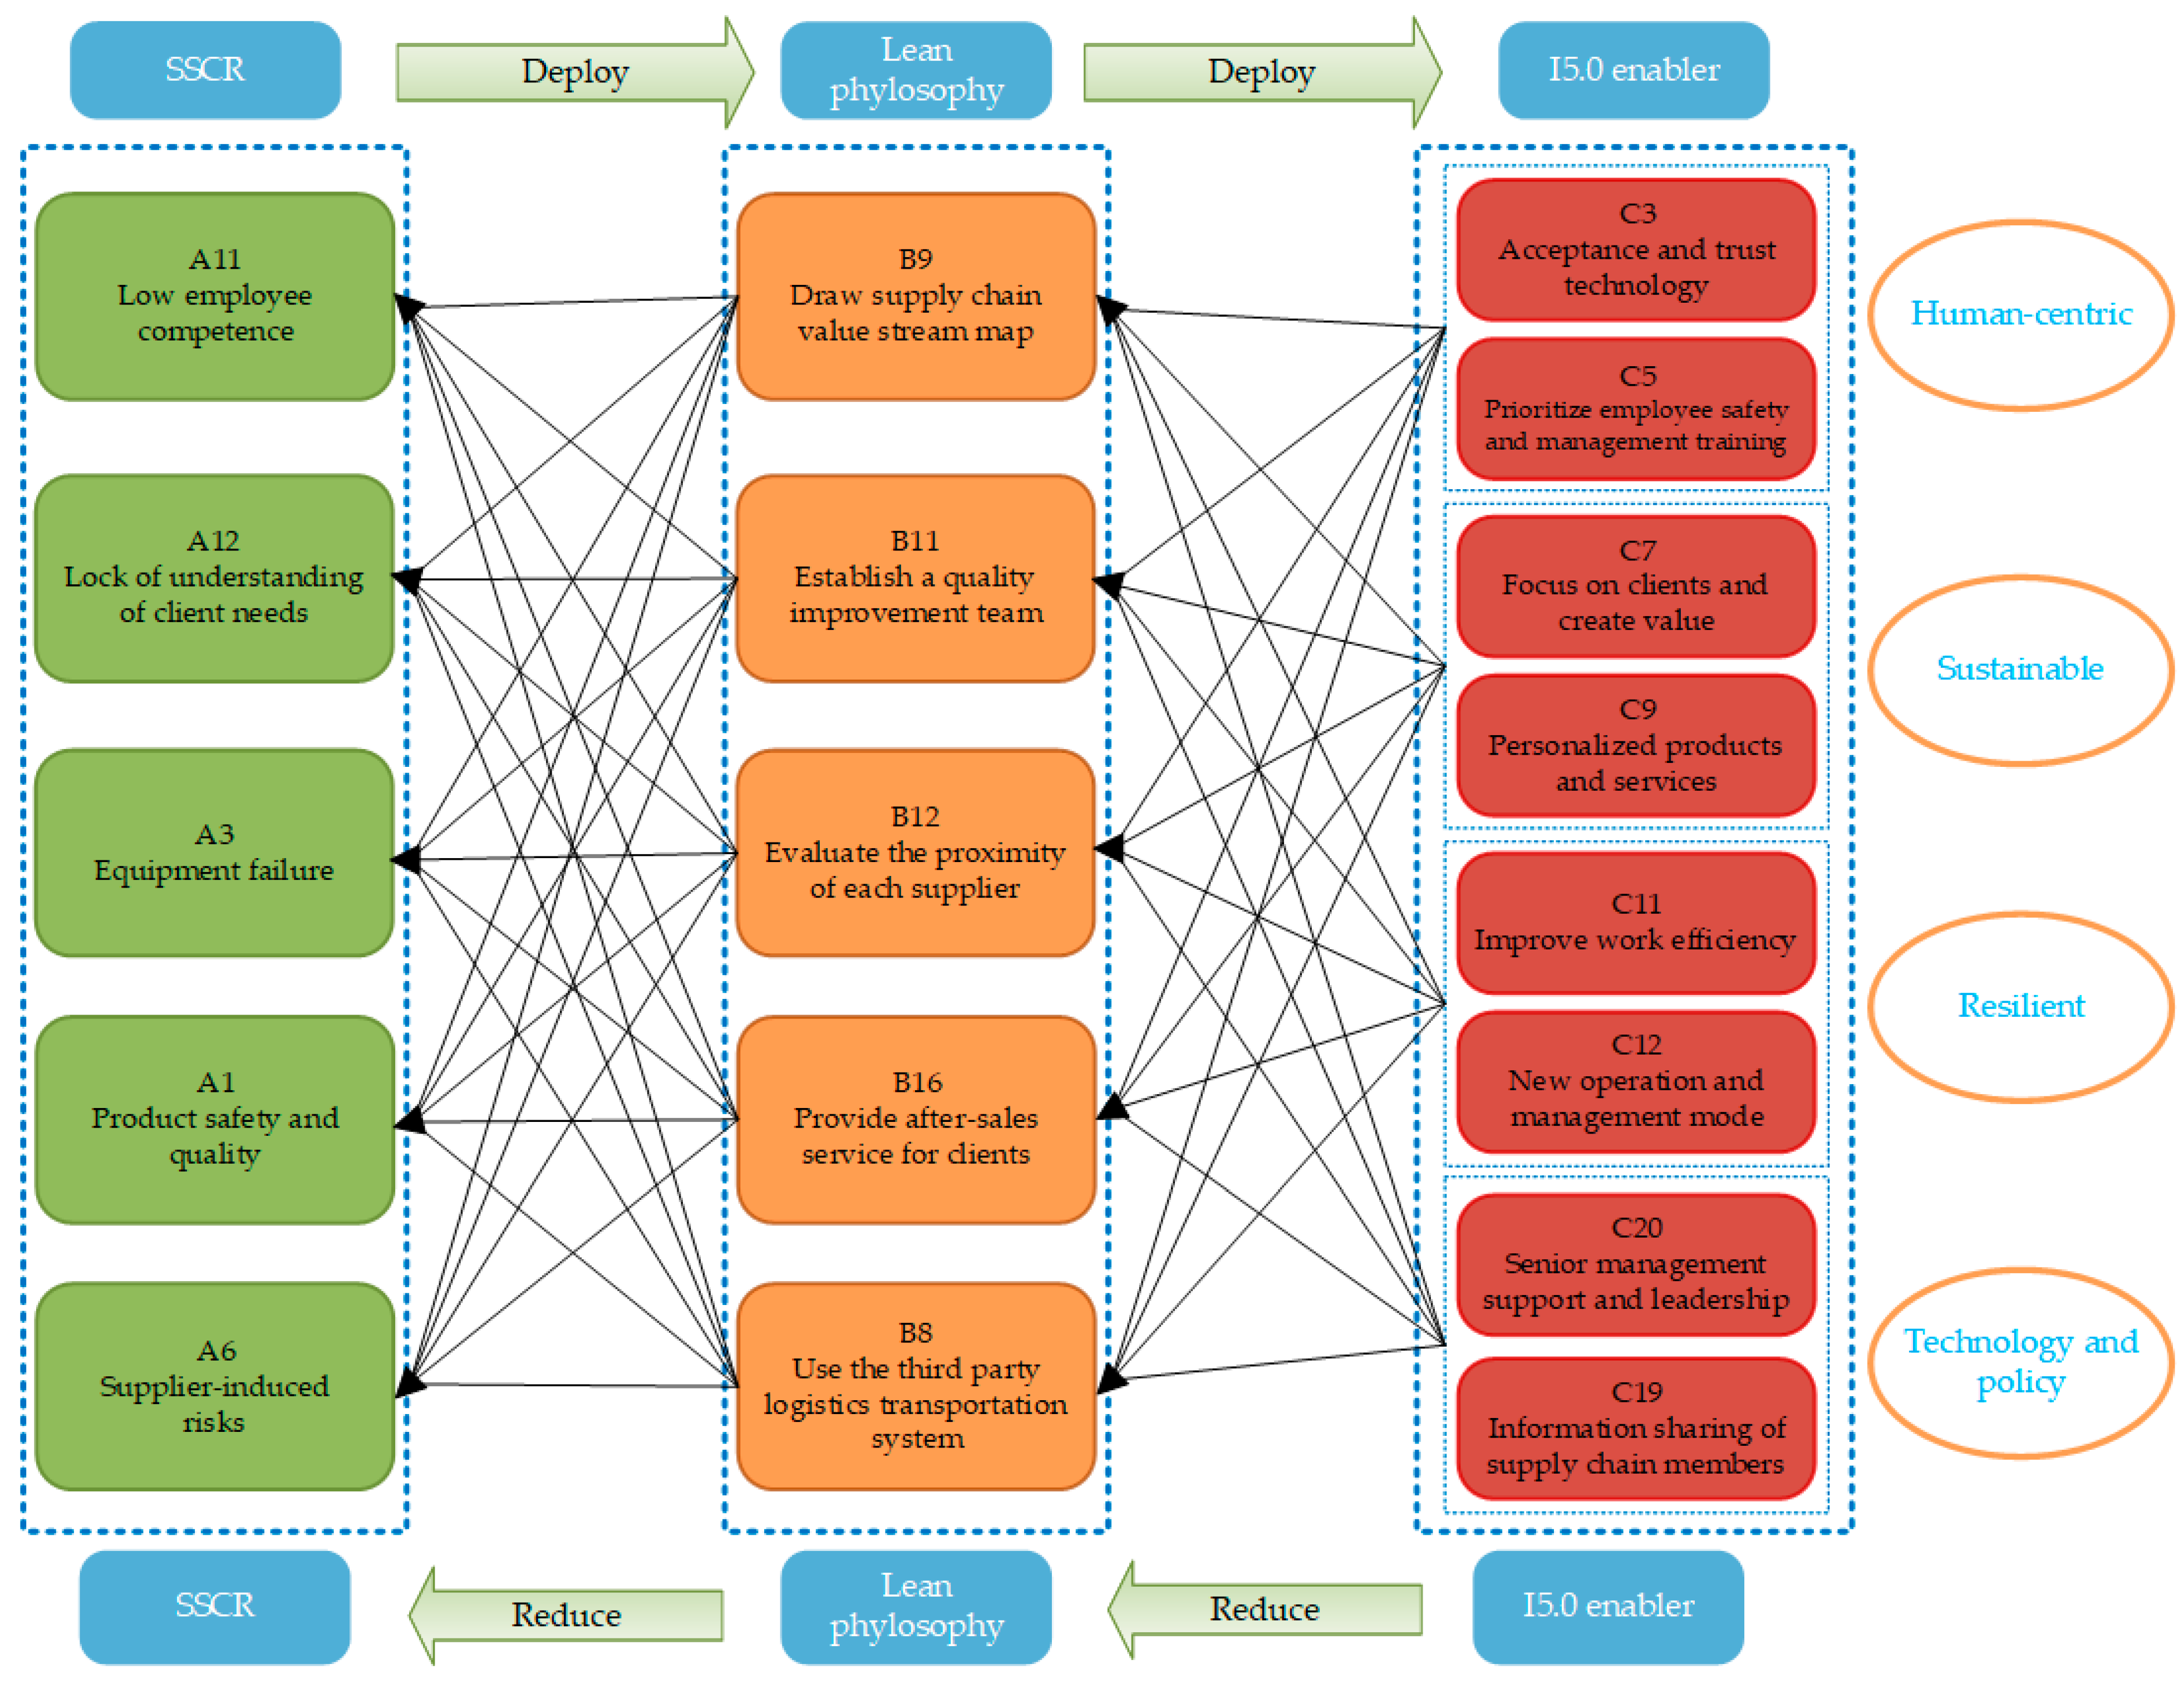
As shown in Figure 7, from left to right, this research progressively deployed the HoQs through the analytical process outlined in Section 3 to identify key factors. These key factors are also ranked in importance from top to bottom. From right to left, the eight critical I5.0 enablers enhance the impact of the top five key leanness philosophies, making it more effective in reducing the first set of five SSCRs that the enterprise needs to address promptly.
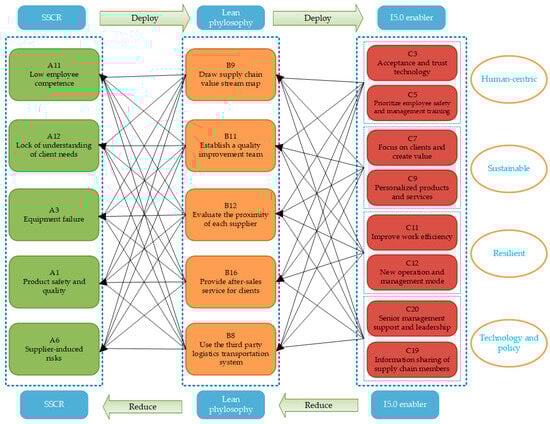
Figure 7.
Solutions to reduce SSCRs (source: authors).
Due to limited resources within an enterprise, simultaneously enhancing all leanness philosophies simultaneously is challenging. To effectively address SSCRs, business managers should prioritize the leanness philosophies and gradually allocate resources to maximize operational efficiency. The Pareto effect can be applied in this context to achieve greater expected results using a few critical factors when resources are constrained. Therefore, we applied the Pareto effect to the framework of this study. With the results of the two HoQ analyses as references, we discuss the rankings of the importance of these three categories of variables. The goal is to use I5.0 key enablers to enhance leanness philosophies and reduce SSCRs for new energy battery companies, as shown in Figure 7. If all key leanness philosophies are improved, this can significantly enhance the enterprise’s ability to withstand SSCRs.
5.1. The First HoQ
5.1.1. Key SSCRs
As indicated in Table 8, the top five SSCRs are low employee competence (A11), lack of understanding of client needs (A12), equipment failures (A3), product safety and quality (A1), and supplier-induced risks (A6). These five risks also reflect that they are the main causes of various issues in the case company. Through the analysis in Table 8, it is evident that low employee competence (A11), equipment failures (A3), and supplier-induced risks (A6) are causal factors. Low employee competence (A11) is acute in China’s new energy battery industry due to a severe shortage of skilled talent. This skills gap, stemming from low business proficiency among existing staff, is estimated to involve millions of missing professionals. Equipment failures (A3) represent a common and critical supply chain risk in this sector. The severity is underscored by incidents such as explosions at two subsidiaries of CATL, the world’s largest battery manufacturer, occurring within a fortnight in January 2021 due to equipment malfunctions. Supplier-induced risks (A6), concerning delays or quality issues in raw material supply, directly impact manufacturers. Consequences include disruptions in product supply and increased defect rates. Furthermore, the reliance on suppliers is set against a backdrop of projected massive industry growth (sales exceeding USD 168 billion by 2030, global data) and looming supply shortages anticipated from 2025 onwards, amplifying this risk for Chinese battery companies. The two most crucial elements in manufacturing are human and machine. If employee capabilities do not improve and equipment issues remain unresolved, these will become the most significant obstacles to the sustainable development of the supply chain. Suppliers provide raw materials, and when risks such as delayed material supply or subpar material quality occur, it can lead to problems for manufacturers, including product supply disruptions and an increase in defective products.
Lack of understanding of client needs (A12) and product safety and quality (A1) are resultant factors. According to forecasts by GGII, a leading Chinese lithium battery research firm, global demand for new energy vehicle power batteries will reach 1165 GWh by 2025. Understanding customer needs is crucial for a company’s development. Furthermore, in China, as of 2023, there had been 640 instances of electric vehicle spontaneous combustion. Ensuring battery safety and quality is about avoiding personal and property losses and developing electric vehicles and new energy batteries. Companies can view this as an expected goal to achieve supply chain sustainability, which means meeting customer needs and ensuring product safety and quality to propagate sustainability throughout the supply chain. It is essential to control causal risk factors to transform resultant risks into positive influences that benefit the company.
5.1.2. Key Leanness Philosophies
Having identified the top five critical SSCRs that demand urgent attention (A11, A12, A3, A1, A6), the subsequent analysis pinpointed five key leanness philosophies (B9, B11, B12, B16, B8) that are most effective in mitigating these risks. This study identified five key leanness principles: draw a supply chain value stream map (B9), establish quality improvement teams (B11), evaluate the proximity of each supplier (B12), provide after-sales services to clients (B16), and use third-party logistics transportation systems (B8). Companies should prioritize these five key leanness philosophies, as their positive application can significantly impact the sustainable development of the supply chain.
Draw the supply chain value stream map (B9). A value stream map can analyze the entire product manufacturing process, from raw materials to finished products reaching the consumer, as well as the design process from concept to launch, including all value-adding and non-value-adding activities within the system. This gives leaders a comprehensive view of the relationships between departments and processes in the supply chain, helping them plan production and demand effectively and reduce issues caused by single suppliers (A2) and supplier-induced risks (A6). It also aids in analyzing numerical changes in the supply chain, visually highlighting areas with value addition and non-value addition, facilitating quick and advantageous decision-making.
Establish a quality improvement team (B11). Battery service life is influenced by manufacturing and operational conditions, with numerous parameters affecting battery health [47]. Hence, it is essential for companies to establish quality improvement teams to ensure battery quality. This is the first step in guaranteeing product safety and quality (A1) and satisfying client quality demands (A12). These teams can set reasonable quality requirements and action plans through discussions among core technical experts. Meeting customer requirements and achieving the right product quality level is key to a company’s actions [48].
Evaluate the proximity of each supplier (B12). When companies are dealing with various potential suppliers, factors such as raw material quality, price, economics, support, and services are commonly used as evaluation criteria. As the scale of the electric vehicle market continues to grow, the market demand for new energy batteries is increasing. Companies should compare the similarities and differences among various suppliers to choose suitable partners, avoiding issues caused by a single supplier (A2) and ensuring diversity in material supply and product variety. In fact, more and more companies are adopting sustainable development strategies. Selecting the right suppliers based on sustainability criteria (economic, environmental, and social) can help companies move toward sustainable development [49].
Provide after-sales service for clients (B16). After-sales service work is a continuation of quality management in the usage phase and an essential guarantee for realizing the value of a product. It serves as a remedy to achieve the value of product use, offering a safety net for consumers. Furthermore, in after-sales service, customer feedback on product opinions and demands can be provided to companies promptly, driving companies to continuously enhance product quality and better meet client needs (A12). Research by Kurata and Nam [50] showed that among various factors affecting customer satisfaction, after-sales service was a clear predictor of customer satisfaction and retention rates. Compared to the number of electric vehicle companies, there are few new energy battery companies with a significant scale. Therefore, while expanding production capacity, it is necessary to provide high-quality after-sales service.
Use the third-party logistics transportation system (B8). Third-party logistics warehousing management refers to modern logistics companies providing storage and distribution logistics services, creating a connection with clients through close contact via computer information management systems to achieve dynamic management and control of the quality and information of goods storage and distribution throughout the entire process. Companies that produce or use hazardous materials usually cannot provide complete transportation services since they require specific and varying capabilities that must be used for complete transport services. This is why they often turn to 3PL services [51]. New energy batteries are also categorized as hazardous materials, making it necessary to consider the use of third-party logistics transportation systems. At the same time, relying on the fast transport capability of third-party logistics systems can reduce risks associated with limited supply capabilities (A4) and limited warehouse space (A10). The five key leanness philosophies discussed above represent the primary levers identified through HoQ1 for addressing critical SSCRs. To further enhance the effectiveness of these lean practices, HoQ2 linked them to I5.0 enablers, identifying eight key enablers categorized into four dimensions.
5.2. The Second HoQ
5.2.1. Dimension 1 (Human-Centric)
Acceptance and trust in technology (C3). Every industrial revolution brings forth new technologies, which undoubtedly inject new energy into productivity. For instance, IoT sensors and blockchain technology enable real-time data collection across all supply chain segments, automatically generating dynamic value stream maps (B9). The immutable nature of blockchain significantly enhances cross-departmental collaboration efficiency [52]. For instance, real-time synchronization of electrode coating process data in battery production allows for precise bottleneck identification. AI-driven quality improvement teams (B11) can rapidly pinpoint root causes of anomalies, such as cathode material impurity issues, by analyzing real-time production line data. At the same time, AR-enabled remote collaboration tools facilitate instant fault data sharing between suppliers and customers, dramatically reducing root cause analysis cycles. For customer service, AI-powered predictive maintenance proactively identifies potential failures based on battery usage data coupled with blockchain-enabled transparent production batch tracing, effectively strengthening customer trust in after-sales services (B16) [53,54]. According to Bencsik et al. [55], technology drives business success, and employee attitudes and trust are paramount in this transformation. However, each new technology is unfamiliar to employees initially, and companies and employees need to establish trust in the new technology gradually. Conversely, if companies or employees reject new technology, they may miss opportunities to profit from it.
Prioritizing employee safety and management training (C5). As noted by Han et al. [56], because perception has a direct impact on human behavior, years of on-site experience does not prevent employees from unsafe behavior. New energy batteries are classified as hazardous chemicals, and battery production workshops are highly automated with a large workforce and complex processes. Employees have low safety awareness, which can result in catastrophic consequences for themselves and negatively impact a company’s social responsibility, along with economic losses. Therefore, prioritizing employee safety and management training is necessary, and this can also drive the establishment of a development training department (B2). Through VR simulations of thermal runaway scenarios, employees systematically learn the correlation between safety risks and quality defects (B11)—such as how electrolyte leakage affects encapsulation processes—while collaborative robots take over high-risk operations, allowing human workers to focus on design optimization [38,57].
5.2.2. Dimension 2 (Sustainable)
Client-centric approach and value creation (C7). Being customer-centric and creating value means understanding customer needs, meeting those needs, and exceeding them. According to Ensslen et al. [58], integrating products and services in electric vehicles into one system provides consumers with functionality that meets their needs while reducing environmental impact. New energy batteries, the providers of electric vehicle power, producers should consider the vision of the electric vehicle industry when addressing the needs of new energy battery customers. This approach allows the products of new energy battery companies to satisfy both downstream automobile manufacturers and a broad customer base of new energy vehicle users. Agreements reached between electric vehicle manufacturers and new energy battery manufacturers to jointly determine requirements are beneficial for cost negotiations with suppliers (B14) and cost savings (B4). This approach also enables continuous assessment of client feedback (B6), reducing risks related to suppliers (A6) and a lack of understanding of client needs (A12).
Personalized products and services (C9). Personalized products are designed and manufactured to meet the specific needs of individual customers, encompassing functional requirements to aesthetics [39]. Value-added services, including personalized services from clearly defined retailers based on consumer preferences, align with consumer buying histories [59]. Since the positioning of electric vehicles varies in the market, new energy battery companies need to offer multiple battery products and corresponding services for electric vehicle companies. This approach also helps integrate the overall strategy (B3) and advance value engineering (B7).
5.2.3. Dimension 3 (Resilient)
Improve work efficiency (C11). C11 significantly enhances lean practice effectiveness through synergy with Industry 5.0 technologies. For quality improvement teams (B11), C11 eliminates redundant operations, freeing up human resources to focus on critical issues such as battery safety while improving problem-solving efficiency through data analytics. Its high-speed data processing capability also empowers supplier proximity evaluation (B12), enabling multidimensional assessments of geographic location and delivery performance to mitigate logistics delays. Additionally, C11 enhances after-sales service systems (B16) by deploying AI-driven rapid response mechanisms for customer feedback, while real-time shipment tracking strengthens third-party logistics (B8) coordination, significantly reducing transportation disruptions [60].
New operational management models (C12). C12 aligns closely with the core objectives of leanness principles, significantly enhancing lean practices through digital means. At the strategic level (B3), C12 serves as a strategic execution tool, integrating cross-departmental metrics via a data platform to ensure operational activities consistently align with leanness goals of cost reduction and efficiency improvement. In internal operations optimization, C12 leverages AI-driven dynamic scheduling (B1) and IoT-based automated data collection (B9) to refine production planning and logistics coordination, precisely identifying and eliminating value stream bottlenecks to ensure on-time delivery and minimize waste [61]. Additionally, it embeds training systems into workflows (B2) and utilizes AR/VR (B11) for remote quality collaboration, advancing skill development and proactive quality control. In external collaboration, C12 establishes transparent supplier coordination platforms (B4, B14), enabling real-time demand and cost data sharing to mitigate the bullwhip effect and support cost negotiations [62].
5.2.4. Dimension 4 (Technological and Policy)
Support and leadership from senior management (C20). Support and leadership from senior management are vital for a company’s development. Senior management’s support represents a key dynamic capability, as they must identify changes in the competitive environment, which is becoming increasingly technological [63]. Successful companies rely on unwavering support and effective leadership from senior management. Liu et al. [64] conducted a case study of BIM companies and found that senior management plays a critical role in making decisions to improve workflows, define goals, and determine the responsibilities of all relevant personnel for effective strategy implementation. Senior management support must establish leadership throughout the entire BIM implementation process, monitoring and coordinating all activities of project teams to prevent errors and misunderstandings. Support and leadership from senior management are critical for implementing strategies effectively, impacting the establishment of a development training department (B2), integration of overall strategy (B3), development of decision support systems (B5), and establishment of internal quality systems (B10).
Share information among supply chain members (C19). Information sharing refers to supply chain members sharing information such as product specifications, product status, ownership, data location, and even environmental impact [65]. Information sharing between supply chain members enables timely responses to each other’s supply situations and facilitates the sharing of market demand changes, allowing for quick adaptations. Information sharing positively and significantly affects supply chain visibility, collaboration, agility, and performance [66]. This transparency directly supports multiple lean practices: sharing demand and inventory data with suppliers can significantly optimize procurement strategies and production planning, thereby reducing costs (B4); real-time logistics data sharing enhances transportation efficiency and supports just-in-time delivery; and comprehensive and accurate information forms the foundation for mapping end-to-end supply chain value streams (B9), helping identify and eliminate non-value-added activities. In addition, transparent cost data provide a basis for fact-based and fair trust-driven negotiations, enabling joint efforts to develop cost optimization solutions (B14).
Industrial 5.0 improvement measures enhance the positive impact of leanness philosophies on SSCRs, efficiently reducing these risks. New energy battery companies should initially focus on these eight I5.0 key enablers and five key leanness philosophies to reduce the five critical SSCRs. Once the risks are mitigated and the company’s performance improves, resources can be allocated to gradually implement the other important I5.0 enablers and leanness philosophies when resources are sufficient to comprehensively reduce SSCRs and promote sustainable supply chain development.
6. Conclusions
In today’s world, the use of clean energy sources is gaining increasing attention for sustainable development. As a result, new energy batteries hold significant potential for development. To adapt to changes in the external environment and intense industry competition, manufacturers of new energy batteries must recognize the importance of reducing the sustainability risks in their supply chains. This study, conducted with a representative new energy battery manufacturing enterprise in China, proposes a novel four-phase mixed MCDM analysis model based on FDM, DEMATEL, AHP, and fuzzy VIKOR. This model integrates sustainability risk factors, leanness philosophies, and I5.0 enablers using two HoQs. It identifies key sustainability risk factors, leanness philosophies, and I5.0 enablers within the supply chain of new energy battery manufacturing enterprises, provided decision support for enhancing supply chain management capabilities.
For practitioners, a systematic intervention strategy should be adopted to address consequential risks. These risks are fundamentally derivative effects of causal risks originating upstream in the supply chain, necessitating a focus on root-cause governance in the course of action. The core of the practical approach lies in “reverse tracing and collaborative intervention,” where companies should first resolve causal risks identified through DEMATEL analysis and leverage Industry 5.0 enablers to strengthen lean measures, thereby disrupting the risk transmission chain. For instance, deploying “technological trust (C3)” and “employee safety training (C5)” enhances workforce competency, directly tackling the root cause of A11 (low employee capability) and subsequently alleviating downstream risk A12 (inadequate customer needs understanding), as well-trained employees can accurately discern customer demands. During implementation, QFD is utilized to precisely quantify risk–mitigation measure relationships. Enterprises can prioritize key measures based on the fuzzy VIKOR output sequence and then reassess the risk network using DEMATEL tailored to their specific characteristics. This practical strategy enables firms to maximize risk reduction with limited resources.
7. Limitations and Future Research
This study focused on the new energy battery sector in emerging economies, thus presenting certain limitations. From an industry perspective, the “lean–I5.0–SSCR risk mitigation” framework proposed in this study possesses systemic characteristics, and the methods and conclusions also offer some reference value for clean energy fields such as solar and hydrogen. These industries similarly face challenges like rapid technological iteration, globalized supply chains, and stringent environmental regulations. When researching risk issues across different industries, risk lists should be constructed based on the specific risks pertinent to each sector. For example, the risk of raw material scarcity in solar panel manufacturing (e.g., polysilicon supply fluctuations) can correspond to the “single supplier” identified in the study. Safety control requirements in hydrogen storage and transportation can be mapped to “product safety and quality.”
Nevertheless, future research is necessary for cross-industry validation. Applying the hybrid MCDM framework to other new energy fields like solar and hydrogen to compare sustainable risks and the differentiated weighting of Industry 5.0 enablers under different technological pathways is meaningful. From the perspective of different cultural and regulatory environments, applying this framework to companies in North America or Europe requires adjusting the weights assigned to Industry 5.0 enablers according to regional differences. For instance, stricter labor regulations in North America necessitate increasing the weight of C5. Carbon border adjustment mechanisms in Europe and the US imply a higher priority for C10.
Finally, future research can conduct effectiveness tests, field tests, or benchmarking through contextualized parameter adaptation. Parameter perturbation tests can be performed to evaluate the ranking stability of key risk factors, leanness concepts, and Industry 5.0, enabling elements to quantify the model’s sensitivity to input changes. In addition, it is recommended that expert backtracking verification be implemented to compare the consistency between the model results and expert empirical judgment. Based on this, iteratively optimize the model parameters or relationship matrix. These verification steps will significantly enhance the robustness of the model and the credibility of actual decision support, thereby upgrading the “risk–lean–enabler” transfer mechanism of this study to a cross-domain decision support system.
Author Contributions
Conceptualization, C.-H.H.; methodology, C.-H.H., D.-X.Z. and S.-W.H.; software, Q.-H.W.; validation, D.-X.Z. and S.-W.H.; formal analysis, S.-W.H.; investigation, D.-X.Z.; resources, D.-X.Z.; data curation, D.-X.Z.; writing—original draft preparation, D.-X.Z.; writing—review and editing, D.-X.Z.; visualization, S.-W.H. and Q.-H.W.; supervision, C.-H.H. and D.-X.Z.; project administration, C.-H.H.; funding acquisition, C.-H.H. All authors have read and agreed to the published version of the manuscript.
Funding
This paper was supported by the Fujian Provincial Social Science Foundation of China (grant FJ2024T020).
Data Availability Statement
The original contributions presented in this study are included in the article. Further inquiries can be directed to the corresponding author.
Conflicts of Interest
The authors declare no conflicts of interest.
References
- Yang, X.; Guo, Y.; Liu, Q.; Zhang, D. Dynamic Co-evolution analysis of low-carbon technology innovation compound system of new energy enterprise based on the perspective of sustainable development. J. Clean. Prod. 2022, 349, 131330. [Google Scholar] [CrossRef]
- Mangla, S.K.; Luthra, S.; Jakhar, S.; Gandhi, S.; Muduli, K.; Kumar, A. A step to clean energy—Sustainability in energy system management in an emerging economy context. J. Clean. Prod. 2020, 242, 118462. [Google Scholar] [CrossRef]
- Kumar, P.; Singh, R.K.; Paul, J.; Sinha, O. Analyzing challenges for sustainable supply chain of electric vehicle batteries using a hybrid approach of Delphi and Best-Worst Method. Resour. Conserv. Recycl. 2021, 175, 105879. [Google Scholar] [CrossRef]
- Çiçek, H.; Turan, H. The Effects of Process Improvement on Sustainable Supply Chain Management Performance. Int. J. Ind. Eng. Theory Appl. Pract. 2023, 30, 4. [Google Scholar] [CrossRef]
- Abdel-Basset, M.; Mohamed, R. A novel plithogenic TOPSIS- CRITIC model for sustainable supply chain risk management. J. Clean. Prod. 2020, 247, 119586. [Google Scholar] [CrossRef]
- Kalantari, F.; Hosseininezhad, S.J. A Multi-objective Cross Entropy-based algorithm for sustainable global food supply chain with risk considerations: A case study. Comput. Ind. Eng. 2022, 164, 107766. [Google Scholar] [CrossRef]
- Riley, J.M.; Klein, R.; Miller, J.; Sridharan, V. How internal integration, information sharing, and training affect supply chain risk management capabilities. Int. J. Phys. Distrib. Logist. Manag. 2016, 46, 953–980. [Google Scholar] [CrossRef]
- Das, K. Integrating lean systems in the design of a sustainable supply chain model. Int. J. Prod. Econ. 2018, 198, 177–190. [Google Scholar] [CrossRef]
- Ahmed, W.; Huma, S. Impact of lean and agile strategies on supply chain risk management. Total Qual. Manag. Bus. Excell. 2021, 32, 33–56. [Google Scholar] [CrossRef]
- Cagnetti, C.; Gallo, T.; Silvestri, C.; Ruggieri, A. Lean production and Industry 4.0: Strategy/management or technique/implementation? A systematic literature review. Procedia Comput. Sci. 2021, 180, 404–413. [Google Scholar] [CrossRef]
- Xu, X.; Lu, Y.; Vogel-Heuser, B.; Wang, L. Industry 4.0 and Industry 5.0—Inception, conception and perception. J. Manuf. Syst. 2021, 61, 530–535. [Google Scholar] [CrossRef]
- Song, W.; Ming, X.; Liu, H.-C. Identifying critical risk factors of sustainable supply chain management: A rough strength-relation analysis method. J. Clean. Prod. 2017, 143, 100–115. [Google Scholar] [CrossRef]
- Rostamzadeh, R.; Ghorabaee, M.K.; Govindan, K.; Esmaeili, A.; Nobar, H.B.K. Evaluation of sustainable supply chain risk management using an integrated fuzzy TOPSIS- CRITIC approach. J. Clean. Prod. 2018, 175, 651–669. [Google Scholar] [CrossRef]
- Nazam, M.; Xu, J.; Tao, Z.; Ahmad, J.; Hashim, M. A fuzzy AHP-TOPSIS framework for the risk assessment of green supply chain implementation in the textile industry. Int. J. Supply Oper. Manag. 2015, 2, 548–568. [Google Scholar]
- Wieland, A.; Wallenburg, C.M. Dealing with supply chain risks: Linking risk management practices and strategies to performance. Int. J. Phys. Distrib. Logist. Manag. 2012, 42, 887–905. [Google Scholar] [CrossRef]
- Amin, F.U.; Dong, Q.-L.; Grzybowska, K.; Ahmed, Z.; Yan, B.-R. A Novel Fuzzy-Based VIKOR–CRITIC Soft Computing Method for Evaluation of Sustainable Supply Chain Risk Management. Sustainability 2022, 14, 2827. [Google Scholar] [CrossRef]
- Jackson, L.; Meinke, C.; Chandramohan, R. Challenges in the Battery Raw Materials Supply Chain: Achieving Decarbonisation from a Mineral Extraction Perspective. Min. Metall. Explor. 2024, 41, 2683–2692. [Google Scholar] [CrossRef]
- Miao, Y.; Liu, L.; Xu, K.; Li, J. High concentration from resources to market heightens risk for power lithium-ion battery supply chains globally. Environ. Sci. Pollut. Res. 2023, 30, 65558–65571. [Google Scholar] [CrossRef] [PubMed]
- Duffner, F.; Mauler, L.; Wentker, M.; Leker, J.; Winter, M. Large-scale automotive battery cell manufacturing: Analyzing strategic and operational effects on manufacturing costs. Int. J. Prod. Econ. 2021, 232, 107982. [Google Scholar] [CrossRef]
- Jamal, R.; Al Alam, M.A.; Sayeed, K.M.A.; Ahmed, S.A.; Haque, N.; Hossain, M.M.; Sujauddin, M. Patching sustainability loopholes within the lead-acid battery industry of Bangladesh: An environmental and occupational health risk perspective. Sustain. Prod. Consum. 2024, 48, 435–445. [Google Scholar] [CrossRef]
- Su, D.; Mei, Y.; Liu, T.; Amine, K. Global Regulations for Sustainable Battery Recycling: Challenges and Opportunities. Sustainability 2025, 17, 3045. [Google Scholar] [CrossRef]
- Shabana, R.; Sajid, Z.; Swamy, D.; Amin, M.T.; Khan, F. Why does the industry need battery safety management system (BSMS)? Process Saf. Environ. Prot. 2025, 197, 107029. [Google Scholar] [CrossRef]
- Hu, X.; Wang, C.; Lim, M.K.; Chen, W.Q.; Teng, L.; Wang, P.; Wang, H.; Zhang, C.; Yao, C.; Ghadimi, P. Critical systemic risk sources in global lithium-ion battery supply networks: Static and dynamic network perspectives. Renew. Sustain. Energy Rev. 2023, 173, 113083. [Google Scholar] [CrossRef]
- Chhimwal, M.; Agrawal, S.; Kumar, G. Sustainable supply chain risk mitigation: A mixed method approach. Int. J. Intell. Enterp. 2022, 9, 142. [Google Scholar] [CrossRef]
- Reinerth, D.; Busse, C.; Wagner, S.M. Using Country Sustainability Risk to Inform Sustainable Supply Chain Management: A Design Science Study. J. Bus. Logist. 2019, 40, 241–264. [Google Scholar] [CrossRef]
- Rahimi, M.; Ghezavati, V.; Asadi, F. A stochastic risk-averse sustainable supply chain network design problem with quantity discount considering multiple sources of uncertainty. Comput. Ind. Eng. 2019, 130, 430–449. [Google Scholar] [CrossRef]
- He, L.; Wu, Z.; Xiang, W.; Goh, M.; Xu, Z.; Song, W.; Ming, X.; Wu, X. A novel Kano-QFD-DEMATEL approach to optimise the risk resilience solution for sustainable supply chain. Int. J. Prod. Res. 2021, 59, 1714–1735. [Google Scholar] [CrossRef]
- Tavakoli Haji Abadi, Y.; Avakh Darestani, S. Evaluation of sustainable supply chain risk: Evidence from the Iranian food industry. J. Sci. Technol. Policy Manag. 2023, 14, 127–156. [Google Scholar] [CrossRef]
- Zhang, F.; Song, W. Sustainability risk assessment of blockchain adoption in sustainable supply chain: An integrated method. Comput. Ind. Eng. 2022, 171, 108378. [Google Scholar] [CrossRef]
- Jakhar, S.K.; Rathore, H.; Mangla, S.K. Is lean synergistic with sustainable supply chain? An empirical investigation from emerging economy. Resour. Conserv. Recycl. 2018, 139, 262–269. [Google Scholar] [CrossRef]
- Zhu, Q.; Shah, P.; Sarkis, J. Addition by subtraction: Integrating product deletion with lean and sustainable supply chain management. Int. J. Prod. Econ. 2018, 205, 201–214. [Google Scholar] [CrossRef]
- Huo, B.; Gu, M.; Wang, Z. Green or lean? A supply chain approach to sustainable performance. J. Clean. Prod. 2019, 216, 152–166. [Google Scholar] [CrossRef]
- Essaber, F.E.; Benmoussa, R.; De Guio, R.; Dubois, S. A Hybrid Supply Chain Risk Management Approach for Lean Green Performance Based on AHP, RCA and TRIZ: A Case Study. Sustainability 2021, 13, 8492. [Google Scholar] [CrossRef]
- Senthil, J.; Muthukannan, M. Development of lean construction supply chain risk management based on enhanced neural network. Mater. Today Proc. 2022, 56, 1752–1757. [Google Scholar] [CrossRef]
- Zhan, Y.; Tan, K.H.; Ji, G.; Chung, L.; Chiu, A.S.F. Green and lean sustainable development path in China: Guanxi, practices and performance. Resour. Conserv. Recycl. 2018, 128, 240–249. [Google Scholar] [CrossRef]
- Moyano-Fuentes, J.; Maqueira-Marín, J.M.; Martínez-Jurado, P.J.; Sacristán-Díaz, M. Extending lean management along the supply chain: Impact on efficiency. J. Manuf. Technol. Manag. 2021, 32, 63–84. [Google Scholar] [CrossRef]
- Nath, V.; Agrawal, R. Agility and lean practices as antecedents of supply chain social sustainability. Int. J. Oper. Prod. Manag. 2020, 40, 1589–1611. [Google Scholar] [CrossRef]
- Maddikunta, P.K.R.; Pham, Q.-V.; Prabadevi, B.; Deepa, N.; Dev, K.; Gadekallu, T.R.; Ruby, R.; Liyanage, M. Industry 5.0: A survey on enabling technologies and potential applications. J. Ind. Inf. Integr. 2022, 26, 100257. [Google Scholar] [CrossRef]
- Akundi, A.; Euresti, D.; Luna, S.; Ankobiah, W.; Lopes, A.; Edinbarough, I. State of Industry 5.0—Analysis and Identification of Current Research Trends. Appl. Syst. Innov. 2022, 5, 27. [Google Scholar] [CrossRef]
- Grabowska, S.; Saniuk, S.; Gajdzik, B. Industry 5.0: Improving humanization and sustainability of Industry 4.0. Scientometrics 2022, 127, 3117–3144. [Google Scholar] [CrossRef] [PubMed]
- Gladysz, B.; Tran, T.; Romero, D.; Van Erp, T.; Abonyi, J.; Ruppert, T. Current development on the Operator 4.0 and transition towards the Operator 5.0: A systematic literature review in light of Industry 5.0. J. Manuf. Syst. 2023, 70, 160–185. [Google Scholar] [CrossRef]
- Rahardjo, B.; Wang, F.K.; Lo, S.C.; Chu, T.-H. A Sustainable Innovation Framework Based on Lean Six Sigma and Industry 5.0. Arab. J. Sci. Eng. 2024, 49, 7625–7642. [Google Scholar] [CrossRef]
- Fani, V.; Bucci, I.; Rossi, M.; Bandinelli, R. Lean and industry 4.0 principles toward industry 5.0: A conceptual framework and empirical insights from fashion industry. J. Manuf. Technol. Manag. 2024, 35, 122–141. [Google Scholar] [CrossRef]
- Pekkaya, M.; Pulat İmamoğlu, Ö.; Koca, H. Evaluation of healthcare service quality via Servqual scale: An application on a hospital. Int. J. Healthc. Manag. 2019, 12, 340–347. [Google Scholar] [CrossRef]
- Hessing, T. Quality Function Deployment (QFD) and House of Quality (HOQ). Available online: https://sixsigmastudyguide.com/house-of-quality-HOQ/ (accessed on 22 July 2019).
- Zhang, M.-C.; Zhu, B.-W.; Huang, C.-M.; Tzeng, G.-H. Systematic Evaluation Model for Developing Sustainable World-Class Universities: An East Asian Perspective. Mathematics 2021, 9, 837. [Google Scholar] [CrossRef]
- Antônio Rufino Júnior, C.; Sanseverino, E.R.; Gallo, P.; Koch, D.; Schweiger, H.-G.; Zanin, H. Blockchain review for battery supply chain monitoring and battery trading. Renew. Sustain. Energy Rev. 2022, 157, 112078. [Google Scholar] [CrossRef]
- Siwiec, D.; Pacana, A. Method of improve the level of product quality. Prod. Eng. Arch. 2021, 27, 1–7. [Google Scholar] [CrossRef]
- Omair, M.; Noor, S.; Tayyab, M.; Maqsood, S.; Ahmed, W.; Sarkar, B.; Habib, M.S. The Selection of the Sustainable Suppliers by the Development of a Decision Support Framework Based on Analytical Hierarchical Process and Fuzzy Inference System. Int. J. Fuzzy Syst. 2021, 23, 1986–2003. [Google Scholar] [CrossRef]
- Kurata, H.; Nam, S.-H. After-sales service competition in a supply chain: Optimization of customer satisfaction level or profit or both? Int. J. Prod. Econ. 2010, 127, 136–146. [Google Scholar] [CrossRef]
- Sremac, S.; Stević, Ž.; Pamučar, D.; Arsić, M.; Matić, B. Evaluation of a Third-Party Logistics (3PL) Provider Using a Rough SWARA–WASPAS Model Based on a New Rough Dombi Agregator. Symmetry 2018, 10, 305. [Google Scholar] [CrossRef]
- Keshta, I.; Aoudni, Y.; Sandhu, M.; Singh, A.; Xalikovich, P.A.; Rizwan, A.; Soni, M.; Lalar, S. Blockchain aware proxy re-encryption algorithm-based data sharing scheme. Phys. Commun. 2023, 58, 102048. [Google Scholar] [CrossRef]
- Zuo, Y. Exploring the Synergy: AI Enhancing Blockchain, Blockchain Empowering AI, and their Convergence across IoT Applications and Beyond. IEEE Internet Things J. 2024, 12, 6171–6195. [Google Scholar] [CrossRef]
- Abdelhamid, M.; Sliman, L.; Ben Djemaa, R.; Perboli, G. A Review on Blockchain Technology, Current Challenges, and AI-Driven Solutions. ACM Comput. Surv. 2024, 57, 1–39. [Google Scholar] [CrossRef]
- Bencsik, A.; Hargitai, D.M.; Kulachinskaya, A. Trust in and Risk of Technology in Organizational Digitalization. Risks 2022, 10, 90. [Google Scholar] [CrossRef]
- Han, Y.; Feng, Z.; Zhang, J.; Jin, R.; Aboagye-Nimo, E. Employees’ Safety Perceptions of Site Hazard and Accident Scenes. J. Constr. Eng. Manag. 2019, 145, 04018117. [Google Scholar] [CrossRef]
- Kula, B.; Roxas, A.L.; Cetin, K.; Berghorn, G.; Anctil, A. Implementation of VR Technology for Energy Audit Training and Workforce Development. J. Manag. Eng. 2025, 41, 04025002. [Google Scholar] [CrossRef]
- Ensslen, A.; Gnann, T.; Jochem, P.; Plötz, P.; Dütschke, E.; Fichtner, W. Can product service systems support electric vehicle adoption? Transp. Res. Part A Policy Pract. 2020, 137, 343–359. [Google Scholar] [CrossRef]
- Zhang, T.; Agarwal, L. The Value of It-Enabled Retailer Learning: Personalized Product Recommendations and Customer Store Loyalty in Electronic Markets. MIS Q. 2011, 35, 859. [Google Scholar] [CrossRef]
- Mohsen, B.M. Ai-driven optimization of urban logistics in smart cities: Integrating autonomous vehicles and iot for efficient delivery systems. Sustainability 2024, 16, 11265. [Google Scholar] [CrossRef]
- Govindan, K.; Asgari, F.; Fard, F.S.N.; Mina, H. Application of IoT technology for enhancing the consumer willingness to return E-waste for achieving circular economy: A Lagrangian relaxation approach. J. Clean. Prod. 2024, 459, 142421. [Google Scholar] [CrossRef]
- Jiang, Q.; Ke, G. Information sharing and bullwhip effect in smart destination network system. Ad Hoc Netw. 2019, 87, 17–25. [Google Scholar] [CrossRef]
- Villena-Manzanares, F.; García-Segura, T.; Pellicer, E. Organizational Factors That Drive to BIM Effectiveness: Technological Learning, Collaborative Culture, and Senior Management Support. Appl. Sci. 2020, 11, 199. [Google Scholar] [CrossRef]
- Liu, H.L.; Song, J.L.; Wang, G.B. User satisfaction of building information modeling (BIM) and its inflfluencing factors in AEC industry. J. China Civ. Eng. 2019, 52, 118–128. [Google Scholar]
- Wang, Y.; Han, J.H.; Beynon-Davies, P. Understanding blockchain technology for future supply chains: A systematic literature review and research agenda. Supply Chain. Manag. Int. J. 2019, 24, 62–84. [Google Scholar] [CrossRef]
- Baah, C.; Opoku Agyeman, D.; Acquah, I.S.K.; Agyabeng-Mensah, Y.; Afum, E.; Issau, K.; Ofori, D.; Faibil, D. Effect of information sharing in supply chains: Understanding the roles of supply chain visibility, agility, collaboration on supply chain performance. Benchmarking Int. J. 2022, 29, 434–455. [Google Scholar] [CrossRef]


Disclaimer/Publisher’s Note: The statements, opinions and data contained in all publications are solely those of the individual author(s) and contributor(s) and not of MDPI and/or the editor(s). MDPI and/or the editor(s) disclaim responsibility for any injury to people or property resulting from any ideas, methods, instructions or products referred to in the content. |
© 2025 by the authors. Licensee MDPI, Basel, Switzerland. This article is an open access article distributed under the terms and conditions of the Creative Commons Attribution (CC BY) license (https://creativecommons.org/licenses/by/4.0/).