Article

Development and Characterization of Dairy Compound with Goat Milk Powder and Rice Flour

by
Ana Caroline Ferreira Carvalho
1,*,
Gilberto Marques Nunes Vieira
2,
Amanda Alves Prestes
1,
Karine Marafon
1,
Carolina Krebs de Souza
3,
Dayanne Regina Mendes Andrade
4,
Cristiane Vieira Helm
5,
Jefferson Santos de Gois
6 and
Elane Schwinden Prudêncio
1,2,*
1
Postgraduate Program in Food Engineering, Technology Center, Federal University of Santa Catarina, Trindade, Florianópolis 88040-900, SC, Brazil
2
Department of Food Science and Technology, Federal University of Santa Catarina, Itacorubi, Florianópolis 88034-001, SC, Brazil
3
Department of Chemical Engineering, University of Blumenau, 3250 São Paulo Street, Blumenau 89030-000, SC, Brazil
4
Postgraduate Program in Food Engineering, Federal University of Paraná, Jardim das Américas, Curitiba 82590-300, PR, Brazil
5
Brazilian Agricultural Research Corporation (Embrapa Florestas), Estrada da Ribeira, km 111, Guaraituba, Colombo 83411-000, PR, Brazil
6
Department of Analytical Chemistry, Rio de Janeiro State University, Rio de Janeiro 21941-909, RJ, Brazil
*
Authors to whom correspondence should be addressed.
Processes 2025, 13(8), 2324; https://doi.org/10.3390/pr13082324
Submission received: 18 June 2025 / Revised: 16 July 2025 / Accepted: 20 July 2025 / Published: 22 July 2025
(This article belongs to the Section Food Process Engineering)

Abstract

Goat milk has lower allergenicity and high commercial value but faces storage limitations, often leading to waste. Converting it into powder increases costs, making blending with non-dairy ingredients, such as rice flour, a viable alternative to reduce costs and potentially improve nutrition. In this this study, we developed five dairy compounds by replacing 10–49% of goat milk powder with rice flour. We evaluated their nutritional and physical properties compared to pure goat milk powder and rice flour. Analyses included water activity, total solids, protein, lipids, energy value, color, flowability, wettability, polyphenol content, mineral profile, and morphology. Higher rice flour content increased water activity and improved wettability but reduced flowability, classifying most compounds as reasonable to fair in flow, except for the 10% rice flour sample. All samples met Brazilian standards, which require ≥13 g/100 g of protein. The dairy compounds showed a yellow-greenish color, with significant color differences compared to goat milk powder, particularly at 49% rice flour. Goat milk powder had higher mineral contents (Ca, K, Mg, Na, P, Zn). Total polyphenol content was highest in the 10% rice flour compound, while individual polyphenols were undetectable. Overall, the formulation proved viable for cost reduction while maintaining nutritional quality.

1. Introduction

Dairy goat farming is a significant agricultural activity, especially in resource-limited areas, and it serves as a crucial source of income for small-scale producers. In Brazil, while cow’s milk dominates the market, goat milk, despite its lower production volume, holds considerable socioeconomic importance, helping to create jobs and generate income in rural communities [1]. However, the limited storage capacity faced by smallholders can lead to waste, particularly when production exceeds immediate consumption needs [2].
Beyond its productive aspects, goat milk has nutritional and functional characteristics that set it apart from cow’s milk. It is notably easier to digest and has a lower allergenic potential, attributes linked to its specific protein composition. Unlike cow’s milk, which contains high levels of αs1-casein, goat milk typically has lower concentrations of this protein fraction, a factor associated with its reduced allergenicity [1]. In this regard, preservation strategies are crucial for maximizing the full utilization of this valuable product, with dehydration emerging as a viable technological alternative.
Milk drying, primarily through the production of milk powder, has become a well-established technique for extending shelf life, minimizing microbiological changes, and facilitating storage and transportation [3]. Consequently, powdered milk provides significant logistical and commercial advantages over fluid milk. Nevertheless, despite its widespread market acceptance and established role in the dairy industry, powdered milk remains a high-cost product [4], which may limit access for lower-income populations.
Milky sources are also the most expensive raw materials for this industry, accounting for approximately 60% to 80% of input costs. They also experience significant price fluctuations, as several factors can influence their productivity, quality, and marketing, including climate, variations in the costs of inputs for feeding lactating animals, and even political and economic issues such as taxation. Thus, substituting powdered milk with rice flour would contribute to a reduction in the product’s price. Goat milk powder costs 10 times as much as rice flour. The substitution of goat milk for rice flour would undoubtedly result in a cheaper product, contributing to the development of economically viable technological alternatives with potential applications in the food industry, including the creation of a new dairy compound with low allergenic potential, i.e., gluten-free.
Preliminary studies have already been conducted using milk powder. Verruck et al. [5] developed a functional dairy product based on full-fat goat milk powder enriched with prebiotics. The formulation aimed to improve the survival of Bifidobacterium BB-12 during storage while simultaneously enhancing the texture, fat content, and overall nutritional quality of the product. Milinčić et al. [6] formulated a powdered dairy product using skimmed goat milk supplemented with grape pomace seed extract. The addition of this agro-industrial by-product aimed to increase the phenolic compound content, resulting in a significant enhancement in the product’s antioxidant activity. Furthermore, George et al. [7] produced biofortified dairy powders via spray drying, incorporating curcumin for its antioxidant effects and veld grape extract (Cissus quadrangularis) for its anti-inflammatory properties. This formulation was designed to deliver bioactive compounds with specific health benefits, yielding functional powders with potential therapeutic value.
In this context, dairy compounds emerge as a promising technological and economic alternative. These products consist of a mixture of milk and other dairy or non-dairy ingredients, aiming to retain the functional and preservative characteristics achieved through dehydration while minimizing production costs. The partial replacement of goat milk with alternative ingredients, such as rice flour (Oryza sativa), can improve the economic viability of the product without compromising its nutritional and technological quality [8].
The production of powdered dairy compounds requires a thorough evaluation of their physical and functional properties, as these factors directly influence product stability, reconstitution behavior, and consumer acceptance. Key parameters such as density, fluidity, wettability, and flowability play a critical role in determining the efficiency of storage, packaging, and handling [2,3]. Additionally, it is essential to assess the nutritional composition and bioactive properties of the product, which contribute to its functional value and potential health benefits [6].
This study aimed to evaluate the physical properties, physicochemical characteristics, total and individual phenolic compounds, multi-element profile, and morphological properties of dairy compounds formulated with powdered goat milk (Capra aegagrus) and rice flour (Oryza sativa). This study contributes to the development of economically viable technological alternatives with potential applications in the food industry.

2. Materials and Methods

2.1. Preparation of Dairy Compounds: Goat’s Milk and Rice Flour

Five dairy compounds were prepared with 10, 20, 30, 40, and 49% (m/m) goat’s milk powder replaced by rice flour, denoted as DC10, DC20, DC30, D40, and DC49, respectively. Control samples 1 and 2 contained 100% milk powder and 100% rice flour, respectively (Table 1). Both raw materials, goat milk powder and rice flour, were stored at room temperature in the dark for up to six months.
These contents were defined according to Normative Instruction n° 28 of 12 June 2007 [9]. This Normative Instruction establishes that dairy ingredients must represent at least 51% (m/m) of the total ingredients (mandatory or raw materials) in the product referred to as a dairy compound. All components used for the formulations (rice flour and goat milk powder) were from the same batch.

2.2. Reagents

All reagents employed were of analytical grade or higher. Ultrapure water (18.2 MΩ resistivity) was produced using an MS3000 ultra-purification system (Master System, Gehaka, São Paulo, SP, Brazil) and used for all reagent and sample dilutions. The chemicals used in sample preparation included acetone, NaOH, petroleum ether, HNO3, and HCl (Quimis, São Paulo, SP, Brazil), as well as tetramethylammonium hydroxide (TMAH) at 25% w/w in water (Sigma-Aldrich, Taufkirchen, Germany). Nitric acid was further purified through a PTFE sub-boiling system (Distill acid BSB-939-IR, Berghof, Berchtesgaden, Germany). For calibration and recovery assessments, individual standard solutions (1000 mg L−1) were sourced from Specsol® (Ca, Cu, P, Zn, Sc; Jacareí, SP, Brazil), MERCK (K; Darmstadt, Germany), SCP Science (Cr, Fe, Mg; Baie D’Urfé, QC, Canada), and VETEC (Na; Duque de Caxias, RJ, Brazil).

2.3. Physicochemical Analysis

The water activity (aw) of the dairy compounds was measured at a temperature of 25 ± 1 °C using the Aqualab 4TE analyzer (Decagon Devices, Pullman, WA, USA), after the samples had stabilized for 15 min.
The total solids content (g/100 g) was determined from 5 g of each sample by drying them to a constant weight at 105 ± 1 °C. The total protein content (g/100 g) was determined using the Kjeldahl method. In contrast, the total lipid content (g/100 g) was obtained by extracting lipids with ethyl ether using the Soxhlet system and protein denaturation with hydrochloric acid [10]. The total carbohydrate content (g/100 g) was calculated by difference. Conversion factors for carbohydrates, fats, and proteins were used to calculate the energy value. Each gram of carbohydrate and protein equals 4 kcal (or 17 kJ), while each gram of lipid equals 9 kcal (or 37 kJ).
Color evaluation of the dairy compound samples was performed using a sphere-type spectrophotometer (SP60 Series, X-Rite Inc., Grand Rapids, MI, USA), and the results were reported in terms of the CIELAB coordinates: L* (lightness), a*, and b*. Measurements were obtained directly from the instrument. The L* value represents brightness on a scale from 0 (black) to 100 (white), while the a* coordinate indicates chromatic variation from green (−a*) to red (+a*), and the b* coordinate reflects the spectrum from blue (−b*) to yellow (+b*). The total difference in color (ΔE*) between the measured values of each dairy compound sample and control 1 (ΔE*1; goat milk powder) and control sample 2 (ΔE*2; rice flour) was determined by using Equation (1).
Δ E * = L * 2 + a * 2 + b * 2
where ΔL* indicates the variation in lightness, Δa* corresponds to the change in red–green intensity, and Δb* represents the change in yellow–blue intensity for each dairy compound sample.

2.4. Physical Analysis

2.4.1. Density

The density of the samples was measured via the values for the aerated bulk density and compacted density, as performed by Verruck et al. [5]. The aerated bulk density was obtained by carefully depositing approximately 2 g of each sample into a graduated cylinder and was calculated using Equation (2).
a e r a t e d b u l k d e n s i t y = s a m p l e m a s s g s a m p l e v o l u m e c m 3
To determine the compacted density, after the sample was deposited inside the test tube, mechanical movements were performed (100 times) to evaluate its compaction. The compacted density was calculated using Equation (3).
c o m p a c t e d d e n s i t y = s a m p l e m a s s g v o l u m e a f t e r m e c h a n i c a l m o v e m e n t s c m 3
The results were expressed in g/cm3.

2.4.2. Fluidity and Cohesiveness

The samples were evaluated for fluidity and cohesiveness in relation to the Carr index and Hausner rate, respectively. The Carr index and Hausner rate were calculated from the aerated bulk density and compacted density using Equations (4) and (5), provided by Reddy et al. [11].
C a r r i n d e x % = a e r a t e d b u l k d e n s i t y c o m p a c t e d d e n s i t y a e r a t e d b u l k d e n s i t y × 100
H a u s n e r r a t e = a e r e t e d b u l k d e n s i t y c o m p a c t e d d e n s i t y

2.4.3. Flowability

The flowability of the powder samples was obtained through the angle of repose, as calculated by George et al. [7] using Equation (6). To calculate the repose angle, a glass funnel with a discharge orifice of approximately 20 mm in diameter and a wall angle of 65° was used. The funnel was kept at a fixed distance from a smooth surface, and the samples were poured, moving down the funnel due to gravity. The diameter (L) and height (h) of the conical mound formed were measured, and the angle of repose was calculated by using Equation (6).
= a r c t g × h L 2
The flowability of powders can be assessed based on their angle of repose. Angles between 25° and 30° indicate very free-flowing powders, while values from 31° to 38° correspond to free-flowing behavior. Angles ranging from 39° to 45° are considered to indicate intermediate flowability. Powders with angles between 46° and 55° are classified as cohesive, showing more restricted flow. Finally, angles above 55° represent very difficult flow, suggesting high cohesiveness among particles. This classification is essential for understanding the handling and processing behavior of powdered materials.

2.4.4. Wettability

The wettability of the samples was evaluated using the wettability index. This index was determined by adding 13 g of dry sample of each dairy compound to 100 g of water at a temperature of 40 °C without stirring. It is worth noting that the wettability index is defined as the time required for a powder to become completely wet, meaning the time for the powder to reach the bottom of a beaker. This analysis was conducted as proposed by Hailu et al. [12].

2.5. Total Phenolic Content

Total phenolic content was evaluated following the Folin–Ciocalteu method [13], with a calibration curve derived from a standard gallic acid solution (1.0–9.0 mg/L), which exhibited a linear correlation (R2 = 0.99). The procedure involved adding the sample extract (0.1–1.0 mL) to tubes, followed by the incorporation of 1.25 mL of Folin–Ciocalteu reagent and 5 mL of a 15% sodium carbonate solution, and measuring the absorbance at 720 nm. The analysis was performed in a spectrophotometer (Shimadzu, UV 1800, Kyoto, Japan) at 720 nm, and the results were reported as milligrams of gallic acid equivalent per 100 g of sample (mg GAE·100 g−1).

2.6. Individual Phenolic Compounds

The concentrations of individual phenolic compounds were determined using HPLC-DAD (High-Performance Liquid Chromatography with Diode Array Detection; Shimadzu, Prominence LC-20AT + SPD-M20A DAD) with an Agilent 1260 Infinity system (Santa Clara, CA, USA) fitted with an autosampler, gradient elution, and a diode array detector (DAD) set to 280, 320, and 360 nm, along with a Pursuit 5 C18 column (250 × 4.6 mm i.d., 5 µm particle size). The flow rate was 1.0 mL/min, the injection volume was 20 µL, and the column temperature was maintained at 25 °C.
Eluent A consisted of 980 mL of ultrapure water and 20 mL of glacial acetic acid (P.A. grade). In contrast, Eluent B was created by mixing 800 mL of acetonitrile with 200 mL of Eluent A. Individual stock standards were prepared in methanol at a concentration of 100 mg/L. A mixed standard solution at 10 mg/L was made using the initial mobile phase composition (95% Eluent A + 5% Eluent B), which was also used for the serial dilution of the standards to construct the calibration curve. Sample extracts were diluted at 1:4 (v/v) in the same initial mobile phase composition before injection.
Phenols (gallic, protocatechuic, vanillic, syringic, trans-cinnamic, caffeic, coumaric acids, and flavonoids rutin and quercetin) were analyzed according to Burin et al. [14].

2.7. Multi-Element Profile

A multi-element analysis was conducted according to Prestes et al. [15]. The preparation of dairy compound samples for elemental analysis involved microwave-assisted digestion using a Multiwave PRO Microwave Reaction System (Anton Paar, Graz, Austria), equipped with internal vessels. The system operated under controlled conditions, with a maximum microwave power of 1200 W, an internal temperature of 200 ± 1 °C, and a pressure limit of 20 bar. Additionally, ultrasonic extraction was conducted in a 60/2 ultrasonic bath (Nova Instruments, Piracicaba, SP, Brazil) at 50 Hz, maintained at ambient temperature (25 ± 1 °C). Alkaline solubilization was performed in a water bath placed on a heated magnetic stirrer (C-MAG HS 7, IKA, Campinas, SP, Brazil). For dry ashing, the samples were incinerated in a muffle furnace (LF0613, Jung, Blumenau, SC, Brazil) at 550 ± 1 °C, and the resulting ashes were dissolved in concentrated hydrochloric acid at 80 ± 1 °C. Subsequently, 2.218 g aliquots of each sample were centrifuged using a model 206 BL centrifuge (Fanem, Guarulhos, SP, Brazil).
Elemental quantification was performed using Inductively Coupled Plasma Optical Emission Spectrometry (ICP-OES), model iCAP 6000 (Thermo Scientific, Waltham, MA, USA), following the method established by Prestes et al. (2024) [15]. The monitored elements and their respective wavelengths were Ca (315.887 nm), Cr (267.716 nm), Cu (324.754 nm), Fe (259.940 nm), K (766.490 nm), Mg (279.553 nm), Na (589.592 nm), P (213.618 nm), and Zn (213.856 nm), with Sc (361.384 nm) serving as the internal standard. These analytes were selected based on their nutritional relevance in dairy matrices and the analytical capability of the instrument, which featured a V-Groove nebulizer and a cyclonic spray chamber, enabling the analysis of samples with elevated dissolved solids content.
Operating conditions for the ICP-OES included radial observation mode, a pump speed of 60 rpm, plasma gas flow at 12 L/min, RF power set to 1300 W, auxiliary gas at 1 L/min, and nebulizer gas at 0.4 L/min. Argon gas with a purity of at least 99.95% (Air Liquide, Rio de Janeiro, RJ, Brazil) was employed throughout the analysis as the plasma, auxiliary, and nebulizer gas. Calibration curves were constructed using standard solutions ranging from 0.1 to 10 mg/L.
Ultrapure water (18.2 MΩ resistivity) generated via an MS3000 purification system (Master System, Gehaka, São Paulo, SP, Brazil) was used in all sample and reagent preparations. Reagents included nitric acid (14.4 mol/L), hydrochloric acid (12 mol/L) (Quimis, São Paulo, SP, Brazil), and tetramethylammonium hydroxide 25% w/w (Sigma-Aldrich, Germany). Nitric acid was further purified by using a sub-boiling system with a PTFE construction (Distill Acid BSB-939-IR, Berghof, Germany).
Certified single-element stock solutions (1000 mg/L) were used to construct calibration curves and for recovery tests. These included analytes such as Al, As, Ca, Cd, Co, Cr, Cu, Fe, Mn, P, Pb, S, Se, Sr, and Zn (Specsol®, Jacareí, SP, Brazil); K (MERCK®, Darmstadt, Germany); Mg (SCP Science®, Quebec, Canada); and Na (VETEC®, Duque de Caxias, RJ, Brazil).

2.8. Scanning Electron Microscopy (SEM)

The dairy compound samples were prepared for scanning electron microscopy (SEM) following a modified protocol based on the method described by Carvalho et al. [16]. Initially, the samples were dehydrated using a Terroni® freeze-dryer (model LD 3000, São Carlos, Brazil). After dehydration, the samples were fractured, mounted on metallic stubs, and coated with a thin gold layer using a Leica® sputter coater (model EM SCD 500, Wetzlar, Germany). Microstructural analysis was performed using a VEGA® 3 SEM scanning electron microscope (Tescan, Tokyo, Japan), operated at an accelerating voltage of 20 kV and a magnification of 500×.

2.9. Statistical Analysis

All steps of this work were performed in triplicate. All results were expressed as the mean ± standard deviation. To determine significant differences (p < 0.05) between the results, one-way analysis of variance (ANOVA) and Tukey’s test were used. All statistical analyses were performed using STATISTICA 13.3 software (TIBCO Software Inc., Palo Alto, CA, USA).

3. Results and Discussion

3.1. Physicochemical Analysis

Figure 1 and Table 2 show the visual characteristics and the results of the chemical and nutritional compositions of control 1 (whole goat’s milk powder), control 2 (rice flour), and the dairy compounds with the substitution of 10, 20, 30, 40, and 49% (m/m) of whole goat’s milk powder with rice flour. The Brazilian market for dairy compounds has been expanding, mainly due to their lower cost compared to powdered milk [17]. These products use whey as a partial substitute for cow’s milk. As an innovation, this study proposes replacing whole goat’s milk powder with rice flour to reduce costs, considering the average prices in May 2025: USD 10.94 for 400 g of goat’s milk powder and USD 2.39 for 1 kg of rice flour.
Regarding the water activity (aw) of the samples, it was generally found that higher levels of rice flour were responsible for its increase. These results align with those observed by Cunha et al. [17] and Pugliese et al. [18], who evaluated five dairy compounds with powdered cow’s milk replaced by powdered soy extract and eleven different commercial brands of powdered milk, respectively. The results for aw found by these authors ranged from 0.24 to 0.33. Pugliese et al. [18] pointed out that aw is an important characteristic of powdered food products, because, due to the longer shelf life they usually have, they are responsible for maintaining nutritional value and preventing lactose crystallization.
The lower protein, lipid, and energy contents (p < 0.05) found in rice flour compared to all the samples evaluated led to a decrease (p < 0.05) in these contents as the substitution of rice flour for whole goat’s milk powder increased. All the dairy compounds produced had high levels of protein, lipids, and energy, ≥18.3 g/100 g, ≥16.8 g/100 g, and ≥443.6 kcal (1864.3 kJ), respectively. Regarding total carbohydrate content, the opposite effect was observed compared to protein and lipids; the higher protein content of rice flour led to an increased replacement of whole goat’s milk powder with rice flour, resulting in milk compounds with a higher carbohydrate content (p < 0.05), ranging from 35.8 to 54.8 g/100 g. The total solids content showed no differences (p > 0.05) between all the samples evaluated. In terms of chemical composition, all the samples complied with Normative Instruction n° 28 of 12 June 2007, issued by the Ministry of Agriculture, Livestock and Supply [9], which only stipulates that the protein content for this type of product should be ≥13 g/100 g. The dairy compound should be incorporated into a balanced diet for adults as a complementary food, rather than a primary source of nutrition. As it is formulated with varying concentrations of ingredients such as goat milk powder and rice flour, the resulting changes in nutrient composition, particularly in protein, fat, and carbohydrate content, must be considered when planning an individual’s overall dietary intake. This consideration ensures that nutritional adequacy is maintained, particularly regarding essential nutrients that may be present in reduced amounts due to formulation adjustments [19].
Table 3 presents the results for the color parameters of the samples evaluated in this study. All the dairy compounds exhibited luminosity (L*) values equal to those of control sample 1 (whole goat’s milk powder) (p > 0.05), and these values were higher than those of control sample 2 (rice flour) (p < 0.05). Consequently, rice flour was whiter than all other samples evaluated. According to Saipriya et al. [19], changes in L* values are primarily due to the reflection of light of all wavelengths by fat and protein particles. Therefore, it is believed that the higher protein and lipid contents in the dairy compound and goat’s milk samples may have influenced the L* parameter values obtained.
The a* (red–green) parameter showed negative values in all the samples, characterizing them as having a green tint; however, the higher the rice flour content, the greater the decrease (p < 0.05) in the green tint. In the case of this parameter, according to Saipriya et al. [19], the reduction in fat content and, consequently, the presence of fewer fat globules on the surface of goat’s milk resulted in a greater amount of light absorbed by greener compounds, such as riboflavin. As cited by these authors, the riboflavin content in goat’s and cow’s milk is 0.21 and 0.16 mg/100 g, respectively.
The results for the b* parameter of all the samples evaluated indicated a hue leaning towards yellow. However, regarding this parameter, it was found that the use of rice flour resulted in dairy compounds different from those observed for goat’s milk powder (control 1) and rice flour (control 2), with the dairy compounds being less yellow than control 1 sample (p < 0.05) and more yellow than control 2 sample (p < 0.05). Among the dairy compounds, a decrease in yellow color was only observed for the sample containing 49% rice flour (p < 0.05). Saipriya et al. [19] credit the yellowish color observed when using goat’s milk to the effect of the light-absorbing substances available in the milk’s serum phase.
When compared to whole goat’s milk, there was only a difference in color between the dairy compound containing 49% rice flour and whole goat’s milk powder. In contrast, all the dairy compounds exhibited color differences compared to rice flour. This behavior was visualized because, according to Lee and Coates [20], when ΔE* > 2, the color difference is perceptible to the human eye. Regarding physical properties, an increase in the densities of the dairy compounds was observed with a higher rice flour content.
Color plays a key role in consumer perception, particularly in powdered products, where variations in the hue angle can reflect differences in processing and storage conditions. These visual attributes influence the impression of freshness and overall acceptability of the product. Rice flour, for instance, may exhibit different tonalities depending on grain variety and processing degree, potentially altering the visual characteristics of the final formulation [21].
Evaluating color parameters is also important for detecting physicochemical changes during storage, such as lipid oxidation and Maillard reactions, which commonly affect protein- and sugar-rich matrices like powdered milk. Alterations in CIE Lab* values—especially lightness (L*) and yellowness (b*)—can signal non-enzymatic browning and degradation of sensitive compounds, even under refrigeration [22,23]. Therefore, monitoring color contributes not only to quality control but also to the assessment of product stability, aligning with consumer expectations for consistent appearance among dairy alternatives.

3.2. Physical Analysis

3.2.1. Density

The values of aerated bulk density and compacted density showed a significant difference (p > 0.05). According to Cunha et al. [17], differences in powder density are attributed to the density of the particles present, which are influenced by the types of solids and their porosity, as demonstrated in Table 4. Additionally, these authors noted that the sample preparation method can significantly impact the powder’s physical properties (goat milk powder and rice flour), mainly because the spray drying process is used for the first sample, while the second undergoes milling. Deshwal et al. [24] also indicate that the density of powders is affected by the non-uniform distribution of particle size.

3.2.2. Fluidity and Cohesiveness

The Carr index and the Hausner rate assess the fluidity and cohesiveness of powdered samples, respectively [17]. In terms of the Carr index (Table 4), whole goat’s milk powder and rice flour differed (p < 0.05), allowing them to be classified as having good and acceptable fluidity, respectively. Concerning the Hausner index (Table 4), whole goat’s milk powder exhibited excellent cohesiveness, while rice flour demonstrated reasonable cohesiveness, which aligns with the results from the Carr index. For both the Carr index and the Hausner rate, the dairy compound containing 10% rice flour did not differ from whole goat’s milk powder (p > 0.05) and can be categorized as a product with good fluidity and cohesiveness. According to the Carr index, all other dairy compounds displayed reasonable fluidity. In contrast, based on the Hausner index, only the dairy compound with 49% rice flour was classified as having reasonable cohesiveness. All other dairy compounds produced were classified as having good cohesiveness, as indicated by the Hausner index. Differences between whole goat’s milk and rice flour, as well as their mixtures, are expected because, as noted by Lamolha and Serra [25], the fluidity of powdered materials also results from the equipment used in processing, explaining all increases and decreases in fluidity. Moreover, these authors emphasize that powders should be evaluated by considering not just one physical property, but a combination of properties.

3.2.3. Flowability

Another physical property evaluated in the powder samples was flowability, measured by the angle of repose [7]. There were no significant differences (p > 0.05) in the angles of repose across all samples assessed, all of which were categorized as difficult-to-flow powders with low flow velocity, potentially hindering their transportation through industrial equipment.

3.2.4. Wettability

Regarding the wettability of the powdered samples, it was observed that the use of rice flour facilitated easier dilution in water, with all samples exhibiting greater wettability as the rice flour content increased (p < 0.05). Consequently, rice flour acted as an “emulsifier” in the product, enhancing the hydration of the powders. According to Lin et al. [26], rice flour contains exposed hydrophobic protein groups, and the non-polar side chains of its proteins likely have an affinity for the hydrophobic chains of the milk fat molecule, resulting in more stable and hydratable aggregates within the powder matrix.

3.3. Total Phenolic Content

Phenolic compounds are secondary metabolites widely recognized for their antioxidant properties. They play an essential role in human health and the oxidative stability of foods [27]. The present study’s quantitative analysis of total phenolic compounds (TPCs) demonstrates significant variation among different formulations containing whole goat milk powder and rice flour (Table 5).
The values in Table 5 indicate that adding rice flour directly influenced the levels of phenolic compounds. Sample DC10 (90% whole goat milk powder and 10% rice flour) presented the highest content of total phenolic compounds (48.53 ± 4.64 mg GAE·100 g−1), significantly higher than that of the other formulations (p < 0.05). This result can be attributed to the presence of bioactive compounds from both goat milk and rice flour, which have different classes of polyphenols [28,29]. Goat milk is a rich source of phenolic compounds, especially flavonoids and phenolic acids, such as gallic acid, caffeic acid, and ferulic acid, which contribute to its antioxidant activity and ability to protect against oxidative stress [30]. These compounds can come from the animals’ diet, which includes forages rich in polyphenols, as well as from the biotransformation of phenolic precursors via the metabolism of goats [31].
Rice flour also contains relevant phenolic compounds, such as p-coumaric acid derivatives, ferulic acid, and catechins, which have antioxidant effects and may increase total phenolic levels [32]. The interaction between the phenolic compounds in goat’s milk and those present in rice flour may enhance the levels observed in the DC10 sample due to possible synergies between the natural antioxidants of the two ingredients.
Compared with the DC20 sample (80% whole goat milk powder and 20% rice flour), a progressive reduction in the content of total phenolic compounds was observed, with values of 44.49 ± 3.02 mg GAE·100 g−1 for DC20 and 44.56 ± 6.42 mg GAE·100 g−1 for DC30. This trend suggests that rice flour may contribute to an initial increase in phenolic contents, but in larger proportions, there may be a dilution effect of the compounds from goat milk.
The lowest levels of TPC were observed in the formulations with higher amounts of rice flour. Samples DC40 and DC49 presented values of 40.33 ± 1.57 mg GAE·100 g−1 and 39.16 ± 2.67 mgGAE·100 g−1, respectively, being significantly lower than the value of DC10 (p < 0.05). Control sample 1 (only whole goat’s milk powder) presented 37.98 ± 1.45 mg GAE·100 g−1, while control sample 2 (only rice flour) recorded the lowest value, 33.77 ± 1.94 mg GAE·100 g−1. These results indicate that whole goat’s milk powder is an important source of phenolic compounds. At the same time, the progressive addition of rice flour can reduce these levels, possibly due to the lower presence of soluble polyphenols compared to goat milk [33].
Thus, the data suggest that incorporating rice flour may be beneficial up to a specific limit for maintaining total phenolic compounds, with a 10% rice flour proportion presenting the best result. Additional studies are needed to understand the interaction between the bioactive compounds of these ingredients and their influence on the bioaccessibility of polyphenols.

3.4. Individual Phenolic Compounds

The presence of individual phenolic compounds was confirmed in all seven samples analyzed, indicating a positive outcome and demonstrating the suitability of the employed chromatographic method. Although the formulations (DC10, DC20, DC30, DC40, DC49, control 1, and control 2) differ in composition, all samples presented the same concentrations of the individual phenolic compounds analyzed. Therefore, the values reported in Table 6 are representative of all samples, as no variation in phenolic content was observed among treatments.
The consistency in results across samples may be partly attributed to the uniform distribution of phenolic compounds resulting from the incorporation of powdered ingredients, which led to a reconstituted matrix with a balanced phenolic composition among treatments. Notably, repeated detection of signals corresponding to compounds such as vanillic acid, syringic acid, trans-cinnamic acid, and quercetin, which have relatively higher detection limits, indicates that these compounds may be present at slightly higher levels compared to the others.
Goat milk naturally contains phenolic compounds, the concentration of which can be increased through enrichment with plant extracts rich in polyphenols. Studies have demonstrated the presence of gallic acid, syringic acid, vanillic acid, p-coumaric acid, and trans-cinnamic acid in enriched goat milk dairy products [6].
Furthermore, studies conducted by Avinash et al. [34] reported the presence of gallic acid, syringic acid, vanillic acid, p-coumaric acid, and trans-cinnamic acid in various rice samples. Complementarily, Shao et al. [35] also identified protocatechuic acid, vanillic acid, and p-coumaric acid in rice grains at different developmental stages.
These findings confirm that goat milk and rice are natural sources of several phenolic acids, which may have contributed to the compounds detected in the dairy product samples analyzed in this study.

3.5. Multi-Element Profile

Adding rice flour to the samples affected the mineral element values, as seen in Table 7. Goat milk naturally contains high levels of Ca, P, Mg, and K. Its composition is vital for human development and health, playing a key role in satisfying nutritional needs [36,37]. As shown in Table 7, P and K were the most abundant minerals in control 1. Pan et al. [38] and Currò et al. [37] found that K is one of the minerals present in the highest concentrations in goat milk. As the addition of rice flour increased in the dairy compounds, these two minerals decreased. The lower P and K content in rice flour can explain this reduction. When added to the dairy compound, it leads to a dilution of these minerals, resulting in lower values [17,37,39].
Ca, Na, Zn, and Mg exhibited similar behavior. Despite reducing these minerals with the increased addition of rice flour in the samples, the Ca content in sample DC 10 was higher than that reported by Pan et al. [38] for raw goat milk. The composition of goat milk powder varies according to the breed of the animal, dietary and nutritional management, and the drying process used.
Currò et al. [37] analyzed the mineral content of raw goat milk and found that the levels of Ca, Mg, and Na were lower compared to those observed in the developed dairy compound samples. Additionally, the Zn concentrations found in the dairy compounds were consistent with the values reported for raw goat milk by Chen et al. [36].
Although the levels of these minerals decreased compared to the formulations with higher proportions of goat milk, all remained detectable in the samples, indicating that the dairy compounds still provide a significant nutritional contribution in terms of essential minerals [39].
The addition of rice flour promoted the enrichment of the dairy compounds with Cu and Mn which consisted exclusively of rice flour. It was noted that as the proportion of rice flour increased in the formulations, the levels of Cu and Mn also rose, indicating a gradual increase in these minerals in the samples, directly associated with the contribution of the plant-based ingredient. Fe was also identified in the dairy compound samples. Fe is an essential mineral, as its deficiency can lead to anemia, while its presence supports the absorption of vitamins such as vitamin C [17,38]. Goat milk naturally contains lower amounts of Cu, Mg, and Fe [36,37]. Pan et al. [38] analyzed the mineral content of goat milk and found the same elements in reduced quantities, supporting the findings obtained in this study.
Cd and Cr were analyzed but not detected. Al, on the other hand, was present in all of them. Previous studies by Cunha et al. [17] reported similar values in dairy compounds. The examination of these metallic elements is vital because, when ingested, they can be toxic even in low concentrations. The detection of Al in the samples may relate to factors such as the composition of the ingredients or possible contamination during processing [37].
The incorporation of rice flour has proven to be a promising complementary strategy, significantly enhancing the enrichment of specific minerals. This blend of animal- and plant-based ingredients not only improves the nutritional profile of dairy compounds but also facilitates the development of more balanced and accessible functional foods, promoting the use of alternative raw materials that provide micronutrients [36,39].

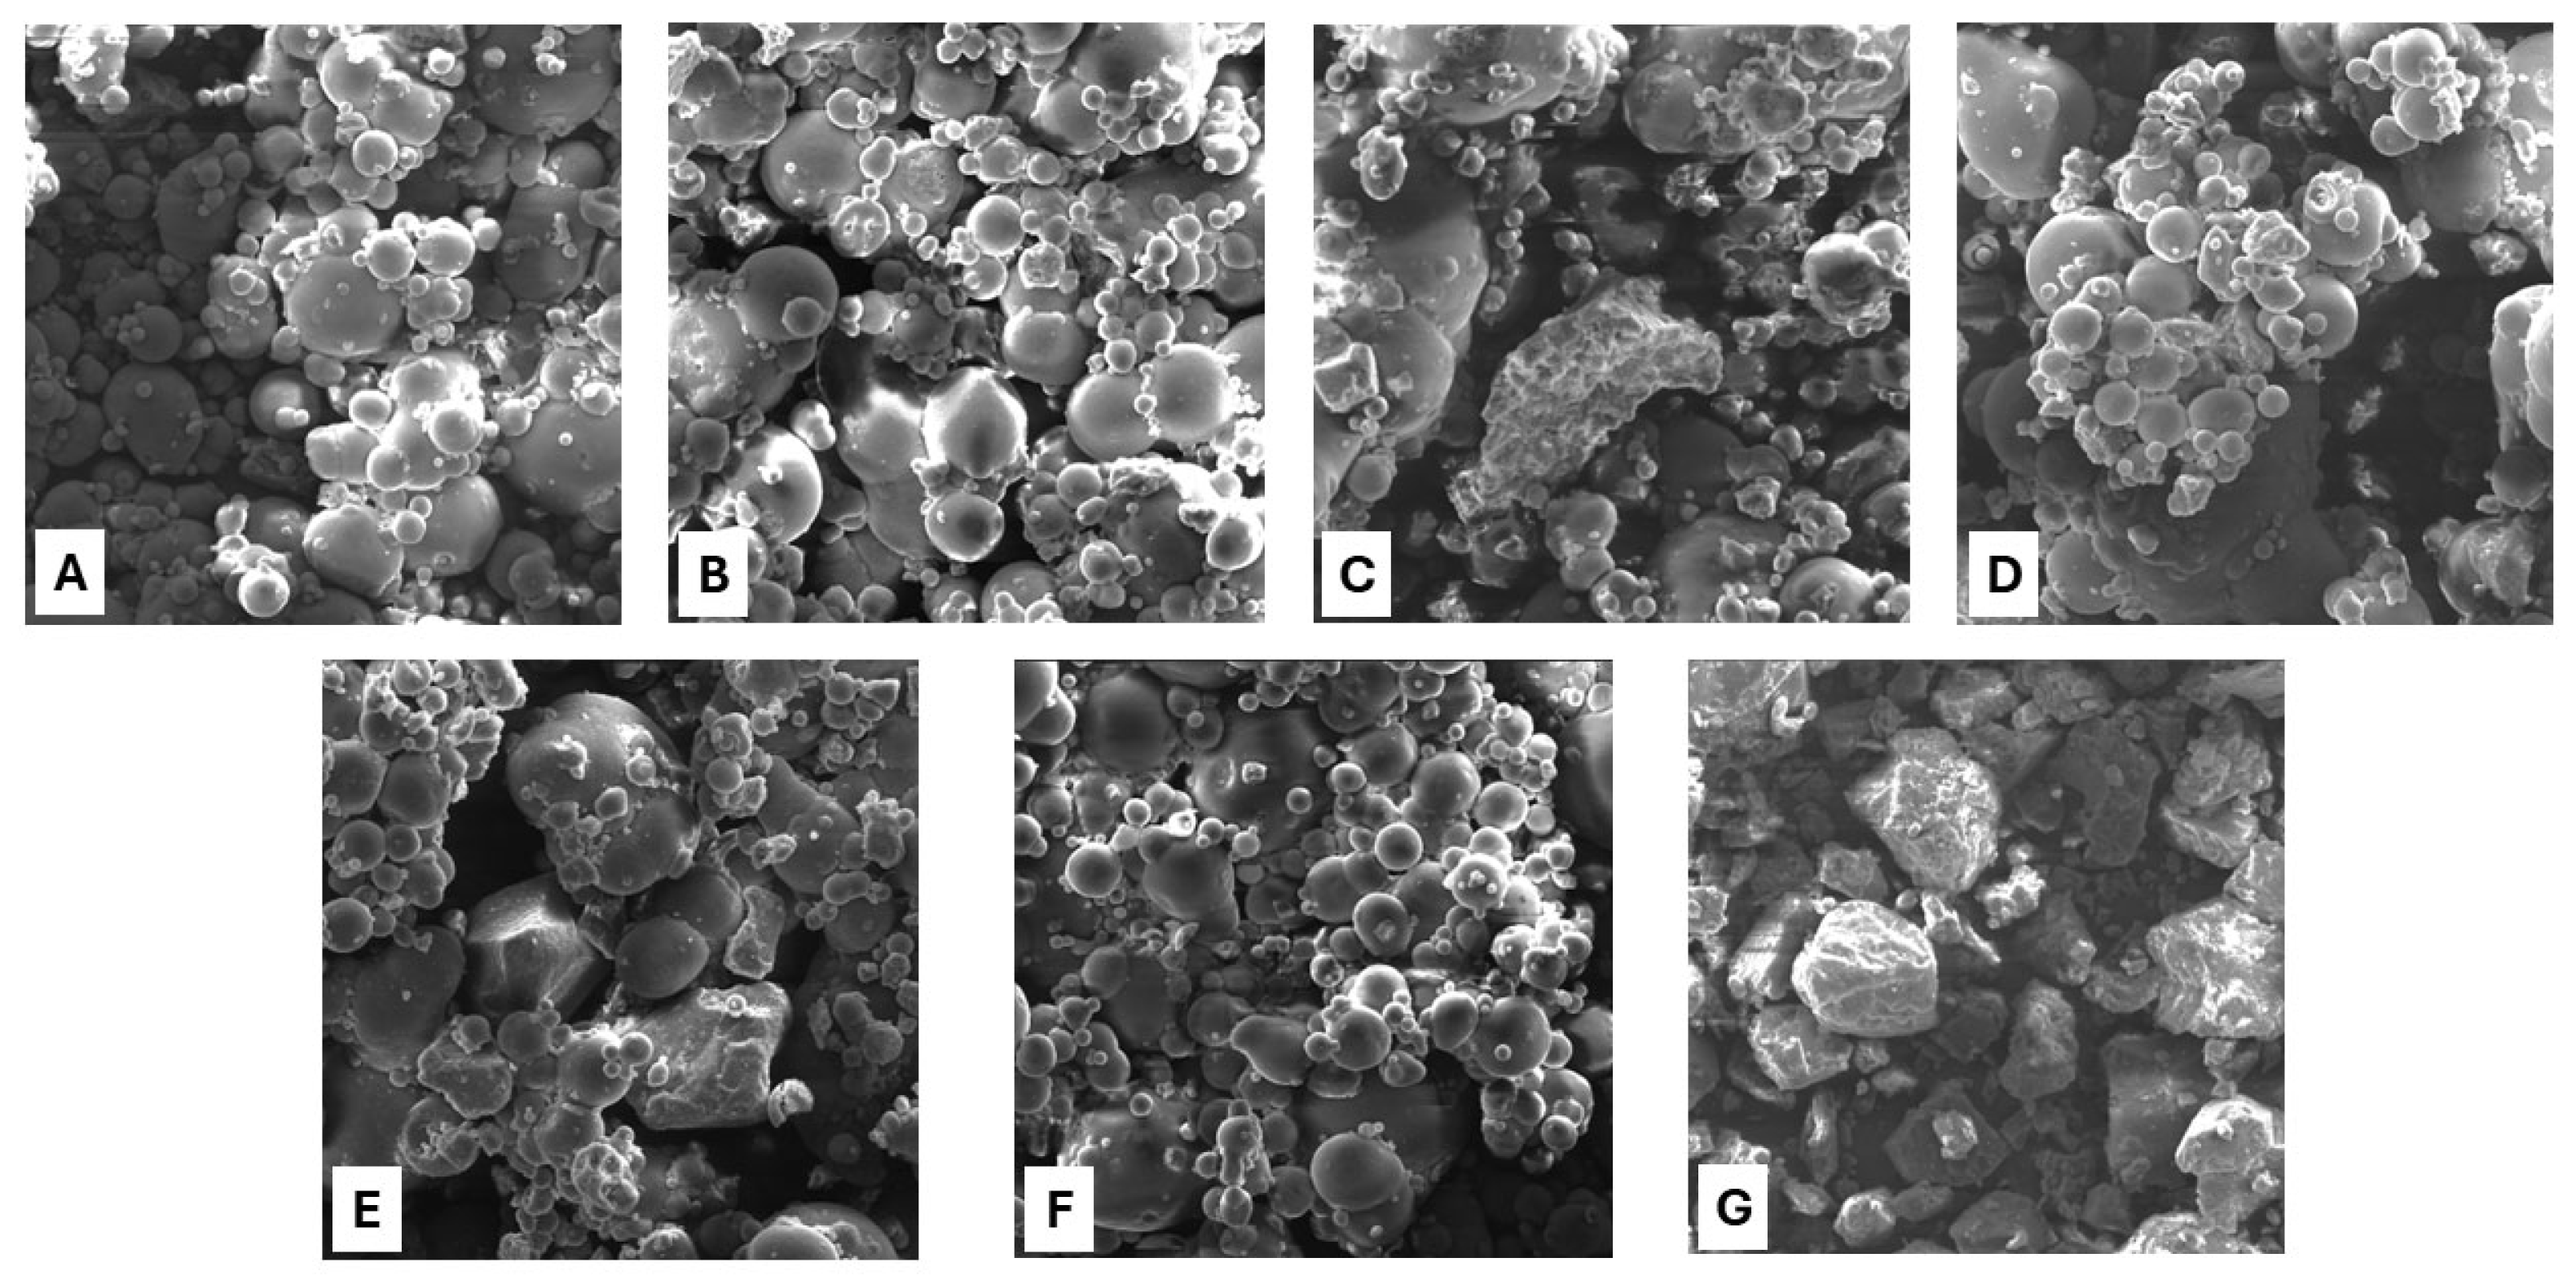
3.6. Scanning Analysis

Figure 2 shows the micrographs obtained from the dairy compound samples. A morphological difference can be observed between the goat milk powder particles (control 1), which are predominantly spherical with smooth surfaces (Figure 2F), and the rice flour particles (control 2), which exhibit an irregular shape, rough surface, and angular contours (Figure 2G).
The morphological analysis confirms that adding rice flour alters the surface structure of particles in the dairy compound (Figure 2A–E). The structure of rice flour and goat milk powder particles directly influences their water affinity and wettability. Rice flour, which is rich in starch, primarily amylopectin, and contains a higher proportion of hydrophilic groups, demonstrates greater water absorption capacity, solubility, and wettability [8]. In contrast, goat milk powder has a higher fat content and more globular proteins, forming a more hydrophobic matrix that results in lower wettability [5]. Therefore, partially replacing goat milk with rice flour may enhance the wettability and reconstitution of dairy compounds in aqueous media.

4. Conclusions

The higher levels of rice flour increased the water activity of the dairy compounds; however, the values obtained remained within the expected range (ranging from 0.28 to 0.33) reported in the literature (ranging from 0.24 to 0.33). Higher rice flour levels reduced the protein, lipid, and energy content, but increased the carbohydrate content. Total solids remained unchanged. In terms of color parameters, the lightness of the dairy compounds was similar to that of whole goat milk powder, and all formulations displayed a yellow-green hue.
Color differences perceptible to the human eye were observed between the dairy compounds and whole goat milk powder; only the formulation with 49% rice flour differed from rice flour. Regarding fluidity and cohesiveness, except for the dairy compound with 10% rice flour, all other dairy compounds showed a reduction in fluidity. However, they were still classified as having fair to good cohesiveness. All samples exhibited poor flowability; however, a higher rice flour content improved wettability, as confirmed by microscopy. All developed dairy compounds displayed measurable levels of total phenolic compounds, including individual phenolic compounds. Furthermore, all formulations contained essential mineral elements in varying concentrations. All the dairy compounds developed comply with current Brazilian legislation. Dairy compounds are a complementary food intended for adult diets. Their variable nutrient composition should be considered to ensure balanced nutritional intake.

Author Contributions

Conceptualization, A.C.F.C., G.M.N.V., C.V.H. and E.S.P.; methodology, A.C.F.C., G.M.N.V., J.S.d.G., D.R.M.A. and E.S.P.; validation, C.V.H., C.K.d.S., J.S.d.G. and E.S.P.; formal analysis, A.C.F.C., K.M., A.A.P., G.M.N.V., J.S.d.G., D.R.M.A., C.V.H., C.K.d.S. and E.S.P.; investigation, C.V.H., C.K.d.S., J.S.d.G. and E.S.P.; resources, J.S.d.G., C.V.H., C.K.d.S. and E.S.P.; data curation, A.C.F.C., A.A.P., K.M., J.S.d.G., D.R.M.A., C.V.H., C.K.d.S. and E.S.P.; writing—original draft preparation, A.C.F.C., A.A.P., K.M. and E.S.P.; writing—review and editing, A.C.F.C. and E.S.P.; visualization, A.C.F.C. and E.S.P.; supervision, C.V.H., C.K.d.S., J.S.d.G. and E.S.P.; project administration, C.V.H. and E.S.P.; funding acquisition, J.S.d.G. and E.S.P. All authors have read and agreed to the published version of the manuscript.

Funding

This research was funded by CNPq (National Council for Scientific and Technological Development, Brazil) [CNPq, 303069/2022-8; 174429/2023-1], a scholarship from CAPES (Coordination of Improvement of Higher Education Personnel, Brazil—Finance Code 001), and Fundação de Amparo à Pesquisa do Rio de Janeiro (FAPERJ). Elane Schwinden Prudencio and Jefferson Santos de Gois have a research grant from CNPq. Jefferson Santos de Gois has a research grant from UERJ (Programa Pró-Ciência).

Data Availability Statement

The original contributions presented in the study are included in the article, further inquiries can be directed to the corresponding author.

Acknowledgments

The authors thank CAPES (Coordination of Improvement of Higher Education Personnel, Brazil—Finance Code 001) and CNPq (National Council for Scientific and Technological Development, Brazil) for the scholarships.

Conflicts of Interest

Author Cristiane Vieira Helm was employed by the company Brazilian Agricultural Research Corporation (Embrapa Florestas). The remaining authors declare that the research was conducted in the absence of any commercial or financial relationships that could be construed as a potential conflict of interest. The company had no role in the design of the study; in the collection, analyses, or interpretation of data; in the writing of the manuscript, or in the decision to publish the results.

References

  1. Ballabio, C.; Chessa, S.; Rignanese, D.; Gigliotti, C.; Pagnacco, G.; Terracciano, L.; Fiocchi, A.; Restani, P.; Caroli, A.M. Goat milk allergenicity as a function of αS1-casein genetic polymorphism. J. Dairy Sci. 2011, 94, 998–1004. [Google Scholar] [CrossRef] [PubMed]
  2. Fialho, T.L.; Nogueira, M.H.; Moreau, A.; Delaplace, G.; Schuck, P.; Perrone, Í.T.; de Carvalho, A.F.; de Sá Peixoto Júnior, P.P. Sugar type matters in spray drying: Homogeneous distribution in milk powder favors repulsive interactions between proteins. Food Struct. 2019, 22, 100132. [Google Scholar] [CrossRef]
  3. Wang, H.J.; Lee, D.S. Packaging and the Shelf Life of Milk Powder Products. In Reference Module in Food Science; Elsevier: Amsterdam, The Netherlands, 2019. [Google Scholar] [CrossRef]
  4. INMETRO. Leite em pó Integral. 2020. Available online: https://bibliosus.saude.gov.br/lis/resource/?id=17605 (accessed on 20 July 2025).
  5. Verruck, S.; de Liz, G.R.; Dias, C.O.; de Mello Castanho Amboni, R.D.; Prudencio, E.S. Effect of full-fat goat’s milk and prebiotics use on Bifidobacterium BB-12 survival and on the physical properties of spray-dried powders under storage conditions. Food Res. Int. 2019, 119, 643–652. [Google Scholar] [CrossRef] [PubMed]
  6. Milinčić, D.D.; Kostić, A.Ž.; Gašić, U.M.; Lević, S.; Stanojević, S.P.; Barać, M.B.; Tešić, Ž.L.; Nedović, V.; Pešić, M.B. Skimmed Goat’s Milk Powder Enriched with Grape Pomace Seed Extract: Phenolics and Protein Characterization and Antioxidant Properties. Biomolecules 2021, 11, 965. [Google Scholar] [CrossRef] [PubMed]
  7. George, S.; Pavan Kumar, M.V.; Rohini Kumar, B. Investigating the impact of spray drying parameters on milk powder bio fortification with curcumin and veld grape extract. Food Hum. 2025, 4, 100572. [Google Scholar] [CrossRef]
  8. Yu, T.; Jing, S.; Jiaxin, L.; Aixia, W.; Mengzi, N.; Xue, G.; Lili, W.; Liya, L.; Fengzhong, W.; Litao, T. Effects of Milling Methods on Rice Flour Properties and Rice Product Quality: A Review. Rice. Sci. 2024, 31, 33–46. [Google Scholar] [CrossRef]
  9. Brazil. Instrução Normativa MAPA no 28, de 12 de junho de 2007: Regulamento Técnico Para Fixação de Identidade e Qualidade de Composto Lácteo. 2007. Available online: https://www.normasbrasil.com.br/norma/?id=76488 (accessed on 20 July 2025).
  10. AOAC. Official Methods of Analysis of the Association of Official Analytical Chemists, 18th ed.; Association of Official Analytical Chemists: Gaithersburg, MD, USA, 2005. [Google Scholar]
  11. Reddy, R.S.; Ramachandra, C.T.; Hiregoudar, S.; Nidoni, U.; Ram, J.; Kammar, M. Influence of processing conditions on functional and reconstitution properties of milk powder made from Osmanabadi goat milk by spray drying. Small Rumin. Res. 2014, 119, 130–137. [Google Scholar] [CrossRef]
  12. Hailu, Y.; Maidannyk, V.A.; Murphy, E.G.; McCarthy, N.A. Improving the physical and wettability properties of skim milk powders through agglomeration and lecithination. J. Food Eng. 2023, 357, 111597. [Google Scholar] [CrossRef]
  13. Singleton, V.L.; Rossi, J.A. Colorimetry of total phenolics with phosphomolybdic-phosphotungstic acid reagents. Am. J. Enol. Vitic. 1965, 16, 144–158. [Google Scholar] [CrossRef]
  14. Burin, V.M.; Ferreira-Lima, N.E.; Panceri, C.P.; Bordignon-Luiz, M.T. Bioactive compounds and antioxidant activity of Vitis vinifera and Vitis labrusca grapes: Evaluation of different extraction methods. Microchem. J. 2014, 114, 155–163. [Google Scholar] [CrossRef]
  15. Prestes, A.A.; de Kacia Souza Coelho, B.; de Oliveira Mindelo, L.J.; Carvalho, A.C.F.; de Gois, J.S.; Andrade, D.R.M.; de Souza, C.K.; Helm, C.V.; da Cruz, A.G.; Prudencio, E.S. Development and chemical, physical, functional, and multi-element profile characterization of Requeijão with guabiroba pulp. Processes 2025, 13, 1322. [Google Scholar] [CrossRef]
  16. Carvalho, A.C.F.; Hoffmann, T.G.; Helm, C.V.; Prudêncio, E.S.; Roy, S.; de Souza, C.K. Smart biopolymer based on rice husk extracts and Pinhão failure applied as an interlayer for sliced mozzarella cheese. J. Vinyl Addit. Technol. 2025, 1–14. [Google Scholar] [CrossRef]
  17. da Cunha, T.M.P.; da Silva Haas, I.C.; da Costa, M.A.J.L.; Luna, A.S.; de Gois, J.S.; Amboni, R.D.D.M.C.; Prudencio, E.S. Dairy powder enriched with a soy extract (Glycine max): Physicochemical and polyphenolic characteristics, physical and rehydration properties and multielement composition. Food Res. Int. 2022, 162, 112144. [Google Scholar] [CrossRef] [PubMed]
  18. Pugliese, A.; Cabassi, G.; Chiavaro, E.; Paciulli, M.; Carini, E.; Mucchetti, G. Physical characterization of whole and skim dried milk powders. J. Food Sci. Technol. 2017, 54, 3433–3442. [Google Scholar] [CrossRef] [PubMed]
  19. Saipriya, K.; Deshwal, G.K.; Singh, A.K.; Kapila, S.; Sharma, H. Effect of dairy unit operations on immunoglobulins, colour, rheology and microbiological characteristics of goat milk. Int. Dairy, J. 2021, 121, 105118. [Google Scholar] [CrossRef]
  20. Lee, H.S.; Coates, G.A. Effect of thermal pasteurization on Valencia orange juice color and pigments. LWT-Food Sci. Technol. 2003, 36, 153–156. [Google Scholar] [CrossRef]
  21. Li, Y.H.; Wang, W.J.; Guo, L.; Shao, Z.P.; Xu, X.J. Comparative study on the characteristics and oxidation stability of commercial milk powder during storage. J. Dairy Sci. 2019, 102, 8785–8797. [Google Scholar] [CrossRef] [PubMed]
  22. Morris, A.; Boeneke, C.; King, J.M. Comparison of Storage Stability and In Vitro Digestion of Rice Flour-Based Yogurt Alternatives Made with Lactobacillus rhamnosus Lgg to Milk-Based Yogurt. Foods 2025, 14, 1129. [Google Scholar] [CrossRef] [PubMed]
  23. Alsaleem, K.A.; Hamouda, M.E.A. Optimizing probiotic low-fat yogurt: The benefits of incorporating defatted rice bran for enhanced quality and functionality. Food Sci. Nutr. 2024, 12, 10242–10254. [Google Scholar] [CrossRef] [PubMed]
  24. Deshwal, G.K.; Singh, A.K.; Kumar, D.; Sharma, H. Effect of spray and freeze drying on physico-chemical, functional, moisture sorption and morphological characteristics of camel milk powder. LWT 2020, 134, 110117. [Google Scholar] [CrossRef]
  25. Lamolha, M.A.; Serra, C.H.D.R. Avaliação das propriedades de fluxo dos granulados e dissolução de comprimidos de hidroclorotiazida 50 mg obtidos por granulação úmida. Rev. Bras. Cienc. Farm. 2007, 43, 435–446. [Google Scholar] [CrossRef]
  26. Lin, Q.; Xiao, H.; Fu, X.; Tian, W.; Li, L.; Yu, F. Physico-chemical properties of flour, starch, and modified starch of two rice varieties. Agric. Sci. China 2011, 10, 960–968. [Google Scholar] [CrossRef]
  27. Shahidi, F.; Ambigaipalan, P. Phenolics and polyphenolics in foods, beverages and spices: Antioxidant activity and health effects—A review. J. Funct. Foods 2015, 18, 820–897. [Google Scholar] [CrossRef]
  28. Aalim, H.; Islam Shishir, M.R.; Yosri, N.; Arslan, M.; Tahir, H.E.; Hashim, S.B.H.; Karim, N.; Zhai, X.; Li, Z.; Zhou, C.; et al. Systematic review of the digestive fate of rice phenolic compounds: Insights into bioavailability, influencing factors, encapsulation strategies, and health implications. Trends Food Sci. Technol. 2025, 156, 104833. [Google Scholar] [CrossRef]
  29. Ansori, F.A.Z.; Nisa, F.C.; Mubarok, A.Z. Functional products based on goat milk with the addition of natural antioxidants: Scientific review. J. Ilmu Teknol. Hasil Ternak 2024, 19, 217–229. [Google Scholar] [CrossRef]
  30. Delgadillo-Puga, C.; Noriega, L.G.; Morales-Romero, A.M.; Nieto-Camacho, A.; Granados-Portillo, O.; Rodríguez-López, L.A.; Alemán, G.; Furuzawa-Carballeda, J.; Tovar, A.R.; Cisneros-Zevallos, L.; et al. Goat’s milk intake prevents obesity, hepatic steatosis and insulin resistance in mice fed a high-fat diet by reducing inflammatory markers and increasing energy expenditure and mitochondrial content in skeletal muscle. Int. J. Mol. Sci. 2020, 21, 5530. [Google Scholar] [CrossRef] [PubMed]
  31. Delgadillo-Puga, C.; Cuchillo-Hilario, M.; León-Ortiz, L.; Ramírez-Rodríguez, A.; Cabiddu, A.; Navarro-Ocaña, A.; Morales-Romero, A.M.; Medina-Campos, O.N.; Pedraza-Chaverri, J. Goats’ feeding supplementation with Acacia farnesiana pods and their relationship with milk composition: Fatty acids, polyphenols, and antioxidant activity. Animals 2019, 9, 515. [Google Scholar] [CrossRef] [PubMed]
  32. Goufo, P.; Trindade, H. Rice antioxidants: Phenolic acids, flavonoids, anthocyanins, proanthocyanidins, tocopherols, tocotrienols, γ-oryzanol, and phytic acid. Food Sci. Nutr. 2014, 2, 75–104. [Google Scholar] [CrossRef] [PubMed]
  33. Ma, B.; Al-Wraikat, M.; Shu, Q.; Yang, X.; Liu, Y. An overview of interactions between goat milk casein and other food components: Polysaccharides, polyphenols, and metal ions. Foods 2024, 13, 2903. [Google Scholar] [CrossRef] [PubMed]
  34. Avinash, G.; Sharma, N.; Prasad, K.R.; Kaur, R.; Singh, G.; Pagidipala, N.; Thulasinathan, T. Unveiling the distribution of free and bound phenolic acids, flavonoids, anthocyanins, and proanthocyanidins in pigmented and non-pigmented rice genotypes. Front. Plant Sci. 2024, 15, 1324825. [Google Scholar] [CrossRef] [PubMed]
  35. Shao, Y.; Xu, F.; Sun, X.; Bao, J.; Beta, T. Phenolic acids, anthocyanins, and antioxidant capacity in rice (Oryza sativa L.) grains at four stages of development after flowering. Food Chem. 2014, 143, 90–96. [Google Scholar] [CrossRef] [PubMed]
  36. Chen, L.; Li, X.; Li, Z.; Deng, L. Analysis of 17 elements in cow, goat, buffalo, yak, and camel milk by inductively coupled plasma mass spectrometry (ICP-MS). RSC Adv. 2020, 10, 6736–6742. [Google Scholar] [CrossRef] [PubMed]
  37. Currò, S.; De Marchi, M.; Claps, S.; Salzano, A.; De Palo, P.; Manuelian, C.; Neglia, G. Differences in the detailed milk mineral composition of Italian local and Saanen goat breeds. Animals 2019, 9, 412. [Google Scholar] [CrossRef] [PubMed]
  38. Pan, J.; Yu, Z.; Dai, J.; Jiang, H.; Shi, C.; Du, Q.; Zhu, W.; Bari, L.; Fan, R.; Wang, J.; et al. Effect of processing methods on the distribution of mineral elements in goat milk fractions. J. Dairy Sci. 2024, 107, 5449–5459. [Google Scholar] [CrossRef] [PubMed]
  39. Pérez-Rodríguez, M.; Dirchwolf, P.M.; Rodríguez-Negrín, Z.; Pellerano, R.G. Assessing mineral profiles for rice flour fraud detection by principal component analysis based data fusion. Food Chem. 2021, 339, 128125. [Google Scholar] [CrossRef] [PubMed]
Figure 1. Visual characteristics of samples of powdered goat’s milk (C1), rice flour (C2), and dairy compounds added to powdered goat’s milk and rice flour, where DC 10, DC 20, DC 30, DC 40, and DC 49 are dairy compounds with 10, 20, 30, 40, and 49% substitution of powdered whole goat’s milk with rice flour, respectively.
Processes 13 02324 g001
Figure 2. Micrographs resulting from scanning electron microscopy (SEM) of dairy compound samples at magnification of 500×: (A) DC10 sample, (B) DC20 sample; (C) DC30 sample; (D) DC40 sample; (E) DC49 sample; (F) control 1 sample; and (G) control 2 sample.
Processes 13 02324 g002
Table 1. The descriptions and ingredients of the samples of the dairy compound with powdered goat’s milk and rice flour.
SampleGoat’s Milk Powder (%) (m/m)Rice Flour (%) (m/m)
Control 11000
Control 20100
DC 109010
DC 208020
DC 307030
DC 406040
DC 495149
Table 2. The results (mean ± standard deviation) of the chemical and nutritional compositions obtained for control 1 (whole goat’s milk powder), control 2 (rice flour), and milk compounds with a substitution of 10, 20, 30, 40, and 49% (m/m) of whole goat’s milk powder with rice flour.
ResultsControl 1Control 2DC 10DC 20DC 30DC 40DC 49
Water activity (aw)0.33 b ± 0.010.42 a ± 0.010.28 c ± 0.010.31 bc ± 0.010.30 c ± 0.010.31 bc ± 0.010.33 b ± 0.01
Total solids content (g/100 g)10.0 a ± 0.510.1 a ± 0.610.1 a ± 0.510.0 a ± 0.510.0 a ± 0.510.0 a ± 0.510.0 a ± 0.6
Total protein content (g/100 g)27.0 a ± 0.29.3 g ± 0.325.2 b ± 0.223.5 c ± 0.221.7 d ± 0.219.9 e ± 0.218.3 f ± 0.2
Total lipid content (g/100 g)32.0 a ± 0.21.0 g ± 0.128.9 b ± 0.225.6 c ± 0.222.7 d ± 0.219.6 e ± 0.216.8 f ± 0.2
Carbohydrates (g/100 g)31.0 g ± 0.479.6 a ± 0.835.8 f ± 0.440.7 e ± 0.545.6 d ± 0.550.4 c ± 0.654.8 b ± 0.6
Energy value(kcal)520.0 a ± 2.3362.2 g ± 1.1504.1 b ± 1.4487.2 c ± 1.5473.5 d ± 1.5457.6 e ± 1.6443.6 f ± 1.6
(kJ)2170.0 a ± 9.61538.1 g ± 4.72150.8 b ± 4.22038.6 c ± 6.41950.9 d ± 6.41920.3 e ± 7.01864.3 f ± 12.7
Note: The results expressed as the mean ± standard deviation (n = 3). a–g On the same line, different lowercase letters indicate a difference between the samples (p < 0.05).
Table 3. The results of the color parameters obtained for control sample 1 (whole goat’s milk powder), control sample 2 (rice flour), and the dairy compounds with a substitution of 10%, 20%, 30%, 40%, and 49% (m/m) of whole goat’s milk powder with rice flour.
SampleColor Parameters
L*a*b*ΔE*1ΔE*2
Control 195.57 a ± 0.12−3.26 a ± 0.05 11.09 a ± 0.12-6.62
Control 293.81 b ± 0.26−0.17 f ± 0.045.51 d ± 0.166.62-
DC 1095.37 a ± 0.17−3.40 a ± 0.3910.12 b ± 0.661.005.84
DC 2095.52 a ± 0.33−2.72 b ± 0.0510.01 b ± 0.261.205.45
DC 3095.54 a ± 0.33−2.51 c ± 0.079.71 b ± 0.361.575.11
DC 4095.54 a ± 0.52−2.34 d ± 0.099.46 b ± 0.291.874.83
DC 4994.93 a ± 0.51−2.07 e ± 0.018.81 c ± 0.042.653.97
Note: The results expressed as the mean ± standard deviation (n = 3). a–f In the same column, different superscript lowercase letters indicate a difference between the samples (p < 0.05). ΔE*1 is the difference in color parameters between control 1 sample (goat’s milk) and the other samples (control 2, and rice flour and milk compounds 10, 20, 30, 40, and 49). ΔE*2 is the difference in color parameters between control 2 sample (rice flour) and the other samples (control 1 and dairy compounds 10, 20, 30, 40, and 49).
Table 4. The results for physical properties such as aerated bulk density, compacted density, and fluidity and cohesiveness via the Carr index and the Hausner rate, respectively; powder flow obtained through the angle of repose; and the wettability index of control 1 (whole goat’s milk powder), control 2 (rice flour), and dairy compounds with a substitution of 10, 20, 30, 40, and 49% (m/m) of whole goat’s milk powder with rice flour.
Physical PropertiesSamples
Control 1Control 2DC 10DC 20DC 30DC 40DC 49
Aerated bulk density (g/cm3)0.47 d ± 0.01 0.63 a ± 0.020.43 d ± 0.050.45 d ± 0.010.50 c ± 0.010.51 c ± 0.010.50 b ± 0.01
Compacted density (g/cm3)0.52 c ± 0.030.77 a ± 0.020.48 c ± 0.040.53 c ± 0.010.59 b ± 0.030.60 b ± 0.010.60 b ± 0.02
Carr index (%)10.64 d ± 0.2322.22 a ± 0.42 11.63 d ± 0.9017.78 c ± 0.13 18.00 c ± 0.21 17.64 c ± 0.15 20.00 b ± 0.50
Hausner ratio1.11 a ± 0.111.22 b ± 0.031.12 a ± 0.011.18 b ± 0.011.18 b ± 0.011.18 b ± 0.011.20 b ± 0.02
Flowability (°)84.00 a ± 1.0087.00 a ± 2.0083.00 a ± 2.00 83.00 a ± 2.0083.00 a ± 2.0083.00 a ± 2.0084.00 a ± 1.00
Wettability (s)120.0 a ± 1.1025.5 g ± 0.5091.0 b ± 0.8070.0 c ± 0.4051.0 d ± 0.5047.4 e ± 0.3034.9 f ± 0.30
Note: The results expressed as the mean ± standard deviation (n = 3). a–g On the same line, different lowercase letters indicate a difference between the samples (p < 0.05).
Table 5. Total phenolic content (TPC) in dairy compounds of powdered goat’s milk with rice flour.
SampleTPC
(mg GAE·100 g−1)
Control 137.98 ± 1.45 d
Control 233.77 ± 1.94 e
DC 1048.53 ± 4.64 a
DC 2044.49 ± 3.02 b
DC 3044.56 ± 6.42 b
DC 4040.33 ± 1.57 c
DC 4939.16 ± 2.67 cd
Note: mg GAE·100 g−1 of gallic acid. a–e Different and superscript lowercase letters, expressed on the same line, indicate significant differences between samples (p < 0.05).
Table 6. Quantification of individual phenolic compounds (µg/g) of dairy compounds (DC10, DC20, DC30, DC40, DC49, control 1, and control 2).
Phenolic Compound DetectedLOQ (µg/g)LOD (µg/g)Quantification (µg/g)
Gallic acid0.07 ± 0.010.02 ± 0.0010.08 ± 0.01
Protocatechuic acid0.06 ± 0.010.02 ± 0.0010.07 ± 0.01
Vanillic acid0.60 ± 0.010.2 ± 0.0010.72 ± 0.05
Siringic acid0.50 ± 0.010.2 ± 0.0010.61 ± 0.04
trans-Cinnamic acid0.40 ± 0.010.1 ± 0.0010.47 ± 0.03
Caffeic acid0.006 ± 0.0010.002 ± 0.00010.008 ± 0.001
p-Coumaric acid0.07 ± 0.010.02 ± 0.0010.08 ± 0.01
Rutin0.03 ± 0.010.01 ± 0.0010.05 ± 0.01
Quercetin0.60 ± 0.010.2 ± 0.0010.67 ± 0.05
Note: Results expressed as mean ± standard deviation (n = 3). LOQ, limit of quantification. LOD, limit of detection.
Table 7. Multi-element profile results of control 1, control 2, DC 10, DC 20, DC 30, DC 40, and DC 49 samples.
Element (µg/g)Samples
Control 1Control 2DC 10DC 20DC 30DC 40DC 49
Ca9485 ± 89 a47 ± 5.4 g8566 ± 184 b7656 ± 123 c6680 ± 211 d5756 ± 146 e4693 ± 44 f
Cu0.84 ± 0.04 g3.1 ± 0.1 a0.95 ± 0.04 f1.2 ± 0.05 e1.4 ± 0.1 d1.6 ± 0.1 c1.8 ± 0.1 b
FePresent11.5 ± 0.8 a2.7 ± 0.3 b1.4 ± 0.1 dPresent2.3 ± 0.2 c2.4 ± 0.4 c
K16,883 ± 189 a465 ± 9 g15,302 ± 299 b13,655 ± 206 c12,003 ± 367 d10,358 ± 268 e8525 ± 67 f
Mg1074 ± 4.0 a174 ± 0.1 f938 ± 12 b858 ± 13 c843 ± 31 c725 ± 8.0 d631 ± 34 e
Mn0.35 ± 0.03 g6.1 ± 0.1 a1.0 ± 0.1 f1.4 ± 0.1 e2.1 ± 0.1 d2.5 ± 0.1 c3.0 ± 0.2 b
Na3274 ± 32 aPresent2954 ± 54 b2628 ± 46 c2281 ± 68 d1943 ± 60 e1580 ± 18 f
P18,116 ± 121 a1346 ± 25 g16,286 ± 331 b14,745 ± 216 c13,160 ± 427 d11,456 ± 247 e9667 ± 96 f
Zn27.8 ± 0.2 a18.9 ± 0.3 f26.4 ± 0.3 b25.1 ± 0.3 c26.3 ± 0.9 b24.7 ± 0.4 d23.2 ± 1.1 e
AlPresentPresentPresentPresentPresentPresentPresent
Cd<LOD<LOD<LOD<LOD<LOD<LOD<LOD
Cr<LOD<LOD<LOD<LOD<LOD<LOD<LOD
The results expressed as the mean ± standard deviation (n = 3). a–g On the same line, different lowercase letters indicate a difference between the samples (p < 0.05). LOD, limit of detection (Cd = 0.5 µg/g; Cr = 0.4 µg/g). LOQ, limit of quantification (Fe = 1.0 µg/g; Al = 5.0 µg/g; Cd = 1.5 µg/g; Cr = 1.1 µg/g). Present indicates that the element was detected in the sample at levels above the limit of detection (LOD) but below the limit of quantification (LOQ), confirming its presence.
Disclaimer/Publisher’s Note: The statements, opinions and data contained in all publications are solely those of the individual author(s) and contributor(s) and not of MDPI and/or the editor(s). MDPI and/or the editor(s) disclaim responsibility for any injury to people or property resulting from any ideas, methods, instructions or products referred to in the content.

