Article

Optimizing Bioactive Compound Recovery from Chestnut Shells Using Pressurized Liquid Extraction and the Box–Behnken Design

by
Magdalini Pazara
1,
Georgia Provelengiadi
1,
Martha Mantiniotou
1,
Vassilis Athanasiadis
1,
Iordanis Samanidis
1,
Ioannis Makrygiannis
1,
Ilias F. Tzavellas
2,
Ioannis C. Martakos
2,
Nikolaos S. Thomaidis
2 and
Stavros I. Lalas
1,*
1
Department of Food Science and Nutrition, University of Thessaly, Terma N. Temponera Street, 43100 Karditsa, Greece
2
Laboratory of Analytical Chemistry, Department of Chemistry, National and Kapodistrian University of Athens, 15771 Athens, Greece
*
Author to whom correspondence should be addressed.
Processes 2025, 13(7), 2283; https://doi.org/10.3390/pr13072283
Submission received: 30 June 2025 / Revised: 14 July 2025 / Accepted: 16 July 2025 / Published: 17 July 2025
(This article belongs to the Special Issue Research of Bioactive Synthetic and Natural Products Chemistry)

Abstract

Chestnut (Castanea sativa Mill.) is an edible nut recognized for its nutritional attributes, particularly its elevated levels of carbohydrates (starch) and proteins. Chestnuts are popular for their health-promoting properties and hold significant environmental and economic importance in Europe. During this study, after the characterization of the fruit, attention was directed toward the valorization of chestnut shells, a predominant by-product of industrial chestnut processing that is typically discarded. Valuable bioactive compounds were extracted from the shells using Pressurized Liquid Extraction (PLE), a green, efficient, scalable method. Response surface methodology (RSM) was utilized to determine optimal extraction conditions, identified as 40% v/v ethanol as the solvent at a temperature of 160 °C for 25 min under a constant pressure of 1700 psi. High total polyphenol content (113.68 ± 7.84 mg GAE/g dry weight) and notable antioxidant activity—determined by FRAP (1320.28 ± 34.33 μmol AAE/g dw) and DPPH (708.65 ± 24.8 μmol AAE/g dw) assays—were recorded in the optimized extracts. Ultrahigh-performance liquid chromatography coupled with a hybrid trap ion mobility-quadrupole time-of-flight mass spectrometer (UHPLC-TIMS-QTOF-MS) was applied to further characterize the compound profile, enabling the identification of phenolic and antioxidant compounds. These findings highlight the possibility of using chestnut shell residues as a long-term resource to make valuable products for the food, medicine, cosmetics, and animal feed industries. This study contributes to the advancement of waste valorization strategies and circular bioeconomy approaches.

1. Introduction

The genus Castanea encompasses four main species groups. The most notable member of this genus is Castanea sativa, which is indigenous mainly to Europe. Historically, chestnuts, or C. sativa, have been used as a valuable source of food, medicine, and lumber [1]. Furthermore, hardy wood of C. sativa has been utilized for building, furniture making, and even tannin production [1]. The shells of chestnuts contain 5–6% tannins [2]. Because of its tannin concentration, it is frequently utilized in the paint industry to obtain a brown color. Fruits that are edible have 40–50% carbohydrates, mostly starch, followed by sucrose, 5% protein, and 5% fat [3,4]; 40–50% moisture; and 1.5–2% ash. It comprises over 80% different types of fatty acids. Among these fatty acids are oleic, linoleic, and palmitic [2]. It comprises vitamins A, B1, B2, B3, B6, and E, in addition to minerals such as Ca, Mg, K, Mn, P, Na, and Zn, along with substantial quantities of vitamin C found in its fruit [5]. The fruits exhibit considerable antioxidant activity linked to their polyphenolic and organic constituents [6]. The fruits are processed into approximately 150 distinct products, including chestnut sugar, chocolate-covered chestnuts, chestnut cream, and mash [2].
Beyond their nutritional richness, chestnut by-products—particularly shells—represent a promising source of bioactive compounds with industrial relevance. Chestnuts possess notable nutritional attributes, featuring substantial quantities of dietary fiber and minimal crude fat content (primarily composed of unsaturated fatty acids) ranging from 2% to 5%. In contrast to conventional nuts, such as almonds, walnuts, and hazelnuts, chestnuts serve as a high energy source, offering various health benefits. Regarding the dry chestnut fruit, the primary constituents of the fruit are carbohydrates, comprising 75–91%, with starch being the most significant at 39–82%, followed by sucrose at 18–22%. The presence of these polysaccharides, along with raffinose, fructose, and glucose, compounds present in considerable amounts, can aid in the determination of a particular cultivar [3]. Currently, the incorporation of these elements into the human diet is strongly advocated [7]. Consequently, chestnut fruits have gained significant relevance in the human diet, attributable to their composition, nutritional value, and related health advantages, including their incorporation into gluten-free diets for individuals with celiac disease [8], reducing abdominal adiposity [9], and diminishing the incidence of coronary heart disease and cancer [10]. The increasing demand for traditional foods has transformed chestnuts into a valuable source, presenting a significant opportunity to be used as functional foods or food ingredients [6]. Given that cooked chestnuts serve as a valuable source of phenolics, such as gallic and ellagic acids, as well as organic acids, like citric acid, and possess a low fat content—attributes linked to beneficial health effects—it is advisable to promote the development of new products derived from chestnuts [6]. The process of peeling chestnuts results in a substantial quantity of both outer and inner shells, which account for roughly 10% of the total weight of the chestnut [11]. At present, factories incinerate this residue to address disposal challenges; however, it may serve as an optimistic resolution for the generation of biologically active compounds derived from a cost-effective and underutilized resource. Indeed, both the outer and inner shells of chestnuts comprise 2.7–5.2% (w/w) of phenolic compounds, which have antioxidant properties [12], and about 36% (w/w) of sugars that can be used as raw material for biofuel production [13]. The use of chestnut shells for the recovery of bioactive compounds, apart from the economic benefits, as these compounds can be exploited by industries producing pharmaceuticals, cosmetics, and food supplements, will also have an environmental benefit, as the waste will no longer need to be incinerated, significantly reducing their environmental footprint.
Pressurized Liquid Extraction (PLE) has been extensively utilized over the last years as an innovative extraction technique [14]. The principle of PLE is to apply high pressures (between 35 and 200 bar) in order to increase the mass transfer by enhancing cellular permeability. Additionally, increased temperatures enhance the solvent’s diffusion into the sample. Moreover, it improves the extraction rate by augmenting the solubility of the desired molecule and promoting mass transfer. This process is straightforward, ensures safe and rapid extraction, minimizes solvent use, shortens the extraction time, and delivers great reproducibility and accuracy [15,16]. Up to this point, there have been numerous applications of PLE on plant- and food-based waste. PLE has been successfully applied on spent coffee grounds [17], red wine pomace [18], pomegranate peels [19], but also on hemp residue post-supercritical CO2 extraction [20].
Chestnuts are fruits with a wide range of applications and the study of their extracts by PLE seems to be very promising. Moreover, the application of “green”, non-toxic solvents for the recovery of bioactive compounds from plant materials is now of paramount importance. The aim of this research is to study the combination of the above-mentioned technique with chestnut peels and to examine extraction performance. Response surface methodology (RSM) was applied to carry out the optimization of crucial extraction parameters. This study investigated the effect of temperature and extraction length on the process, along with the effects of green solvent mixtures, such as water and ethanol. The optimal conditions were identified utilizing a partial least squares (PLS) model.

2. Materials and Methods

2.1. Chemicals and Reagents

Methanol (LC-MS grade) and iron (III) chloride hexahydrate (97%) were purchased from Merck (Darmstadt, Germany). A Milli-Q purification apparatus (Millipore Direct-Q UV, Bedford, MA, USA) was used to provide distilled water. Ammonium acetate, ammonium formate, and sodium hydroxide monohydrate used for trace analysis ≥99.9995% and formic acid 99% were purchased from Fluka (Buchs, Switzerland). Regenerated cellulose syringe filters (RC filters, pore size 0.2 μm, diameter 15 mm) were acquired from Phenomenex (Torrance, CA, USA). A deionizing column was used to produce deionized water for all the experiments performed. Acetonitrile was from Labkem (Barcelona, Spain). Rutin (≥94%), formic acid (99.8%), and sodium carbonate (anhydrous, 99.5%) were from Penta (Prague, Czech Republic). L-ascorbic acid (99%), 2,2-diphenyl-1-picrylhydrazyl (DPPH), 2,4,6-tris(2-pyridyl)-s-triazine (TPTZ) (≥98%), Bradford reagent, bovine serum albumin, Tris base, and hydrochloric acid (37%) were purchased from Sigma-Aldrich (Darmstadt, Germany). Folin-Ciocalteu reagent, ethanol (99.8%), and gallic acid (97%) were provided by Panreac Co. (Barcelona, Spain).

2.2. Chestnut Material

The chestnut fruits were collected from Pelion Mountain, Thessaly, Greece (at 39°40′99″ N and 23°13′28″ E, at a latitude of 533 m, based on Google Earth version 9.185.0.0) on 28 September 2024. Chestnuts from the Castanea sativa cultivar were donated by a local chestnut grower (Oikotexnia Chioti). The fruits were stored at 4 °C until further handling. The entire shells, including both the outer and inner layers, were manually separated using a ceramic knife. The inner shells, which directly encase the kernel, were carefully removed by hand for further analysis. Samples were then freeze-dried at −54 °C and 7 Pa for 24 h using a Biobase BK-FD10P lyophilizer (Biobase, Jinan, China). The dried shells were ground and stored at −40 °C until use. The chestnut fruits themselves were put in an oven (Binder BD56, Bohemia, NY, USA) at 60 °C for 24 h to remove humidity, ground, and preserved under the same conditions.

2.3. Calculation of Nutritional Value of Chestnut Fruits

A modified procedure adopted from Delima and Trio [21] was used to extract proteins from samples of chestnut fruit using a Tris-HCl buffer [21]. Protein quantification was performed as established by Bradford [22], and a calibration curve of bovine serum albumin (BSA) as the standard reference was used. Total carbohydrate content was determined through titration with Fehling’s reagent, using methylene blue as an indicator, allowing the estimation of both reducing and non-reducing sugars in aqueous chestnut fruit extracts [23]. Lipids were extracted using Soxhlet extraction with petroleum ether as the solvent. Caloric content was calculated using the following Atwater general factors: 4 kcal per gram of protein, 4 kcal per gram of carbohydrate, and 9 kcal per gram of fat, based on the values obtained from the experimental analysis. This approach provided an estimate of the total energy content expressed in kilocalories per 100 g of raw chestnuts.

2.4. Design of the Experimental Procedure

RSM using a Box–Behnken design with three factors at three levels was employed to optimize the extraction conditions for total polyphenol content (TPC), total tannin content (TTC), and antioxidant activity (evaluated via ferric-reducing antioxidant power (FRAP) and DPPH assays) using the PLE method on chestnut shell powder. The Box–Behnken design was picked for its ability to yield rapid results, employing a central composite technique that effectively minimizes certain runs to preserve the definition of higher-order surfaces. This design does not depend on complete or fractional factorial designs and necessitates fewer experimental runs [24]. A PLE system (Fluid Management Systems, Inc., Watertown, MA, USA) was employed to execute every extraction [25]. The PLE instrument was operating at 1700 psi pressure level throughout all extractions, and the solid-to-liquid ratio was also constant, at 1:20 g/mL, based on preliminary experiments. The independent variables examined included the solvent composition, and more specifically the aqueous ethanol concentration (C, % v/v) as X1, process temperature (T, °C) as X2, and duration (t, min) as X3, each assigned the following three coded levels: low (−1), medium (0), and high (+1), as detailed in Table 1. The choice of the solvent was based on the variation in its polarity, and for this reason three levels were chosen: one of low, one of intermediate and one of high polarity. The temperature level choice and the extraction duration were based on preliminary experiments. To assess procedure repeatability, a total of 15 experimental runs were carried out, each of which was reproduced three times and included three central points. The average response values were recorded for further examination.
The predictive precision of the model was improved through the stepwise regression by minimizing variance associated with unnecessary term estimation. This process results in a second-order polynomial equation that characterizes the interactions among the three independent variables:
Y k = β 0 + i = 1 2 β i X i + i = 1 2 β i i X i 2 + i = 1 2 j = i + 1 3 β i j X i X j
where Yk defines the expected response variable, and Xi and Xj represent the independent variables. The linear, quadratic, and interaction factors in the model are represented by the intercept and regression coefficients β0, βi, βii, and βij, respectively.

2.5. Spectrophotometric Determinations

2.5.1. Total Polyphenolic Content (TPC)

The previous Folin–Ciocalteu method [26] was employed to assess the TPC, and the results are expressed as mg of gallic acid equivalents (GAE) per g of dry weight (dw). The calibration curve (10–100 mg/L of gallic acid, R2 = 0.9996) in the aqueous solution was employed in a photometric test at a wavelength of 740 nm, utilizing a Shimadzu UV-1900i UV/Vis spectrophotometer (Kyoto, Japan). Samples were incubated at a temperature of 40 °C using an Elmasonic P70H ultrasonic bath from Elma Schmidbauer GmbH (Singen, Germany). All analyses were conducted in triplicate, and the final result was the average of these, which was utilized to assess the outcomes.

2.5.2. Total Tannin Content (TTC)

The TTC was measured using the vanillin assay with catechin as the standard according to the method of Sun et al. [27]. In brief, 0.2 mL of the diluted sample extract was mixed with 1 mL of 1% (w/v) vanillin in methanol and 1 mL of 25% (v/v) sulfuric acid in methanol. The mixture was then incubated for 15 min at 30 °C in a water bath, and the absorbance was subsequently measured at a wavelength of 500 nm using a spectrophotometer. A blank solution using methanol instead of the vanillin solution was also prepared. The results are reported as mg of catechin equivalents (CtE) per g of dw. A calibration curve constructed with catechin standard solutions (0 to 200 mg/L) was used to evaluate the results.

2.5.3. Ferric-Reducing Antioxidant Power (FRAP) Evaluation of Antioxidant Activity

The antioxidant ability of the extracts were assessed through the FRAP assay that was established in a previous study [28]. This procedure involves detecting the reduction of Fe3+ to Fe2+, which presents a characteristic blue color. Ascorbic acid was used as a standard reference (50–500 μM in 0.05 M HCl, R2 = 0.9997), and so the results are expressed as μmol of ascorbic acid equivalents (AAE) per g of dw. All analyses were performed in triplicate, and the results evaluated comprise their average.

2.5.4. Evaluation of DPPH Radical Scavenging Activity

A protocol described in another study [29] for DPPH scavenging was used. Ascorbic acid in methanol was used as a reference of the antiradical activity (100–1000 μmol/L, R2 = 0.9926), and the results are expressed as μmol AAE per g of dw. All analyses were conducted in a total of three, and their average was used to evaluate the antiradical scavenging activity.

2.6. Colorimetric Analysis

The CIELAB color coordinates (L*, a*, and b*) of the extracts were established using a Lovibond CAM-System 500 colorimeter (The Tintometer Ltd., Amesbury, UK). This instrument allowed the precise assessment of lightness (L*), redness/greenness (a*), and yellowness/blueness (b*), providing a standardized evaluation of extract color characteristics.

2.7. UHPLC-TIMS-QTOF-MS Analysis

Ultrahigh-performance liquid chromatography (UHPLC) from the Elute LC series (Bruker Daltonics, Bremen, Germany) was utilized in conjunction with a hybrid trap ion mobility-quadrupole time-of-flight (QTOF) mass spectrometer (TIMS-QTOF-MS) (timsTOF Pro, Bruker Daltonics, Bremen, Germany) for sample analysis. The compounds were identified by calculating the masses of the deprotonated and protonated ions from their molecular formulas using the Isotope Pattern tool (Bruker DataAnalysis software, version 4.4, Bruker Daltonics, Bremen, Germany), and extracting EICs in DataAnalysis 6.2 (Bruker software, Bruker Daltonics, Bremen, Germany). Chromatographic separation was conducted using an Elute UHPLC system with a Solo C18 column (2.1 × 100 mm, 1.8 μm) (Bruker Daltonics), maintained at 40 °C. In the negative ionization mode, the mobile phase included water/methanol (90:10 v/v, solvent A) and methanol (solvent B), each containing 5 mM of ammonium acetate. In the positive ionization mode, the mobile phase included water/methanol in a 90/10 ratio (solvent A) and methanol (solvent B), each containing 5 mM ammonium formate and 0.01% formic acid. A gradient elution protocol was implemented in both ionization modes, commencing with 1% B (flow rate of 0.2 mL/min) for 1 min, subsequently elevated to 39% over 2 min, and ultimately increased to 99.9% (flow rate of 0.4 mL/min) over an additional 11 min. The B gradient elution protocol was maintained at a constant flow rate of 0.48 mL/min for 2 min; the initial chromatographic conditions were reinstated by re-equilibrating the column for 3 min. The injection volume was established at 5 μL.

2.8. Statistical Analysis

JMP® Pro 16 program (SAS, Cary, NC, USA) was utilized to perform statistical analyses of response surface methodology (RSM) and distribution analysis. The quantitative studies were performed in triplicate, and each batch of chestnut extracts underwent the extraction procedure at least twice. The normality of the data was evaluated using the Kolmogorov–Smirnov test. One-way analysis of variance (ANOVA) and the Tukey HSD multiple comparison test were employed to determine any significant differences. The findings are reported as averages and variability metrics.

3. Results and Discussion

3.1. Chestnut Fruit’s Nutritional Value

The nutritional value per 100 g of raw, peeled chestnuts is presented in Table 2. The chestnut sample had a moisture content of 54%, which falls within the expected range of 50–60% reported in the literature [30]. Borges et al. [31] determined a similar fat content (1.97 g/100 g chestnut) in the “Soutos da Lapa” cultivar, consistent with the results of our study. Regarding carbohydrates, Barreira et al. [32] studied four different chestnut cultivars and established similar amounts of carbohydrates, ranging from 41.6 to 44.1 g per 100 g of fruit. Notably, our sample exhibited a significantly higher carbohydrate content, measured at 56.4 g per 100 g, of which 12.5 g were sugars. This elevated carbohydrate concentration could be associated with varietal differences. Moreover, local climate conditions—such as temperature fluctuations, rainfall patterns, and sunlight exposure—likely influence the biochemical composition of chestnuts, particularly in the accumulation of starches and sugars during maturation.

3.2. Optimization of PLE Parameters

Considering there are a lot of bioactive compounds, which means there are a lot of variations in polarity and solubility, it can make adjusting the extraction method difficult [33]. The antioxidant activity and extract yield are both affected by the extraction process and its parameters. There have been major developments in extraction technology recently that reduce the need for harmful organic solvents, safeguard human health, and utilize minimal resources. The integration of an environmentally benign solvent is crucial for the successful application of this technique [34]. Water is considered the best solvent for polar molecules because it is accessible, sustainable, cost-effective, and non-toxic. Additionally, organic solvents are frequently used to improve extraction. One extraction solvent that has found utility in food companies is ethanol–water [35]. All these factors were considered, and various parameters were evaluated, including solvent composition, extraction temperature, and duration. Table 3 presents how these variables influence the responses under investigation. Table 4 displays the results of the color analysis coordinates, while Table 5 summarizes the ANOVA applied to the RSM quadratic polynomial model.

3.3. Model Analysis

Equations (2)–(5) represent regression models related to the extraction process, predicting key response variables: TPC, TTC, FRAP, and DPPH. The complex correlations among experimental variables are highlighted by the incorporation of linear, quadratic, and interaction components in each equation. The models comprised exclusively of significant terms. The regression models highlight the impact of solvent composition, temperature, and time on extraction efficacy. The linear and quadratic terms indicate non-linear correlations between factors, suggesting that ideal circumstances for maximal antioxidant yield exist. The extraction conditions, especially solvent composition (X1), significantly affect the TPC and DPPH equations. The presence of interaction terms signifies that antioxidant potential is affected by the synergistic impacts of several variables, highlighting the importance of meticulous parameter optimization. Moreover, extended extraction periods enhance the solubility of a larger quantity of bioactive chemicals, such as antioxidants, in the solvent. The ideal extraction time range is signified by the presence of quadratic terms (X12, X22) and interactions (X1X3). The interaction terms indicate that extraction time is not functioning independently. The interplay between extraction duration and temperature in FRAP and DPPH, as indicated by X2X3, implies that antioxidant capacity is affected by these factors.
TPC = −34.46 + 1.65X1 + 0.59X2 + 0.76X3 − 0.02X12
TTC = −11.71 + 0.23X1 + 0.20X2 − 0.002X12 − 0.001X22
FRAP = 1348.69 + 19.35X1 − 5.19X2 − 77.57X3 − 0.26X12 + 0.63X2X3
DPPH = 24.31 + 10.31X1 + 0.73X2 − 14.82X3 − 0.12X12 + 0.17X2X3
Table 6 presents the predicted optimal conditions for the PLE parameters, together with the estimated values for total phenolic content (TPC), total tannin content (TTC), ferric-reducing antioxidant power (FRAP), and DPPH radical scavenging activity. Additionally, the table includes the model’s overall desirability score.

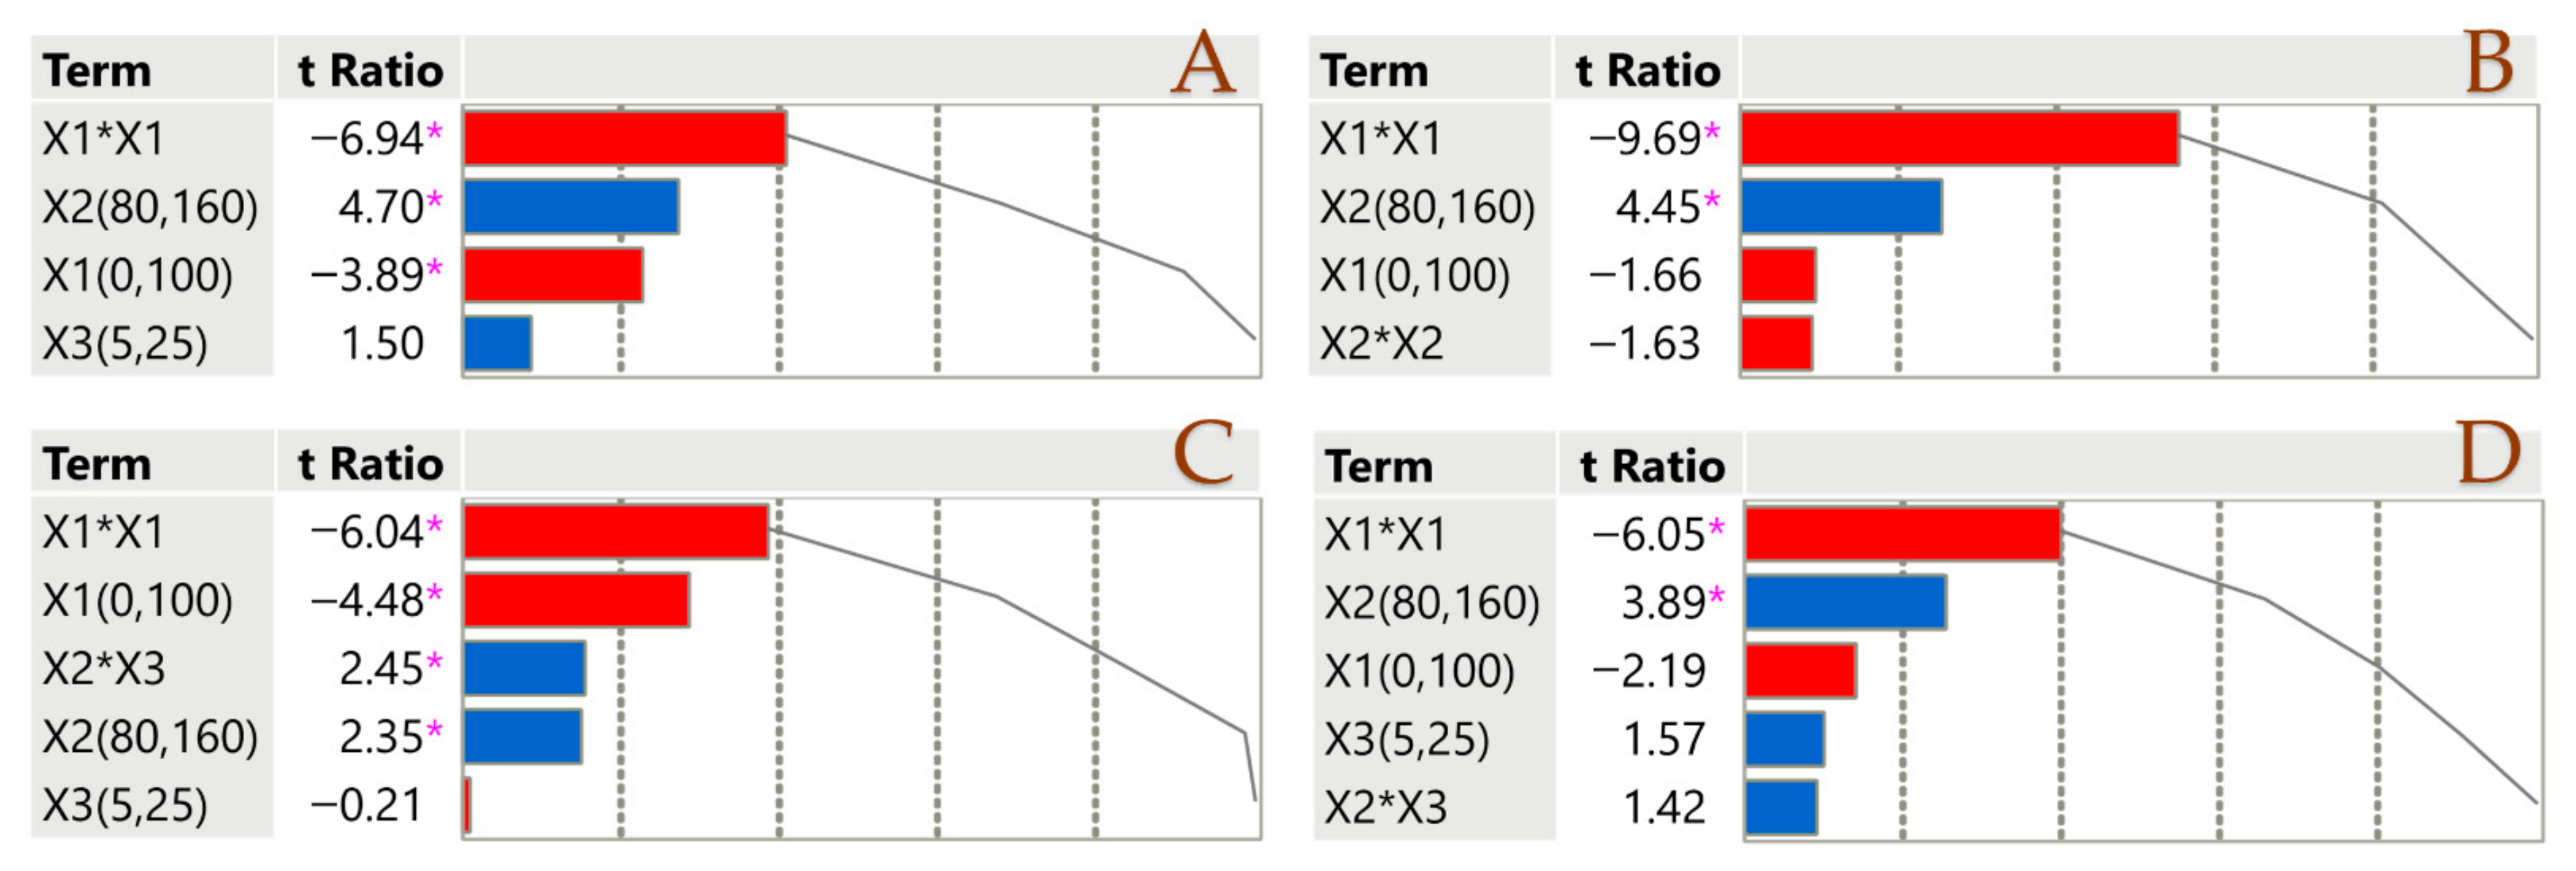
3.4. Impact of Extraction Parameters on Assays Through Pareto Plot Analysis

Division of the parameter estimate by its standard error yields the t-ratio in a Pareto plot (Figure 1). In order to determine how significant each parameter estimate is, this ratio is essential. To see how well each estimate accounts for the data, look at the cumulative line in the figure, which is the sum of all the absolute t-ratios. For the sake of clarity, the diagram uses certain colors: blue for a positive impact and red for a negative impact. When the p-value is less than 0.05, a pink asterisk (*) denotes statistical significance. Factor X1 has a negative impact on all parameters. This could be attributed to the fact that the solvent composition is crucial, as its polarity profoundly affects chemical extraction [36]. The solvent’s great efficacy in recovering polar compounds confirms the necessity of a binary solvent to improve extraction effectiveness. Factor X2 affects positively all parameters, which proves that elevated temperatures lead to high performances when it comes to PLE.

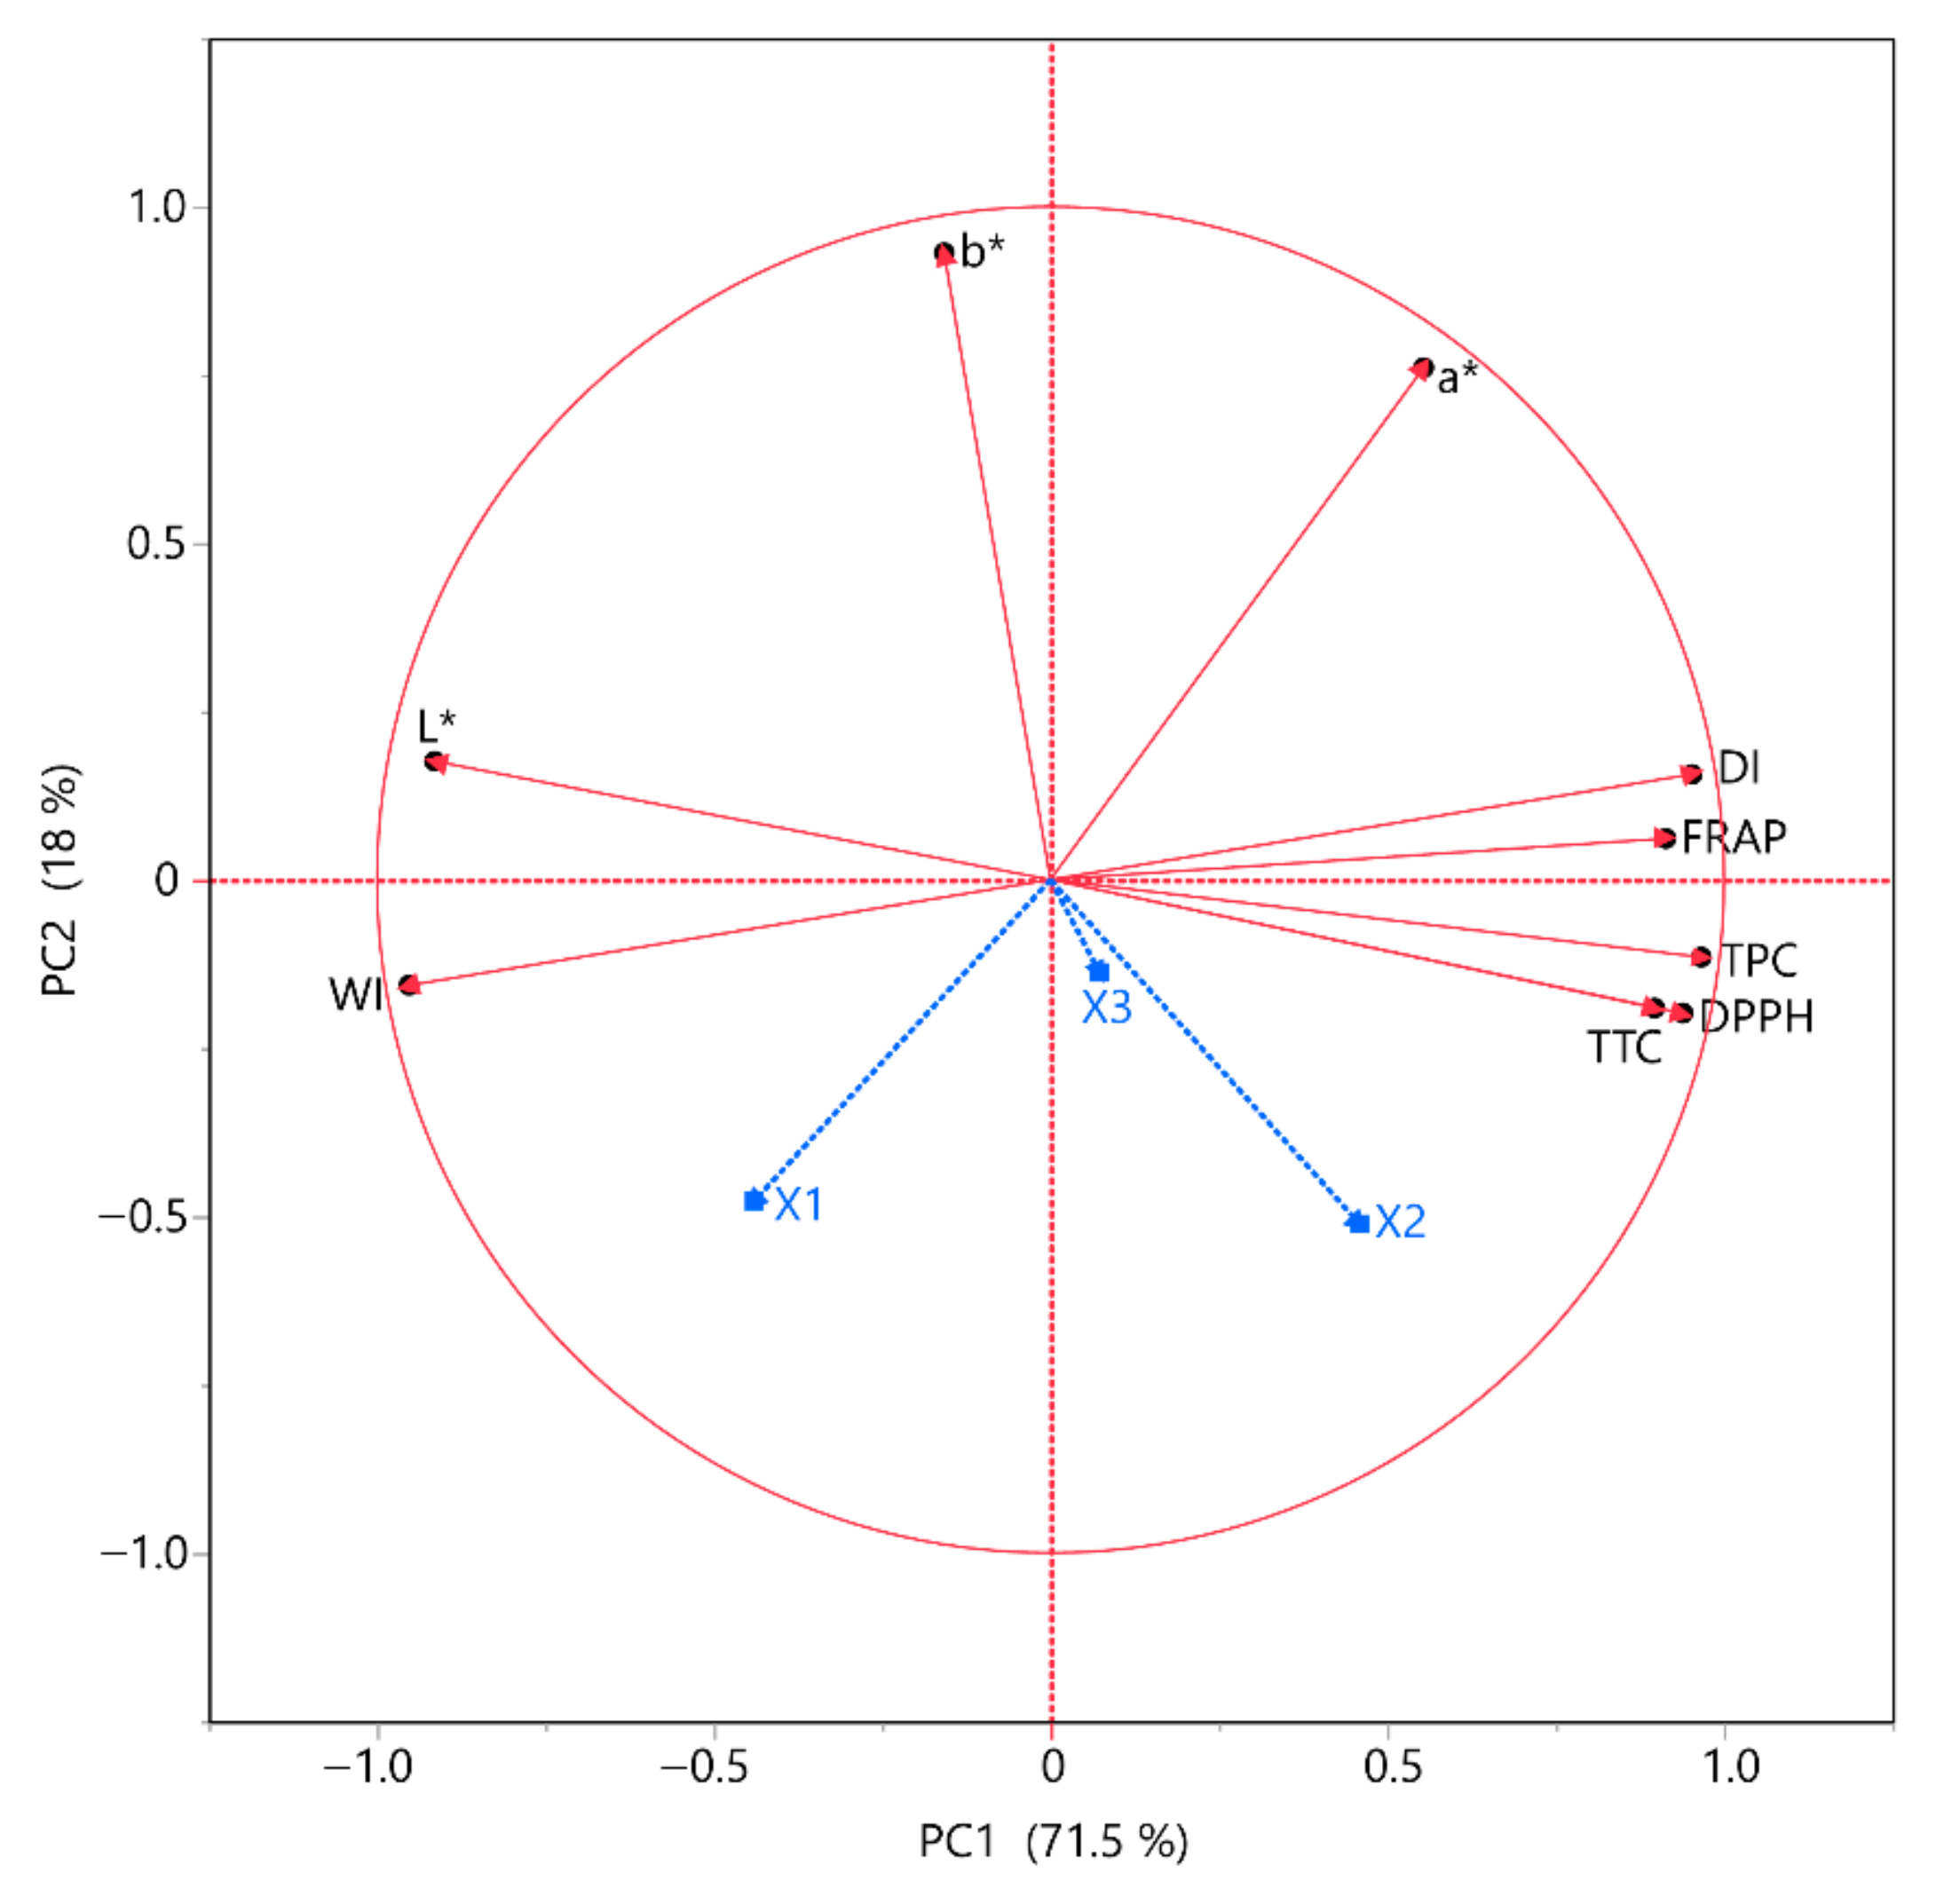
3.5. Principal Component Analysis (PCA) and Multivariate Component Analysis (MCA)

To gain a better understanding of the responses and how they were correlated, we used principal component analysis (Figure 2) and multivariate correlation analysis (MCA) (Table 7). The goal of multivariate data analysis (MCA) is to find patterns and correlations between many variables all at once, while principal component analysis (PCA) is used to show a multivariate data table as a reduced collection of variables (summary indices) to help spot trends, anomalies, clusters, and outliers. Using principal component analysis (PCA) to examine complex datasets helps shed light on the data and how they relate to other variables. According to PCA, it is once again validated that the solvent composition has a negative correlation with all the other parameters. It is also obvious that the antioxidant assays, namely FRAP and DPPH, slightly differ from one another. As for MCA, TPC, and DPPH seem to have a high positive correlation with one another. FRAP appears to have a negative correlation with TPC, TTC, and DPPH.

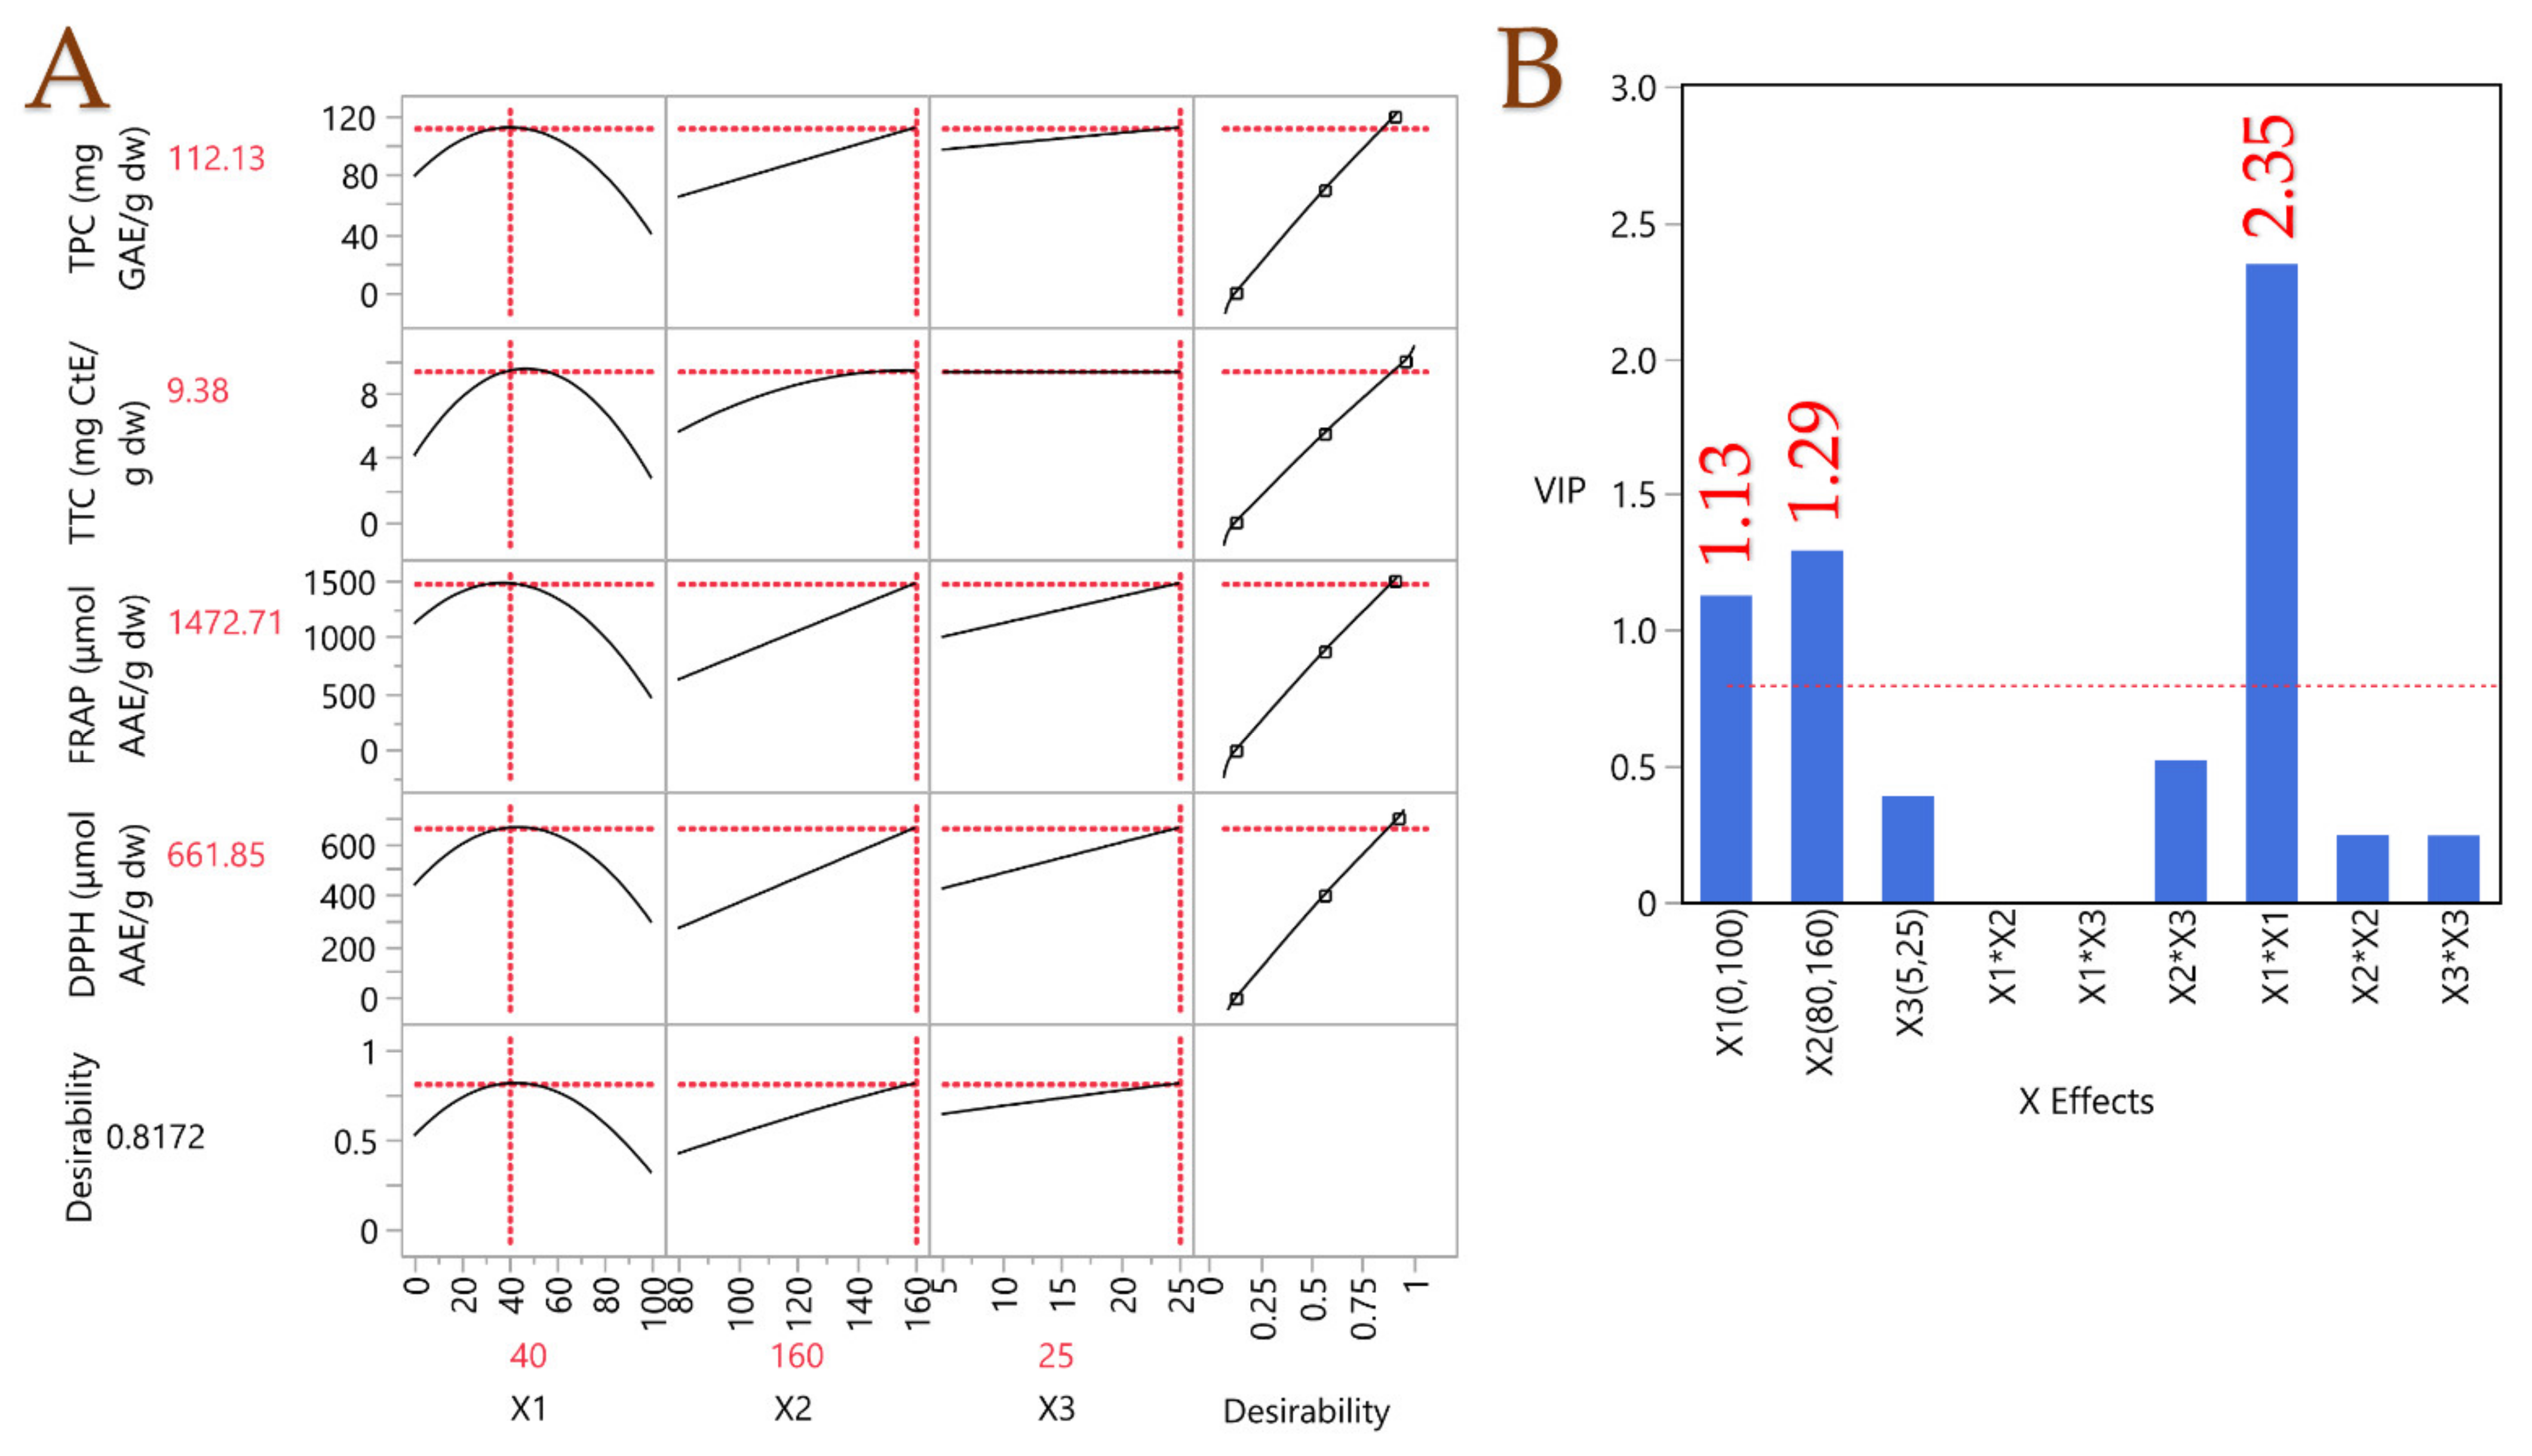
3.6. Partial Least Squares (PLS) Analysis

A PLS model was applied to assess the extraction parameters’ impact. Figure 3 displays the prediction profiler together with the desirability function, which incorporates extrapolation control and is accompanied by a variable importance plot (VIP). It became clear that a moderate polarity solvent, comprising 40% v/v aqueous ethanol, was ideal for optimal recovery. This outcome is consistent with the notion that the average polarity of the solvent can facilitate the dissolution of both higher- and lower-polarity substances concurrently, in contrast to the dissolution properties of a high- or low-polarity solvent. Moreover, a high temperature (160 °C) and long extraction duration (25 min) were proven to lead to high recovery rates, thus confirming the principle of PLE discussed above. The optimal extraction conditions were assessed accordingly. Following the optimization of the PLE parameters, a simple stirring-assisted extraction (STE) was carried out to investigate and compare the impact of PLE on the recovery of bioactive compounds and to determine whether these compounds undergo degradation. STE was performed under the same conditions in terms of liquid-to-solid ratio, solvent and extraction duration, with the only difference being the extraction temperature. The temperature of 40 °C was chosen to avoid any degradation of the bioactive compounds. In Table 8, the results of the analyses on the optimal PLE extract and the STE extract are depicted. The PLE extract exhibited a ~500%-times-higher TPC recovery, which implies the superiority of PLE on chestnut shells. A similar pattern was observed for all experimental values. PLE seems to perform very well in recovering polyphenols from chestnut shells, and in other work [37], the amounts recovered were up to 153% less than in the present study. Vella et al. [12] determined a TPC of 17.68 mg GAE/g in chestnut through STE, ~543% lower than the one determined through PLE, thus enhancing the claim that PLE performs exceptionally on chestnut shells. Fuente-Maqueda et al. [38] studied chestnut leaves and heartwood, and they determined the tannin content in them. The tannin content was significantly lower than that in chestnut shells, 0.11 mg CtE/g fresh weight. In another study by Vázquez et al. [39] on chestnut shells, through mechanical stirring, the TPC was almost the same as in this study, but the antioxidant activity assessed by FRAP was significantly lower. Yang et al. [40] also studied the TPC on chestnut shells, and they yielded a ~30% lower result. Based on these observations, it appears that PLE is a promising technique for the recovery of bioactive compounds from chestnut shells, compared to other conventional or non-conventional techniques.
The experimental results and PLS model predictions demonstrate a high degree of agreement, indicated by a correlation coefficient of 0.995 and a coefficient of determination (R2) value of 0.991. Moreover, a p-value of less than 0.0001 suggests that the differences between the actual and predicted values are statistically insignificant.
Figure 4 illustrates a comparison of the darkness index (DI) values for chestnut shell extracts obtained via two techniques: PLE and STE. The DI for PLE was significantly higher at 67.0 ± 1.3 compared to 48.1 ± 1.4 for STE, indicating that PLE extracts yield a noticeably darker product. This difference, marked as statistically significant (p < 0.05), suggests that the intensified conditions of PLE—such as elevated pressure and temperature—facilitate the extraction of pigments or color-enhancing compounds more effectively than the conventional STE. The result underscores the superior efficiency of PLE in producing darker, potentially more concentrated extracts for applications requiring intense coloration.

3.7. Compound Identification

In Table 9, the results of the compounds’ identification through UHPLC-TIMS-QTOF-MS are presented. The parameters established in this instance were as follows: a mass accuracy threshold of up to 5 ppm, an isotopic fit of 100 mSigma or less, a minimum peak area threshold of 2000, a minimum ion intensity threshold of 800, and a peak score (ratio of peak area to intensity) exceeding 4 (the optimal peak score should range between 4 and 38 [41]). The MS/MS fragments were analyzed and validated utilizing in silico fragmentation methods, including MetFrag [42]. The experimental retention time (Rt) of each chemical was compared with the predicted Rt using an in-house model based on the Quantitative Structure–Retention Relationship (QSRR) [43]. Compound identification was also confirmed by comparing their MS/MS fragment ions with literature data.
The UHPLC-TIMS-QTOF-MS analysis of chestnut shell PLE and STE extracts revealed the presence of 15 secondary metabolites tentatively identified in the negative or positive ionization mode, depending on their presence and best ionization profile (Table 9). More specifically, the extracts were found to contain two alpha-hydroxy acids (compounds 1 and 3), one hydroxycarboxylic acid (compound 2), one trihydroxy benzoic acid (compound 5), one hydroxycinnamic acid (compound 7), and in the series of amino acids one amino acid (compound 4) and a methylated amino acid derivative (compound 6). Additionally, the extracts contained a gallic acid derivative (compound 8) and two ellagic acid methylated derivatives (compounds 13 and 15). In the category of flavonoids, the extracts also contained a flavanol aglycone (compound 10), two flavone aglycones (compounds 12 and 14), a dihydrochalcone (compound 11), and a procyanidin dimer (compound 9). Both extracts were similar under this qualitative screening, with all compounds present in both extracts, except for compounds 4 and 11, absent in the PLE extract, and compound 8 absent in the STE extract. These slight variations may reflect differences in ionization efficiency, compound solubility, or chromatographic retention, and warrant further investigation in future studies. However, the underlying causes of these minor differences were beyond the scope of the present study and may warrant investigation in future research.
Numerous studies have focused on investigating chestnut shell secondary metabolites by applying novel extraction techniques, such as deep eutectic solvents [44], subcritical water extraction [45], and microwave-assisted extraction [46]. As mentioned in a previous study, the secondary metabolites depicted in Table 9 have also been detected in chestnut shells [37]. They span various classes, i.e., organic acids, amino acids and derivatives, phenolic acids and derivatives, flavonoids and tannins, and ellagic acid derivatives, each with distinct nutritional roles, potential health benefits, and other uses.
Among the group of organic/amino acids and derivatives (compounds 1, 2, 3, 4, 6), malic (1) and citric (3) acids, which are key components of the Krebs cycle, have been used as an additive in pharmaceutical, food, and beverage industries [47,48]; quinic acid (2) has been studied as a nutritional supplement to prevent the negative consequences of high-fat-diet (HFD) consumption [49]; arginine (4) has been extensively studied for its therapeutic application in clinical nutrition [50]; and betaine (6) has been used as a preventative agent for the treatment of a variety of diseases [51].
Among the group of phenolic acids and derivatives (compounds 5, 7, 8), gallic acid (5) has been acknowledged for its therapeutic (anticancer, cardioprotective, anti-inflammatory) uses and food applications [52]; galloylglucose (8), which is also classified as the simplest member of galloyltannins, may exhibit antioxidant properties attributed to the galloyl moiety [53]; and caffeic acid (7) exerts various biological properties, such as antibacterial, antioxidant, anti-atherosclerotic, anti-inflammatory, cardioprotective, and others [54].
In the group of flavonoids and tannins (compounds 9, 10, 11, 12, 14), the C-C B type dimer (9) may exhibit antioxidant, anticancer, anti-inflammatory, immunosuppressive, antibacterial, and other activities [55]; catechin (10) has been studied for its anti-obesity, neuroprotective, anticardiovascular, anticancer anti-infectious, antidiabetic, and hepatoprotective effects [56]; phloretin (11) exhibits therapeutic benefits against various diseases [57]; luteolin (12) possesses four major biological activities, i.e., antioxidant, anti-inflammatory, antibacterial, and anti-cancer [58]; and apigenin (14) has been studied for its beneficial uses for inflammatory-related diseases, including infection, diabetes, obesity, cancer, depression, insomnia, and hepatoprotective, respiratory, cardiovascular, neurodegenerative, and skin diseases [59].
Among the group of ellagic acid derivatives (compounds 13, 15), trimethyl ellagic acid (13) has been studied for its antitumor effects [60]; dimethyl ellagic acid (15) has been studied for its antimicrobial and antioxidant activities [61].

4. Conclusions

The present study demonstrated the very high efficiency of applying PLE to chestnut shells. The optimal PLE conditions led to an extract that exhibited high TPC recovery (~114 mg GAE/g dw), exceptional antioxidant activity (~1320 μmol AAE/g dw through FRAP and ~709 μmol AAE/g dw through DPPH), and a high TTC (~10 mg CtE/g dw). Remarkably, PLE proved to be much more efficient than STE, resulting in much higher yields. Analyses of the two extracts (PLE and STE) by UHPLC-TIMS-QTOF-MS revealed that the bioactive compounds had not been completely degraded, at least not to such an extent that they had not been detected at all, providing further support for the claim that PLE is used to isolate them from chestnut shells. This study’s findings underscore the efficacy of green extraction methods for by-products that can be employed in the production of food additives, animal feed, dietary supplements, and cosmetics. Furthermore, they provide an efficient eco-friendly solution for reducing waste in the food industry. In general, the PLE technique proved to be rapid, clean, and environmentally friendly for determining the active content in chestnut fruits and appears to be a promising technique that can be applied to a wide range of plant materials, fruits, and their by-products. Future research could address the shelf life of the products from chestnut shells and the antimicrobial activity of the extracts to shed more light on the utility of the new, enhanced products.

Author Contributions

Conceptualization, V.A. and S.I.L.; methodology, V.A.; software, V.A.; validation, V.A.; formal analysis, M.M., I.S., I.F.T., I.C.M. and V.A.; investigation, M.P., G.P., M.M., I.F.T., I.C.M. and I.M.; resources, S.I.L.; data curation, M.M. and I.S.; writing—original draft preparation, M.M. and I.S.; writing—review and editing, M.M., V.A. and S.I.L.; visualization, M.M. and V.A.; supervision, V.A., N.S.T. and S.I.L.; project administration, N.S.T. and S.I.L.; funding acquisition, S.I.L. All authors have read and agreed to the published version of the manuscript.

Funding

This research received no external funding.

Data Availability Statement

The original contributions presented in this study are included in the article. Further inquiries can be directed at the corresponding author.

Acknowledgments

The authors would like to acknowledge Oikotexnia Chioti (oikotexniachioti@gmail.com), located in Thessaly province, Greece, for providing the raw chestnuts.

Conflicts of Interest

The authors declare no conflicts of interest.

References

  1. Abdelwahab, S.I.; Taha, M.M.E.; Aljahdali, I.; Oraibi, B.; Alzahrani, A.; Farasani, A.; Alfaifi, H.; Babiker, Y. Exploring the Potential of Chestnut (Castanea sativa Mill.): A Comprehensive Review and Conceptual Mapping. Bull. Natl. Res. Cent. 2024, 48, 82. [Google Scholar] [CrossRef]
  2. Çobanoğlu, H.; Cantürk, U.; Koç, İ.; Kulaç, Ş.; Sevik, H. Climate Change Effect on Potential Distribution of Anatolian Chestnut (Castanea sativa Mill.) in the Upcoming Century in Turkiye. Forestist 2023, 73, 247–256. [Google Scholar] [CrossRef]
  3. Santos, M.J.; Pinto, T.; Vilela, A. Sweet Chestnut (Castanea Sativa Mill.) Nutritional and Phenolic Composition Interactions with Chestnut Flavor Physiology. Foods 2022, 11, 4052. [Google Scholar] [CrossRef] [PubMed]
  4. Poljak, I.; Vahčić, N.; Vidaković, A.; Tumpa, K.; Žarković, I.; Idžojtić, M. Traditional Sweet Chestnut and Hybrid Varieties: Chemical Composition, Morphometric and Qualitative Nut Characteristics. Agronomy 2021, 11, 516. [Google Scholar] [CrossRef]
  5. Antoniewska-Krzeska, A.; Grygorieva, O.; Zhurba, M.; Goncharovska, I.; Brindza, J. Chemical Composition of Castanea Sativa Mill. Fruits. Agrobiodivers. Improv. Nutr. Health Life Qual. 2023, 7, 218–225. [Google Scholar] [CrossRef]
  6. Ciucure, C.T.; Geana, E.-I.; Sandru, C.; Tita, O.; Botu, M. Phytochemical and Nutritional Profile Composition in Fruits of Different Sweet Chestnut (Castanea sativa Mill.) Cultivars Grown in Romania. Separations 2022, 9, 66. [Google Scholar] [CrossRef]
  7. Mota, M.; Pinto, T.; Vilela, A.; Marques, T.; Borges, A.; Caço, J.; Ferreira-Cardoso, J.; Raimundo, F.; Gomes-Laranjo, J. Irrigation Positively Affects the Chestnut’s Quality: The Chemical Composition, Fruit Size and Sensory Attributes. Sci. Hortic. 2018, 238, 177–186. [Google Scholar] [CrossRef]
  8. El Khoury, D.; Balfour-Ducharme, S.; Joye, I.J. A Review on the Gluten-Free Diet: Technological and Nutritional Challenges. Nutrients 2018, 10, 1410. [Google Scholar] [CrossRef]
  9. Rodrigues, P.; Ferreira, T.; Nascimento-Gonçalves, E.; Seixas, F.; Gil da Costa, R.M.; Martins, T.; Neuparth, M.J.; Pires, M.J.; Lanzarin, G.; Félix, L.; et al. Dietary Supplementation with Chestnut (Castanea sativa) Reduces Abdominal Adiposity in FVB/n Mice: A Preliminary Study. Biomedicines 2020, 8, 75. [Google Scholar] [CrossRef]
  10. Choupina, A.B. Nutritional and Health Potential of European Chestnut. Rev. Ciênc. Agrár. 2019, 42, 801–807. [Google Scholar] [CrossRef]
  11. Cacciola, N.A.; Squillaci, G.; D’Apolito, M.; Petillo, O.; Veraldi, F.; La Cara, F.; Peluso, G.; Margarucci, S.; Morana, A. Castanea sativa Mill. Shells Aqueous Extract Exhibits Anticancer Properties Inducing Cytotoxic and Pro-Apoptotic Effects. Molecules 2019, 24, 3401. [Google Scholar] [CrossRef]
  12. Vella, F.M.; Laratta, B.; La Cara, F.; Morana, A. Recovery of Bioactive Molecules from Chestnut (Castanea sativa Mill.) by-Products through Extraction by Different Solvents. Nat. Prod. Res. 2018, 32, 1022–1032. [Google Scholar] [CrossRef]
  13. Morana, A.; Squillaci, G.; Paixão, S.M.; Alves, L.; Cara, F.L.; Moura, P. Development of an Energy Biorefinery Model for Chestnut (Castanea sativa Mill.) Shells. Energies 2017, 10, 1504. [Google Scholar] [CrossRef]
  14. Fraguela-Meissimilly, H.; Bastías-Monte, J.M.; Vergara, C.; Ortiz-Viedma, J.; Lemus-Mondaca, R.; Flores, M.; Toledo-Merma, P.; Alcázar-Alay, S.; Gallón-Bedoya, M. New Trends in Supercritical Fluid Technology and Pressurized Liquids for the Extraction and Recovery of Bioactive Compounds from Agro-Industrial and Marine Food Waste. Molecules 2023, 28, 4421. [Google Scholar] [CrossRef] [PubMed]
  15. Martinez, A.S.; Lanaridi, O.; Stagel, K.; Halbwirth, H.; Schnürch, M.; Bica-Schröder, K. Extraction Techniques for Bioactive Compounds of Cannabis. Nat. Prod. Rep. 2023, 40, 676–717. [Google Scholar] [CrossRef] [PubMed]
  16. Picot-Allain, C.; Mahomoodally, M.F.; Ak, G.; Zengin, G. Conventional versus Green Extraction Techniques—A Comparative Perspective. Curr. Opin. Food Sci. 2021, 40, 144–156. [Google Scholar] [CrossRef]
  17. Christoforidis, A.; Mantiniotou, M.; Athanasiadis, V.; Lalas, S.I. Caffeine and Polyphenolic Compound Recovery Optimization from Spent Coffee Grounds Utilizing Pressurized Liquid Extraction. Beverages 2025, 11, 74. [Google Scholar] [CrossRef]
  18. Croxatto Vega, G.; Sohn, J.; Voogt, J.; Birkved, M.; Olsen, S.I.; Nilsson, A.E. Insights from Combining Techno-Economic and Life Cycle Assessment—A Case Study of Polyphenol Extraction from Red Wine Pomace. Resour. Conserv. Recycl. 2021, 167, 105318. [Google Scholar] [CrossRef]
  19. Hernández-Corroto, E.; Plaza, M.; Marina, M.L.; García, M.C. Sustainable Extraction of Proteins and Bioactive Substances from Pomegranate Peel (Punica granatum L.) Using Pressurized Liquids and Deep Eutectic Solvents. Innov. Food Sci. Emerg. Technol. 2020, 60, 102314. [Google Scholar] [CrossRef]
  20. Athanasiadis, V.; Mantiniotou, M.; Kalompatsios, D.; Makrygiannis, I.; Alibade, A.; Lalas, S.I. Evaluation of Antioxidant Properties of Residual Hemp Leaves Following Optimized Pressurized Liquid Extraction. AgriEngineering 2025, 7, 1. [Google Scholar] [CrossRef]
  21. Delima, D.; Trio, P. Method Validation for Protein Quantitation of Fish Muscle Tissues from Lake Taal, Batangas. KIMIKA 2019, 30, 5–16. [Google Scholar] [CrossRef]
  22. Bradford, M.M. A Rapid and Sensitive Method for the Quantitation of Microgram Quantities of Protein Utilizing the Principle of Protein-Dye Binding. Anal. Biochem. 1976, 72, 248–254. [Google Scholar] [CrossRef] [PubMed]
  23. Zhang, Y.; Chen, Q. Improving Measurement of Reducing Sugar Content in Carbonated Beverages Using Fehling’s Reagent. J. Emerg. Investig. 2020, 2, 1–6. [Google Scholar] [CrossRef] [PubMed]
  24. Wang, J.; Wan, W. Experimental Design Methods for Fermentative Hydrogen Production: A Review. Int. J. Hydrog. Energy 2009, 34, 235–244. [Google Scholar] [CrossRef]
  25. Pappas, V.M.; Athanasiadis, V.; Palaiogiannis, D.; Poulianiti, K.; Bozinou, E.; Lalas, S.I.; Makris, D.P. Pressurized Liquid Extraction of Polyphenols and Anthocyanins from Saffron Processing Waste with Aqueous Organic Acid Solutions: Comparison with Stirred-Tank and Ultrasound-Assisted Techniques. Sustainability 2021, 13, 12578. [Google Scholar] [CrossRef]
  26. Mantiniotou, M.; Athanasiadis, V.; Kalompatsios, D.; Lalas, S.I. Optimization of Carotenoids and Other Antioxidant Compounds Extraction from Carrot Peels Using Response Surface Methodology. Biomass 2025, 5, 3. [Google Scholar] [CrossRef]
  27. Sun, B.; Ricardo-da-Silva, J.M.; Spranger, I. Critical Factors of Vanillin Assay for Catechins and Proanthocyanidins. J. Agric. Food Chem. 1998, 46, 4267–4274. [Google Scholar] [CrossRef]
  28. Kalompatsios, D.; Athanasiadis, V.; Mantiniotou, M.; Lalas, S.I. Optimization of Ultrasonication Probe-Assisted Extraction Parameters for Bioactive Compounds from Opuntia Macrorhiza Using Taguchi Design and Assessment of Antioxidant Properties. Appl. Sci. 2024, 14, 10460. [Google Scholar] [CrossRef]
  29. Shehata, E.; Grigorakis, S.; Loupassaki, S.; Makris, D.P. Extraction Optimisation Using Water/Glycerol for the Efficient Recovery of Polyphenolic Antioxidants from Two Artemisia Species. Sep. Purif. Technol. 2015, 149, 462–469. [Google Scholar] [CrossRef]
  30. Pinto, D.; Delerue-Matos, C.; Rodrigues, F. Chestnut: Phytochemicals and Biological Activities. In Natural Products; Springer: Berlin/Heidelberg, Germany, 2025; pp. 1–38. ISBN 978-3-642-36202-6. [Google Scholar]
  31. Borges, O.; Gonçalves, B.; De Carvalho, J.L.S.; Correia, P.; Silva, A.P. Nutritional Quality of Chestnut (Castanea sativa Mill.) Cultivars from Portugal. Food Chem. 2008, 106, 976–984. [Google Scholar] [CrossRef]
  32. Barreira, J.C.M.; Casal, S.; Ferreira, I.C.F.R.; Oliveira, M.B.P.P.; Pereira, J.A. Nutritional, Fatty Acid and Triacylglycerol Profiles of Castanea sativa Mill. Cultivars: A Compositional and Chemometric Approach. J. Agric. Food Chem. 2009, 57, 2836–2842. [Google Scholar] [CrossRef]
  33. Thoo, Y.; Ng, S.Y.; Khoo, M.; Mustapha, W.; Ho, C. A Binary Solvent Extraction System for Phenolic Antioxidants and Its Application to the Estimation of Antioxidant Capacity in Andrographis paniculata Extracts. Int. Food Res. J. 2013, 20, 1103–1111. [Google Scholar]
  34. Athanasiadis, V.; Chatzimitakos, T.; Makrygiannis, I.; Kalompatsios, D.; Bozinou, E.; Lalas, S.I. Antioxidant-Rich Extracts from Lemon Verbena (Aloysia citrodora L.) Leaves through Response Surface Methodology. Oxygen 2024, 4, 1–19. [Google Scholar] [CrossRef]
  35. Chemat, F.; Rombaut, N.; Meullemiestre, A.; Turk, M.; Perino, S.; Fabiano-Tixier, A.-S.; Abert-Vian, M. Review of Green Food Processing Techniques. Preservation, Transformation, and Extraction. Innov. Food Sci. Emerg. Technol. 2017, 41, 357–377. [Google Scholar] [CrossRef]
  36. Mantiniotou, M.; Bujor, B.-C.; Athanasiadis, V.; Chatzimitakos, T.; Kalompatsios, D.; Kotsou, K.; Bozinou, E.; Lalas, S.I. Response Surface Methodology-Aided Optimization of Bioactive Compound Extraction from Apple Peels Through Pulsed Electric Field Pretreatment and Ultrasonication. Eng 2024, 5, 2886–2901. [Google Scholar] [CrossRef]
  37. Nam, M.; Yu, J.M.; Park, Y.R.; Kim, Y.-S.; Kim, J.-H.; Kim, M.-S. Metabolic Profiling of Chestnut Shell (Castanea crenata) Cultivars Using UPLC-QTOF-MS and Their Antioxidant Capacity. Biomolecules 2022, 12, 1797. [Google Scholar] [CrossRef] [PubMed]
  38. Fuente-Maqueda, F.; Rodríguez, A.; Majada, J.; Fernández, B.; Feito, I. Methodology Optimization for the Analysis of Phenolic Compounds in Chestnut (Castanea sativa Mill.). Food Sci. Technol. Int. 2020, 26, 520–534. [Google Scholar] [CrossRef]
  39. Vázquez, G.; Freire, M.S.; Santos, J.; Antorrena, G.; González-Álvarez, J. Optimisation of Polyphenols Extraction from Chestnut Shell by Response Surface Methodology. Waste Biomass Valorization 2010, 1, 219–225. [Google Scholar] [CrossRef]
  40. Yang, F.; Wei, D.; Li, J.; Xie, C. Chestnut Shell Represents a Rich Source of Polyphenols: Preparation Methods, Antioxidant Activity and Composition Analysis of Extractable and Non-Extractable Polyphenols. Eur. Food Res. Technol. 2023, 249, 1273–1285. [Google Scholar] [CrossRef]
  41. Gago-Ferrero, P.; Schymanski, E.L.; Bletsou, A.A.; Aalizadeh, R.; Hollender, J.; Thomaidis, N.S. Extended Suspect and Non-Target Strategies to Characterize Emerging Polar Organic Contaminants in Raw Wastewater with LC-HRMS/MS. Environ. Sci. Technol. 2015, 49, 12333–12341. [Google Scholar] [CrossRef]
  42. Wolf, S.; Schmidt, S.; Müller-Hannemann, M.; Neumann, S. In Silico Fragmentation for Computer Assisted Identification of Metabolite Mass Spectra. BMC Bioinform. 2010, 11, 148. [Google Scholar] [CrossRef]
  43. Aalizadeh, R.; Thomaidis, N.S.; Bletsou, A.A.; Gago-Ferrero, P. Quantitative Structure–Retention Relationship Models To Support Nontarget High-Resolution Mass Spectrometric Screening of Emerging Contaminants in Environmental Samples. J. Chem. Inf. Model. 2016, 56, 1384–1398. [Google Scholar] [CrossRef]
  44. Li, Z.; Cheng, C.; Zhang, L.; Xue, J.; Sun, Q.; Wang, H.; Cui, R.; Liu, R.; Song, L. Extraction of Pigments from Chestnut (Castanea mollissima) Shells Using Green Deep Eutectic Solvents: Optimization, HPLC-MS Identification, Stability, and Antioxidant Activities. Food Chem. 2025, 488, 144916. [Google Scholar] [CrossRef]
  45. Cravotto, C.; Grillo, G.; Binello, A.; Gallina, L.; Olivares-Vicente, M.; Herranz-López, M.; Micol, V.; Barrajón-Catalán, E.; Cravotto, G. Bioactive Antioxidant Compounds from Chestnut Peels through Semi-Industrial Subcritical Water Extraction. Antioxidants 2022, 11, 988. [Google Scholar] [CrossRef] [PubMed]
  46. Kocer, S.; Utku Copur, O.; Ece Tamer, C.; Suna, S.; Kayahan, S.; Uysal, E.; Cavus, S.; Akman, O. Optimization and Characterization of Chestnut Shell Pigment Extract Obtained Microwave Assisted Extraction by Response Surface Methodology. Food Chem. 2024, 443, 138424. [Google Scholar] [CrossRef] [PubMed]
  47. Diaz, A.B.; Blandino, A.; Caro, I. Value Added Products from Fermentation of Sugars Derived from Agro-Food Residues. Trends Food Sci. Technol. 2018, 71, 52–64. [Google Scholar] [CrossRef]
  48. Adetunji, A.I.; Oberholster, P.J.; Erasmus, M. From Garbage to Treasure: A Review on Biorefinery of Organic Solid Wastes into Valuable Biobased Products. Bioresour. Technol. Rep. 2023, 24, 101610. [Google Scholar] [CrossRef]
  49. Dong, J.; Zheng, H.; Zeng, Q.; Zhang, X.; Du, L.; Bais, S. Protective Effect of D-(−)-Quinic Acid as Food Supplement in Modulating AMP-Activated Protein Kinase Signalling Pathway Activation in HFD Induced Obesity. Hum. Exp. Toxicol. 2022, 41, 1–10. [Google Scholar] [CrossRef]
  50. Patel, V.B.; Preedy, V.R.; Rajendram, R. (Eds.) L-Arginine in Clinical Nutrition; Springer International Publishing: Cham, Switzerland, 2017; ISBN 978-3-319-26007-5. [Google Scholar]
  51. Arumugam, M.K.; Paal, M.C.; Donohue, T.M.; Ganesan, M.; Osna, N.A.; Kharbanda, K.K. Beneficial Effects of Betaine: A Comprehensive Review. Biology 2021, 10, 456. [Google Scholar] [CrossRef]
  52. Hadidi, M.; Liñán-Atero, R.; Tarahi, M.; Christodoulou, M.C.; Aghababaei, F. The Potential Health Benefits of Gallic Acid: Therapeutic and Food Applications. Antioxidants 2024, 13, 1001. [Google Scholar] [CrossRef]
  53. He, H.-F. Recognition of Gallotannins and the Physiological Activities: From Chemical View. Front. Nutr. 2022, 9, 888892. [Google Scholar] [CrossRef]
  54. Maity, S.; Kinra, M.; Nampoothiri, M.; Arora, D.; Pai, K.S.R.; Mudgal, J. Caffeic Acid, a Dietary Polyphenol, as a Promising Candidate for Combination Therapy. Chem. Pap. 2022, 76, 1271–1283. [Google Scholar] [CrossRef]
  55. Dasiman, R.; Nor, N.M.; Eshak, Z.; Mutalip, S.S.M.; Suwandi, N.R.; Bidin, H. A Review of Procyanidin: Updates on Current Bioactivities and Potential Health Benefits. Biointerface Res. Appl. Chem. 2021, 12, 5918–5940. [Google Scholar] [CrossRef]
  56. Isemura, M. Catechin in Human Health and Disease. Molecules 2019, 24, 528. [Google Scholar] [CrossRef]
  57. Nakhate, K.T.; Badwaik, H.; Choudhary, R.; Sakure, K.; Agrawal, Y.O.; Sharma, C.; Ojha, S.; Goyal, S.N. Therapeutic Potential and Pharmaceutical Development of a Multitargeted Flavonoid Phloretin. Nutrients 2022, 14, 3638. [Google Scholar] [CrossRef] [PubMed]
  58. Punia Bangar, S.; Kajla, P.; Chaudhary, V.; Sharma, N.; Ozogul, F. Luteolin: A Flavone with Myriads of Bioactivities and Food Applications. Food Biosci. 2023, 52, 102366. [Google Scholar] [CrossRef]
  59. Mushtaq, Z.; Sadeer, N.B.; Hussain, M.; Mahwish; Alsagaby, S.A.; Imran, M.; Mumtaz, T.; Umar, M.; Tauseef, A.; Al Abdulmonem, W.; et al. Therapeutical Properties of Apigenin: A Review on the Experimental Evidence and Basic Mechanisms. Int. J. Food Prop. 2023, 26, 1914–1939. [Google Scholar] [CrossRef]
  60. Bai, C.; Sun, Y.; Pan, X.; Yang, J.; Li, X.; Wu, A.; Qin, D.; Cao, S.; Zou, W.; Wu, J. Antitumor Effects of Trimethylellagic Acid Isolated from Sanguisorba officinalis L. on Colorectal Cancer via Angiogenesis Inhibition and Apoptosis Induction. Front. Pharmacol. 2020, 10, 1646. [Google Scholar] [CrossRef]
  61. Vigbedor, B.Y.; Akoto, C.O.; Neglo, D. Isolation and Characterization of 3,3′-Di-O-Methyl Ellagic Acid from the Root Bark of Afzelia africana and Its Antimicrobial and Antioxidant Activities. Sci. Afr. 2022, 17, e01332. [Google Scholar] [CrossRef]
Figure 1. Pareto plots illustrate the significance of parameter estimates for the PLE technique across TPC (A), TTC (B), FRAP (C), and DPPH (D), with a pink asterisk marking significant values (p < 0.05). Positive estimates are shown in blue, while negative ones are represented in red.
Processes 13 02283 g001
Figure 2. PCA for the measured variables. Each X variable is presented with a blue color.
Processes 13 02283 g002
Figure 3. Plot (A) illustrates the optimization of the PLE technique for chestnut shell extracts using a partial least squares (PLS) prediction profiler and a desirability function with extrapolation control. Plot (B) presents the variable importance plot (VIP) graph, showing the VIP values for each predictor variable in the PLE technique, with a red dashed line marking the 0.8 significance level.
Processes 13 02283 g003
Figure 4. Darkness index based on color analysis coordinates for the PLE chestnut shell extract, compared with the STE technique extract. The bars are filled with the corresponding extract colors using the appropriate HEX codes, derived from the measured L*, a*, and b* values. Statistically significant differences (p < 0.05) are indicated with lowercase letters (e.g., a, b) within each bar.
Processes 13 02283 g004
Table 1. Levels of independent variables included in the experimental design.
Independent VariablesCoded UnitsCoded Levels
−101
Ethanol concentration (C, % v/v)X1050100
Extraction temperature (T, °C)X280120160
Extraction duration (t, min)X351525
Table 2. Raw, peeled chestnuts’ nutritional value in the literature and experimentally.
Nutritive IngredientsQuantity per 100 g
(Literature [30])
Quantity per 100 g
(Current Study)
Calories (kcal)196256 ± 13
Proteins (g)2.02.0 ± 0.1
Fats (g)1.42.5 ± 0.1
Carbohydrates (g)44.056.4 ± 3.0
Of which sugars (g)10.612.5 ± 0.6
Table 3. Results from experiments measuring the effects of the PLE method on the three independent variables and the dependent variables.
Design PointIndependent VariablesActual PLE Responses *
C (%) (X1)T (°C) (X2)t (min) (X3)TPCTTCFRAPDPPH
1100 (1)120 (0)25 (1)8.071.4434.6543.27
250 (0)120 (0)15 (0)81.379.16990.31406.95
350 (0)120 (0)15 (0)79.889.18960.73408.91
4100 (1)120 (0)5 (−1)6.041.0830.3436.54
550 (0)80 (−1)5 (−1)33.813.62894.80167.59
6100 (1)80 (−1)15 (0)3.400.5642.9811.40
70 (−1)80 (−1)15 (0)33.511.50731.11141.44
80 (−1)160 (1)15 (0)59.452.97596.59222.41
90 (−1)120 (0)5 (−1)46.582.76890.66178.68
1050 (0)160 (1)5 (−1)96.499.841128.49472.98
1150 (0)160 (1)25 (1)135.5810.891721.04793.18
1250 (0)120 (0)15 (0)78.018.61987.24406.55
130 (−1)120 (0)25 (1)51.053.59592.55215.70
14100 (1)160 (1)15 (0)16.582.0576.4286.10
1550 (0)80 (−1)25 (1)48.654.81473.54220.64
* Values represent the mean of triplicate determinations; TPC, total polyphenol content (in mg GAE/g dw); TTC, total tannin content (mg CtE/g dw); FRAP, ferric-reducing antioxidant power (in μmol AAE/g dw); DPPH, antiradical activity (in μmol AAE/g dw).
Table 4. Data obtained from experiments using the PLE method’s color analysis coordinates and three independent variables.
Design PointIndependent VariablesResponses
C (%) (X1)T (°C) (X2)t (min) (X3)L*a*b*Whiteness Index (WI) 1Darkness Index (DI) 2HEX CodeColor 3
1100 (1)120 (0)25 (1)73.11.515.668.931.1BFB297
250 (0)120 (0)15 (0)39.114.55.937.162.9755353
350 (0)120 (0)15 (0)42.216.16.739.760.3805A59
4100 (1)120 (0)5 (−1)67.20.47.566.433.6A9A396
550 (0)80 (−1)5 (−1)61.517.136.044.655.4BE8855
6100 (1)80 (−1)15 (0)69.0−0.52.068.931.1ABA8A5
70 (−1)80 (−1)15 (0)51.815.820.845.154.99D7159
80 (−1)160 (1)15 (0)46.612.98.044.455.6876662
90 (−1)120 (0)5 (−1)54.916.624.446.153.9A8785A
1050 (0)160 (1)5 (−1)35.412.94.034.066.0694C4D
1150 (0)160 (1)25 (1)32.03.20.132.068.0504A4B
1250 (0)120 (0)15 (0)40.816.15.938.461.67C5657
130 (−1)120 (0)25 (1)48.518.416.442.957.1976758
14100 (1)160 (1)15 (0)38.913.710.936.563.575534B
1550 (0)80 (−1)25 (1)53.421.324.743.156.9AB7156
1 For Judd whiteness index used the following equation: WIJUDD = 100 − [(100 − L*)2 + (a*)2 + (b*)2]1/2; 2 For the darkness index, we used the following equation: DI = 100 − WI; 3 table cells are filled with the corresponding color of the extract using the proper HEX code, corresponding to the L*, a*, and b* values measured.
Table 5. Analysis of variance (ANOVA) was utilized for the response surface quadratic polynomial model in the context of the PLE technique.
FactorTPCTTCFRAPDPPH
Stepwise regression coefficients
Intercept73.11 *8.6 *1022 *411 *
X1—Ethanol concentration−19.6 *−0.71−328 *−72.6
X2—Temperature23.59 *1.908 *172.5 *129.2 *
X3—Extraction time7.554-−15.352.13
X1X2----
X1X3----
X2X3--253.5 *66.79
X 1 2 −51 *−6.1 *−648 *−294 *
X 2 2 -−1.02--
X 3 2 ----
ANOVA
F-value (model)21.9129.3213.6212.2
F-value (lack of fit)88.7610.24208.67110
p-value (model)<0.0001 *<0.0001 *0.0006 *0.0009 *
p-value (lack of fit)0.0112 *0.0075 *0.0048 *0.0001 *
R20.8980.9210.8830.871
Adjusted R20.8570.890.8180.8
RMSE14.211.212207.393.92
CV68.576.167.5677.13
DF (total)14141414
* Values significantly affected responses at a probability level of 95% (p < 0.05). TPC, total polyphenol content; TTC, total tannin content; FRAP, ferric-reducing antioxidant power; DPPH, antiradical activity; F-value, test for comparing model variance with residual (error) variance; p-value, probability of seeing the observed F-value if the null hypothesis is true; RMSE, root mean square error; CV, coefficient of variation; DF, degrees of freedom.
Table 6. Optimal conditions for extracting the dependent variables and the maximum expected responses.
ParametersIndependent VariablesDesirabilityStepwise
Regression
C (%) (X1)T (°C) (X2)t (min) (X3)
TPC (mg GAE/g dw)40160250.7876112.13 ± 19.69
TTC (mg CtE/g dw)47160-0.84969.51 ± 1.52
FRAP (μmol AAE/g dw)37160250.82851474.52 ± 373.22
DPPH (μmol AAE/g dw)44160250.8156663.56 ± 170.06
Table 7. Multivariate correlation analysis of measured variables.
VariablesTPCTTCFRAPDPPHL*a*b*WIDI
TPC-0.92670.90730.9728−0.84420.4365−0.2241−0.85510.8551
TTC -0.84880.9339−0.74230.3368−0.2547−0.74570.7457
FRAP -0.9097−0.71960.4758−0.0068−0.81440.8144
DPPH -−0.80730.3117−0.2549−0.81020.8102
L* -−0.42460.39730.9329−0.9329
a* -0.5219−0.65890.6589
b* -0.0492−0.0492
WI -−1.0000
DI -
Table 8. The partial least squares (PLS) prediction profiler determined the maximum desirability for all variables under optimal extraction conditions for the PLE chestnut shell extract, compared with the STE technique extract.
ParametersIndependent VariablesPLS RegressionPLE Experimental ValuesSTE Experimental Values
C (%) (X1)T (°C) (X2)t (min) (X3)
TPC (mg GAE/g dw)4016025112.13113.68 ± 7.84 a18.93 ± 0.59 b
TTC (mg CtE/g dw)9.389.62 ± 0.24 a1.85 ± 0.11 b
FRAP (μmol AAE/g dw)1472.711320.28 ± 34.33 a239.15 ± 13.15 b
DPPH (μmol AAE/g dw)661.85708.65 ± 24.8 a135.02 ± 6.15 b
Statistically significant differences (p < 0.05) are indicated with lowercase letters (e.g., a, b) within each row.
Table 9. Tentative identification of compounds in chestnut shell PLE and STE extracts analyzed by UHPLC-TIMS-QTOF-MS.
NoCompoundFormulaRt (min)[M H]
(m/z)
[M + H]+
(m/z)
Δ (ppm)MS/MS FragmentsPLE ExtractSTE ExtractCompound Type
1Malic acidC4H6O51.10133.0141 +7.14110.9757,
96.9604
++Alpha-hydroxy acid
2Quinic acidC7H12O61.20191.0559 +4.71169.0141,
133.0148
++Hydroxycarboxylic acid
3Citric acidC6H8O71.21191.0194 +4.04133.0141,
96.9610
++Alpha-hydroxy acid
4ArginineC6H14N4O21.28 175.1185−2.58118.0867
83.0602
+Amino Acid
5Gallic acidC7H6O51.30169.0129 −1.18125.0244,
69.0346
++Trihydroxybenzoic acid
6Betaine (Trimethylglycine)C5H11NO21.31118.0868 +4.61104.1074,
83.0602
++Methylated amino acid derivative
7Caffeic acidC9H8O41.40179.0335 −2.15135.0452,
134.0373
++Hydroxycinnamic acid
8GalloylglucoseC13H16O102.90 333.0820+1.20201.0739,
83.0607
+ O-acyl carbohydrate
9C-C B-type dimer
(C: epicatechin or catechin)
C30H26O123.41 579.1506+1.55316.2124,
239.1485, 197.1281,
83.0603
++Procyanidin dimer
10CatechinC15H14O63.85 219.0864+0.54169.0492,
130.1881,
83.0603
++Flavanol aglycone
11PhloretinC15H14O58.00273.0768 +4.03167.0343,
123.0450
+Dihydrochalcone
12LuteolinC15H10O68.10285.0407 +4.91175.0401,
151.0037,
133.0295
++Flavone aglycone
13Trimethylellagic acidC17H12O88.52 345.0602−0.58158.1544,
102.1286,
83.0614
++Ellagic acid methylated derivative
14ApigeninC15H10O58.80269.0461 +6.31151.0031,
117.0343
++Flavone aglycone
15Dimethylellagic acidC16H10O89.63329.0305 +4.26255.2334,
217.0026,
141.0163
++Ellagic acid methylated derivative
Disclaimer/Publisher’s Note: The statements, opinions and data contained in all publications are solely those of the individual author(s) and contributor(s) and not of MDPI and/or the editor(s). MDPI and/or the editor(s) disclaim responsibility for any injury to people or property resulting from any ideas, methods, instructions or products referred to in the content.

