Article

Study on Solid and Pore Structures of Borehole Municipal Solid Waste Samples by X-Ray CT Scanning

1
School of Civil Engineering and Architecture, Guangxi University, Nanning 530004, China
2
MOE Key Laboratory of Soft Soils and Geoenvironmental Engineering, Zhejiang University, Hangzhou 310058, China
3
Dongtong Geotechnical Technology Co., Ltd., Hangzhou 310020, China
4
PowerChina Chengdu Engineering Co., Ltd., Chengdu 610031, China
*
Author to whom correspondence should be addressed.
Processes 2025, 13(7), 2176; https://doi.org/10.3390/pr13072176
Submission received: 16 June 2025 / Revised: 4 July 2025 / Accepted: 4 July 2025 / Published: 8 July 2025
(This article belongs to the Special Issue Emerging Technologies in Solid Waste Recycling and Reuse)

Abstract

The microscale solid and pore structures of waste is crucial for the bio-hydro-mechanical behaviors of landfilled municipal solid waste (MSW). The quantitative analysis of the structural characteristics of MSW is still limited. In this study, borehole MSW samples at different depths (i.e., 0 m, 2.5 m, 5 m, 7.5 m, 10 m, and 12.5 m) were drilled from a landfill. The waste composition and basic physical properties of these samples were tested in laboratory. Solid and pore structural characteristics were studied through computed tomography (CT) analysis. The results indicate that the ratio of cellulose content to lignin content (i.e., C/L) decreased from 0.85 to 0.47 with increasing depth. For solid particles, two-dimensional (2D) particles constituted the greatest fraction (60.22~72.16%), which showed a decrease with increasing depth. The deeper sample tended to have more fine particles. For pores, the void ratio decreased from 1.68 to 1.10 with increasing depth, with more small pore channels. Meanwhile, the average pore diameter coefficient (λ) decreased from 0.209 to 0.190, the pore angle (θe) decreased from 29.6° to 17.8°, the tortuosity (τ) increased from 1.129 to 1.184, and the connectivity (ce) decreased from 12.0 to 4.1. These quantitative findings can further the understanding of fluid flow behaviors in landfilled waste.

1. Introduction

Municipal solid waste (MSW) is a highly heterogeneous porous medium that contains a variety of components, and hence has complex solid and pore structures [1,2]. Currently, landfilling is still one of the main disposal methods for MSW in many countries [3,4]. The complex shape and size of solid particles contribute to the heterogeneous distribution of pores, which further results in the special properties of landfilled MSW, as compared to common soil. For example, landfilled MSW tends to have significant preferential flow due to elongated or flat particles [5,6,7], a reinforcing effect due to fiber materials [8,9,10,11], and large settlement due to degradable materials [12,13].
After landfilling, the waste structure generally undergoes void enlargement, rearrangement, and collapse during progressive structure evolution. This is due to the coupled effects of biochemical degradation, mechanical compression, and fluid flow in waste [14,15,16,17]. Meanwhile, the evolution of the structural characteristics of landfilled MSW significantly influences the coupled phenomenon. However, the macroscale understanding of the evolution of waste structure is insufficient to describe the complex properties (e.g., preferential flow in pores, reinforcing effect of solids, and degradation of waste) of landfilled MSW related to microscale structural properties. For example, as pointed out by Muaaz-Us-Salam et al. [1], modeling transport phenomena in MSW is challenging due to its inherent multi-scale heterogeneity and ever-evolving pore space. Pore-scale studies could further the understanding of leachate and gas transport at the field scale.
Recently, the microscale structure of MSW has been studied through visual methods (e.g., photography and CT scanning). In the study by Caicedo-Concha et al. [6] on compressed, aged MSW, two-dimensional (2D) materials (e.g., paper, plastics, and textiles) were found to constitute the greatest fraction of solid particles larger than 20 mm in size. They noticed the role of horizontally orientated 2D particles in the modification of flow paths and the increase in tortuosity, which in turn created a preferential flow. CT scanning of synthetic MSW under degradation was carried out by Zhang et al. [18]. It indicated that pore structure changed significantly after degradation and subsequent settlement, with clear decreases in porosity, coordination number, and densities of pore path and pore throat. However, in their study, synthetic MSW had no 2D materials. Qin et al. [19] observed the horizontal orientation of 2D particles for degraded, synthetic MSW under compression, which resulted in a decrease in large pores and the anisotropy of permeability. They noticed that a horizontal flow path formed along the surface of 2D particles. Meng et al. [20] found that large pores were generally formed around 2D particles for the synthetic MSW under compression, and pore channels became flat with the horizontal orientation of 2D particles. This contributed to the increase in the anisotropy of liquid permeability from 2 to 10. The study by Liu et al. [16] showed the effect of microorganisms on the pore evolution of MSW. Connected pores were segmented into several small, disconnected pores with degradation, which contributed to reduced connected paths and more isolated paths. They mentioned the minor contribution of physical effects, which might have been due to the fact that no surcharge load was applied on the sample. Ke et al. [2,21] also found that large pores basically formed along the 2D particles, and the angle of pores became increasingly flat with these 2D particles. The structural solid angle tended to be horizontal under compression, while the influence was limited. These former studies are mainly on synthetic MSW samples exposed to degradation or compression. Our understanding of the evolution of the structural characteristics of MSW exposed to both degradation and compression is still limited. Furthermore, quantitative characterization through suitable structural parameters is highly required.
There are also limitations regarding the extrapolation of laboratory-measured microscale parameters to the field scale due to the high heterogeneity of waste in landfill and difficulty of collecting undisturbed representative samples [22]. In situ non-invasive measurements, such as ground-penetrating radar (GPR), electrical resistivity tomography (ERT), magnetic resonance imaging (MRI), and the seismic wave method, can help to evaluate waste properties. Orlando and Marchesi [23] used georadar to define the geometry of landfilled waste. The ERT study by Vargemezis et al. [24] clearly depicted the interface between resistive waste and conductive, undisturbed host soil. Zhao et al. [25] used ERT to map the variations in moisture content in the waste and underlying subsurface. Clément et al. [26] found that MRI could reveal the water content of waste with a dry density of less than about 450 kg/m3. Abreu et al. [27] used a seismic investigation to calculate the shear wave velocity and compression wave velocity of landfilled waste. The combination of different geophysical methods can provide a high local resolution while characterizing large areas of the site. For instance, Wille et al. [28] used electromagnetic induction, magnetic profiling, seismic refraction, and ground penetrating radar to explore the stratigraphy and the distribution of the different components in waste. Furthermore, Isobe and Ishimori [29] combined the field ERT monitoring of water migration in two landfills and the laboratory X-ray CT analysis of waste samples. Their novel work indicated that the microscale structure information obtained from CT analysis could effectively improve our understating of fluid flow behaviors revealed by ERT monitoring. However, the interpretation of non-invasive monitoring data is still challenging for engineers. Future studies on establishing suitable models considering the effect of microscale structure can improve the numerical analysis of field-scale behaviors.
In this study, borehole MSW samples at different depths in a landfill were obtained. The waste composition and basic physical properties of these samples were tested in laboratory. Solid and pore structural characteristics were studied through CT scanning in order to reveal the variations in the structural parameters according to landfilled depth. Finally, discussions of this study and the reported studies were presented to achieve a comprehensive understanding of the evolution of the microscale structure of landfilled MSW.

2. Borehole Sampling

2.1. Site Description

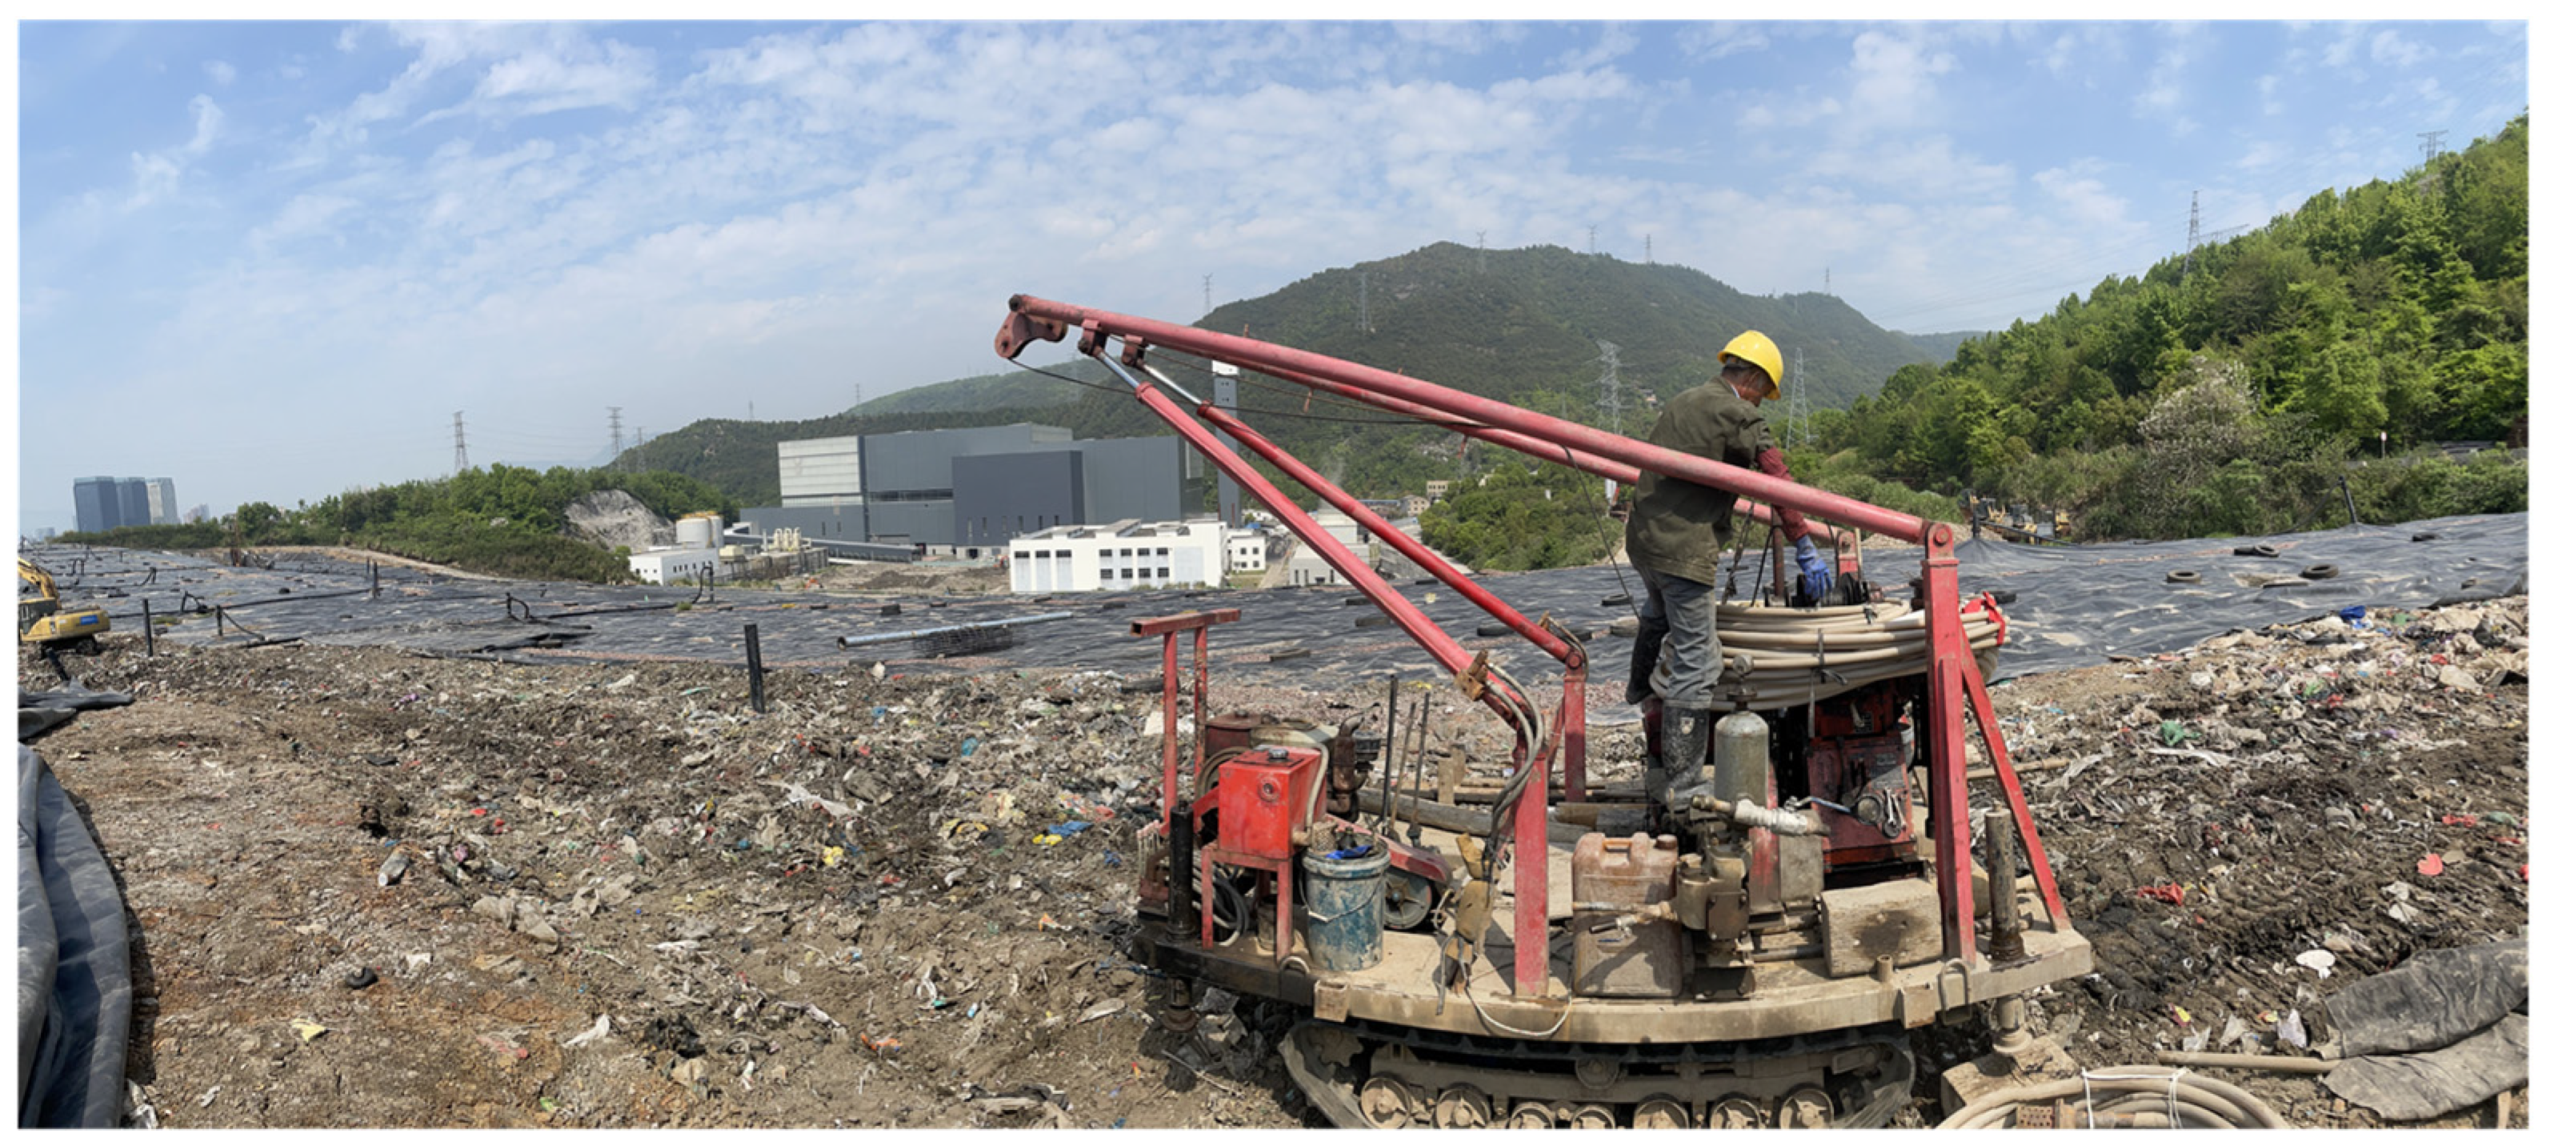
Borehole MSW samples were drilled from a landfill site in Zhejiang, China (See Figure 1). The landfill is located in a valley and covers an area of about 286,200 m2. The landfill site was in a subtropical monsoon climate zone, with an average annual temperature of about 17 °C and an annual rainfall level of about 1676 mm. The bedrock of the landfill is tufa, which has no adverse geological body.
The first phase of the landfill site started in September 2005, which was built according to the Chinese sanitary landfill standard CJJ 17-2004 [30], and had a total storage capacity of 3.3 × 10⁶ m3. It could store 300 tons of MSW daily and had a designed service life of 20 years. With the increasing demand for waste treatment, the second phase of the landfill site was launched in November 2014, which had a total storage capacity of 2.7 × 10⁶ m3. It could store 800 tons of MSW daily and had a designed service life of 13 years.
By the end of 2019, the first and second phases of the landfill stored over 2.98 million tons of waste. The depth of the landfilled waste ranged between 10 m and 50 m. According to the in situ measurements of vertical wells, the leachate level was at a depth of about 7.2 m below the landfill’s surface.

2.2. Sampling

The borehole samples were drilled from the landfill after removing the top high-density polyethylene (HDPE) membrane on the landfill surface (see Figure 2), and the position of the sampling is shown in Figure 1. The samples were taken from the landfill surface (0 m) and depths of 2.5 m, 5 m, 7.5 m, 10 m, and 12.5 m.
The core tube used for borehole sampling was a steel pipe with an outer diameter of 30 cm and an inner diameter of 29.6 cm. It had two specifications of a standard length: 30 cm and 100 cm. First, the core tubes with the standard length of 100 cm were drilled into the landfilled waste. Then, they were replaced by the core tubes with the standard length of 30 cm, so as to minimize the disturbance during the extraction of samples from the core tubes. A ring knife (outer diameter of 10 cm, inner diameter of 9.5 cm, and height of 10 cm) was inserted into the central zone of each 30 cm-long core tube to extract a waste sample. One set of waste samples in the ring knife was used for geotechnical property tests. The other set of waste samples in the ring knife was placed into polymethyl methacrylate (PMMA) tubes for CT scanning. A photo of the borehole sample is shown in Figure 3.

3. Testing Methods

3.1. Waste Composition and Particle Shape

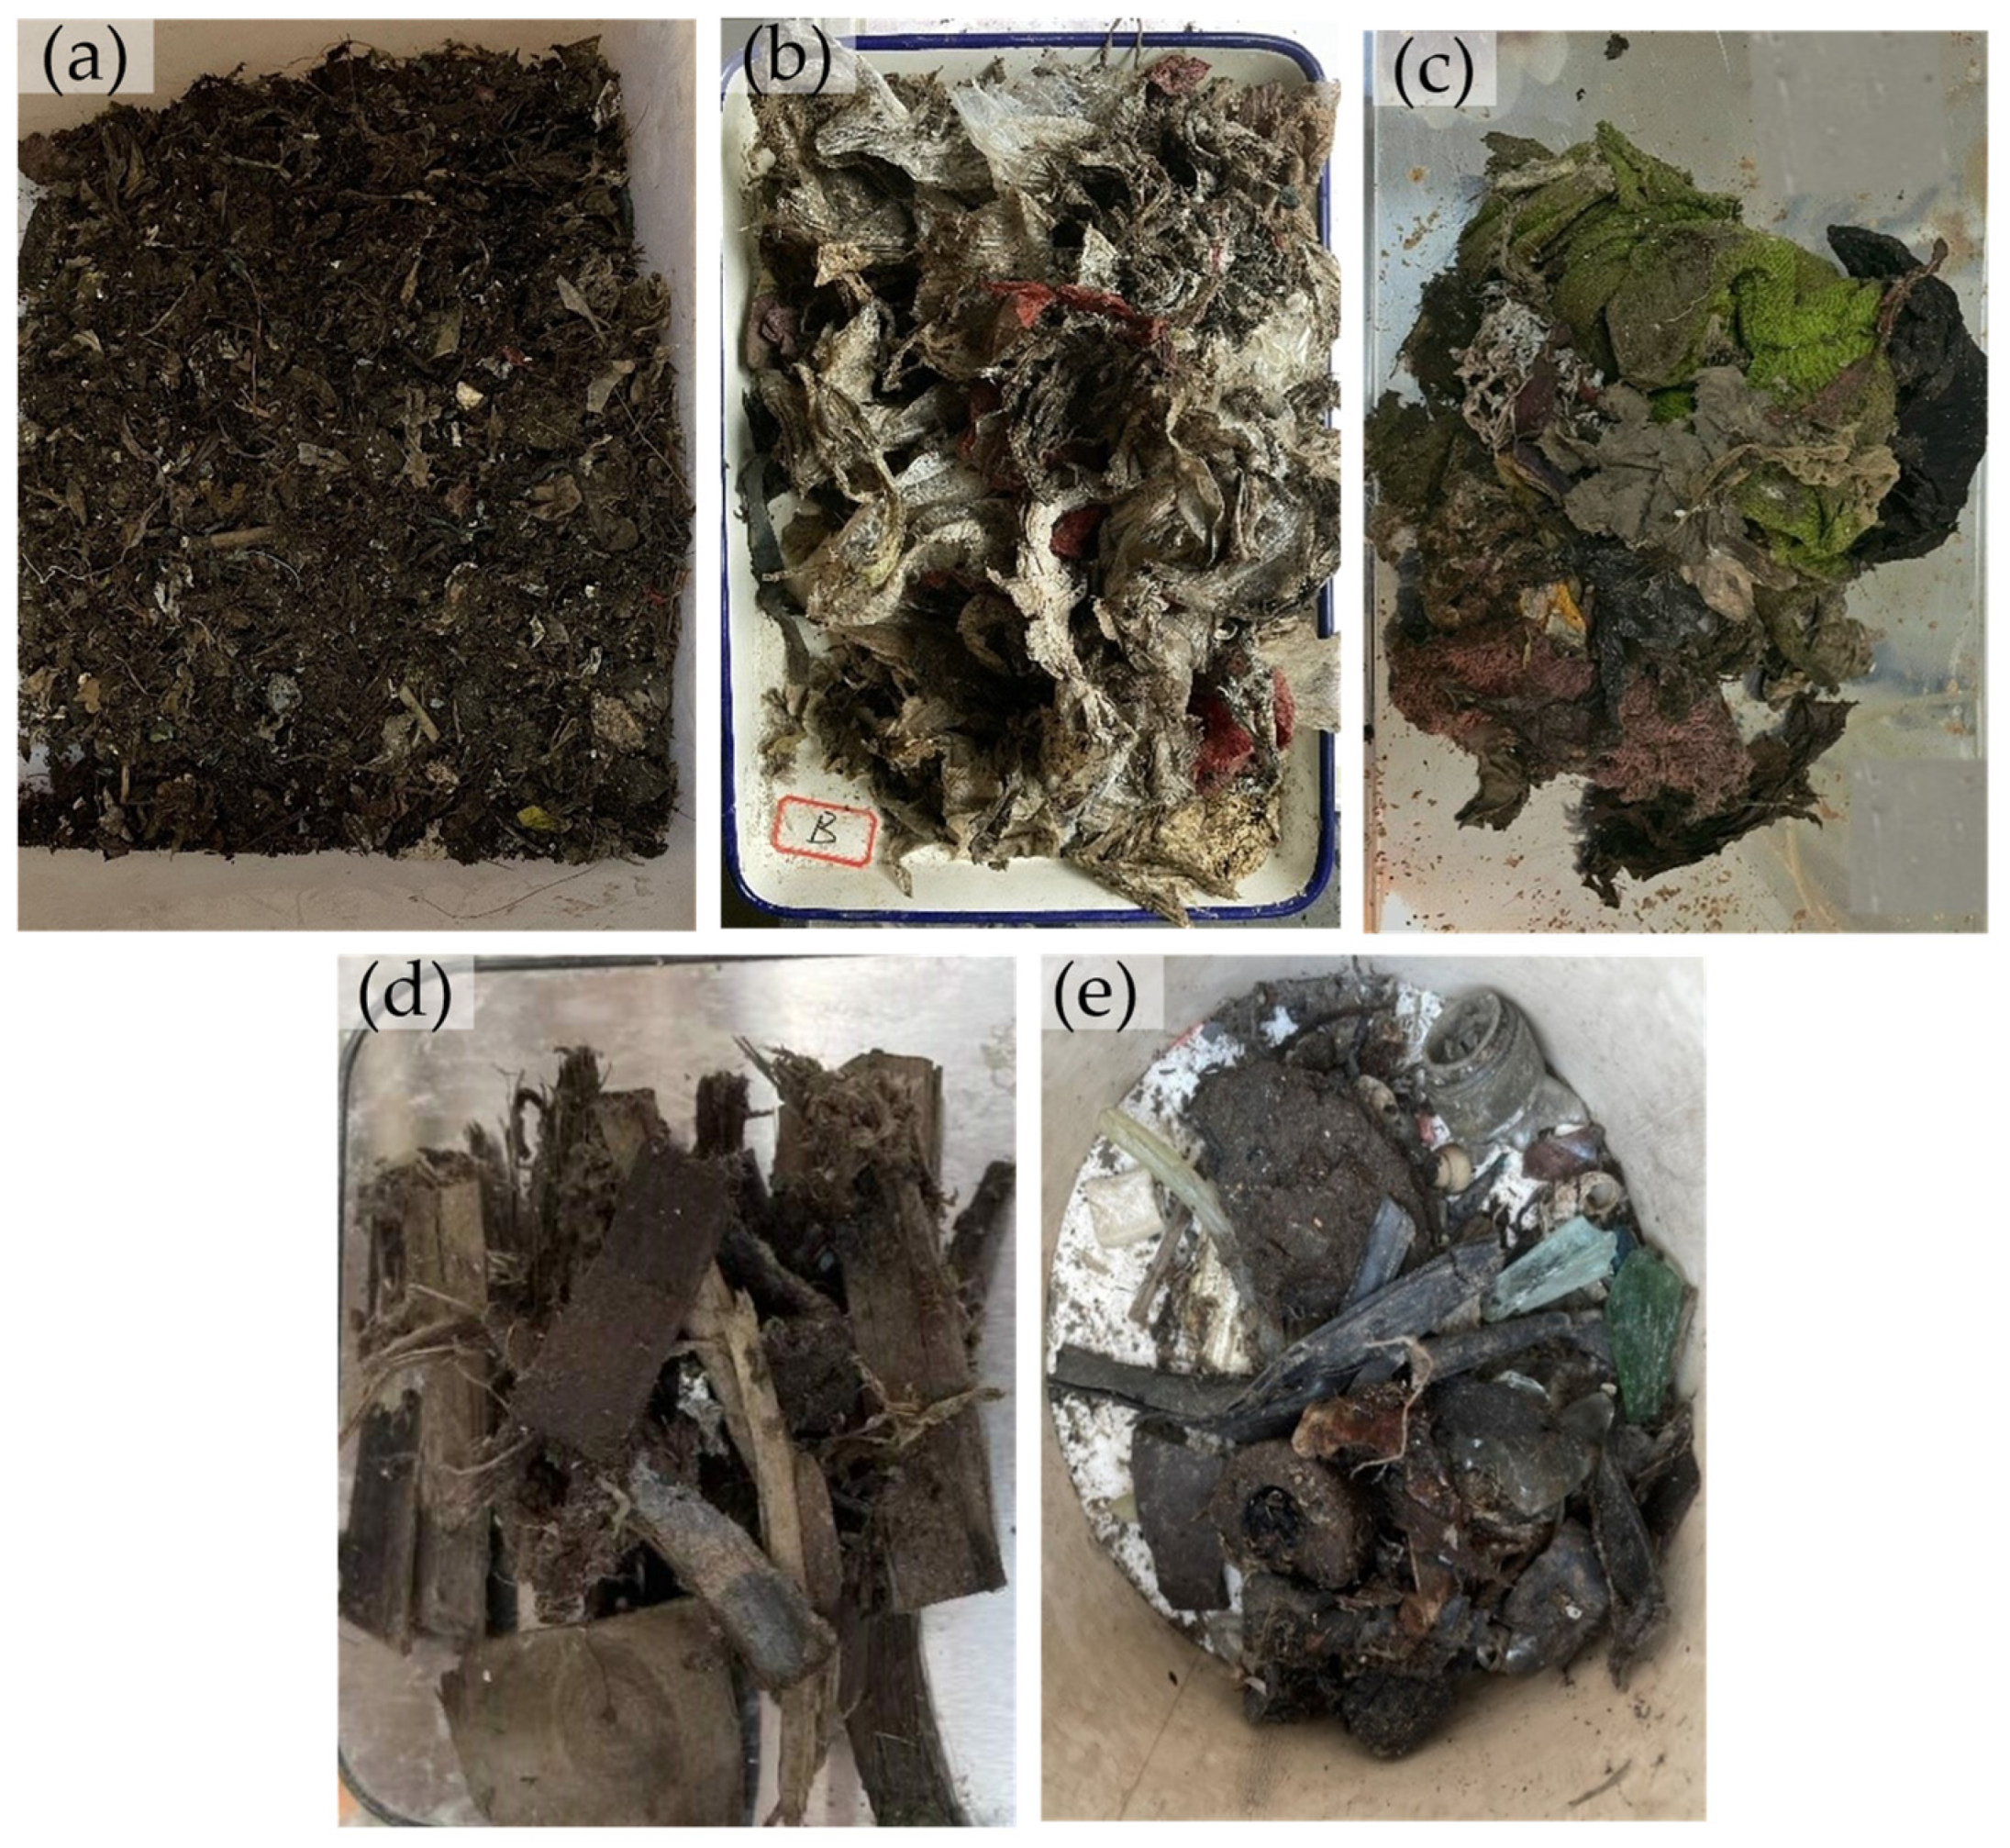
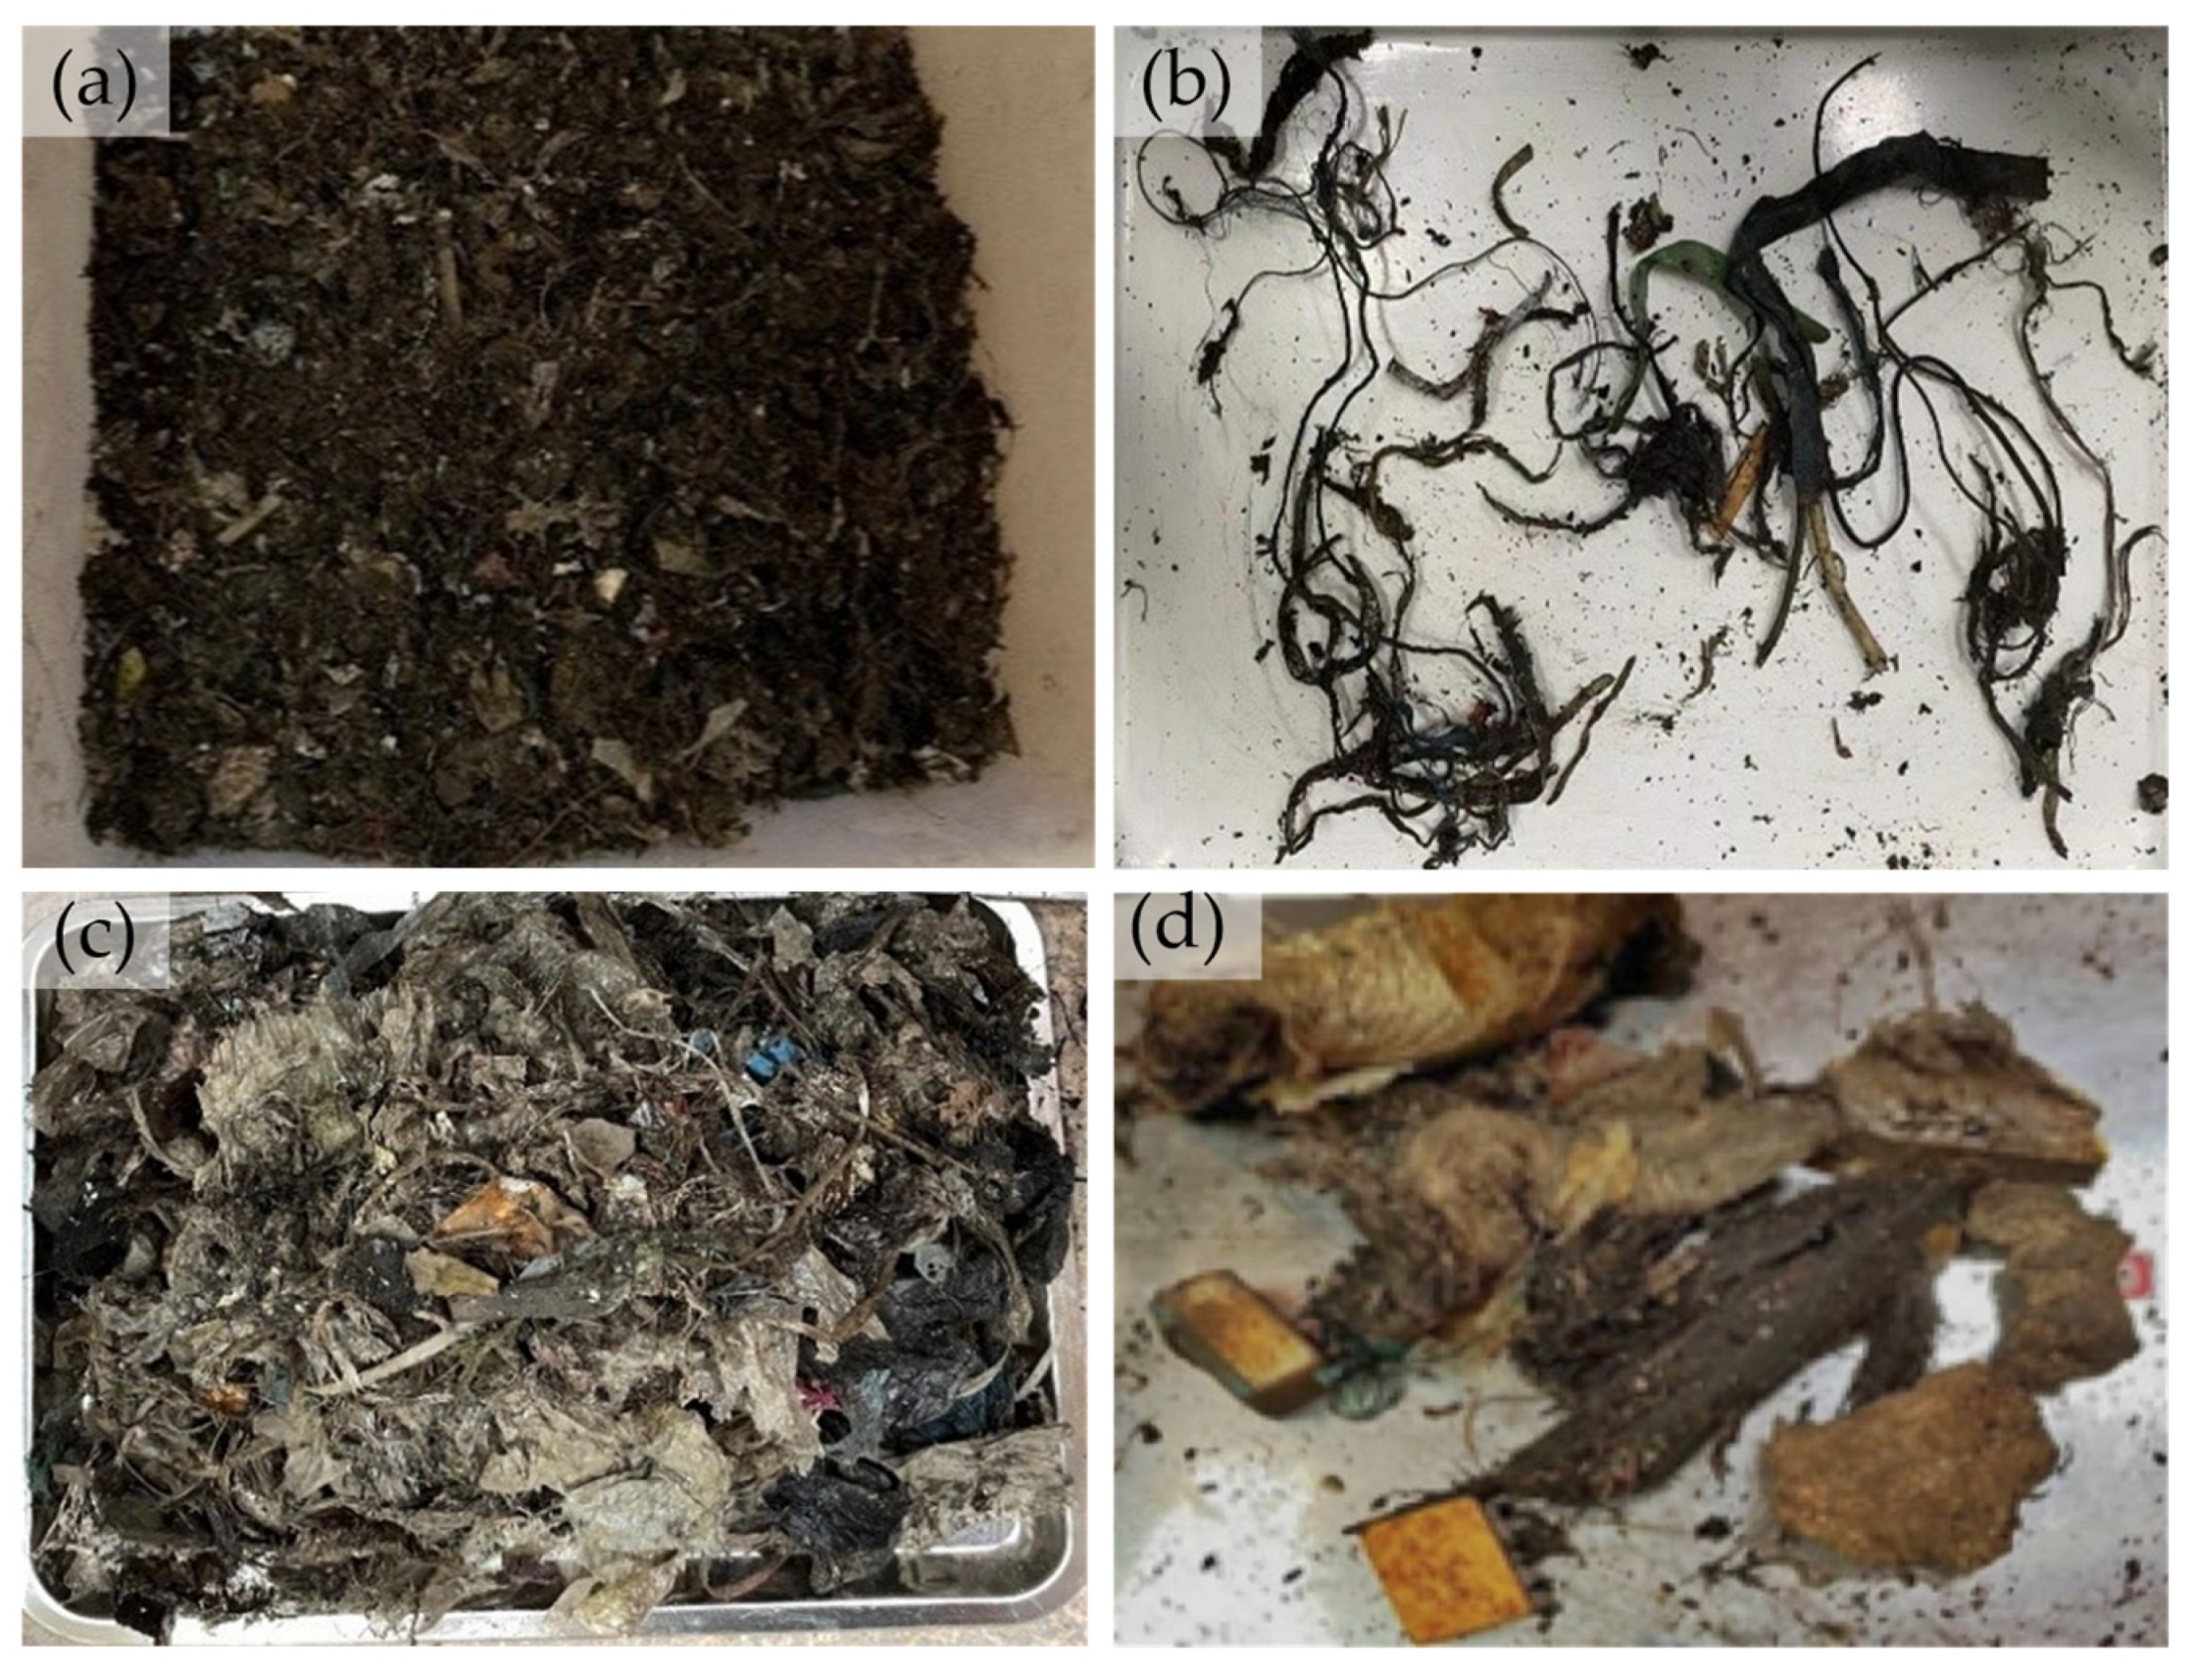
The components of MSW are usually divided into eight categories, including food waste, paper, plastics, textile, wood, glass, metal, and cinder and dust [31,32]. As the landfill has been closed for nearly four years, food waste has basically degraded and cannot be identified. Plastics and textiles account for a large proportion, followed by wood, and cinder and dust. The proportion of other materials (e.g., metal and glass) is very small. Therefore, in this study, five types of waste components were divided for each sample by manual sorting, including cinder and dust (particle size less than 20 mm), plastics, textiles, wood, and others (e.g., metal and glass).
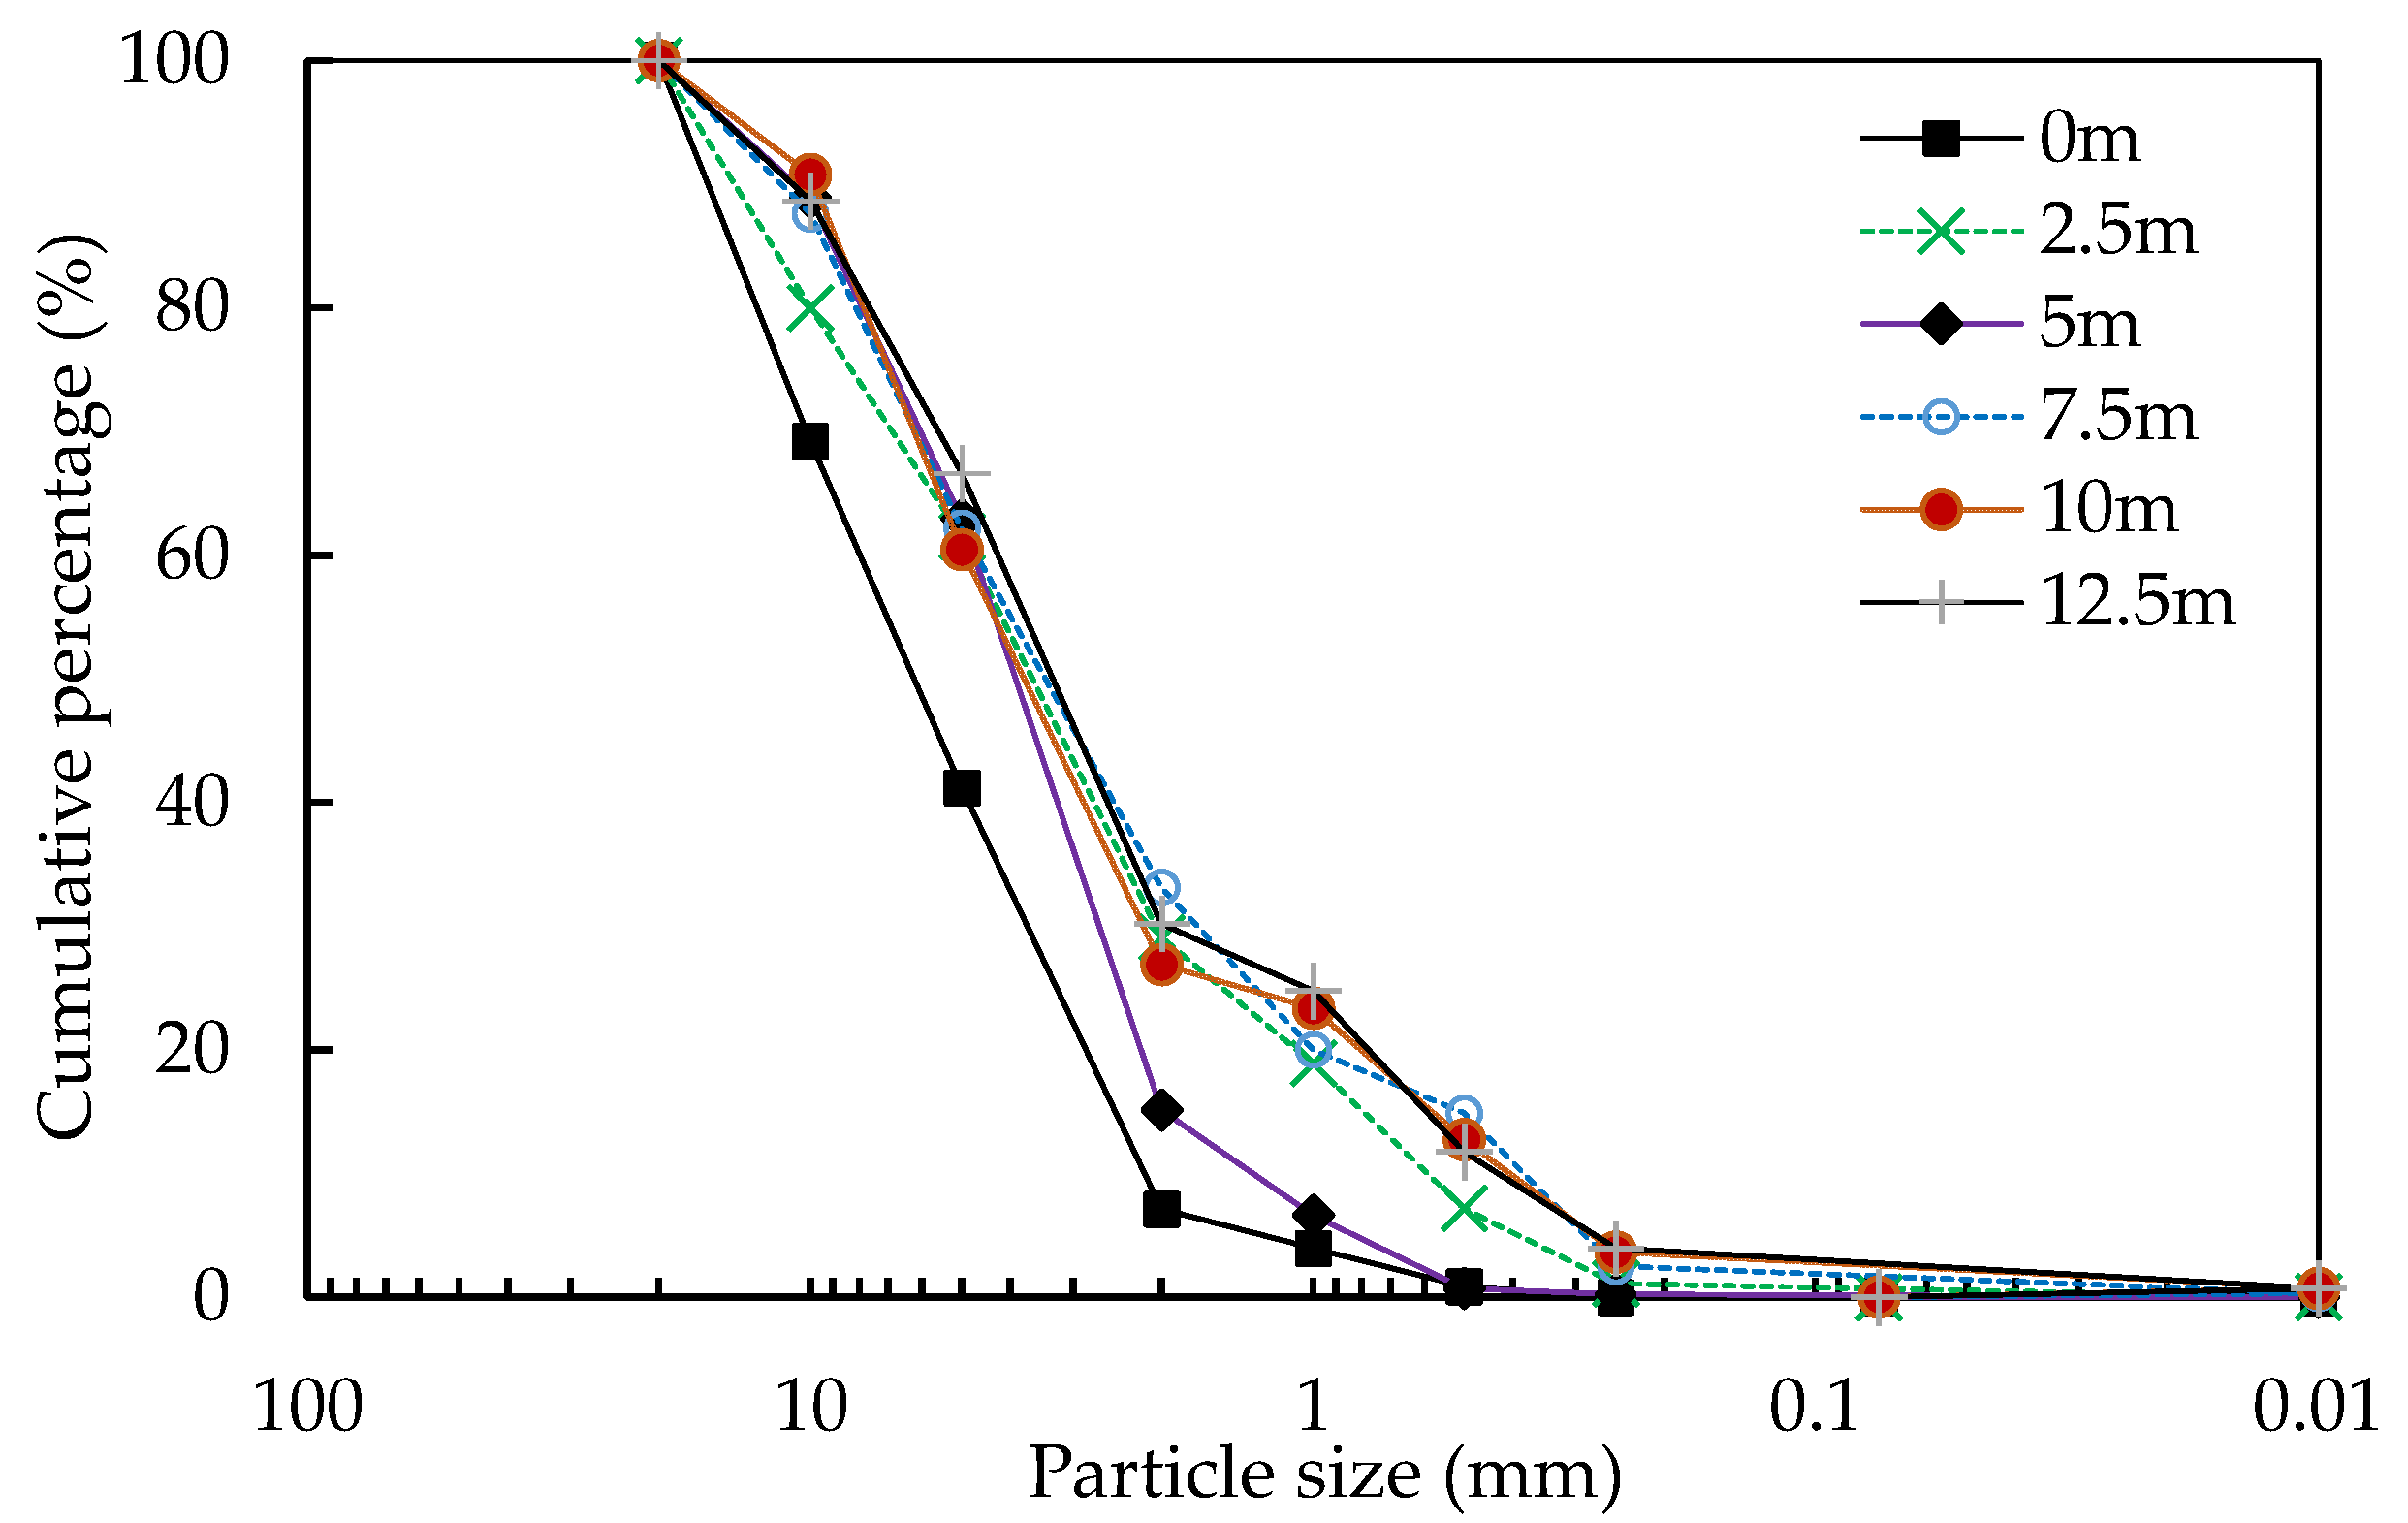
Based on the studies by Kolsch [33], Velkushanova et al. [34], and Caicedo-Concha [35], waste components can be categorized according to particle shape: (i) 0D particles with each dimension less than a certain minimum length; (ii) 1D particles with one dimension longer than others; (iii) 2D particles with two long dimensions and one short one; and (iv) 3D particles with all three dimensions greater than the minimum significant value. According to Qin [36], particles smaller than 20 mm are considered to be 0D particles (fine particles). In this study, the dried samples were first sieved through a standard sieve with a pore diameter of 20 mm. The particles passing through the sieve were 0D particles. The 1D and 3D particles were manually sorted from the waste remaining in the sieve. Finally, the rest of the particles were considered to be 2D particles. All the categorized particles were photographed and weighted. Furthermore, according to Chen et al. [37], the particle shape distribution curve of 0D particles was tested for each sample through standard sieves with pore diameters of 20 mm, 10 mm, 5 mm, 2 mm, 1 mm, 0.5 mm, 0.25 mm, 0.1 mm, and 0.075 mm.

3.2. Basic Physical Properties and Degree of Degradation

Based on the testing standard CJJ/T 204-2013 issued in China [38], the water content ω and specific gravity Gs of the borehole samples were tested through the oven-drying method and Archimedes method, respectively. Based on the measured water content and specific gravity, the void ratio e of the sample could be obtained. It should be pointed out that, with increasing depth, some of the borehole samples are located below the leachate level. The water content of the samples below the leachate level was taken as the saturated water content. The particle size distribution curve of 0D particles in the borehole samples was tested using dry sieving according to CJJ/T 204-2013 [38].
According to Chen et al. [37], the ratio of cellulose content to lignin content (i.e., C/L) is generally used to characterize the degree of degradation for MSW. The cellulose and lignin contents of each sample were measured using the Van Soest–Wine method [39,40].

3.3. CT Scanning

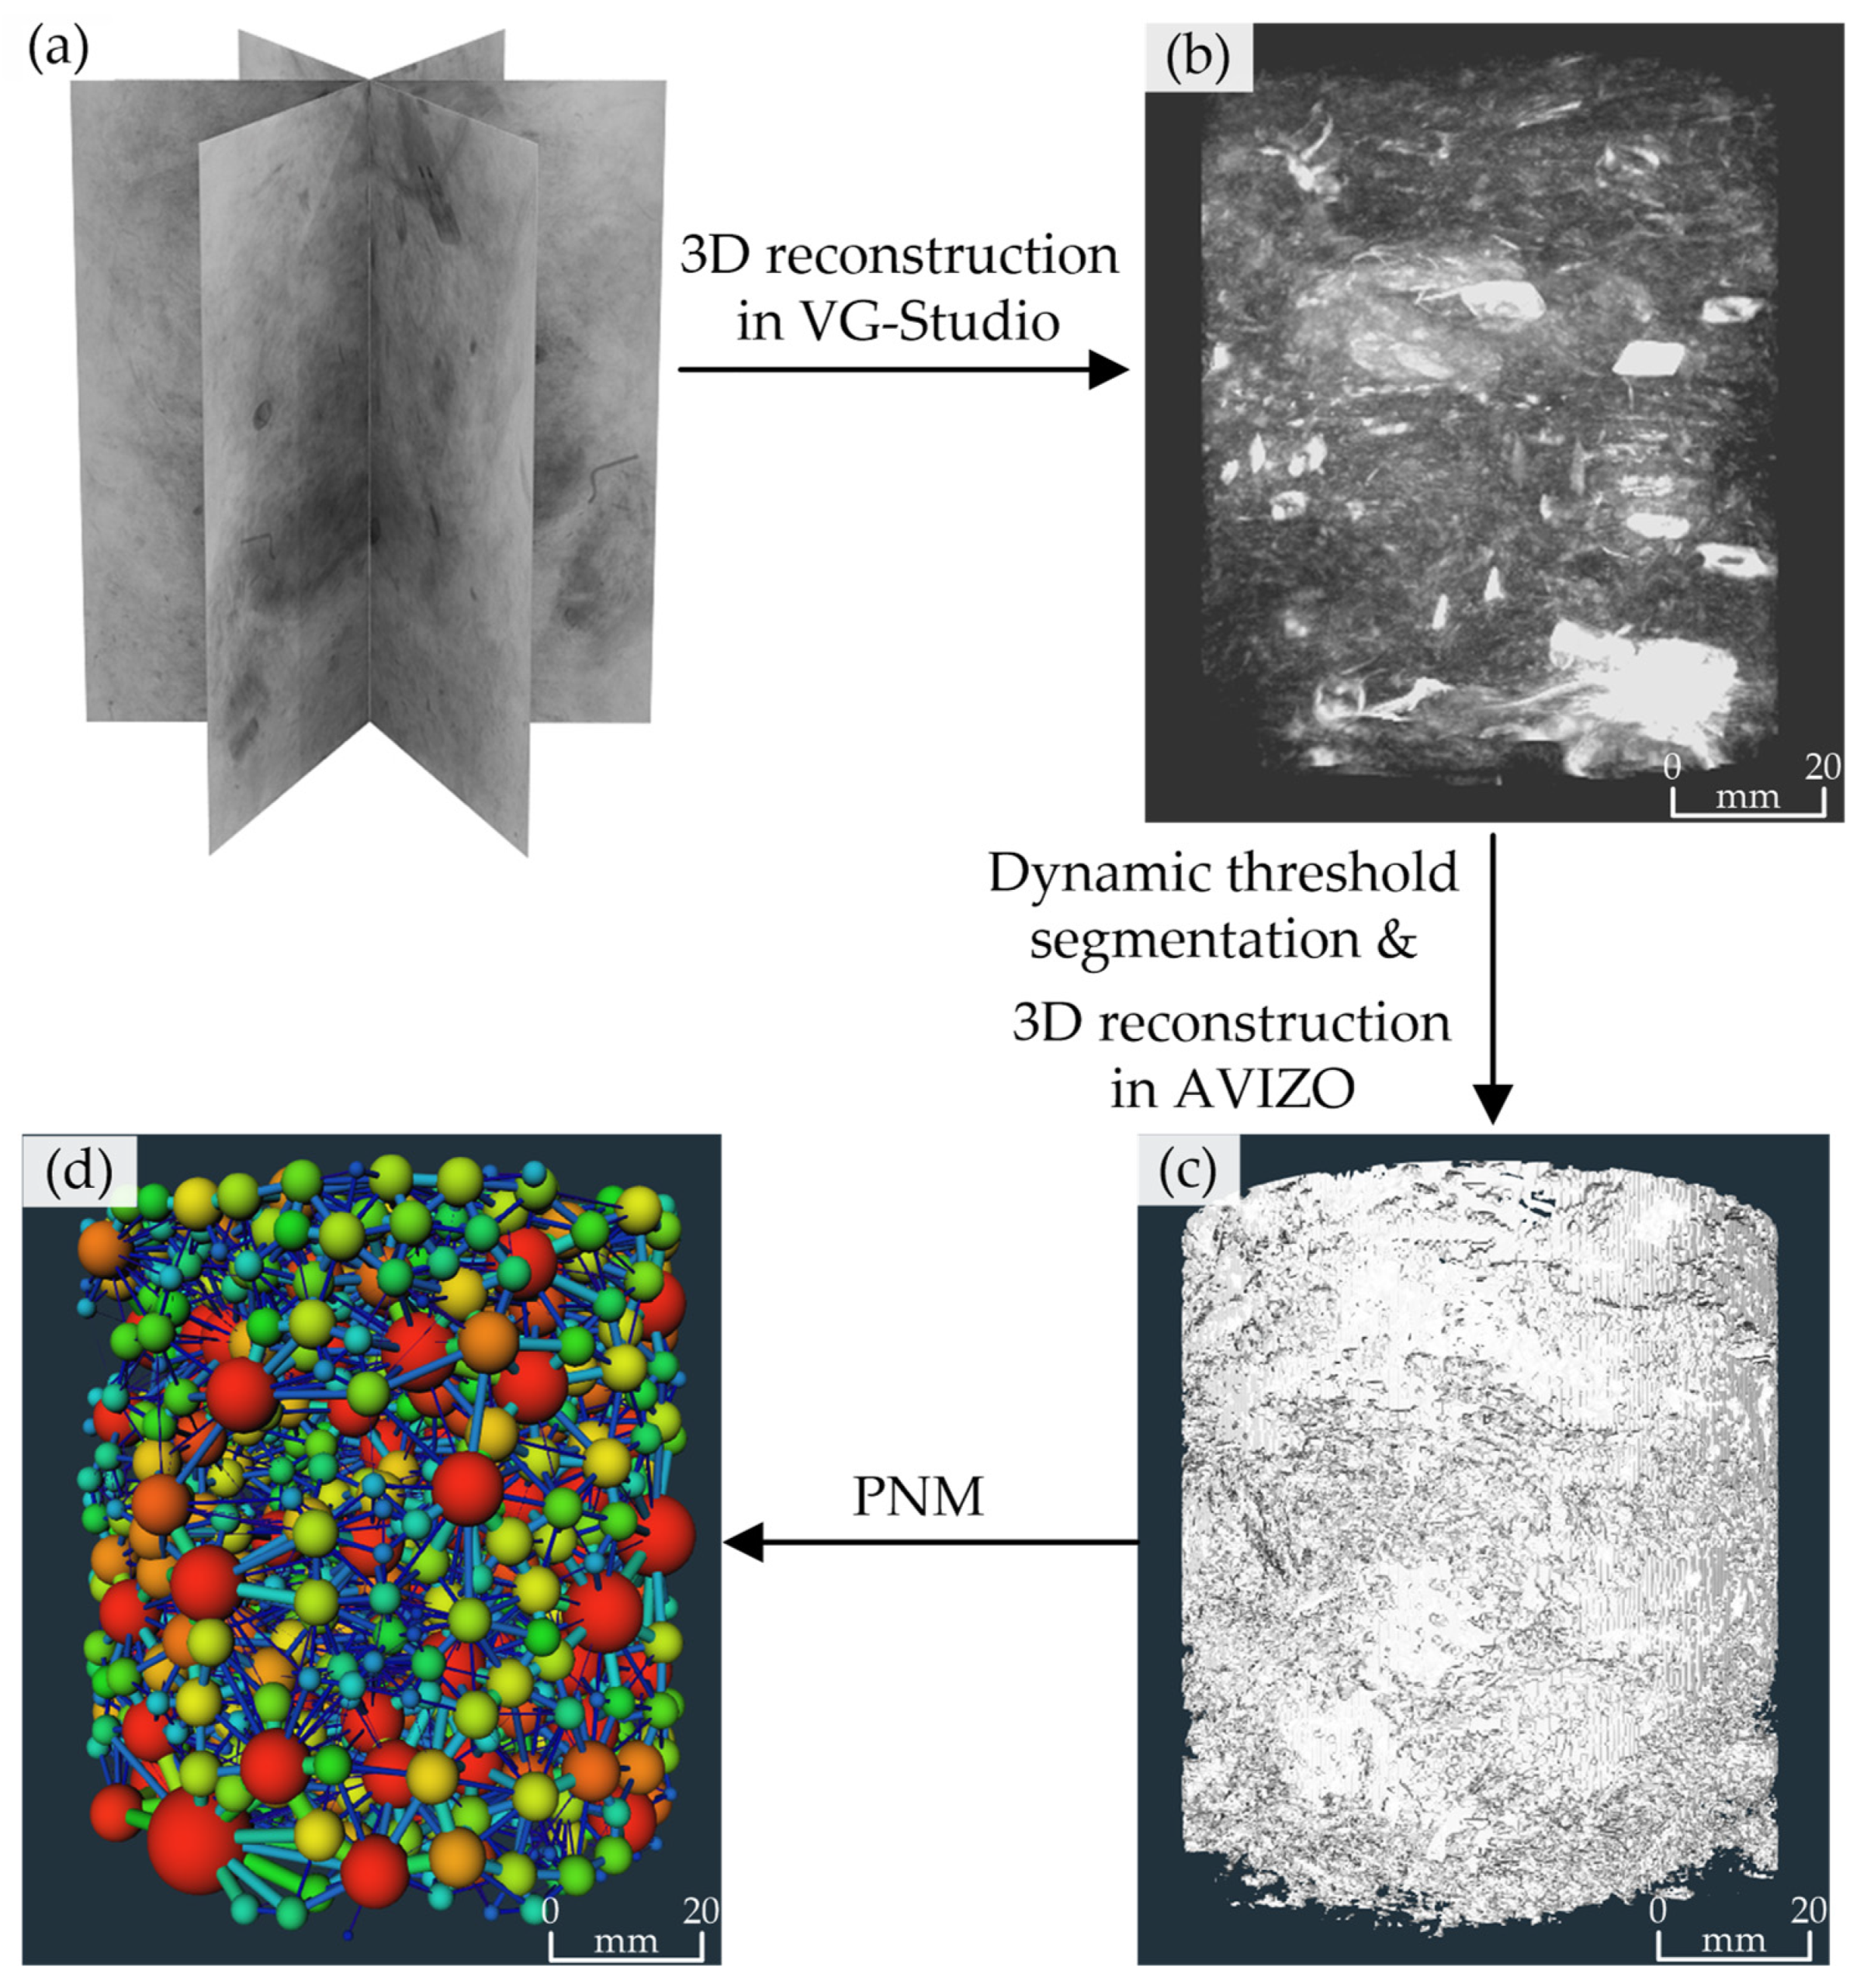
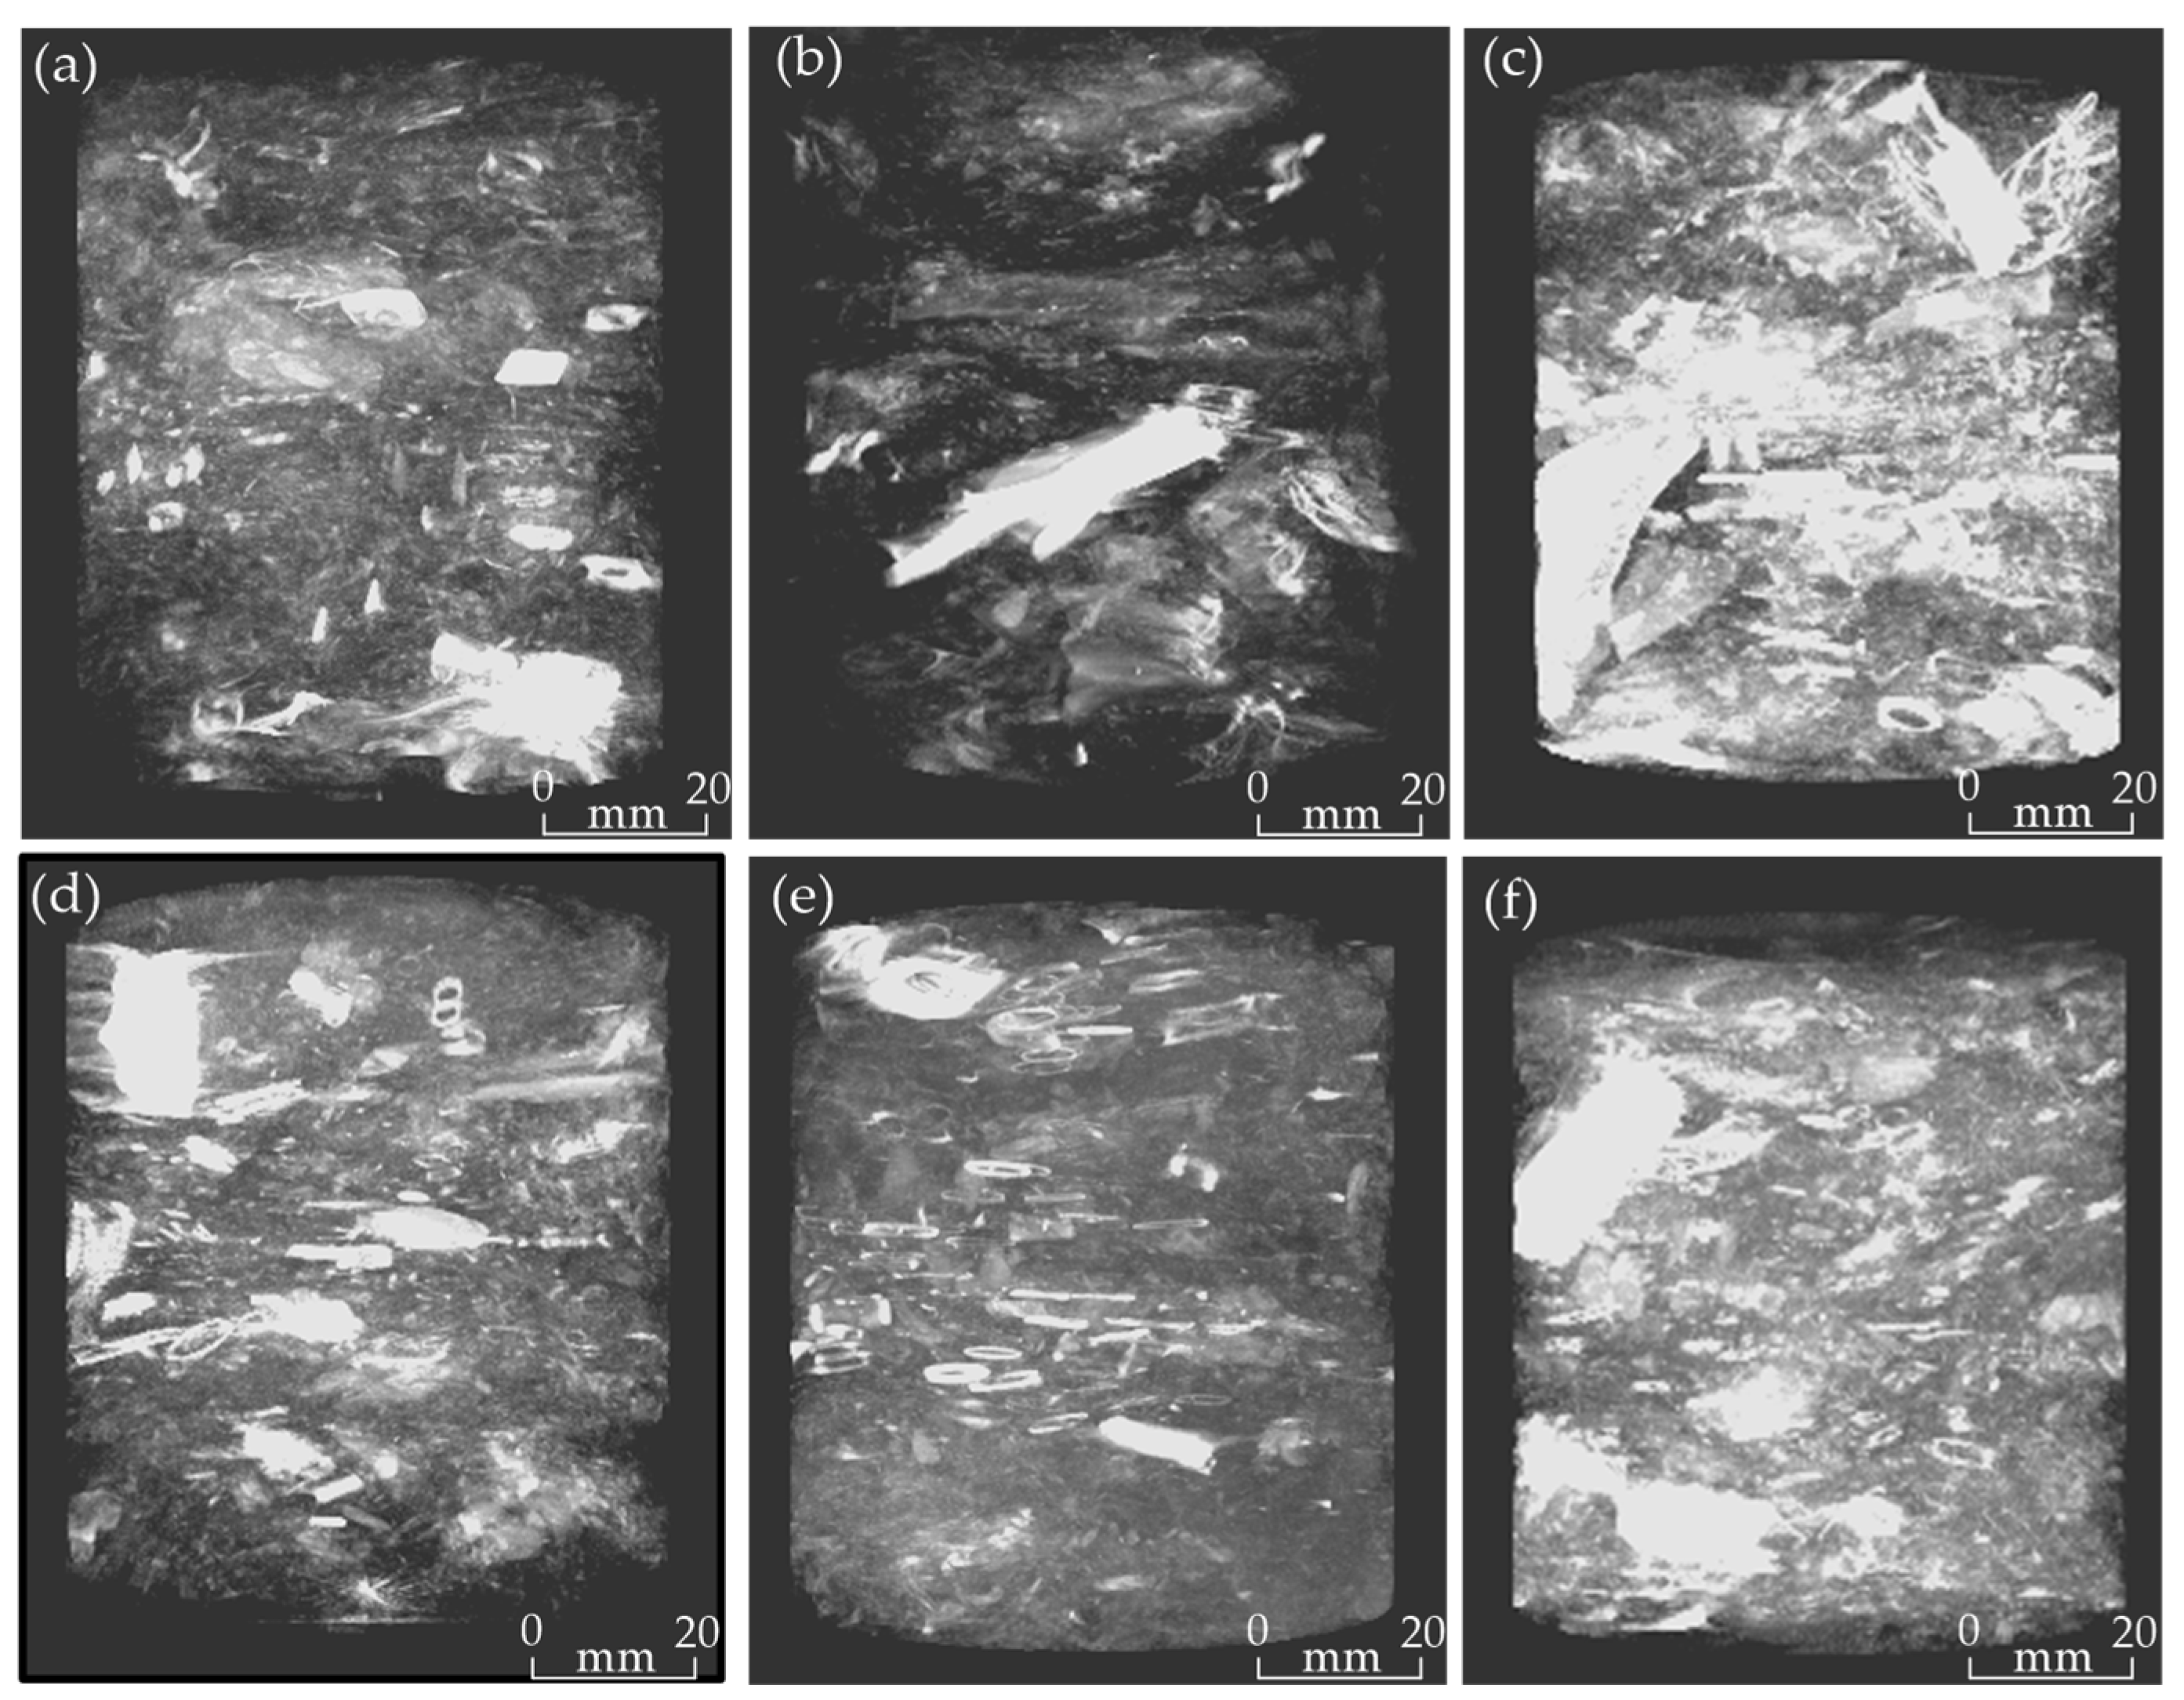
An XTH 225/320LC industrial CT scanning workstation produced by Nikon UK was used to scan the dried samples. The scanning parameters were set as U-200 kV and I-160 mA, and the scanning time was 1 h. To minimize the appearance of ring artifacts, scanning was performed in the ring compensation mode. As shown in Figure 4, the original data obtained from CT scanning were processed preliminarily and output in the form of multiplanar reconstruction (MPR) by VG-Studio Max V3.0 (Volume Graphics, Heidelberg, Germany). Then, a 3D reconstruction of the samples was conducted through AVIZO 2020 (Thermo Fisher Scientific Inc., Waltham, MA, USA) to analyze the pore structure parameters. The detailed steps of the CT image processing for each sample are as follows:
(i)
The original data of the CT scan were imported into VG-Studio MAX. Then, according to Ke et al. [2], the visible pores and particles in the 3D reconstructed images were divided by dynamic threshold segmentation based on the background brightness and morphological denoising method.
(ii)
Rotate the 3D reconstructed model in VG-Studio and slice it by every 1-degree angle. Then, the longest connected pore channel from the slices was obtained through the visual method. Its angles relative to the horizontal plane were determined as the characteristic angle of the connected pores in the sample.
(iii)
Import the 3D reconstructed model from VG-Studio into AVIZO 2020. Through the dynamic adjustment of the gray-level threshold, the 3D reconstructed model of AVIZO was achieved.
(iv)
Separate the pores and solid particles in the 3D reconstructed model of AVIZO. Use the Generate Pore Network Model command to establish the equivalent pore network model (PNM) for connected pores. The pore structure parameters of the sample, including the diameter, volume, connectivity, and tortuosity of connected pores, were obtained through the PNM.
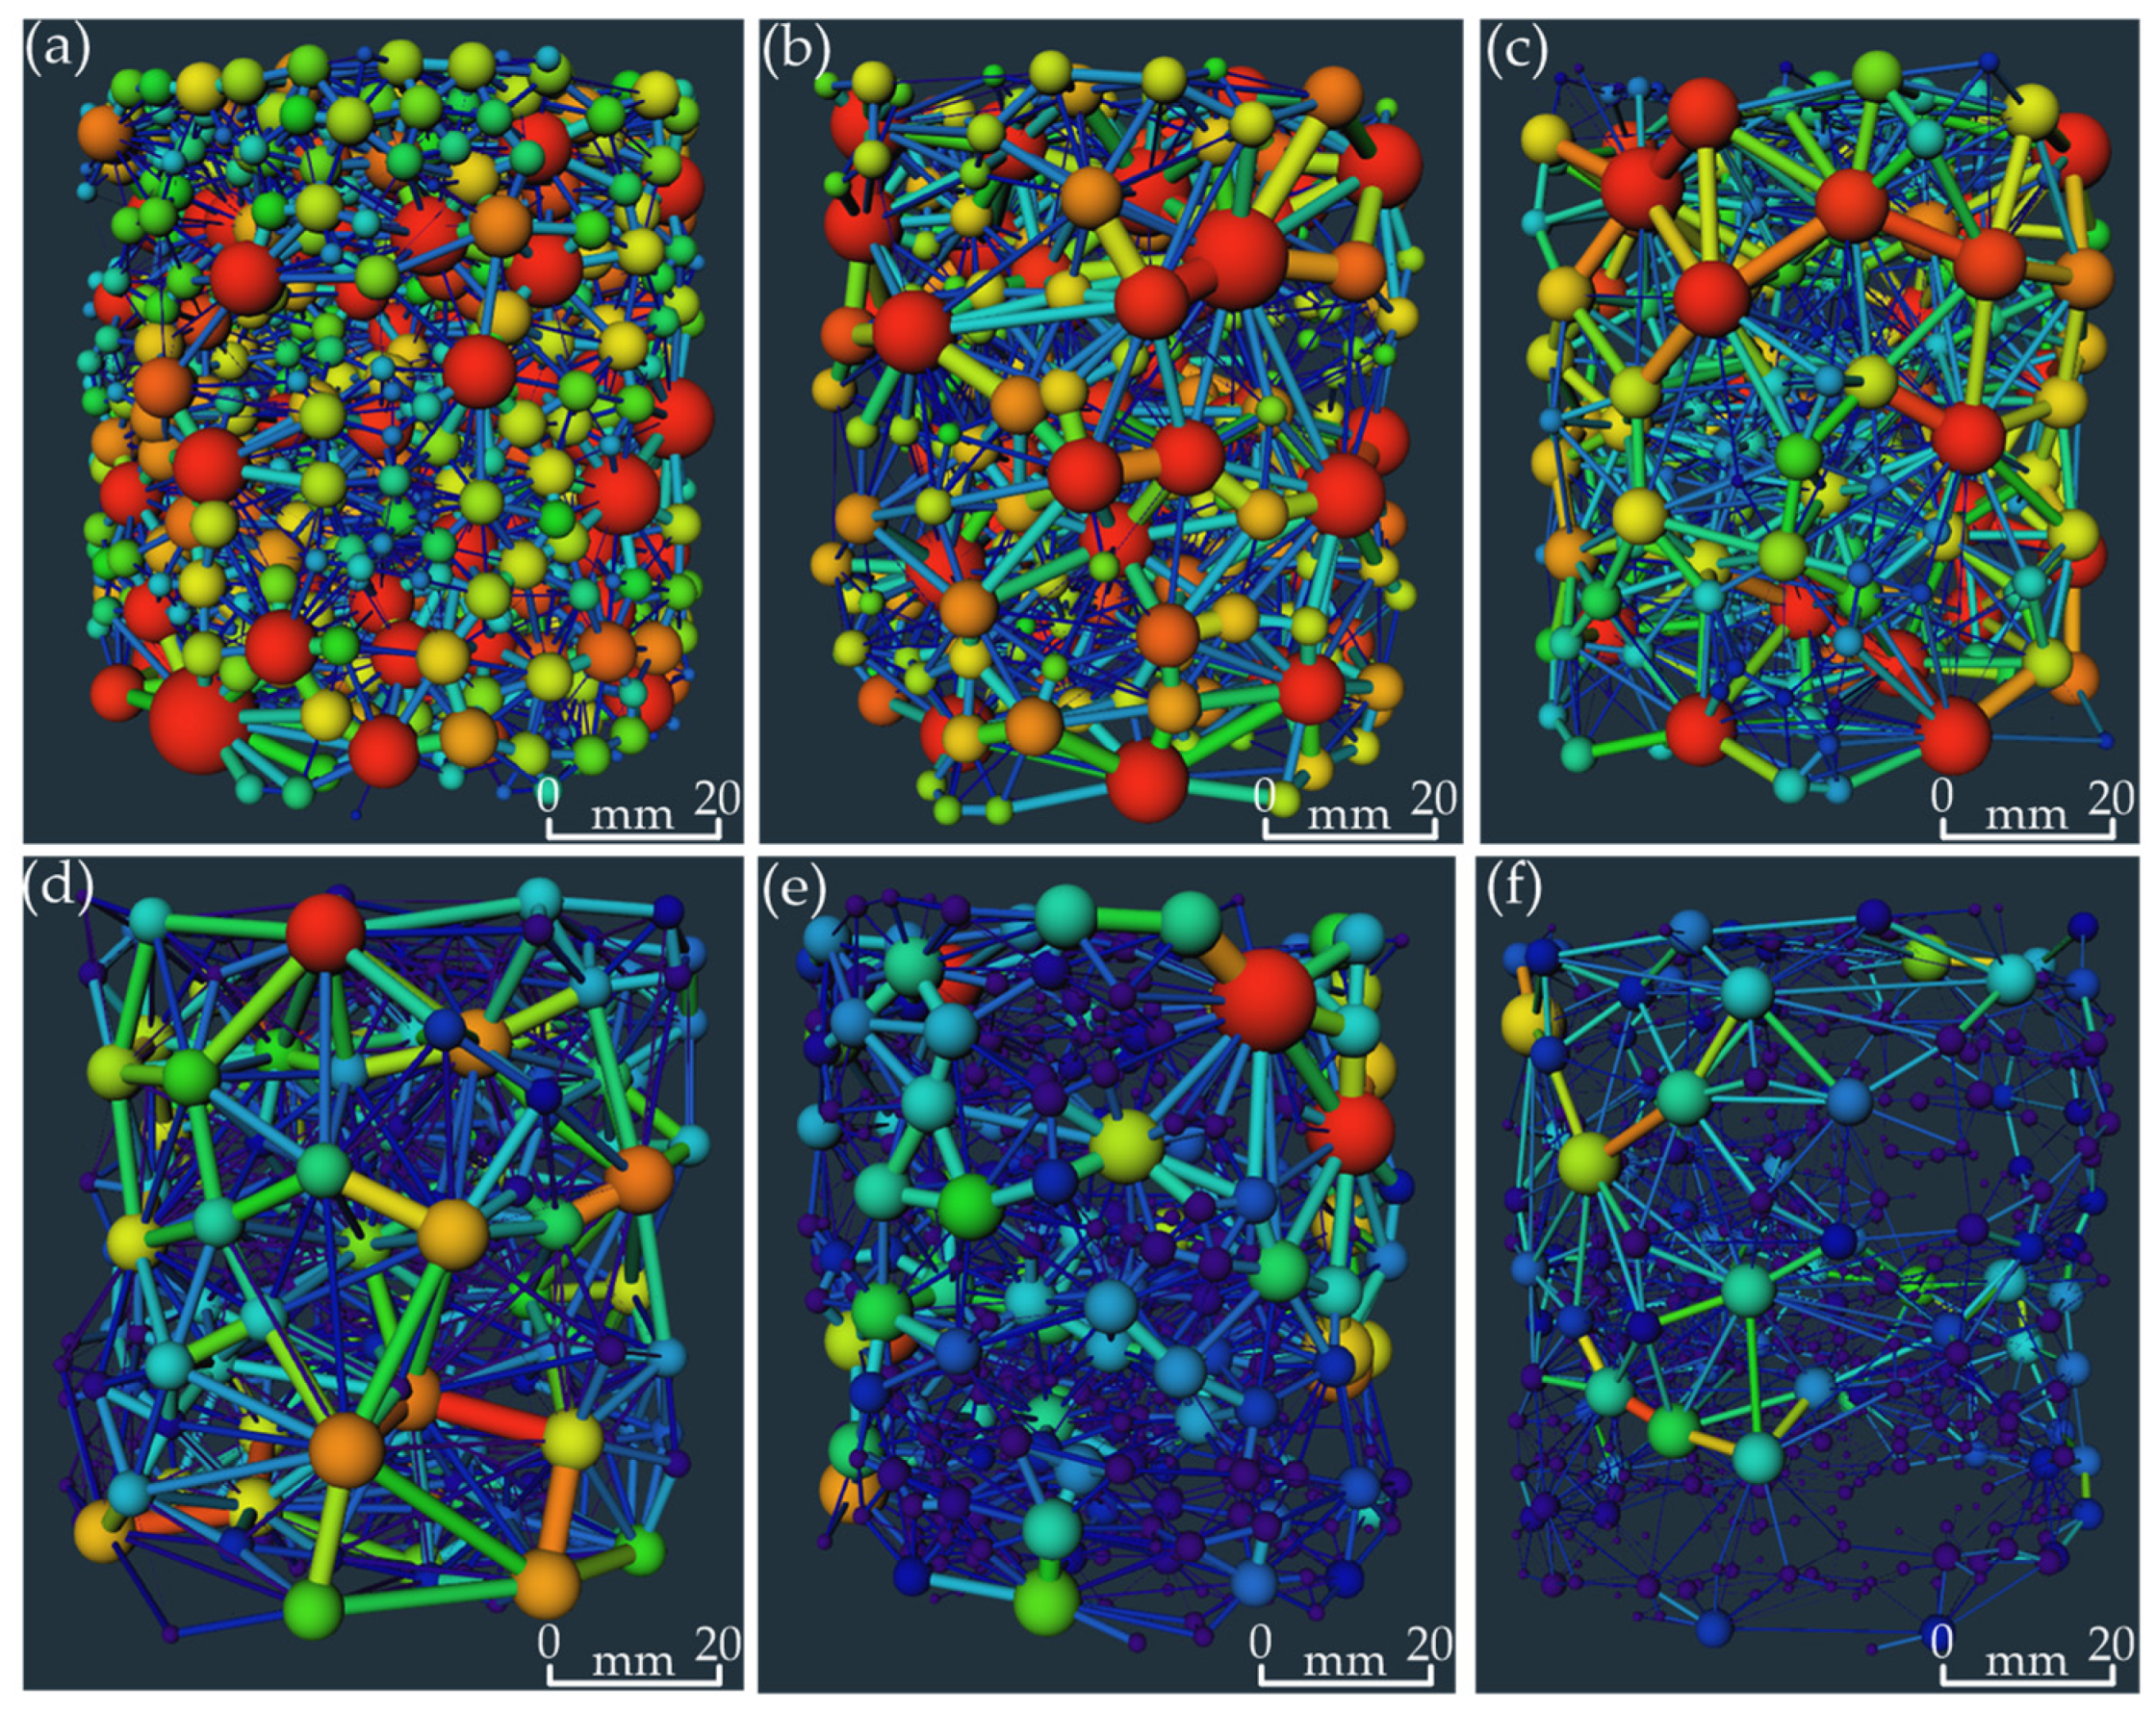
Pores in the sample were divided into pore balls (i.e., relatively large space) and pore channels (i.e., relatively narrow and long space) in the PNM [41,42,43]. The larger the pore ball, the closer the color of the ball was to red. The smaller the pore ball, the closer the color of the ball was to blue. Similarly, the larger the pore channel, the closer the color of the channel was to red. The smaller the pore channel, the closer the color of the channel was to blue. Based on the 3D reconstructed model and PNM, all the pore structure parameters of the connected pores were obtained and are expressed as follows.
In order to study the pore size distribution more quantitatively, the cumulative distribution function proposed by Ke et al. [2] was used to fit the pore size distribution curve obtained from the PNM:
F ( d ) = 1 exp d d min / λ η
where F(d) is the cumulative distribution function; d (mm) is the diameter of the pore ball; dmin (mm) is the minimum diameter of the pore ball; and λ and η are the curve parameters. In the above model, λ is a coefficient related to the average pore diameter [2].
Based on the PNM, the coordination number of one pore ball is the total number of pore throats connecting it [43]. Therefore, the average coordination number of all the pore balls of connected pores can be used to describe the pore connectivity of the sample:
C e = 1 k c i k
where ci is the coordination number of the ith pore ball of connected pores; and k is the total number of pore balls of connected pores.
According to the study by Shanti et al. [44] and Zhu et al. [45], a tortuosity calculation was performed by the path length ratio (PLR) using the relationship between the geodesic and Euclidean lengths:
τ = L t L 0
where τ is the tortuosity, Lt (mm) is the length of a pore channel (geodesic length), and L0 (mm) is the end-to-end length of the pore channel (Euclidean length).
The PLR method is especially useful for determining tortuosity from 3D images, such as those produced from CT scanning, since Lt and L0 can be measured directly. In this study, the lengths Lt and L0 were measured from the PNM. Firstly, both the top and bottom regions with a height equivalent to 10% of the total height of the sample were divided. After the selection of one pore ball in the top region and the other pore ball in the bottom region, the length of the shortest connected pore throat of the two pore balls was determined as Lti, and the end-to-end length of the two pore balls was determined as L0i. Then, considering there are m groups from the independent selection of two pore balls, the equivalent tortuosity, τe, of the connected pores of the sample can be derived as:
τ e = 1 m τ i m = 1 m L t i L 0 i m
where τi is the tortuosity of the ith group of the top and bottom pore balls of connected pores.
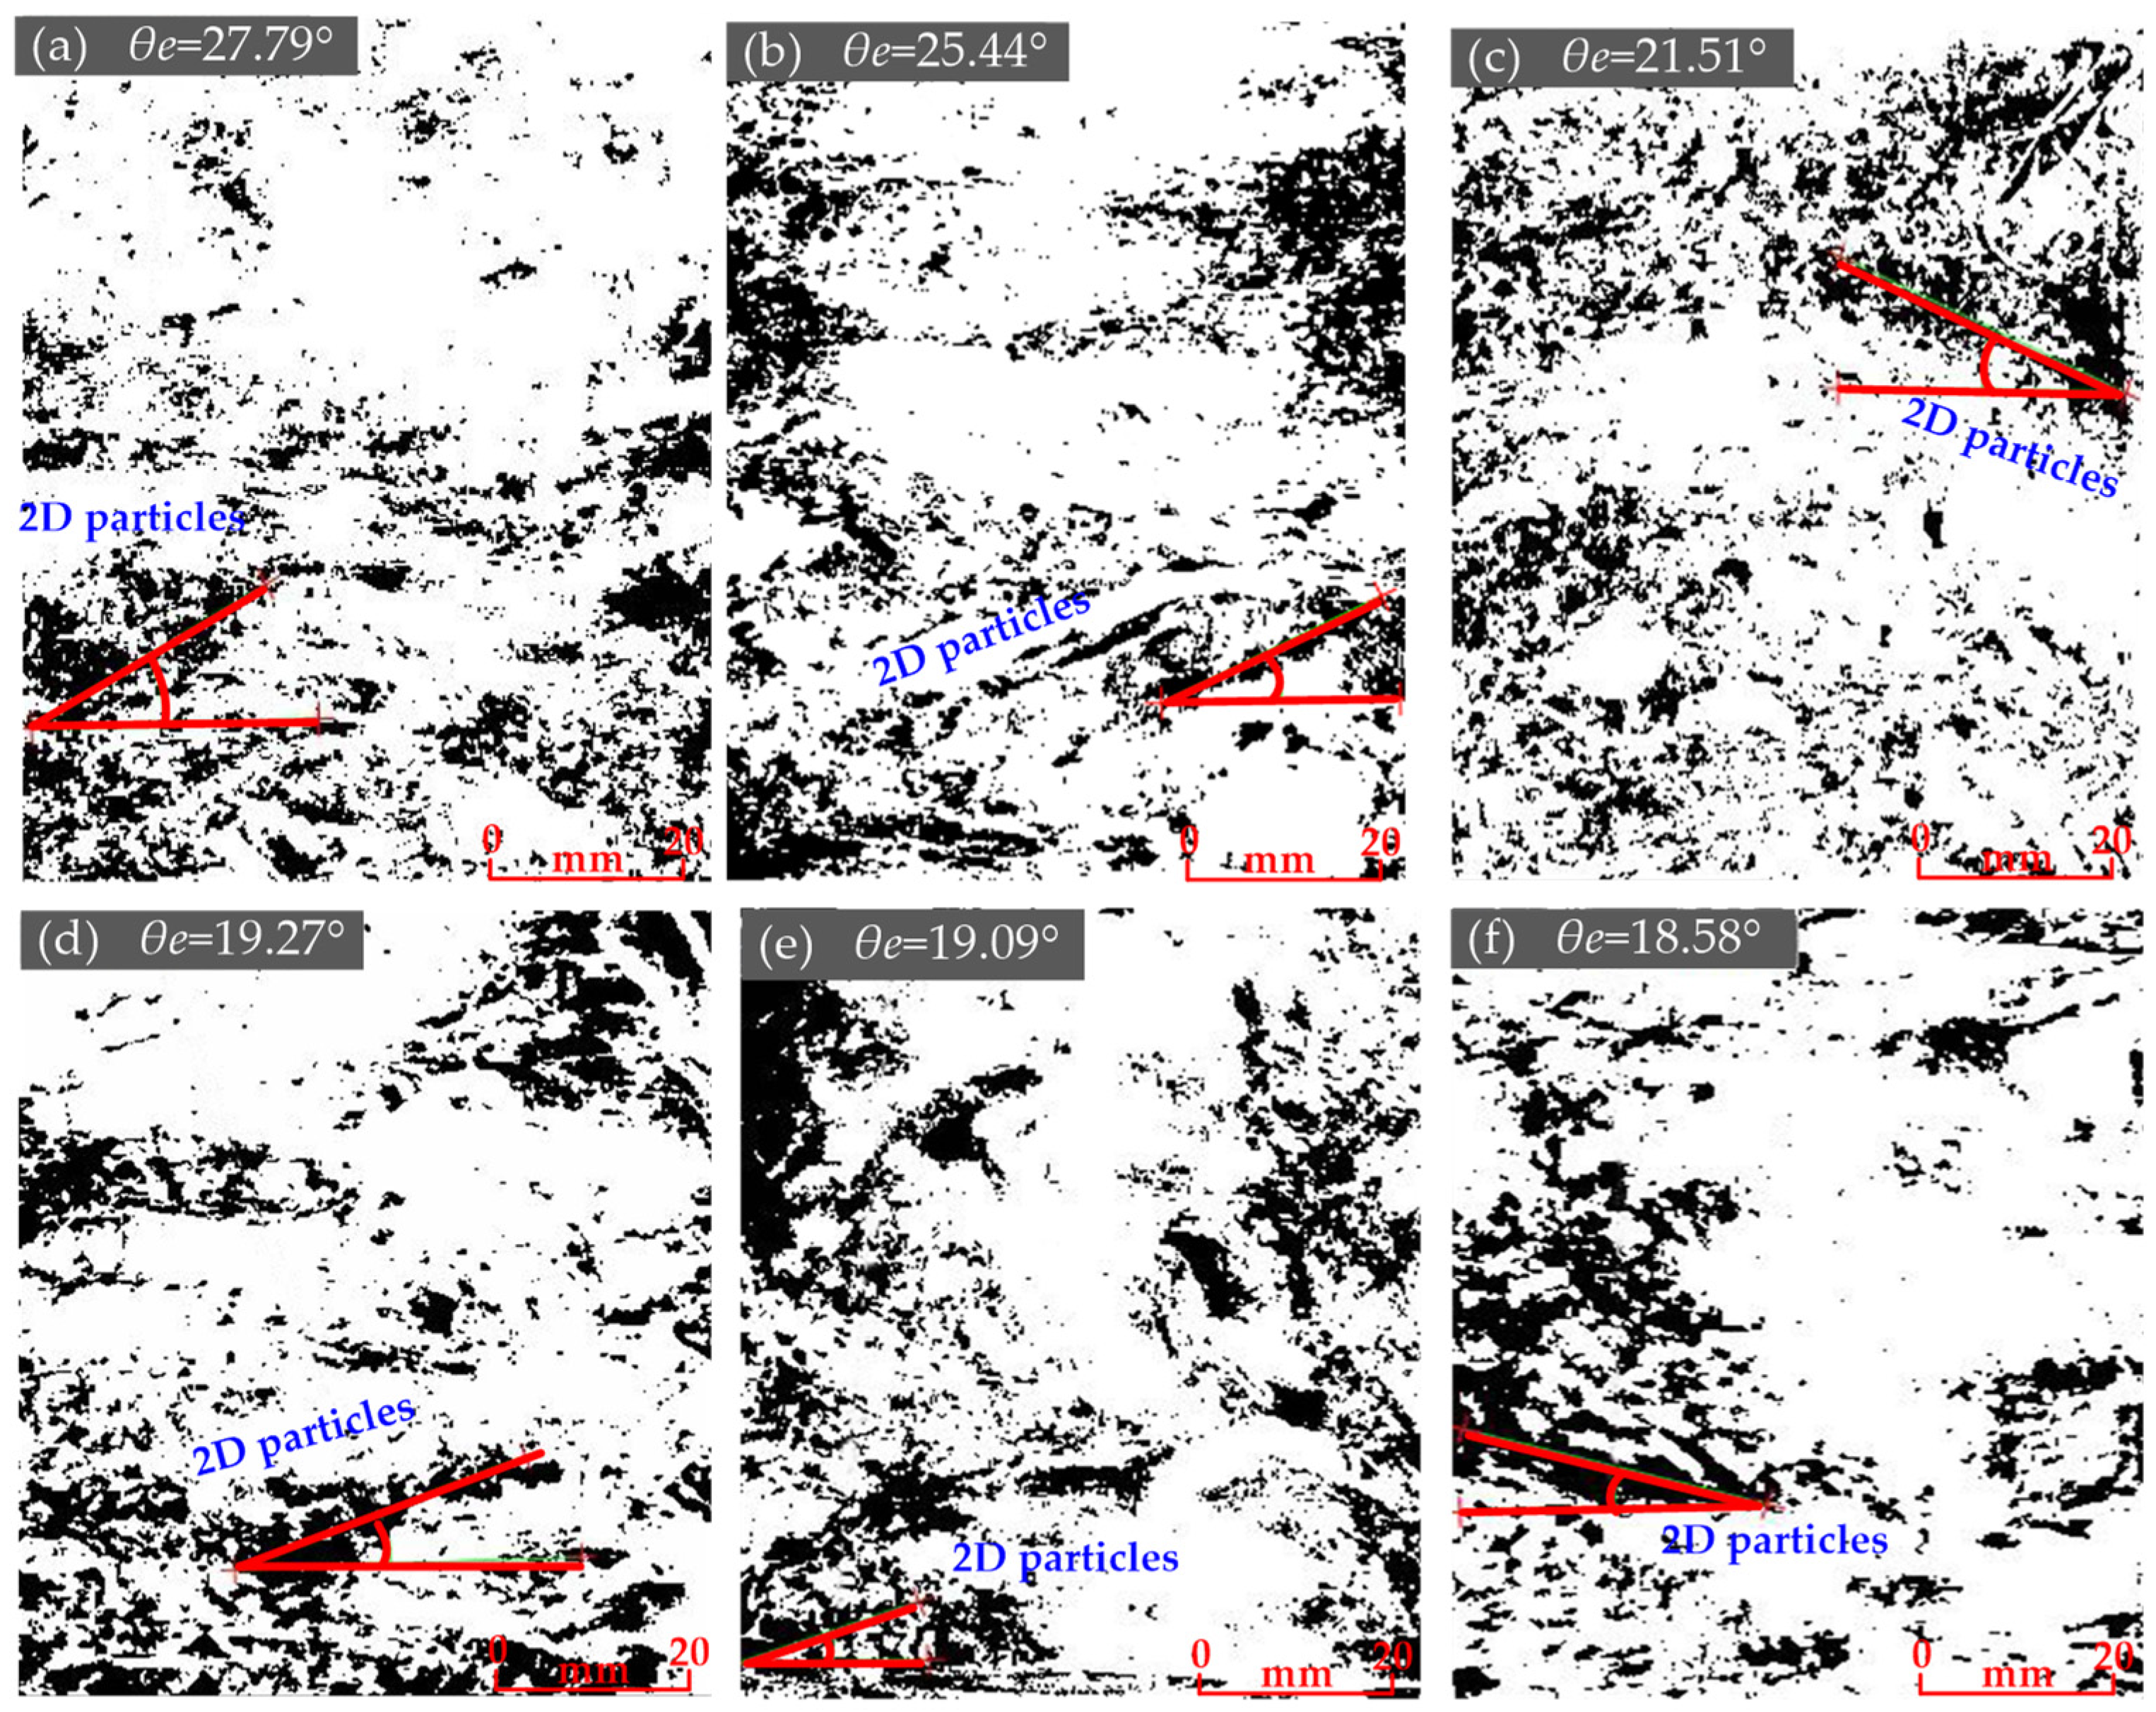
Based on the 2D slice image from the 3D reconstructed model by VG-Studio, the angle (relative to the horizontal plane) of connected pores around 2D particles could be determined as the angle of the pore channel for the MSW sample [19,20]. However, in the former studies, the standard for choosing the so-called connected pores around 2D particles was not mentioned. In this study, the cross-sections through the axis of the cylindric sample were checked by every 1 degree to achieve the longest connected pore channel around 2D particles. The angle of this pore channel was determined as the pore angle of the borehole sample, θe.

4. Testing Results

4.1. Waste Composition, Degree of Degradation, and Basic Physical Properties

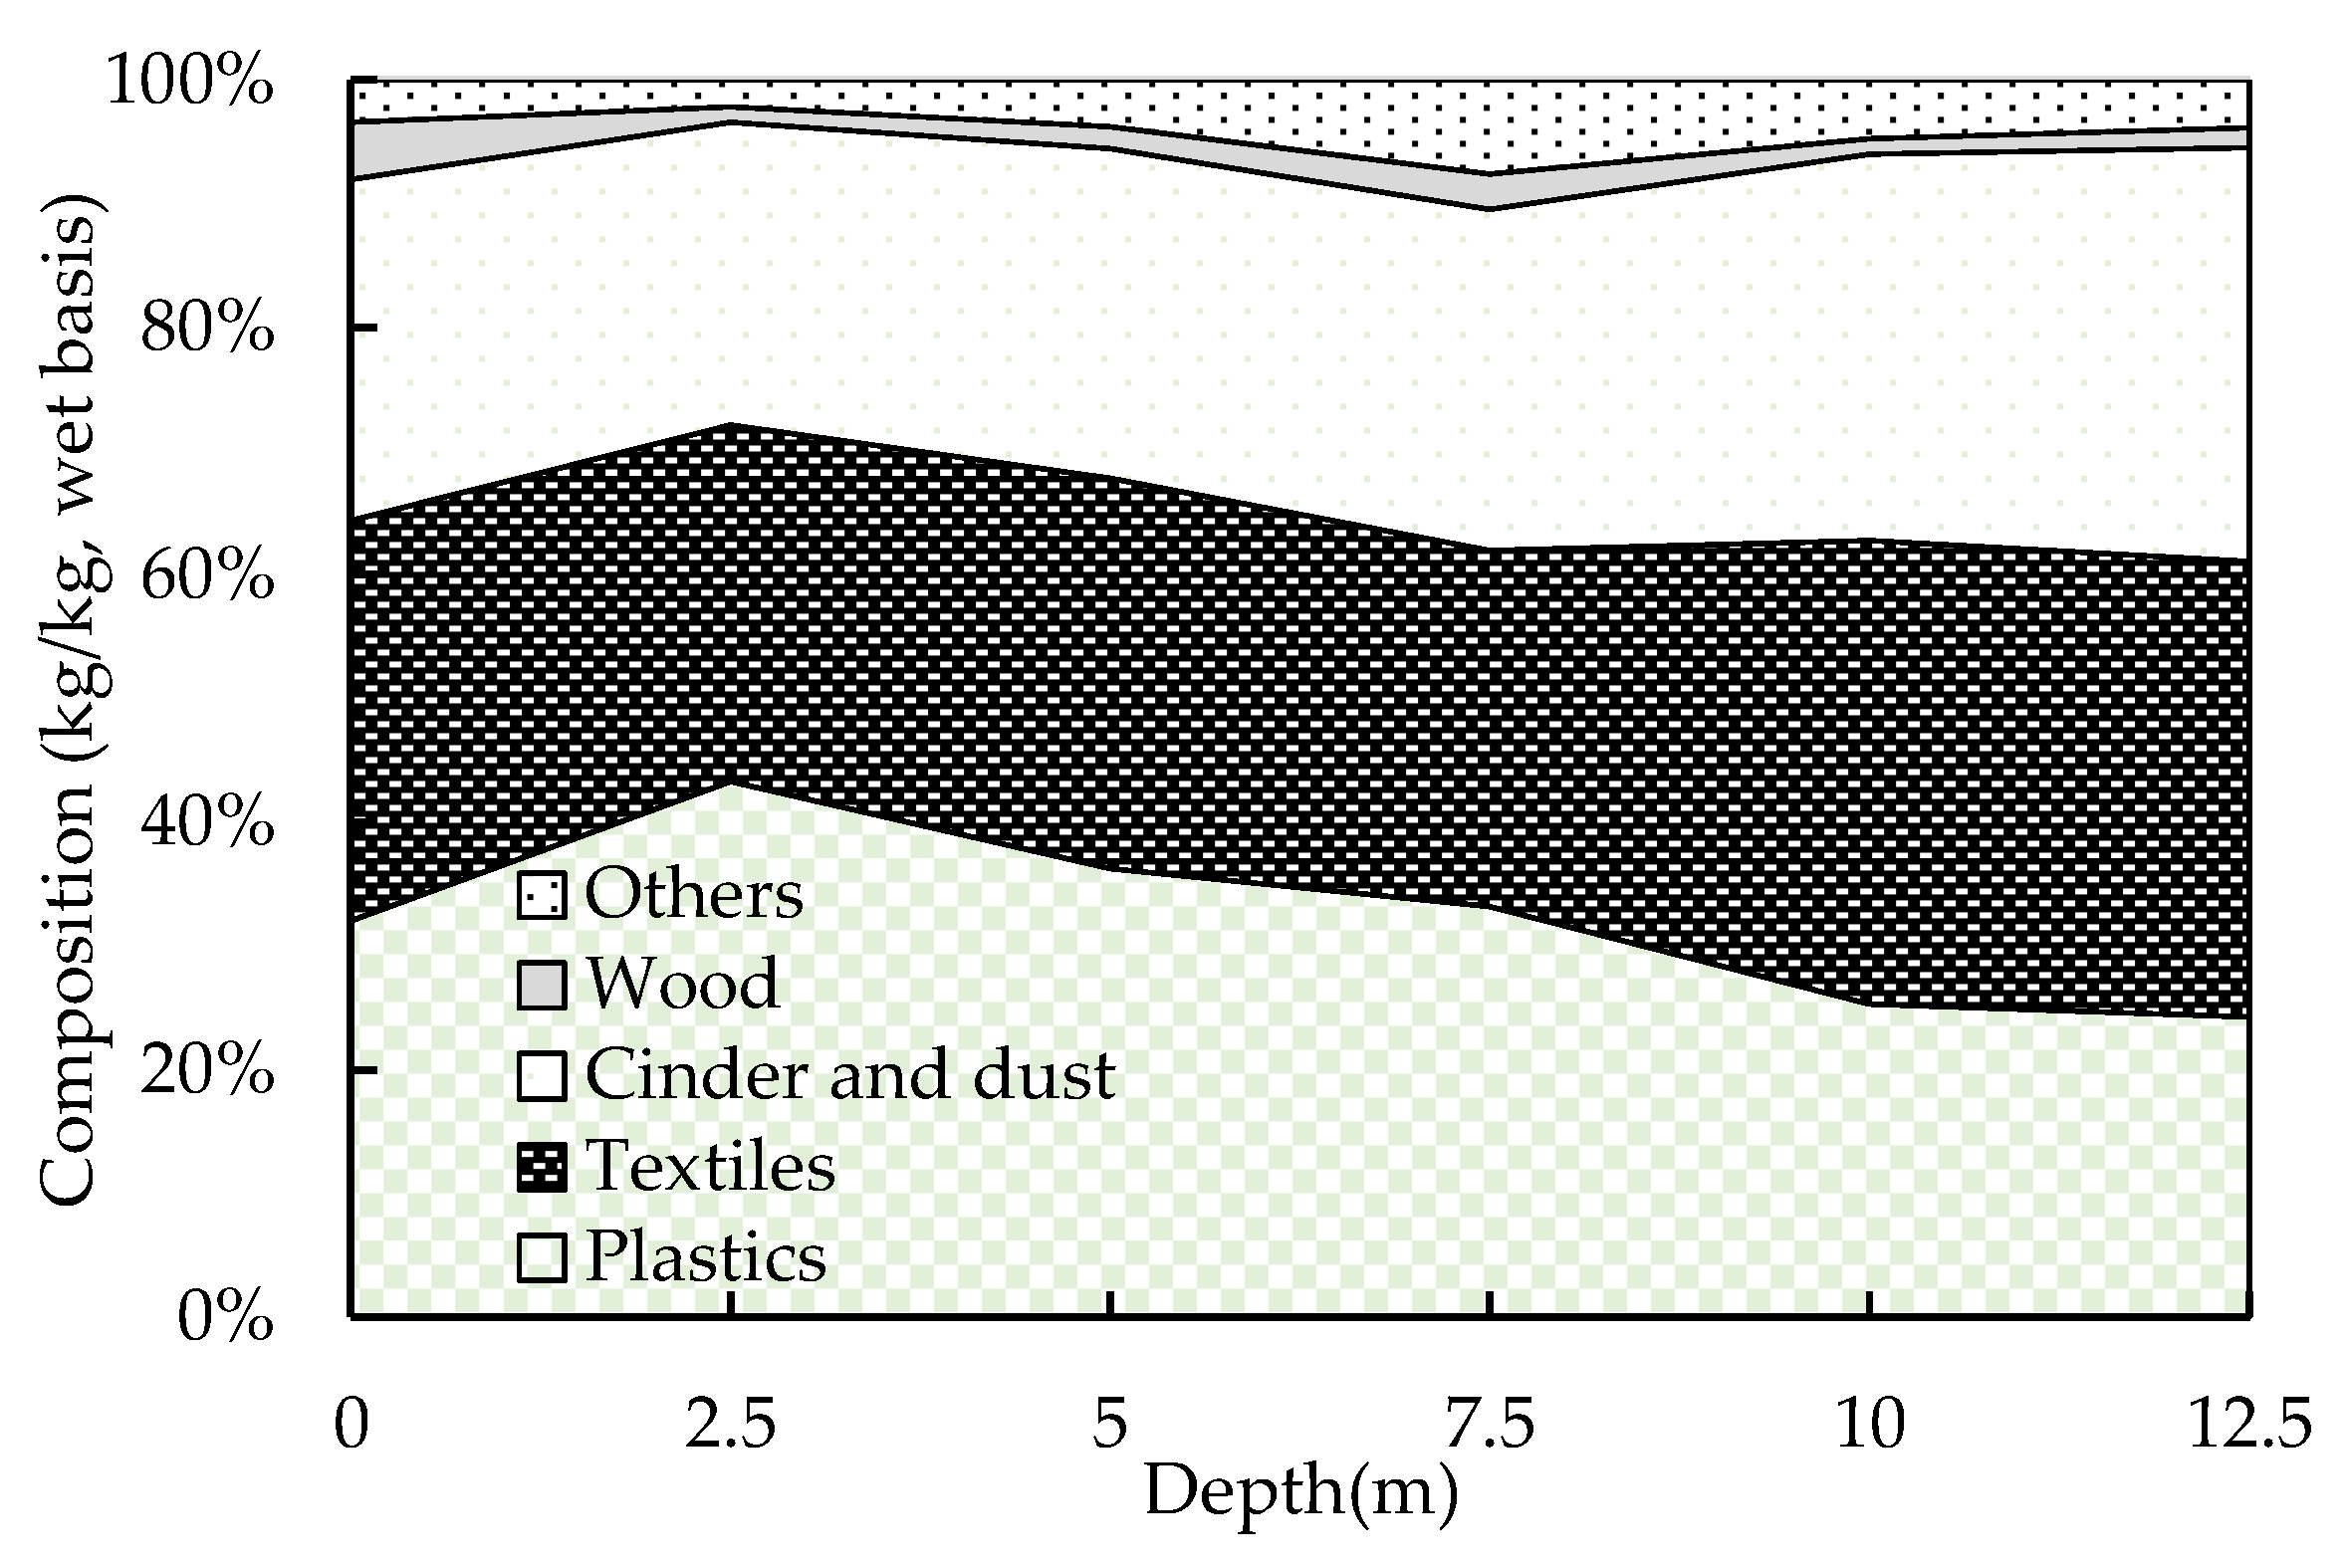
Photos of the typical composition of a borehole sample are shown in Figure 5. The contents of typical components (kg/kg, wet basis) are shown in Figure 6. The results show that, except for the sample from the landfill surface, the content of plastics decreased with increasing depth, ranging from 24.23% to 43.32%. The content of textiles showed a slight increase with increasing depth, ranging from 28.76% to 37.49%. The content of cinder and dust slightly increased with increasing depth, ranging from 24.43% to 33.47%. The contents of wood and others were very low, which were about 1.25~4.61% and 2.15~7.55%, respectively.
Considering the weak degradability of plastics, the decreased content of plastics with increasing depth might be due to their aging and poor ductility, which leads to fragmentation during the subsequent landfilling of waste. The slight increase in textiles content with increasing depth could be due to their weak degradability and relatively good durability. The increased content of cinder and dust with increasing depth was mainly due to the degradation and fragmentation of large particles.
The results of the C/L, w, Gs, and e of the borehole samples at different depths are shown in Table 1. It shows that C/L decreased from 0.85 to 0.47 with increasing depth. Except for the sample at a depth of 2.5 m, the values of w and Gs generally increased with increasing depth, which ranged between 26.5~48.7% and 1.01~1.25, respectively. The value of e decreased from 1.68 to 1.10 with increasing depth. The above results indicate that, as the depth increases, the degrees of degradation and compression also increase. This is consistent with the change in waste composition mentioned above and the change in particle shape discussed below.

4.2. Particle Shape

Photos of typical particles with different shapes are shown in Figure 7, with their contents shown in Figure 8. The results show that the content of 0D particles increased with increasing depth, ranging from 25.74% to 30.15%. The contents of 1D and 3D particles were very low, ranging from 0.86% to 2.45% and 1.08% to 8.21%, respectively, with no clear variation trend. The content of 2D particles slightly decreased with increasing depth, ranging from 60.22% to 72.16%. Due to the fact that the majority of 0D particles were cinder and dust, the variation trend of their content was similar to that of cinder and dust. Similarly, as the 2D particles were mainly plastics and textiles, the variation trend of their content was roughly the same as that of the total content of plastics and textiles.
The particle size distribution curves of 0D particles at different depths are shown in Figure 9. The results show that the sample from the landfill surface had the lowest content (about 69.19%) of particles smaller than 10 mm, while samples obtained from deeper within the landfill had the highest content (about 30.81%) of particles between 10 mm and 20 mm. All the samples basically did not contain particles smaller than 0.075 mm. The contents of particles within the ranges of 0.075 mm~0.01 mm, 0.01 mm~0.25 mm, and 0.5 mm~1 mm generally increased with increasing depth. The content of particles within the range of 1 mm~20 mm decreased from 96.02% to 75.23% with increasing depth. Therefore, overall, the deeper sample tended to have more small particles and less large particles.

4.3. Size of Connected Pores

The original 3D images from VG-Studio for the samples at different depths are shown in Figure 10. The PNM models from AVIZO for the samples are shown in Figure 11. The results indicate that, as the depth increased, the number and diameter of pore balls tended to decrease. The number and diameter of pore channels also showed a decreasing trend. Therefore, overall, the volume and connectivity of pores tended to decrease with increasing depth.
The pore diameter distribution curves of the samples are shown in Figure 12. The figure shows that the cumulative distribution curve of the pore diameter tended to shift to the left with increasing depth. There was a significant change when the depth increased from 5 m to 7.5 m. This indicates that the landfilled MSW tends to have more small pore channels with increasing depth. Based on Equation (1), the value of λ representing the average pore diameter was obtained. It shows a decrease from 0.209 to 0.190 with increasing depth (see Table 2).
The variation in pore size in Figure 11 and Figure 12 is in agreement with the measured decreases in the degree of degradation, C/L, and void ratio, e, with increasing depth (see Table 1), as degradation and compression tend to result in denser waste with more fine particles (see Figure 9) and more small pores.

4.4. Connectivity, Tortuosity, and Angle of Connected Pores

The average coordination number, pore tortuosity, and pore arrangement angle of the samples at different depths are shown in Table 2. The results show that the average coordination number, ce, gradually decreases from 12.0 to 4.1 with increasing depth. This indicates that the connectivity of pores decreases with increasing depth. The tortuosity, τ, generally shows an increase with increasing depth. It was about 1.129 for the shallowest sample and 1.184 for the deepest sample. The angle of connected pores, θe, decreased from 29.6° to 17.8° with increasing depth, which indicates the flatter arrangement of waste particles. As shown in Figure 13, the length of the longest connected pores around 2D particles is not long in the 2D slice image. This indicates that the connected pore channel actually deviated from the 2D plane. Its 3D spatial distribution is rather complex, such as that shown in Figure 11.

5. Discussions

A summary of the reported studies on the solid and pore structures of MSW is shown in Table 3. In this study, the contents of 2D particles and 0D particles decreased and increased with increasing depth, respectively. This is in agreement with the results of Ke et al. [21], which is mainly due to the greater degree of degradation for deeper MSW. As the borehole samples in this study showed a smaller decrease in C/L (i.e., 0.85~0.47) than that (i.e., 3.93~0.61) of Ke et al. [21], the variations in the contents of 2D particles and 0D particles in this study were less significant. The horizontal orientation of 2D particles was found in this case study, which was also shown in the reported studies [2,6,19,20]. However, in the study by Ke et al. [2], the influence of vertical stress on the structural solid angle (30°~32°) was found to be limited for synthetic MSW. This might be mainly because each waste component was shredded to less than 5 cm to artificially prepare the samples in their study.
For the pores of MSW, a layered structure was found in this study and the reported ones [19,20]. This was mainly due to the horizontal orientation of 2D particles and the large pores around 2D particles [20,21]. A decrease in the pore angle (θe) with increasing depth was found in this study, as greater compression in deeper layers can result in a flatter pore structure [19,20]. In this study, the decrease in connectivity (ce) with increasing depth was in accordance with the findings of Zhang et al. [18] and Liu et al. [16]. The increase in tortuosity (τ) with increasing depth agreed with the findings of Qin et al. [19] and Liu et al. [16], which was attributed to the greater degrees of degradation and compression in deeper layers. The decrease in the average pore diameter coefficient (λ) with increasing depth was also in agreement with the findings of Qin et al. [19] and Ke et al. [2], which was mainly due to fewer large pores resulting from greater compression. However, it should be noted that the decreases of λ and τ with increasing depth were not significant in this study. This might be due to the relatively great degree of degradation (i.e., 0.85~0.47) of the borehole samples at different depths.
As shown in Table 3, the experimental study on the solid and pore structures of real landfilled MSW (e.g., borehole samples) is rather limited and deserves more attention. There is still a lack of research on the link between the structural parameters and fluid flow parameters of MSW. The decreased porosity, increased small pore channels, decreased connectivity, and increased tortuosity with increasing depth in this study are consistent with the reported decreased air permeability and hydraulic conductivity in similar landfills in China [46,47,48]. Currently, the liquid and gas permeabilities and soil water characteristic curves of the borehole samples in this study are being tested. Based on models such as the Kozeny–Carman model and the van Genuchten-Mualem model, a quantitative analysis of the relationship between structural parameters and fluid flow parameters can be performed [49,50]. This will be shown in a separate paper.
It is also necessary to reveal the implications of the laboratory-observed trends for field-scale phenomena (e.g., leachate migration, gas flow, and stability) in landfilled MSW. For example, the reported anisotropy of fluid flow [51] and variation in slope stability [47] are believed to be correlated to the above structural parameters. As it is hard to obtain undisturbed representative samples, the combination of the laboratory CT results with field, non-invasive monitoring results is believed to provide a better understanding of the real behaviors of landfilled MSW. Future studies in this area are urgently required.

6. Conclusions

The quantitative analysis of the structural characteristics of the solids and pores of landfilled MSW was carried out through CT scanning borehole MSW samples (i.e., depths in the range of 0 m~12.5 m). The main conclusions drawn from this study are the following:
(i)
The ratio of cellulose content to lignin content (i.e., C/L) decreased from 0.85 to 0.47 with increasing depth, which showed that the deeper sample had a greater degree of degradation.
(ii)
For solid particles in the samples, 2D particles constituted the greatest fraction (60.22~72.16%), which showed a decrease with increasing depth. The content of 0D particles increased with increasing depth, which was in the range of 25.74~30.15%. The contents of 1D and 3D particles showed no clear variations with depth.
(iii)
For pores in the samples, the void ratio decreased from 1.68 to 1.10 with increasing depth, indicating the deeper sample had a greater degree of compression. With the increase in depth, there were more small-pore channels with an average pore diameter coefficient (λ) decreasing from 0.209 to 0.190. Furthermore, the pore angle (θe) decreased from 29.6° to 17.8°, tortuosity (τ) increased from 1.129 to 1.184, and connectivity (ce) decreased from 12.0 to 4.1.
The observed variation trends of the above structural parameters are consistent with the reported laboratory and field studies. However, two aspects for further study are still required. First, it is necessary to establish the relationship between structural parameters and fluid flow parameters. Second, the combination of a laboratory microscale study and field, non-invasive, geophysical study can be conducted to provide a better understanding of the real behaviors of landfilled MSW.

Author Contributions

Writing—review and editing, X.X.; software, Z.Z. and L.L.; validation, J.H. and C.C.; formal analysis, L.L. and C.C.; data curation, H.K. and L.L.; writing—original draft preparation, X.X.; writing—review and editing, X.X. and Z.Z.; visualization, Z.Z. and L.L.; supervision, H.K.; funding acquisition, X.X. and J.H. All authors have read and agreed to the published version of the manuscript.

Funding

The work was supported by the National Natural Science Foundation of China, Grant Nos.: 52178363, 42372303, and 52108348.

Data Availability Statement

The data presented in this study are available upon request from the corresponding authors.

Conflicts of Interest

Author L.L. was employed by Dongtong Geotechnical Technology Co., Ltd. Author C.C. was employed by PowerChina Chengdu Engineering Co., Ltd. The remaining authors declare that the research was conducted in the absence of any commercial or financial relationships that could be construed as a potential conflict of interest. Dongtong Geotechnical Technology Co., Ltd. and PowerChina Chengdu Engineering Co., Ltd. had no role in the design of the study; in the collection, analyses, or interpretation of data; in the writing of the manuscript, or in the decision to publish the results.

References

  1. Muaaz-Us-Salam, S.; Cleall, P.J.; Harbottle, M.J. The case for examining fluid flow in municipal solid waste at the pore-scale—A review. Waste Manag. Res. 2019, 37, 315–332. [Google Scholar] [CrossRef]
  2. Ke, H.; Liu, Y.; Meng, M.; Hu, J.; Zhao, S.Y.; Qin, R.; Wu, X.W. Experimental study on the pore and solid structures of municipal solid waste under compression based on computed tomography (CT) scans. Environ. Sci. Pollut. Res. 2022, 29, 37359–37374. [Google Scholar] [CrossRef] [PubMed]
  3. Nanda, S.; Berruti, F. Municipal solid waste management and landfilling technologies: A review. Environ. Chem. Lett. 2021, 19, 1433–1456. [Google Scholar] [CrossRef]
  4. Chen, Y.M. Soil Degradation-Consolidation Theory and Its Applications; Springer: Singapore, 2024. [Google Scholar]
  5. Rosqvist, H.; Destouni, G. Solute transport through preferential pathways in municipal solid waste. J. Contam. Hydrol. 2000, 46, 39–60. [Google Scholar] [CrossRef]
  6. Caicedo-Concha, D.M.; Sandoval-Cobo, J.J.; Whiting, K. An experimental study on the impact of two dimensional materials in waste disposal sites: What are the implications for engineered landfills? Sustain. Environ. Res. 2016, 26, 255–261. [Google Scholar] [CrossRef]
  7. Zhang, W.; Yuan, S. Characterizing preferential flow in landfilled municipal solid waste. Waste Manag. 2019, 84, 20–28. [Google Scholar] [CrossRef]
  8. Athanasopoulos, G.; Grizi, A.; Zekkos, D.; Founta, P.; Zisimatou, E. Municipal solid waste as a reinforced soil: Investigation using synthetic waste. In GeoCongress 2008: Geotechnics of Waste Management and Remediation; American Society of Civil Engineers (ASCE): Reston, VA, USA, 2008. [Google Scholar] [CrossRef]
  9. Zekkos, D.; Grizi, A.; Athanasopoulos, G. Experimental investigation of the effect of fibrous reinforcement on shear resistance of soil-waste mixtures. Geotech. Test. J. 2013, 36, 867–881. [Google Scholar] [CrossRef]
  10. Ramaiah, B.J.; Ramana, G.V. Study of stress-strain and volume change behavior of emplaced municipal solid waste using large-scale triaxial testing. Waste Manag. 2017, 63, 366–379. [Google Scholar] [CrossRef]
  11. Jing, X.; Wu, S.; Qin, J.; Li, X.; Liu, X.; Zhang, Y.; Mao, J.; Nie, W. Multiscale mechanical characterizations of ultrafine tailings mixed with incineration slag. Front. Earth Sci. 2023, 11, 1123529. [Google Scholar] [CrossRef]
  12. Powrie, W.; Xu, X.B.; Richards, D.; Zhan, L.T.; Chen, Y.M. Mechanisms of settlement in municipal solid waste landfills. J. Zhejiang Univ.—Sci. A 2019, 20, 927–947. [Google Scholar] [CrossRef]
  13. Pi, X.; Fei, X.; Wang, Y.; Sun, X.; Guo, Y. Global void ratio of municipal solid waste for compression indices estimation. Waste Manag. 2023, 160, 69–79. [Google Scholar] [CrossRef] [PubMed]
  14. Reddy, K.R.; Kumar, G.; Giri, R.K. Modeling coupled processes in municipal solid waste landfills: An overview with key engineering challenges. Int. J. Geosynth. Ground Eng. 2017, 3, 6. [Google Scholar] [CrossRef]
  15. Feng, S.; Zheng, Q.; Chen, H.X. Unsaturated flow parameters of municipal solid waste. Waste Manag. 2017, 63, 107–121. [Google Scholar] [CrossRef] [PubMed]
  16. Liu, X.; Zhang, L.; Wu, S.; Shao, Y.; Wu, X.; Li, Z. Changes in municipal solid waste pore structure during degradation: Analysis of synthetic waste using X-ray computed microtomography. Sci. Total Environ. 2020, 708, 135089. [Google Scholar] [CrossRef]
  17. Hanson, J.L.; Cox, J.T.; Yesiller, N. Evolution of municipal solid waste structure over time: Compaction and settlement effects. Environ. Geotech. 2023, 10, 455–463. [Google Scholar] [CrossRef]
  18. Zhang, L.; Liu, X.; Wu, S.; Li, Z. CT measurement analysis for simulation experiment of pore structure of domestic waste landfill pile. Environ. Eng. 2018, 36, 165–170. [Google Scholar]
  19. Qin, R.; Ke, H.; Hu, J.; Lan, J.W. Analysis of particle composition and structure of MSW based on permeability. China Environ. Sci. 2019, 39, 203–209. [Google Scholar]
  20. Meng, M.; Qin, R.; Luo, P.; Ke, H. Structure and hydraulic characteristics of municipal solid waste based on CT scanning. J. Cent. South Univ. Sci. Technol. 2020, 51, 126–133. [Google Scholar]
  21. Ke, H.; Liu, Y.; Hu, J.; Qin, R.; Xu, X.B.; Chen, Y.M. Experimental study on anisotropy of hydraulic conductivity for municipal solid waste. Waste Manag. 2022, 137, 39–49. [Google Scholar] [CrossRef]
  22. Juarez, M.B.; Mondelli, G.; Giacheti, H.L. An overview of in situ testing and geophysical methods to investigate municipal solid waste landfills. Environ. Sci. Pollut. Res. 2023, 30, 24779–24789. [Google Scholar] [CrossRef]
  23. Orlando, L.; Marchesi, E. Georadar as a tool to identify and characterise solid waste dump deposites. J. Appl. Geophys. 2001, 48, 163–174. [Google Scholar] [CrossRef]
  24. Vargemezis, G.; Tsourlos, P.; Giannopoulos, A.; Trilyrakis, P. 3D electrical resistivity tomography technique for the investigation of a construction and demolition waste landfill site. Stud. Geophys. Et Geod. 2015, 59, 461–476. [Google Scholar] [CrossRef]
  25. Zhao, R.; Anderson, N.; Sun, J. Geophysical investigation of a solid waste disposal site using integrated electrical resistivity tomography and multichannel analyses of surface waves methods. J. Geosci. Environ. Prot. 2020, 8, 55–69. [Google Scholar] [CrossRef]
  26. Clément, R.; Legchenko, A.; Quetu, M.; Descloitres, M.; Oxarango, L.; Guyard, H.; Girard, J. Experimental study of domestic waste material using magnetic resonance measurements. Exp. Study Domest. Waste Mater. Using Magn. Reson. Meas. Near Surf. Geophys. 2011, 9, 179–185. [Google Scholar] [CrossRef]
  27. Abreu, A.E.S.; Gandolfo, O.C.B.; Vilar, O.M. Characterizing a Brazilian sanitary landfill using geophysical seismic techniques. Waste Manag. 2016, 53, 116–127. [Google Scholar] [CrossRef]
  28. Wille, E.; Martens, K.; Behets, T.; Umans, L.; Walraevens, K. Exploring the Anthropocene: Mapping and Surveying of Landfills in Flanders. In Proceedings Sardinia 2013; Italy, 2013. Available online: https://ovam.vlaanderen.be/c/document_library/get_file?uuid=f452c518-8ab5-5956-bf89-4c1d72aac18e&groupId=177281 (accessed on 1 January 2025).
  29. Isobe, Y.; Ishimori, H. Continuous electrical resistivity tomography monitoring in waste landfill sites with different properties and visualization of water channels. Appl. Sci. 2025, 15, 6920. [Google Scholar] [CrossRef]
  30. Ministry of Construction of the PRC (MCPRC). Technical Code for Municipal Solid Waste Sanitary Landfill (CJJ 17–2004); China Architecture & Building Press: Beijing, China, 2004. [Google Scholar]
  31. Zhou, H.; Meng, A.; Long, Y.; Li, Q.; Zhang, Y. An overview of characteristics of municipal solid waste fuel in China: Physical, chemical composition and heating value. Renew. Sustain. Energy Rev. 2014, 36, 107–122. [Google Scholar] [CrossRef]
  32. Edjabou, M.E.; Jensen, M.B.; Götze, R.; Pivnenko, K.; Petersen, C.; Scheutz, C.; Astrup, T.F. Municipal solid waste composition: Sampling methodology, statistical analyses, and case study evaluation. Waste Manag. 2015, 36, 12–23. [Google Scholar] [CrossRef]
  33. Kolsch, F. Material Values for Some Mechanical Properties of Domestic Waste. In Proceedings Sardinia 1995; Italy, 1995. Available online: http://www.dr-koelsch.de/assets/Downloads/sardinia95.pdf (accessed on 1 January 2025).
  34. Velkushanova, K.; Caicedo, D.; Richards, D.J.; Powrie, W. A detailed characterisation of an MBT waste. In Proceedings Sardinia 2009; Italy, 2009. Available online: https://www.researchgate.net/publication/281774367_A_detailed_characterisation_of_an_MBT_waste (accessed on 1 January 2025).
  35. Caicedo-Concha, D.M. A Study of the Structure in Solid Wastes and Some Implications for Fluid Flow in Landfills. Ph.D. Thesis, University of Southampton, Southampton, UK, 2013. [Google Scholar]
  36. Qin, R. Study on Structure and Preferential Flow Characteristics of Waste Under Different Degradation Ages. Master’s Thesis, Zhejiang University, Hangzhou, China, 2019. [Google Scholar]
  37. Chen, Y.M.; Liu, X.C.; Xu, W.J.; Li, Y.C.; Lan, J.W.; Zhan, L.T.; Li, H.; Li, C.M. Analysis of stabilization characteristics and exploitability of landfilled municipal solid waste: Case of a typical landfill in China. Sci. Sin. Technol. 2019, 49, 199–211. [Google Scholar] [CrossRef]
  38. Ministry of Housing and Urban-Rural Development of the PRC (MHURDPRC). Technical Specification for Soil Test of Landfilled Municipal Solid Waste (CJJ/T 204–2013); China Architecture & Building Press: Beijing, China, 2013. [Google Scholar]
  39. Van Soest, P.J.; Wine, R.H. Determination of lignin and cellulose in acid-detergent fiber with permanganate. J. Assoc. Off. Anal. Chem. 1968, 51, 780–785. [Google Scholar] [CrossRef]
  40. Barlaz, M.A. Forest products decomposition in municipal solid waste. Waste Manag. 2006, 26, 321–333. [Google Scholar] [CrossRef]
  41. Callow, B.; Falcon-Suarez, I.; Marin-Moreno, H.; Bull, J.M.; Ahmed, S. Optimal X-ray micro-CT image based methods for porosity and permeability quantification in heterogeneous sandstones. Geophys. J. Int. 2020, 223, 1210–1229. [Google Scholar] [CrossRef]
  42. Fan, N.; Wang, J.; Deng, C.; Fan, Y.; Wang, T.; Guo, X. Quantitative characterization of coal microstructure and visualization seepage of macropores using CT-based 3D reconstruction. J. Nat. Gas Sci. Eng. 2020, 81, 103384. [Google Scholar] [CrossRef]
  43. Xing, M.; Wu, J.S.; Zhang, C.Y.; Li, G.C.; Gao, S. Extraction and research on the pore structure of coal and rock based on CT scanning technology. J. North China Inst. Sci. Technol. 2021, 18, 32–38. [Google Scholar]
  44. Shanti, N.O.; Chan, V.W.L.; Stock, S.R.; Carlo, F.D.; Thornton, K.; Faber, K.T. X-ray micro-computed tomography and tortuosity calculations of percolating pore networks. Acta Mater. 2014, 71, 126–135. [Google Scholar] [CrossRef]
  45. Zhu, Y.; Yue, W.; Zhang, X.; Wang, Z.; Lu, M. Advances on the calculation methods of tortuosity in porous media. Prog. Geophys. 2023, 38, 1293–1304. [Google Scholar]
  46. Wu, H.; Chen, T.; Wang, H.; Lu, W. Field air permeability and hydraulic conductivity of landfilled municipal solid waste in China. J. Environ. Manag. 2012, 98, 15–22. [Google Scholar] [CrossRef]
  47. Yang, R.; Xu, Z.; Chai, J.; Qin, Y.; Li, Y. Permeability test and slope stability analysis of municipal solid waste in Jiangcungou Landfill, Shaanxi, China. J. Air Waste Manag. Assoc. 2016, 66, 655–662. [Google Scholar] [CrossRef]
  48. Feng, S.; Gao, K.; Chen, Y.; Li, Y.; Zhang, L.M.; Chen, H.X. Geotechnical properties of municipal solid waste at Laogang Landfill, China. Waste Manag. 2017, 63, 354–365. [Google Scholar] [CrossRef]
  49. Xu, X.B.; Zhan, T.L.T.; Chen, Y.M.; Beaven, R.P. Intrinsic and relative permeabilities of shredded municipal solid wastes from the Qizishan landfill, China. Can. Geotech. J. 2014, 51, 1243–1252. [Google Scholar] [CrossRef]
  50. Cao, W.; Hu, N.; Yan, G.; Hofmann, H.; Scheuermann, A. Permeability–porosity model considering oxidative precipitation of Fe (II) in granular porous media. J. Hydrol. 2024, 636, 131346. [Google Scholar] [CrossRef]
  51. Singh, K.; Kadambala, R.; Jain, P.; Xu, Q.Y.; Townsend, T.G. Anisotropy estimation of compacted municipal solid waste using pressurised vertical well liquids injection. Waste Manag. Res. 2014, 32, 482–491. [Google Scholar] [CrossRef] [PubMed]
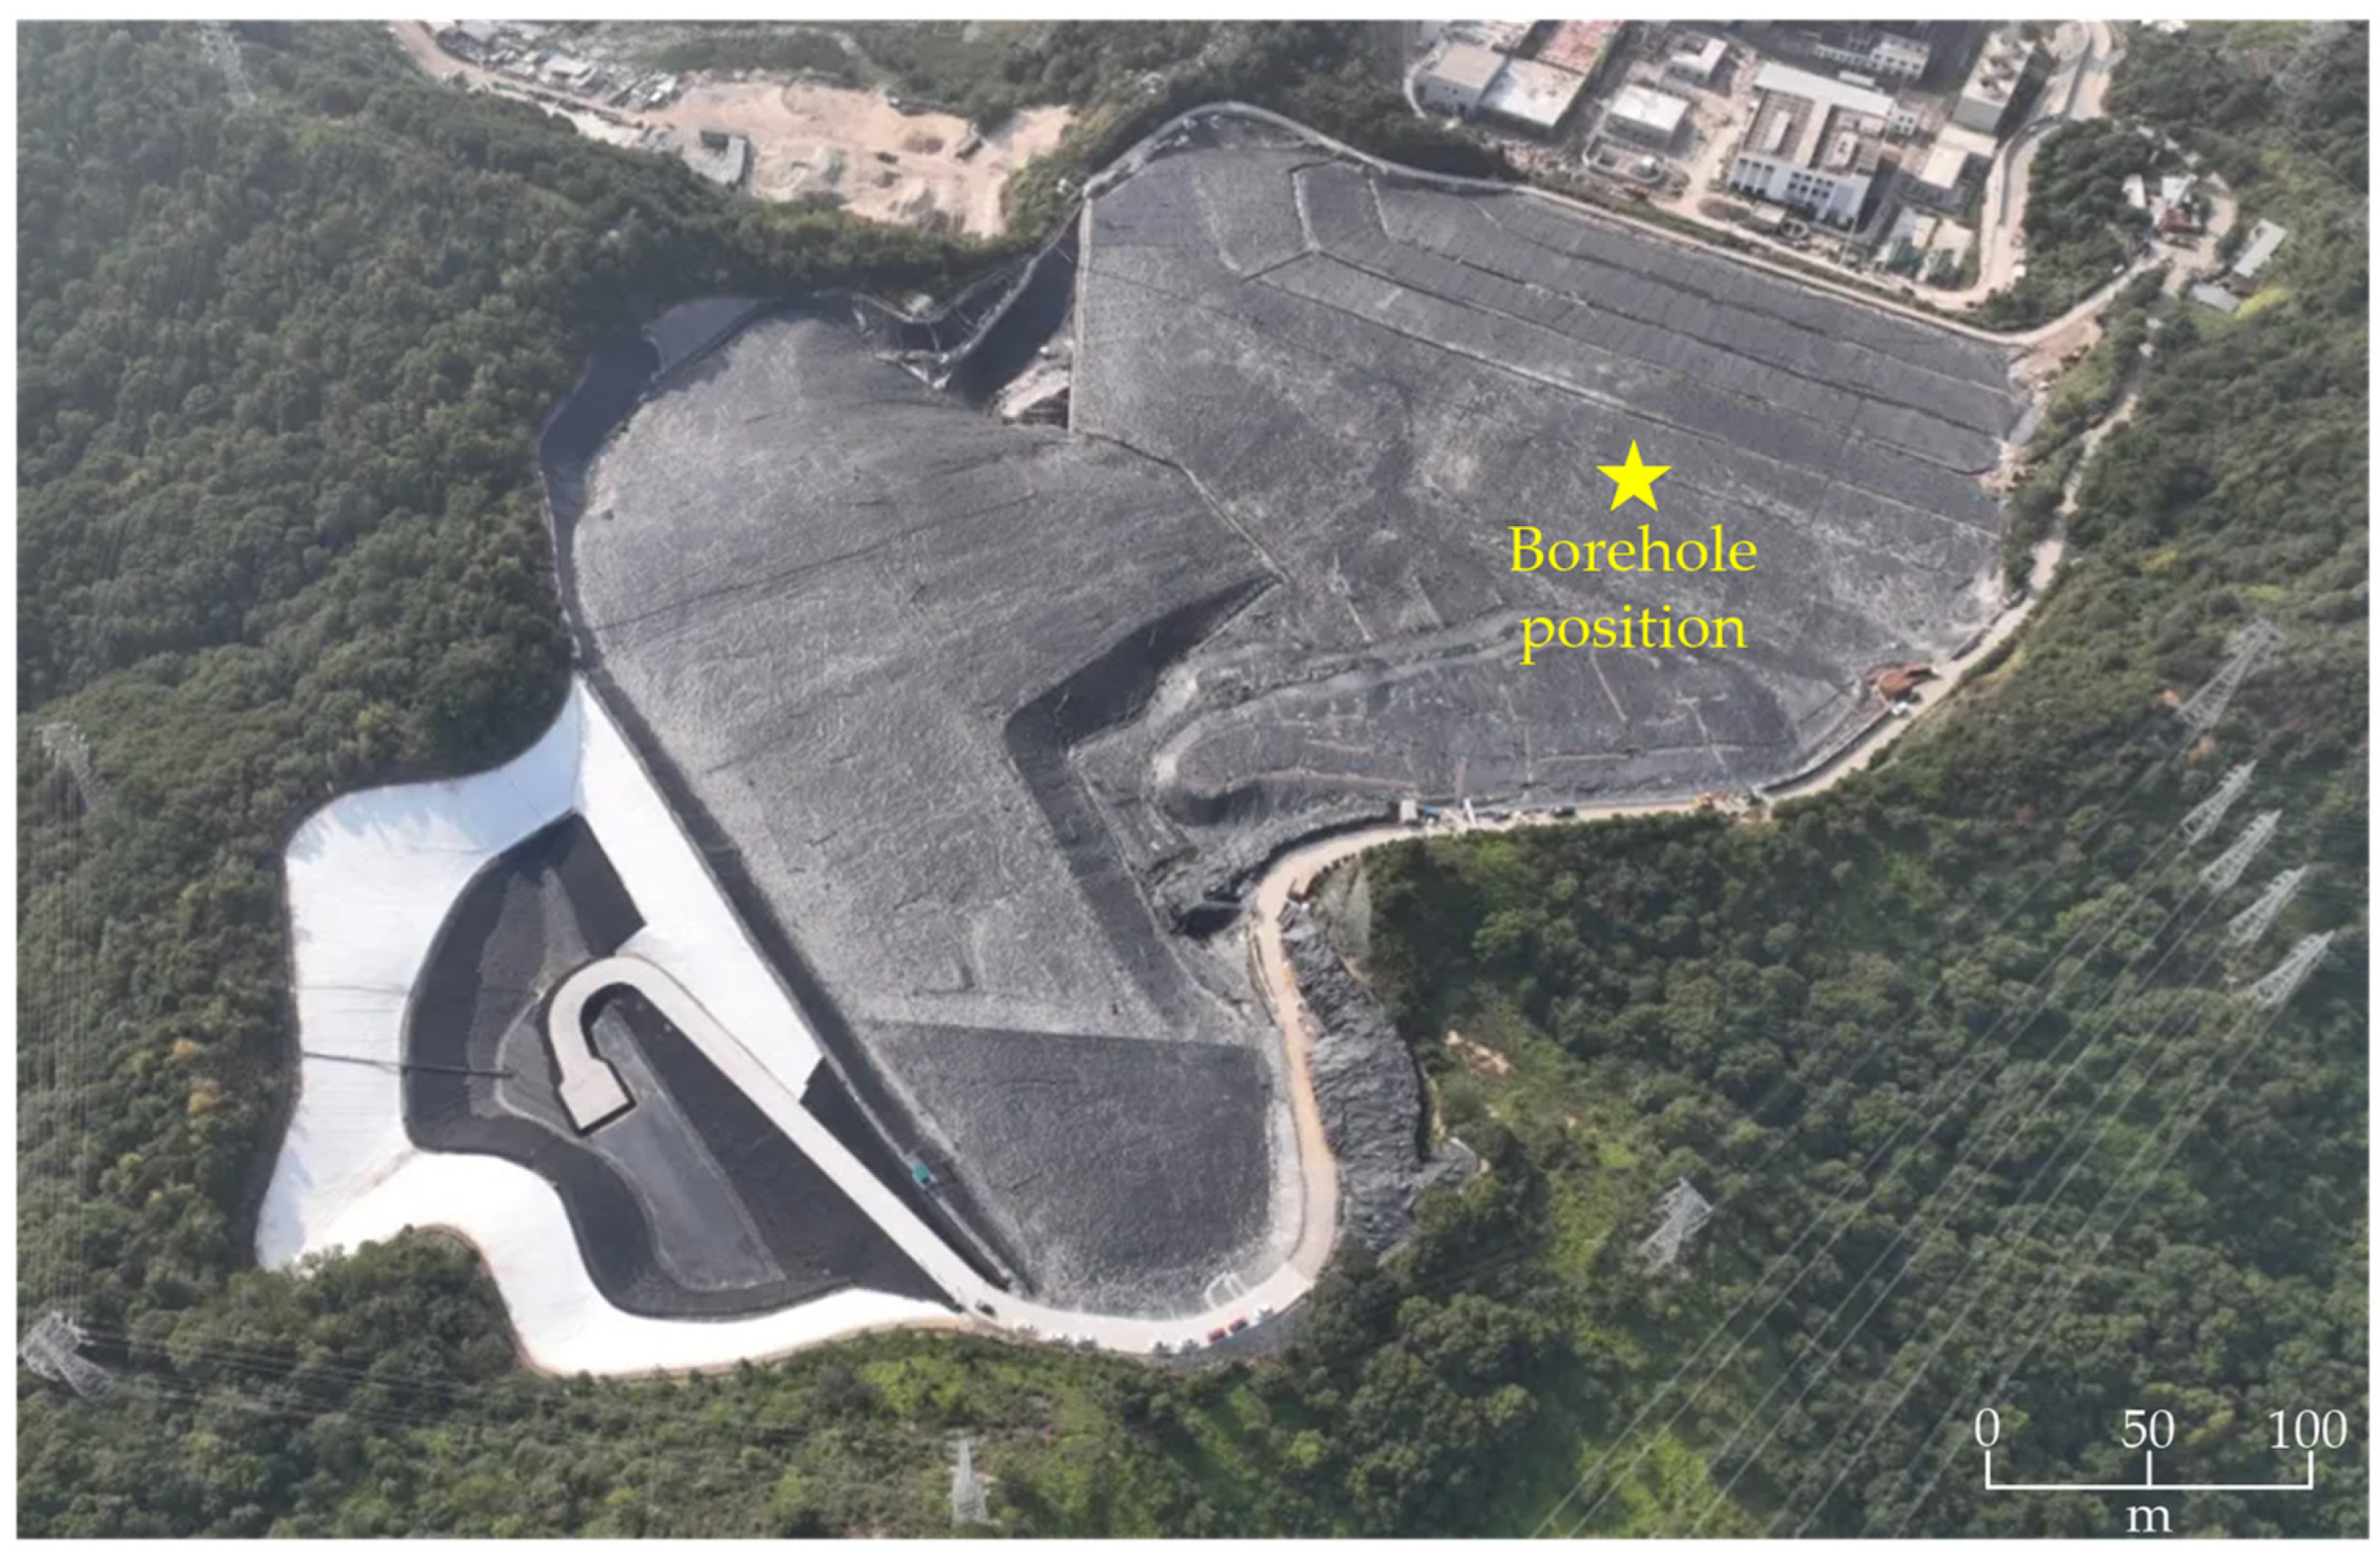
Figure 1. Photo of the landfill and borehole position.
Processes 13 02176 g001
Figure 2. Photo of borehole sampling in the landfill.
Processes 13 02176 g002
Figure 3. Photos of borehole sample: (a) after cutting for geotechnical property tests; (b) in the PMMA tube for CT scanning.
Processes 13 02176 g003
Figure 4. CT image processing flow: (a) 2D slice image from CT scan; (b) original 3D image from VG-Studio; (c) 3D image from AVIZO; (d) PNM.
Processes 13 02176 g004
Figure 5. Photos of the typical composition of a borehole sample: (a) cinder and dust; (b) plastics; (c) textiles; (d) wood; (e) others.
Processes 13 02176 g005
Figure 6. Waste composition of borehole samples at different depths.
Processes 13 02176 g006
Figure 7. Photos of typical particles with different shapes: (a) 0D; (b) 1D; (c) 2D; (d) 3D.
Processes 13 02176 g007
Figure 8. Particles with different shapes in borehole samples at different depths.
Processes 13 02176 g008
Figure 9. Particle size distribution curve of 0D particles in borehole samples at different depths.
Processes 13 02176 g009
Figure 10. Original 3D images from VG-Studio: (a) 0 m; (b) 2.5 m; (c) 5.0 m; (d) 7.5 m; (e) 10.0 m; (f) 12.5 m.
Processes 13 02176 g010
Figure 11. Pore network model of borehole samples at different depths: (a) 0 m; (b) 2.5 m; (c) 5.0 m; (d) 7.5 m; (e) 10.0 m; (f) 12.5 m.
Processes 13 02176 g011
Figure 12. Pore diameter distribution curve of borehole samples at different depths.
Processes 13 02176 g012
Figure 13. Pore angle of borehole samples at different depths: (a) 0 m; (b) 2.5 m; (c) 5.0 m; (d) 7.5 m; (e) 10.0 m; (f) 12.5 m.
Processes 13 02176 g013
Table 1. Physical properties of borehole samples at different depths.
Depth
(m)
Degree of
Degradation
C/L
Specific
Gravity
Gs
Water Content
w (%)
Void Ratio
e
00.851.1426.51.68
2.50.601.0133.91.53
5.00.541.1829.91.40
7.50.501.2243.31.20
10.00.481.2345.51.12
12.50.471.2548.71.10
Table 2. Structural parameters of connected pores in the borehole samples.
Depth
(m)
Pore Size
Distribution
Parameters
λ and η
Average
Coordination
Number ce
Tortuosity
τ
Pore Angle
θe (°)
00.209 and 2.35812.01.12929.6
2.50.207 and 2.40211.31.14725.4
50.205 and 2.31311.31.13422.6
7.50.196 and 2.00910.61.18221.6
100.191 and 1.9686.11.17719.2
12.50.190 and 1.9814.11.18417.8
Table 3. Summary of reported solid and pore structures of MSW.
Waste TypeTest MethodParticle StructurePore Structure References
Compressed and aged MSW (γd = 4.8 kN/m3 and e = 0.46)Visual method after cutting the sample vertically into sectionsHorizontal orientation of 2D particles (i.e., plastics, textiles, and paper).Layered structure leads to increased tortuosity for vertical flow.Caicedo-Concha et al. [6]
Synthetic MSW with degradation (Initial γ = 8 kN/m3)CT scans of the sample on day 2 and day 260-Fewer pores and connectivity.
Day 2: n = 0.40, ce = 5.68.
Day 260: n = 0.11, ce = 3.61.
Zhang et al. [18]
Degraded synthetic MSW under compression (Surcharge load of 50 kPa~200 kPa)Visual method after cutting the sampleHorizontal orientation of 2D particles due to the surcharge load.Fewer large pores, flatter pore structure, and greater tortuosity with increasing surcharge load. The value of θe decreases from 22°~23° to 8°~10° under compression.Qin et al. [19]
Synthetic, fresh, Chinese MSW under compression (Initial Gs = 1.3 and w = 33%, surcharge load of 50 kPa~200 kPa)CT scanningHorizontal orientation of 2D particles (e.g., plastics and paper) under compression.Large pores occur around 2D particles. Pore channels become flat with the horizontal orientation of 2D particles. The value of θe decreases from 30° to 20° under compression.Meng et al. [20]
Synthetic MSW sample with enhanced degradationCT scans of the sample on day 2 and day 260-Less connected paths and more isolated paths with degradation. Connected path becomes more curved. Its tortuosity increases and the connectivity decreases.
Day 2: n = 0.40, ce = 4.35.
Day 260: n = 0.10, ce = 3.45.
Liu et al. [16]
Synthetic MSW sample with the elimination of microorganismsCT scans of the sample on day 2 and day 260-Slight change in pore structure.
Day 2: n = 0.42, ce = 4.35.
Day 260: n = 0.38, ce = 4.21.
Liu et al. [16]
Degraded synthetic MSW under compression (C/L = 2.19, surcharge load of 50 kPa~400 kPa)CT scanningThe structural solids tend to be horizontal under compression, but the influence of vertical stress is limited. The structural solid angle is mainly concentrated at 30°~32°.The porosity of large pores (>1 mm) decreases significantly, while that of the medium (0.1 mm~1 mm) and small (<0.1 mm) pores remains almost unchanged. The value of λ decreases from 2.09 to 1.30.Ke et al. [2]
Borehole MSW samples (Depths of 5 m, 7 m, and 9 m)Depth of 5 m: λ = 2.722.
Depth of 7 m: λ = 1.818.
Depth of 9 m: λ = 1.548.
Degraded synthetic MSW under compression (Degradation time of 0~18 months, Gs of 1.30~1.75, C/L of 3.93~0.61, surcharge load of 50 kPa~400 kPa)Visual method and CT scanningThe content of 2D particles decreases from 78.7% to 47.2%, and that of 0D particles increases from 12.3% to 38.8%. The contents of 1D and 3D particles show little change.Pores are mostly arranged along 2D particles.Ke et al. [21]
Borehole MSW samples (Depths of 0 m~15m, Gs of 1.14~1.25, e of 1.68~1.10, C/L of 0.85~0.47).Visual method and CT scanningHorizontal orientation of 2D particles. More fine particles with increasing depth.The value of ce decreases from 12.0 to 4.1 with increasing depth. The value of θe decreases from 29.6 to 17.8 accordingly. The decreases of λ and τ are not significant.This study
Disclaimer/Publisher’s Note: The statements, opinions and data contained in all publications are solely those of the individual author(s) and contributor(s) and not of MDPI and/or the editor(s). MDPI and/or the editor(s) disclaim responsibility for any injury to people or property resulting from any ideas, methods, instructions or products referred to in the content.