Abstract
Copper is essential for various biological functions, but elevated levels in water can pose serious health risks. In this work, we introduce a novel electrochemical sensor designed for the highly sensitive and selective detection of copper ions. The sensor is based on a screen-printed platinum working electrode coated with a solid-state Nafion layer. Compared to previous platinum-based sensors, this design demonstrates enhanced sensitivity, a wide linear detection range (1 µM to 10 mM), and an exceptionally low limit of detection (1 nM). It also offers a rapid response time of 3–6 s, strong selectivity, and excellent stability. Interference from common metal ions such as Cr2+, Zn2+, Mn2+, Pb2+, and Fe2+ was minimal, with signal deviations remaining below 2%, and performance remained consistent across varying anion concentrations, showing less than 1% deviation. The use of Nafion as a solid-state electrolyte successfully overcomes challenges typically associated with traditional silver-based reference electrodes. These characteristics make the sensor a reliable and practical tool for the rapid, on-site monitoring of water quality.
1. Introduction
Heavy metal pollution in aquatic ecosystems is a growing global concern due to the persistent, non-biodegradable nature of these pollutants, which tend to accumulate in the environment and pose significant risks to both ecosystems and human health [1]. Among these pollutants, copper (Cu2+) is one of the most prevalent, primarily introduced through agricultural activities, pesticides, mining operations, and the waste generated by chemical, pharmaceutical, and paper industries [2,3]. Copper is an essential trace element for human health, as it plays vital roles in several physiological processes, including maintaining hematopoietic function, supporting the central nervous system, and promoting skin, bone, and blood vessel health, as well as contributing to antioxidant defenses [4,5,6]. However, its imbalance, either as a deficiency or excess, can lead to severe health issues. Chronic exposure to elevated Cu2+ levels may cause toxicity, resulting in conditions such as diabetes, hemolytic anemia, liver and kidney damage, necrotizing hepatitis, and a potential association with diseases like Alzheimer’s and cardiomyopathy, and even death [4,7,8].
In marine environments, copper bioaccumulation is a serious issue, adversely affecting both marine organisms and human populations. For example, oysters, which are known for their ability to accumulate copper, can develop the “blue oyster” phenomenon due to high copper content [9]. Anthropogenic activities such as seawater aquaculture, shipping, wastewater discharge, and coastal development contribute significantly to copper pollution in marine systems [1,10]. The increasing global production of copper has led to higher concentrations of soluble Cu2+ compounds in the environment, presenting a major health risk to humans. Additionally, copper contamination in drinking water can result from plumbing systems, where pipe corrosion leads to elevated Cu2+ levels [11]. The World Health Organization (WHO) recommends a maximum copper concentration of 1.3 mg/L in drinking water to mitigate health risks [11]. Water scarcity, exacerbated by rapid industrialization and population growth, further compounds the issue by increasing the demand for water and generating wastewater containing harmful metals, thus contributing to the contamination of drinking water, groundwater, and marine ecosystems. While trace metals are necessary for some biological functions, excessive concentrations disrupt ecosystems and pose serious health risks, particularly through bioaccumulation in food chains, which affects organisms like fish [9,12].
Detecting copper ions in water is critical to meet safety standards and prevent environmental and health risks [13]. Several detection methods have been developed, each with distinct advantages and limitations. Elkhatat et al. [13] provided a detailed review of copper detection techniques, such as spectrophotometry, mass spectrometry, sensors, voltammetry, and chromatography, comparing their advantages and practical applications. Traditional techniques like atomic absorption spectroscopy (AAS), atomic fluorescence spectroscopy (AFS) [14], high-performance liquid chromatography (HPLC) [8], inductively coupled plasma (ICP) [15], and ultraviolet spectrophotometry [15,16] are reliable and accurate but often face challenges such as high operational costs, extensive sample preparation, and the need for skilled operators, limiting their feasibility for routine or field monitoring [13,14].
Liu et al. [17] compared inductively coupled plasma mass spectrometry (ICP-MS) and inductively coupled plasma optical emission spectroscopy (ICP-OES) for trace element analysis, emphasizing ICP-MS for its lower detection limits and superior accuracy, while ICP-OES is preferred for its cost-effectiveness and robustness in routine applications.
One promising approach involves optical fiber-based sensors, which utilize plasmonic resonance for the highly sensitive detection of Cu2+ ions in drinking water [18]. These sensors can detect low concentrations of copper in complex water samples, offering compact designs and real-time, remote monitoring capabilities with high precision.
Electrochemical sensing methods are increasingly favored due to their simplicity, sustainability, miniaturization, and ease of integration, making them ideal for real-time monitoring in field settings [19,20,21,22,23,24]. Among electrochemical methods, differential pulse anodic stripping voltammetry (DPASV) is especially effective for the rapid and sensitive detection of Cu2+ in natural water systems [24,25]. Graphitized multi-walled carbon nanotubes (GMWCNTs) are commonly used for electrode modification in electrochemical sensors due to their high surface area, excellent conductivity, chemical stability, and cost-effectiveness [24,26], improving the sensitivity and reliability of copper detection. Cu2+ ion carriers further enhance the detection accuracy by forming stable binding complexes [25].
Recent developments in electrochemical sensors for copper detection have been promising. For example, Liu [19] employed stripping voltammetry to measure copper concentrations in industrial wastewater, demonstrating high sensitivity and low detection limits. Zamani et al. [21] introduced PVC-membrane copper-selective electrodes, which showed excellent selectivity and stability for Cu2+ detection in wastewater. Similarly, Zhang et al. [24] designed a glassy carbon electrode modified with GMWCNTs and Cu2+ ion carriers, achieving a linear response for copper concentrations from 50 to 500 µg/L, with a correlation coefficient of 0.996 and a detection limit of 0.74 µg/L.
Theerthagiri et al. [25] developed a sensor based on a metal–organic framework (MOF) that showed high sensitivity and selectivity for Cu2+ detection with nanomolar detection limits. Romero-Cano et al. [23] created a carbon paste electrode sensor using grapefruit peel extract, demonstrating excellent performance for Cu2+ detection in water samples.
Emerging sensor technologies continue to advance. For instance, Li et al. [26] developed a portable sensor system based on microelectromechanical systems (MEMS) technology, which provides reliable performance and ease of use for field applications. Inam et al. [27] proposed a flexible, cost-effective screen-printed electrochemical sensor with electrodeposited copper, focusing on nitrate detection but offering potential for copper applications. Likewise, Li et al. [28] designed an electrode containing copper nanoparticles confined in silica nanochannels, showing potential for Cu2+ detection technologies. Daly et al. [29] designed and fabricated platinum-based interdigitated microelectrode arrays (Pt-IDAs) for trace-level, reagent-free detection of copper ions in water, enabling autonomous and in situ monitoring for environmental applications. The measurement range using chemical pH adjustment (Acidified to pH 2) is 5 to100 µg/L (ppb) with LOD of 0.8 µg/L, while the range using electrochemical pH adjustment (reagent-free) is 5 to 90 µg/L (ppb) with LOD of 0.8 µg/L (not explicitly stated, but inferred to be ≥1 µg/L based on sensitivity reduction).
Andy Cranny et al. [30] developed screen-printed platinum electrodes for the detection of Cu2+ ions as a corrosion monitoring tool in marine environments containing 3.5% NaCl. Utilizing voltammetric techniques, particularly cyclic differential pulse voltammetry (DPV), the electrodes were fabricated on alumina substrates through a straightforward and cost-effective thick-film printing process using platinum paste. This approach produced robust and durable sensors capable of withstanding harsh conditions. The sensors demonstrated reliable detection of Cu2+ over a wide concentration range (10 µM to 100 mM), with a LOD of 10 µM, making them well-suited for early-stage corrosion detection. Additionally, they exhibited a near-linear response in the range of 40 µM to 1000 µM, with a high correlation coefficient (R2 ≈ 0.98).
The development of advanced electrochemical sensors, including those using novel materials like GMWCNTs and metal–organic frameworks, offers a promising approach for the accurate, portable, and cost-effective monitoring of copper levels in aquatic environments. Compared to traditional analytical techniques such as atomic absorption spectroscopy (AAS) and inductively coupled plasma mass spectrometry (ICP-MS), electrochemical sensors offer several practical advantages, including portability, rapid response, and lower operational costs, making them highly suitable for on-site water monitoring.
In this work, we introduce a novel electrochemical sensor that incorporates a solid-state electrolyte, disposable screen-printed electrodes, and employs electrochemical techniques such as cyclic voltammetry and amperometry. The sensor’s performance was thoroughly characterized in terms of linearity, sensitivity, reproducibility, and limit of detection (LOD) across a wide concentration range (1 µM to 10 mM). Unlike earlier approaches that relied on complex modifications or nanomaterials, our findings demonstrate that unmodified screen-printed platinum electrodes are capable of delivering sensitive and selective detection of Cu2+ ions with high reproducibility and excellent linearity. Compared to previous platinum-based sensors [24,29], this design offers clear advantages in simplicity, sensitivity, detection limits, and reproducibility. Nafion was chosen as the solid-state electrolyte due to its superior ionic conductivity, chemical and thermal stability, and effective cation-exchange properties. These characteristics contribute to the sensor’s robustness and stable performance under diverse environmental conditions, making it highly suitable for rapid, on-site water quality monitoring [31].
2. Materials and Methods
This section describes the materials and experimental methods employed in this study.
2.1. Sensor Electrodes
In all experiments, DS550 disposable screen-printed electrodes (DropSens, Llanera, Spain) were used. According to the DropSens website, these electrodes are manufactured on a ceramic substrate with dimensions of 33 mm in length, 10 mm in width, and 0.5 mm in thickness. The electrochemical configuration includes a circular platinum (Pt) working electrode (WE) with a 4 mm diameter, a curved Pt counter electrode (CE), a small, curved silver (Ag) reference electrode (RE), and a silver electrical contact, as illustrated in Figure 1. The Pt working electrode was chosen for its outstanding stability and superior sensitivity to electrochemical reactions [32].

Figure 1.
DS550 screen-printed electrodes.
2.2. Reagents
In total, 1000 g of copper (Cu) (2.683 g CuCl2. 2H2O + 0.1 g HCL) was obtained from Sigma Aldrich (3050 Spruce St, Saint Louis, MO 63103, USA). Copper chloride (CuCl2), copper sulfate (CuSO4), and copper nitrate (Cu(NO3)2) were obtained from Sigma Aldrich (3050 Spruce St, Saint Louis, MO 63103, USA). Copper samples were dispensed with a micropipette from Sigma Aldrich (3050 Spruce St, Saint Louis, MO 63103, USA) capable of measuring volumes between 10 and 100 μL. Nafion was applied using a Hamilton microsyringe from Sigma Aldrich (3050 Spruce St, Saint Louis, MO 63103, USA) with a volume range of 0.1 to 10 μL. Deionized (DI) water (measured pH = 6.3), obtained from a Milli-Q Plus water filtration system, was used both for diluting copper solutions and rinsing the electrode surface between measurements. A 5% w/w Nafion perfluorinated resin solution obtained from Sigma Aldrich (3050 Spruce St, Saint Louis, MO 63103, USA) containing 45% water and a mixture of lower aliphatic alcohols was used as a solid-state electrolyte in all experiments.
2.3. Sensor Surface Modification
The sensor was modified by applying 0.2 μL of Nafion solution onto the WE, which was then allowed to air-dry at room temperature for 30 min, resulting in the formation of a thin Nafion film. The deposited volume was precisely controlled and maintained within 0.2 ± 0.05 μL, based on consistent pipetting using a calibrated Hamilton microsyringe.
2.4. Electrochemical Instrumentation
The PalmSens4 potentiostat (PalmSens, Vleugelboot 22, 3991 CL Houten, The Netherlands) was utilized for cyclic voltammetry (CV) and amperometry across all experiments. It was connected to a PC equipped with PSTrace software (version 5.8), which facilitated the display, storage, and analysis of amperometry and CV data for generating calibration curves.
2.5. Copper Sample Preparation
To create copper solutions of varying concentrations, a 1000 ppm stock solution was prepared by dissolving 1000 g of copper in 1000 mL of deionized (DI) water. Copper samples were prepared by diluting a 1000 ppm (15.748 mM) copper stock solution with deionized (DI) water following a standard dilution method [33]. This 15.748 mM solution served as the basis for preparing a range of concentrations, from 1 µM to 10 mM, through additional dilutions.
2.6. The Measurement Setup
The experiments were conducted in the Research Lab for Designing Sensors and Systems (Electronics Engineering Department, Yarmouk University). All experiments in this study were conducted at a controlled temperature of 25 °C, maintained by the lab air conditioner. To measure copper concentrations ranging from 1 µM to 10 mM, cyclic voltammetry and amperometry were employed. Cyclic voltammetry was used to determine the oxidation/reduction potential of copper and quantify its concentration within the specified range by scanning voltages from −2 V to 2 V. The voltage identified through cyclic voltammetry was then applied in amperometry measurements at different copper concentrations.
Amperometric data were utilized to generate calibration curves that mapped the sensor’s response to varying copper levels. Copper solutions were prepared according to the procedure detailed in Section 2.5. During measurements, the applied voltage corresponded to the potential determined via cyclic voltammetry. The testing process followed a sequential approach, starting with lower concentrations and progressively increasing to higher levels within the 1 µM to 10 mM range. Deionized (DI) water was used as a reference solution with zero copper concentration and also served to rinse the electrode between measurements, ensuring a clean surface before introducing new samples. All experiments were conducted in an open-air environment at room temperature (T = 25 °C).
2.6.1. Cyclic Voltammetry
Before each experiment, the electrodes were cleaned with DI water and air-dried at room temperature. The liquid samples were prepared following the method described in Section 2.5. To obtain a baseline measurement, 100 µL of DI water was applied to the electrodes, and a scanning procedure was conducted from −2 V to +2 V at a scan rate of 100 mV/s, repeated for three cycles. For each liquid sample within the concentration range of 1 µM to 10 mM, 100 µL of the sample was applied to the electrode surface, followed by the same scanning procedure from −2 V to +2 V at 100 mV/s for three cycles.
2.6.2. Amperometry
Prior to each experiment, the electrodes were thoroughly rinsed with DI water and allowed to air-dry at room temperature. The liquid samples were prepared according to the procedure described in Section 2.5. To establish a baseline, 100 µL of DI water was placed on the electrodes. The voltage was set based on the cyclic voltammetry results, and amperometry was conducted for 120 s to measure the current corresponding to zero copper concentration.
For each sample within the 1 µM to 10 mM concentration range, 100 µL was applied directly to the electrode surface. The same measurement procedure was then repeated, maintaining the same voltage and time duration, to measure the current for each specific copper concentration.
3. Results and Discussion
3.1. Sensor Cyclic Voltammetry Results
The main equations that represent the copper reaction in water are as follows [34,35]:
The overall redox reaction of copper in DI water is:
2Cu(s) + O2(g) + 4H+(aq) → 2Cu2+(aq) + 2H2O
The oxidation reaction is represented in the following equation:
Cu(s) → Cu2+(aq) + 2e−
The reduction reaction is represented in the following equation:
Cu2+(aq) + 2e− → Cu(s)
Cyclic voltammetry was performed to determine the oxidation potential of copper. The results indicated a shift in the oxidation peak compared to the baseline (zero reading) after introducing the copper sample, with the oxidation current increasing as copper concentration rose. Figure 2 presents the cyclic voltammetry results for different copper concentrations. Deionized (DI) water served as the baseline measurement, representing zero copper content.
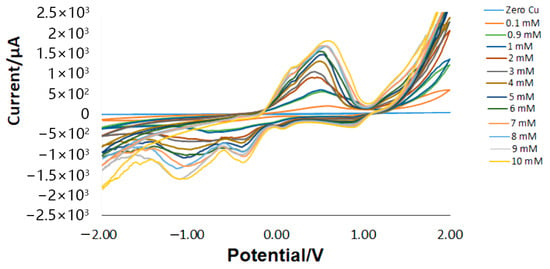
Figure 2.
Cyclic voltammetry results of copper in DI water.
The copper oxidation current was recorded at 0.6 ± 0.05 V. While additional peaks appear in the figures, they do not correspond to copper since they do not follow the expected trend with varying concentrations. However, some IR drop was observed at certain concentrations, which may be attributed to occasional human errors during the injection of Nafion, leading to uneven layer distribution on the electrode surface. This unevenness could cause uncompensated resistance between the reference electrode tip and the working electrode surface, ultimately reducing the effective potential applied to the electrochemical double layer [36].
An automated Nafion deposition process, ensuring a uniform and consistent coating, could be implemented in future work to improve the sensor’s reproducibility. This approach would allow for better control over the coating thickness, minimizing variations that might otherwise cause inconsistencies in the electrochemical response.
The oxidation potential of copper observed in this study differed from previously reported values in the literature [37,38,39,40,41,42,43,44,45,46,47,48,49,50,51,52,53,54,55,56,57,58,59], primarily due to three factors. First, variations in electrode shape and surface area contributed to this difference. Second, instead of using the standard silver/silver chloride (Ag/AgCl) reference electrode, we utilized a silver-only reference electrode. Although the Ag/AgCl electrode is widely preferred for its established stability and reproducibility, we opted for the silver-only electrode due to its simplicity and ease of fabrication. However, we acknowledge that the use of a silver-only reference electrode could introduce potential drift or inconsistencies in long-term measurements because it lacks a chloride-based reference. To address this, we closely monitored and controlled experimental conditions to minimize drift. Third, variations in the conditioning of the WE across different studies may have affected its surface properties, which could explain shifts in the activation potential. Despite these variations, the copper detection peak was consistently observable in all figures, as evidenced by the steady increase in current intensity with increasing copper concentrations at the same potential.
3.2. Sensor Calibration Results
The sensor calibration curves (Figure 3 and Figure 4) were created using current values corresponding to various copper concentrations, ranging from 1 µM to 10 mM, measured through amperometry at voltages determined by cyclic voltammetry. These current values were recorded during the period when the signal stabilized, typically within 5 to 10 s. The stable readings within a defined range were averaged; the average current at zero copper level is around 1.3 μA with a standard deviation (stdv) of 0.1 μA. Two calibration curves were developed: one for lower concentrations (1 µM to 100 µM) and another for higher concentrations (0.5 mM to 10 mM). The calibration curves represent the average readings from six electrodes under consistent conditions.
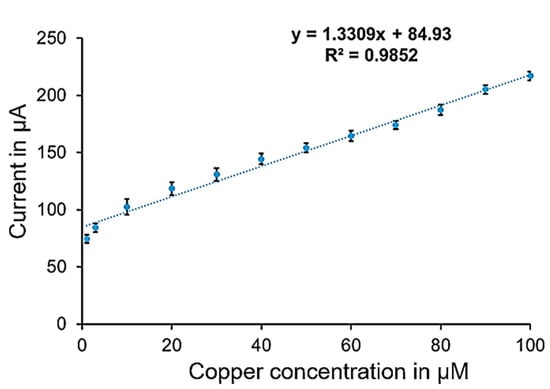
Figure 3.
Calibration curve for copper measurement in the lower concentration range.
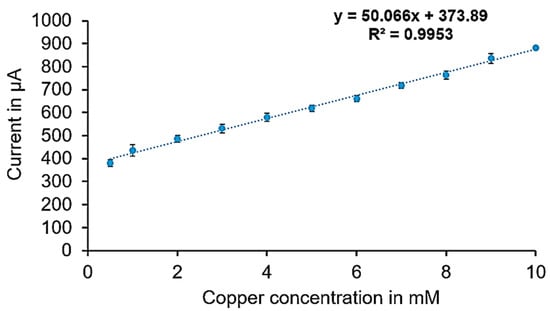
Figure 4.
Calibration curve for copper measurement in the higher concentration range.
Figure 3 shows the calibration curve for the lower concentration range, with average currents ranging from 74 µA at 1 µM (stdv = 3.5 μA) to 217 µA at 100 µM (stdv = 3.7 μA), providing a sensitivity of 1.331 µA/µM and a correlation coefficient of 0.98. Figure 4 illustrates the calibration curve for the higher concentration range, with average currents from 380 µA to 882 µA (stdv = 5 μA to 14 μA) showing a sensitivity of 50.07 µA/mM and a correlation coefficient of 0.99. Raw amperometry data for both low and high concentration ranges are presented in Figure 5 and Figure 6, respectively.
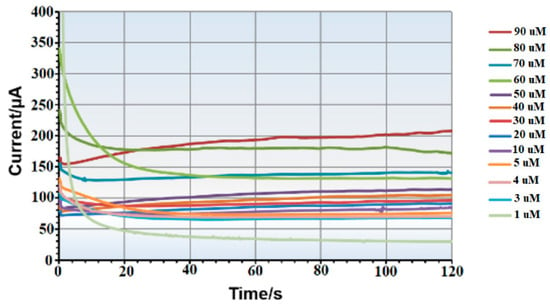
Figure 5.
Example of amperometry results of copper samples across concentration range of (1 µM to 90 µM).
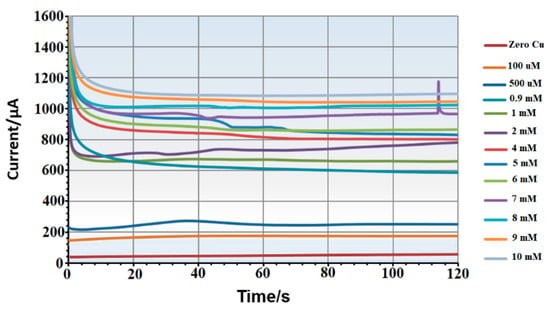
Figure 6.
Example of amperometry results of copper samples across concentration range of (0 mM to 10 mM).
3.3. Limit of Detection (LOD)
The limit of detection (LOD) was determined by systematically diluting copper solutions to very low concentrations and identifying the lowest level at which a measurable signal could be distinguished from a copper-free (blank) sample. Serial dilutions were prepared below 0.1 μM, reaching as low as 0.0005 μM. The LOD was calculated based on the signal-to-noise ratio criterion of 3:1, comparing the response at low copper concentrations with the baseline noise in the blank sample. To ensure accuracy and reproducibility, six replicate measurements (n = 6) were performed for both the blank and the lowest detectable concentration. The resulting LOD was approximately 0.001 μM, demonstrating the sensor’s high sensitivity and its suitability for trace-level copper detection in aqueous environments. Representative data used in the LOD determination are presented in Figure 7.
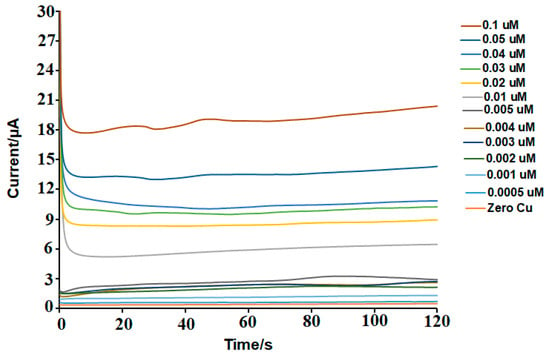
Figure 7.
Example of amperometry results for measuring the LOD.
3.4. Limit of Quantification (LOQ)
The limit of quantification (LOQ) for the copper sensor was determined using a signal-to-noise (S/N) ratio of 10:1. This criterion ensures that the signal exceeds the noise by at least 10 times for accurate quantification. Since the limit of detection (LOD) was already established based on six replicate measurements (n = 6), the LOQ was calculated from the LOD using a standard multiplier, denoted as “k.” The formula is LOQ = k ∗ LOD [55]. While some methods use higher multipliers, such as 5 or 10, to increase the reliability of quantification, our study used k = 3, a commonly accepted value. As a result, the LOQ was estimated to be approximately 0.003 μM.
3.5. Interference Test
An interference study was conducted to assess the sensor’s ability to selectively detect copper ions in the presence of a 50 ppm heavy metal complex comprising Cr, Zn, Mn, Pb, and Fe. Cyclic voltammetry (CV) was utilized to determine if these metals exhibit electrochemical activity at the copper activation potential.
Initially, 100 µL of the heavy metal complex was applied to the electrode surface, and CV measurements were recorded over a potential range of −1.4 V to 1.4 V. The absence of a peak at 0.6 ± 0.05 V indicated that none of the metals in the complex were electroactive at this potential (Figure 8a).
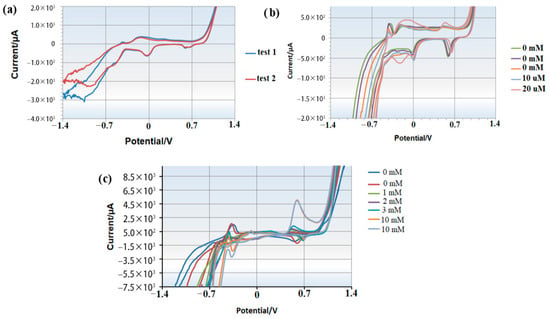
Figure 8.
Cyclic voltammetry results illustrating the electrochemical behavior of a heavy metal complex: (a) without added copper; (b) with low concentrations of copper; (c) with high concentrations of copper.
Subsequent experiments involved sequentially adding copper ions to 100 µL of the fresh heavy metal complex. After measuring each sample, the electrodes were thoroughly rinsed with deionized water and air-dried at room temperature. CV measurements were then performed with the addition of copper concentrations of 10 µM and 20 µM. A distinct peak emerged at approximately 0.6 V, confirming copper detection at this potential (Figure 8b).
Further tests with higher copper concentrations (1 mM, 2 mM, 3 mM, and 10 mM) demonstrated a clear increase in peak current at 0.6 V, reinforcing that copper can be reliably detected at this potential without interference from other metals in the complex (Figure 8c).
3.6. Effect of Anion Concentrations on Sensor Performance
To assess the influence of different anions on the sensor’s performance, 10 µM copper solutions were prepared with three distinct counter anions: chloride (CuCl2), sulfate (CuSO4), and nitrate (Cu(NO3)2). All measurements were conducted under controlled conditions, including constant ambient temperature, identical voltage settings, and electrodes from the same batch. Cyclic voltammetry and amperometry analyses revealed that the oxidation peak consistently occurred at approximately 0.6 ± 0.05 V for all anion types. The corresponding current responses showed minimal variation (within ±3%), as detailed in Table 1. This small variation in the sensor’s response is attributed to the stability of the Nafion film and the specific electrochemical detection mechanism. Under the given experimental conditions, the sensor’s performance is largely unaffected by common anions, which do not significantly disrupt the copper ion detection process. As a result, the sensor demonstrates reliable performance even in environments with varying anion concentrations, making it well-suited for field applications.

Table 1.
Sensor current response for 10 µM copper with different anion sources.
3.7. Summary of the Results
The sensor successfully detected copper ions across a broad concentration range (1 μM to 10 mM), achieving a detection limit as low as 0.001 μM. The calibration curve displayed excellent linearity and high sensitivity, as reflected by the steep slope. A consistent linear correlation was maintained between the measured current and copper concentration over both low and high ranges.
To assess the sensor’s measurement reliability and reproducibility, standard deviations were computed from six calibration datasets obtained using six identically prepared electrodes. The results demonstrated stable sensor performance and reproducible detection across different copper concentrations. The use of Nafion as a solid-state electrolyte effectively addressed the limitations typically associated with conventional silver-based reference electrodes.
Variations in the sensor readings were primarily attributed to factors such as inconsistencies in sample injection (speed and angle), variations in Nafion film thickness, slight concentration differences among copper samples, and potential electrochemical cross-talk between electrodes. Furthermore, the sensor maintained stable output in the presence of different anion species, and interference studies confirmed that no other heavy metal ions produced signals at the same potential as copper, validating the sensor’s selectivity.
3.8. Comparison with Recent Studies
When compared to recent studies, our sensor shows significant improvements in linearity, sensitivity, limit of detection (LOD), and reproducibility [2,3,19,20,21,22,23,24,25,26,27,28,29,37,38,39,40]. Its advantages are particularly evident in its straightforward surface characterization method, use of a solid-state Nafion electrolyte, quick response time, and enhanced analytical properties, including reduced interference from other heavy metal ions. Additionally, our sensor offers a broader detection range than many previously reported sensors [2,3,19,29], coupled with significantly higher sensitivity, lower LOD, and better linearity. Specifically, we highlight the substantial reduction in LOD, with our sensor reaching an outstanding 1 nM, compared to 11.64 nM in [24], 10 µM in [30], and 23.6 µM in [37]. This comparison underscores the improved sensitivity and selectivity of our sensor, clearly demonstrating its superiority in copper ion detection.
Many current studies on copper sensors focus on single-point measurements and often fail to provide detailed data on reproducibility or the composition of the electrolyte used. In Table 2, we provide a comparative summary of our sensor’s performance against the latest state-of-the-art devices, showcasing key metrics such as linearity, sensitivity, concentration range, LOD, limit of quantification (LOQ), measurement techniques, and surface modifications.

Table 2.
The comparison of this work with some of the recent studies.
Various electrochemical methods, including Square Wave Voltammetry (SWV), Stripping Voltammetry, and Anodic Stripping Voltammetry, have been widely applied for Cu2+ detection in aqueous solutions [2,3,19,20,21,22,23,24,25,26,27,28,29,37,38,39,40,42,54,55,56,57,58]. These studies often utilize surface modifications like graphite oxide-imprinted polymer composites [20,24], gold nanoparticles [40], and MoS2 nanostructures [29] to improve sensor performance. In contrast, our sensor utilizes Nafion as a solid-state electrolyte, while many other studies either use tartrate-based buffers or do not disclose electrolyte details at all.
In terms of linearity, most reviewed sensors report excellent performance with correlation coefficients (R2) close to 1, consistent with our findings. Sensitivity in previous studies ranges up to 0.0075 μA/μM, while our sensor achieves a much higher sensitivity between 1.3 μA/μM and 50 μA/mM. Similarly, detection limits reported in the literature go as low as 0.01 μM, while our sensor consistently detects copper from 1 μM to 10 mM, with an LOD of 0.001 μM and an LOQ of 0.003 μM.
While electrochemical copper sensors show promising results, reproducibility data remains scarce in the literature, complicating comparisons across studies. Furthermore, inconsistencies in electrolyte selection and surface modification methods highlight the need for further research to standardize protocols and enhance sensor reliability and reproducibility.
4. Conclusions and Future Work
In this work, we developed a solid-state electrochemical sensor based on screen-printed platinum electrodes modified with a Nafion coating for the ultra-sensitive detection of copper ions in aqueous environments. The sensor demonstrated reliable and reproducible detection of Cu2+ over a wide concentration range from 1 µM to 10 mM, achieving a limit of detection of 1 nM and a limit of quantification of 3 nM. Cyclic voltammetry and amperometry results confirmed a consistent oxidation peak at 0.6 ± 0.05 V, with peak current intensities increasing proportionally with concentration. The sensor exhibited strong linearity across both low and high concentration ranges, with correlation coefficients of 0.98 and 0.99, respectively, and demonstrated high sensitivity (up to 50 µA/mM), confirming its capability for trace-level copper quantification. Interference studies showed that the sensor maintained excellent selectivity, as no competing electrochemical signals were observed from other common heavy metals (Cr, Zn, Mn, Pb, Fe) at the copper oxidation potential.
Moreover, a study on anion concentration effects revealed that the sensor response remained consistent across different anionic environments (chloride, sulfate, nitrate), demonstrating robustness and stability of the Ag pseudo-reference electrode when combined with the solid-state Nafion layer. These features ensure reliable operation even in field applications where ionic conditions may vary. When compared to existing technologies, the proposed sensor offers superior performance in terms of detection limit, dynamic range, reproducibility, and ease of fabrication. The integration of screen-printed electrodes, solid-state electrolytes, and portable instrumentation provides a cost-effective, scalable, and field-deployable platform for real-time water quality monitoring.
Future work will focus on evaluating the sensor’s performance in real-world water samples, including seawater, wastewater, and industrial effluents, to assess its robustness and applicability in diverse environmental conditions and water quality monitoring. Additionally, we plan to conduct further experiments to explore the sensor’s behavior over a range of temperatures, ensuring its reliability in practical applications.
Furthermore, we will work on improving the Nafion coating process to enhance the uniformity and consistency of the sensor’s performance. By exploring more standardized application techniques, such as spin-coating or automated microdispensing, we aim to enhance coating precision and reproducibility, ultimately reducing variations and optimizing the sensor for dependable real-world use. Future research will also focus on the long-term stability and performance of the silver-only pseudo-reference electrode, comparing it with the standard Ag/AgCl electrode under different environmental conditions to evaluate its reliability and suitability for field applications.
Funding
This research was funded by the Deanship of Scientific Research& Graduate Studies at Yarmouk University of about $21,430 (Project No.8/2023).
Data Availability Statement
The original contributions presented in this study are included in the article. Further inquiries can be directed to the corresponding author(s).
Conflicts of Interest
The authors declare no conflict of interest.
References
- Xiang, S.; Liu, Y. Trace element copper and human physiological function and disease. Univ. Chem. 2022, 37, 2107128. (In Chinese) [Google Scholar]
- Kirk, K.A.; Andreescu, S. Easy-to-use sensors for field monitoring of copper contamination in water and pesticide-sprayed plants. Anal. Chem. 2019, 91, 13892–13899. [Google Scholar] [CrossRef] [PubMed]
- Maddipatla, D.; Saeed, T.S.; Narakathu, B.B.; Obare, S.O.; Atashbar, M.Z. Incorporating a novel hexaazatriphenylene derivative to a flexible screen-printed electrochemical sensor for copper ion detection in water samples. IEEE Sens. J. 2020, 20, 12582–12591. [Google Scholar] [CrossRef]
- Uauy, R.; Olivares, M.; Gonzalez, M. Essentiality of copper in humans. Nutr. Rev. 1998, 67 (Suppl. 5), 952S–959S. [Google Scholar] [CrossRef] [PubMed]
- Fu, P.; Han, H.; Ye, B.; Ji, R.; Li, J.; Liu, A.; Li, S.; Yang, L.; Zhang, S. Trace element copper effects on human health. J. Prev. Med. Henan 2021, 32, 888–892. [Google Scholar]
- Sobhanardakani, S.; Tayebi, L.; Farmany, A. Toxic metal (Pb, Hg, and As) contamination of muscle, gill, and liver tissues of Otolithes rubber, Pampus argenteus, Parastromateus niger, Scomberomorus commerson, and Onchorynchus mykiss. World Appl. Sci. J. 2011, 14, 1453–1456. [Google Scholar]
- Wołowiec, M.; Komorowska-Kaufman, M.; Pruss, A.; Rzepa, G.; Bajda, T. Removal of heavy metals and metalloids from water using drinking water treatment residuals as adsorbents: A review. Minerals 2019, 9, 487. [Google Scholar] [CrossRef]
- Grandis, D.J.; Nah, G.; Whitman, I.R.; Vittinghoff, E.; Dewland, T.A.; Olgin, J.E.; Marcus, G.M. Wilson’s disease and cardiac myopathy. Am. J. Cardiol. 2017, 120, 2056–2060. [Google Scholar] [CrossRef]
- Wang, W.X.; Yang, Y.; Guo, X.; He, M.; Guo, F.; Ke, C. Copper and zinc contamination in oysters: Subcellular distribution and detoxification. Environ. Toxicol. Chem. 2011, 30, 1767–1774. [Google Scholar] [CrossRef]
- Parks, A.N.; Cantwell, M.G.; Katz, D.R.; Cashman, M.A.; Luxton, T.P.; Ho, K.T.; Burgess, R.M. Assessing the release of copper from nanocopper-treated and conventional copper-treated lumber into marine waters: Concentrations and rates. Environ. Toxicol. Chem. 2018, 37, 1956–1968. [Google Scholar] [CrossRef]
- World Health Organization (WHO). Copper in Drinking-Water: Background Document for Development of WHO Guidelines for Drinking-Water Quality (WHO/SDE/WSH/03.04/88); World Health Organization: Geneva, Switzerland, 2004.
- Malik, L.A.; Bashir, A.; Qureashi, A.; Pandith, A.H. Detection and removal of heavy metal ions: A review. Environ. Chem. Lett. 2019, 17, 1495–1521. [Google Scholar] [CrossRef]
- Elkhatat, A.M.; Soliman, M.; Ismail, R.; Ahmed, S.; Abounahia, N.; Mubashir, S.; Fouladi, S.; Khraisheh, M. Recent trends of copper detection in water samples. Bull. Natl. Res. Cent. 2021, 45, 218. [Google Scholar] [CrossRef]
- Özzeybek, G.; Erarpat, S.; Chormey, D.S.; Fırat, M.; Büyükpınar, Ç.; Turak, F.; Bakırdere, S. Sensitive determination of copper in water samples using dispersive liquid-liquid microextraction-slotted quartz tube-flame atomic absorption spectrometry. Microchem. J. 2017, 132, 406–410. [Google Scholar] [CrossRef]
- Wilschefski, S.C.; Baxter, M.R. Inductively coupled plasma mass spectrometry: Introduction to analytical aspects. Clin. Biochem. Rev. 2019, 40, 115–133. [Google Scholar] [CrossRef]
- Ouyang, Z.; Chen, Z.; Mou, H. Determination of copper by flame atomic absorption spectrometry using flow injection on-line preconcentration with double micro-columns. Rev. Anal. Chem. 2010, 29, 51–58. [Google Scholar] [CrossRef]
- Liu, H.-L.; Meng, Q.; Zhao, X.; Ye, Y.-L.; Tong, H.-R. Inductively coupled plasma mass spectrometry (ICP-MS) and inductively coupled plasma optical emission spectrometer (ICP-OES)-based discrimination for the authentication of tea. Food Control 2021, 123, 107735. [Google Scholar] [CrossRef]
- Pesavento, M.; Profumo, A.; Merli, D.; Cucca, L.; Zeni, L.; Cennamo, N. An Optical Fiber Chemical Sensor for the Detection of Copper(II) in Drinking Water. Sensors 2019, 19, 5246. [Google Scholar] [CrossRef]
- Liu, B. Determination of copper in metal processing wastewater by stripping voltammetry. IOP Conf. Ser. Mater. Sci. Eng. 2017, 224, 012060. [Google Scholar] [CrossRef]
- Topcu, C.; Lacin, G.; Yilmaz, V.; Coldur, F.; Caglar, B.; Cubuk, O.; Isildak, I. Electrochemical determination of copper(II) in water samples using a novel ion-selective electrode based on a graphite oxide–imprinted polymer composite. Anal. Lett. 2018, 51, 1890–1910. [Google Scholar] [CrossRef]
- Zamani, H.A.; Rajabzadeh, G.; Firouz, A.; Ganjali, M.R. Determination of copper (II) in wastewater by electroplating samples using a PVC-membrane copper (II)-selective electrode. J. Anal. Chem. 2007, 62, 1080–1087. [Google Scholar] [CrossRef]
- Seher, S.; Shah, A.; Iftikhar, F.J.; Nisar, J.; Ashiq, M.N.; Aljar, M.A.; Akhter, M.S. Detection of Copper Ions by a Simple, Greener and Cost Effective Sensor with GCE Modified with L-Tryptophan. J. Electrochem. Soc. 2020, 167, 027506. [Google Scholar] [CrossRef]
- Romero-Cano, L.A.; Zárate-Guzmán, A.I.; Carrasco-Marín, F.; González-Gutiérrez, L.V. Electrochemical detection of copper in water using carbon paste electrodes prepared from bio-template (grapefruit peels) functionalized with carboxyl groups. J. Electroanal. Chem. 2019, 837, 22–29. [Google Scholar] [CrossRef]
- Zhang, C.; Tao, W.; Qiu, C.; Qu, W.; Zhuang, Y.; Gu, Y.; Hao, H.; Zhao, Z. Detection of Copper Ions in Seawater Using a Graphitised Multi-Walled Carbon Nanotubes-Copper Ion Carrier Modified Electrode. Water 2024, 16, 2128. [Google Scholar] [CrossRef]
- Li, R.-Z.; Qin, L.; Fu, D.-J.; Wang, M.-L.; Song, X.-F.; Bai, Y.-H.; Liu, W.-F.; Liu, X.-G. A highly selective and sensitive electrochemical Cu(II) detector based on ion-imprinted magnetic carbon nanospheres. New Carbon Mater. 2023, 38, 1092–1100. [Google Scholar] [CrossRef]
- Li, Y.; Liu, Y.; Zhang, Z.; Tong, J.; Bian, C.; Dong, H.; Xia, S. A portable sensor system for detection of copper ions in water samples. In Proceedings of the 2019 IEEE 14th International Conference on Nano/Micro Engineered and Molecular Systems (NEMS), Bangkok, Thailand, 11–14 April 2019; IEEE: Piscataway, NJ, USA, 2019; pp. 385–388. [Google Scholar] [CrossRef]
- Inam, A.K.M.S.; Costa Angeli, M.A.; Shkodra, B.; Douaki, A.; Avancini, E.; Magagnin, L.; Petti, L.; Lugli, P. Flexible Screen-Printed Electrochemical Sensors Functionalized with Electrodeposited Copper for Nitrate Detection in Water. ACS Omega 2021, 6, 33523–33532. [Google Scholar] [CrossRef] [PubMed] [PubMed Central]
- Li, D.; Xu, S.; Jin, H.; Wang, J.; Yan, F. Copper Nanoparticles Confined in a Silica Nanochannel Film for the Electrochemical Detection of Nitrate Ions in Water Samples. Molecules 2023, 28, 7515. [Google Scholar] [CrossRef] [PubMed] [PubMed Central]
- Daly, R.; Narayan, T.; Shao, H.; O’Riordan, A.; Lovera, P. Platinum-Based Interdigitated Micro-Electrode Arrays for Reagent-Free Detection of Copper. Sensors 2021, 21, 3544. [Google Scholar] [CrossRef]
- Cranny, A.; Harris, N.R.; Nie, M.; Wharton, J.A.; Wood, R.J.K.; Stokes, K.R. Sensors for Corrosion Detection: Measurement of Copper Ions in 3.5% Sodium Chloride Using Screen-Printed Platinum Electrodes. IEEE Sens. J. 2012, 12, 2091–2099. [Google Scholar] [CrossRef]
- Mauritz, K.A.; Moore, R.B. Nafion®: A unique polymer for membranes. Chem. Rev. 2004, 104, 4535–4586. [Google Scholar] [CrossRef]
- Arán-Ais, R.M.; Herrero, E.; Feliu, J.M. Termodynamic studies of anion adsorption at the Pt(111) electrode surface from glycolic acid solutions. J. Solid State Electrochem. 2015, 19, 13–21. [Google Scholar] [CrossRef][Green Version]
- Chen, S.H. Wither the Concepts of Mole and Concentration: Conceptual Confusion in applying M1V1 = M2V2. Univers. J. Educ. Res. 2016, 4, 1158–1162. [Google Scholar] [CrossRef][Green Version]
- Lin, C.J.; Wang, P.Y.; Lin, Y.L.; Chang, S.T.; Hsu, C.S.; Wu, S.P.; Wu, C.H. Nonpolar Side Chains Affect the Photochemical Redox Reactions of Copper(II)–Amino Acid Complexes in Aqueous Solutions. ACS Omega 2021, 6, 28194–28202. [Google Scholar] [CrossRef] [PubMed]
- Chemistry LibreTexts. Characteristic Reactions of Copper Ions (Cu2+). 2023. Available online: https://chem.libretexts.org (accessed on 7 June 2025).
- Liu, Y.; Aoki, K.J.; Chen, J. The Difference in the Effects of IR-Drop from the Negative Capacitance of Fast Cyclic Voltammograms. Electrochem 2023, 4, 460–472. [Google Scholar] [CrossRef]
- Bernalte, E.; Arévalo, S.; Pérez-Taborda, J.; Wenk, J.; Estrela, P.; Avila, A.; Di Lorenzo, M. Rapid and on-site simultaneous electrochemical detection of copper, lead and mercury in the Amazon river. Sens. Actuators B Chem. 2020, 307, 127620. [Google Scholar] [CrossRef]
- Mei, C.J.; Yusof, N.A.; Alang Ahmad, S.A. Electrochemical Determination of Lead & Copper Ions Using Thiolated Calix[4]arene-Modified Screen-Printed Carbon Electrode. Chemosensors 2021, 9, 157. [Google Scholar] [CrossRef]
- Daniele, S.; Bragato, C.; Baldo, M.A. An approach to the calibration less determination of copper and lead by anodic stripping voltammetry at thin mercury film microelectrodes. Application to well water and rain. Anal. Chim. Acta 1997, 346, 145–156. [Google Scholar] [CrossRef]
- See, W.P.; Nathan, S.; Heng, L.Y. Copper(II) and aluminium(III) ion sensors based on gold nanoparticles modified screen-printed carbon electrodes. AIP Conf. Proc. 2013, 1571, 725–731. [Google Scholar] [CrossRef]
- Bobrowski, A.; Maczuga, M.; Królicka, A.; Konstanteli, E.; Sakellaropoulou, C.; Economou, A. Determination of Copper(II) Through Anodic Stripping Voltammetry in Tartrate Buffer Using an Antimony Film Screen-printed Carbon Electrode. Anal. Lett. 2017, 50, 2920–2936. [Google Scholar] [CrossRef]
- Tesfaye, E.; Chandravanshi, B.S.; Negash, N.; Tessema, M. Development of a new electrochemical method for the determination of copper(II) at trace levels in environmental and food samples. RSC Adv. 2022, 12, 35367–35382. [Google Scholar] [CrossRef] [PubMed]
- Li, L.G.; Chen, M.; Hao, H.Q.; Xu, Q.Q.; Wu, J.; Xie, C.G.; Fu, X.C. Electrochemical determination of trace copper(II) based on L-cysteine functionalized gold nanoparticle/CdS nanosphere hybrid. Anal. Methods 2016, 8, 3592–3598. [Google Scholar] [CrossRef]
- Koudelkova, Z.; Syrovy, T.; Ambrozova, P.; Moravec, Z.; Kubac, L.; Hynek, D.; Richtera, L.; Adam, V. Determination of zinc, cadmium, lead, copper and silver using a carbon paste electrode and a screen printed electrode modified with chromium(III) oxide. Sensors 2017, 17, 1832. [Google Scholar] [CrossRef] [PubMed]
- Zeng, B.; Ding, X.; Zhao, F.; Yang, Y. Electrochemical determination of copper(II) by gold electrodes modified with N-ACETYL CYSTEINE. Anal. Lett. 2002, 35, 2245–2258. [Google Scholar] [CrossRef]
- Hermouche, L.; Aqil, Y.; Abbi, K.; El Hamdouni, Y.; Ouanji, F.; El Hajjaji, S.; El Mahi, M.; Lotfi, E.; Labjar, N. Eco-friendly modified carbon paste electrode by Bigarreau Burlat kernel shells for simultaneous trace detection of cadmium, lead, and copper. Chem. Data Collect. 2021, 32, 100642. [Google Scholar] [CrossRef]
- Ting, S.L.; Ee, S.J.; Ananthanarayanan, A.; Leong, K.C.; Chen, P. Graphene quantum dots functionalized gold nanoparticles for sensitive electrochemical detection of heavy metal ions. Electrochim. Acta 2015, 172, 7–11. [Google Scholar] [CrossRef]
- Akhdhar, A.; Binkadem, M.S.; El-Said, W.A.; Yakout, A.A. Design and Fabrication of Silver Nanoparticles Doped β-cyclodextrin-chitosan Functionalized Graphene Nanocomposite Modified Electrode for Determination of Cu(II). Curr. Anal. Chem. 2024, 20, 275–285. [Google Scholar] [CrossRef]
- Melo, L.C.; Julião MSda, S.; Barbano, E.P.; Portela, R.R.; Dias, S.S. Evaluation of voltammetric method for the determination of electrodeposited copper in citrate medium validated by ICP-OES. Matéria 2021, 26, e13069. [Google Scholar] [CrossRef]
- Jing-ji, P.; Hong, Z.; Yi-song, Z.; Guo-kun, L.; Dong-xing, Y. Electrochemical Determination of Trace Copper ions in Drinking Water Source. J. Electrochem. 2019, 25, 699–707. [Google Scholar] [CrossRef]
- Miglione, A.; Spinelli, M.; Amoresano, A.; Cinti, S. Sustainable copper electrochemical stripping onto a paper-based substrate for clinical application. ACS Meas. Sci. Au 2022, 2, 177–184. [Google Scholar] [CrossRef]
- Niu, L.M.; Luo, H.Q.; Li, N.B.; Song, L. Electrochemical detection of copper(II) at a gold electrode modified with a self-assembled monolayer of penicillamine. J. Anal. Chem. 2007, 62, 470–474. [Google Scholar] [CrossRef]
- Patella, B.; Narayan, T.; O’Sullivan, B.; Daly, R.; Zanca, C.; Lovera, P.; Inguanta, R.; O’Riordan, A. Simultaneous detection of copper and mercury in water samples using in-situ pH control with electrochemical stripping techniques. Electrochimica Acta 2023, 439, 141668. [Google Scholar] [CrossRef]
- Hassan, S.S.M.; El-Shalakany, H.H.; Fathy, M.A.; Kamel, A.H. A novel potentiometric screen-printed electrode based on crown ethers/nano manganese oxide/Nafion composite for trace level determination of copper ion in biological fluids. Microchim. Acta 2024, 191, 313. [Google Scholar] [CrossRef] [PubMed]
- Ashley, S. Lister, 7—Validation of HPLC Methods in Pharmaceutical Analysis. In Separation Science and Technology; Ahuja, S., Dong, M.W., Eds.; Academic Press: Cambridge, MA, USA, 2005; Volume 6, pp. 191–217. ISSN 1877-1718. [Google Scholar]
- Nudurupati, U.; Narla, T.; Punihaole, D.; Ou, Y. A facile approach to create sensitive and selective Cu(II) sensors on carbon fiber microelectrodes. RSC Adv. 2023, 13, 33688–33695. [Google Scholar] [CrossRef] [PubMed]
- Kaimal, R.; Dube, A.; Al Souwaileh, A.A.; Wu, J.J.; Anandan, S. A copper metal–organic framework-based electrochemical sensor for identification of glutathione in pharmaceutical samples. Analyst 2024, 149, 947–957. [Google Scholar] [CrossRef] [PubMed]
- Elik, M.; Akyasan, A.; Ozcan, A.N.; Gurdere, M.B. Electrochemical determination of copper(II) ions based on a semicarbazone derivative molecule. Turk. J. Sens. Biosens. 2024, 1, 37–44. [Google Scholar]
- Gao, Y.; Li, X.; Zhang, H.; Wang, Y. Deep learning-assisted single-atom detection of copper ions by electrochemical sensor. Nat. Commun. 2024, 15, 54743. [Google Scholar]
Disclaimer/Publisher’s Note: The statements, opinions and data contained in all publications are solely those of the individual author(s) and contributor(s) and not of MDPI and/or the editor(s). MDPI and/or the editor(s) disclaim responsibility for any injury to people or property resulting from any ideas, methods, instructions or products referred to in the content. |
© 2025 by the author. Licensee MDPI, Basel, Switzerland. This article is an open access article distributed under the terms and conditions of the Creative Commons Attribution (CC BY) license (https://creativecommons.org/licenses/by/4.0/).