
Thermal Runaway Critical Threshold and Gas Release Safety Boundary of 18,650 Lithium-Ion Battery in State of Charge


Abstract
1. Introduction
2. Experimental Platform and Device
2.1. Charging and Discharging Cycle Equipment
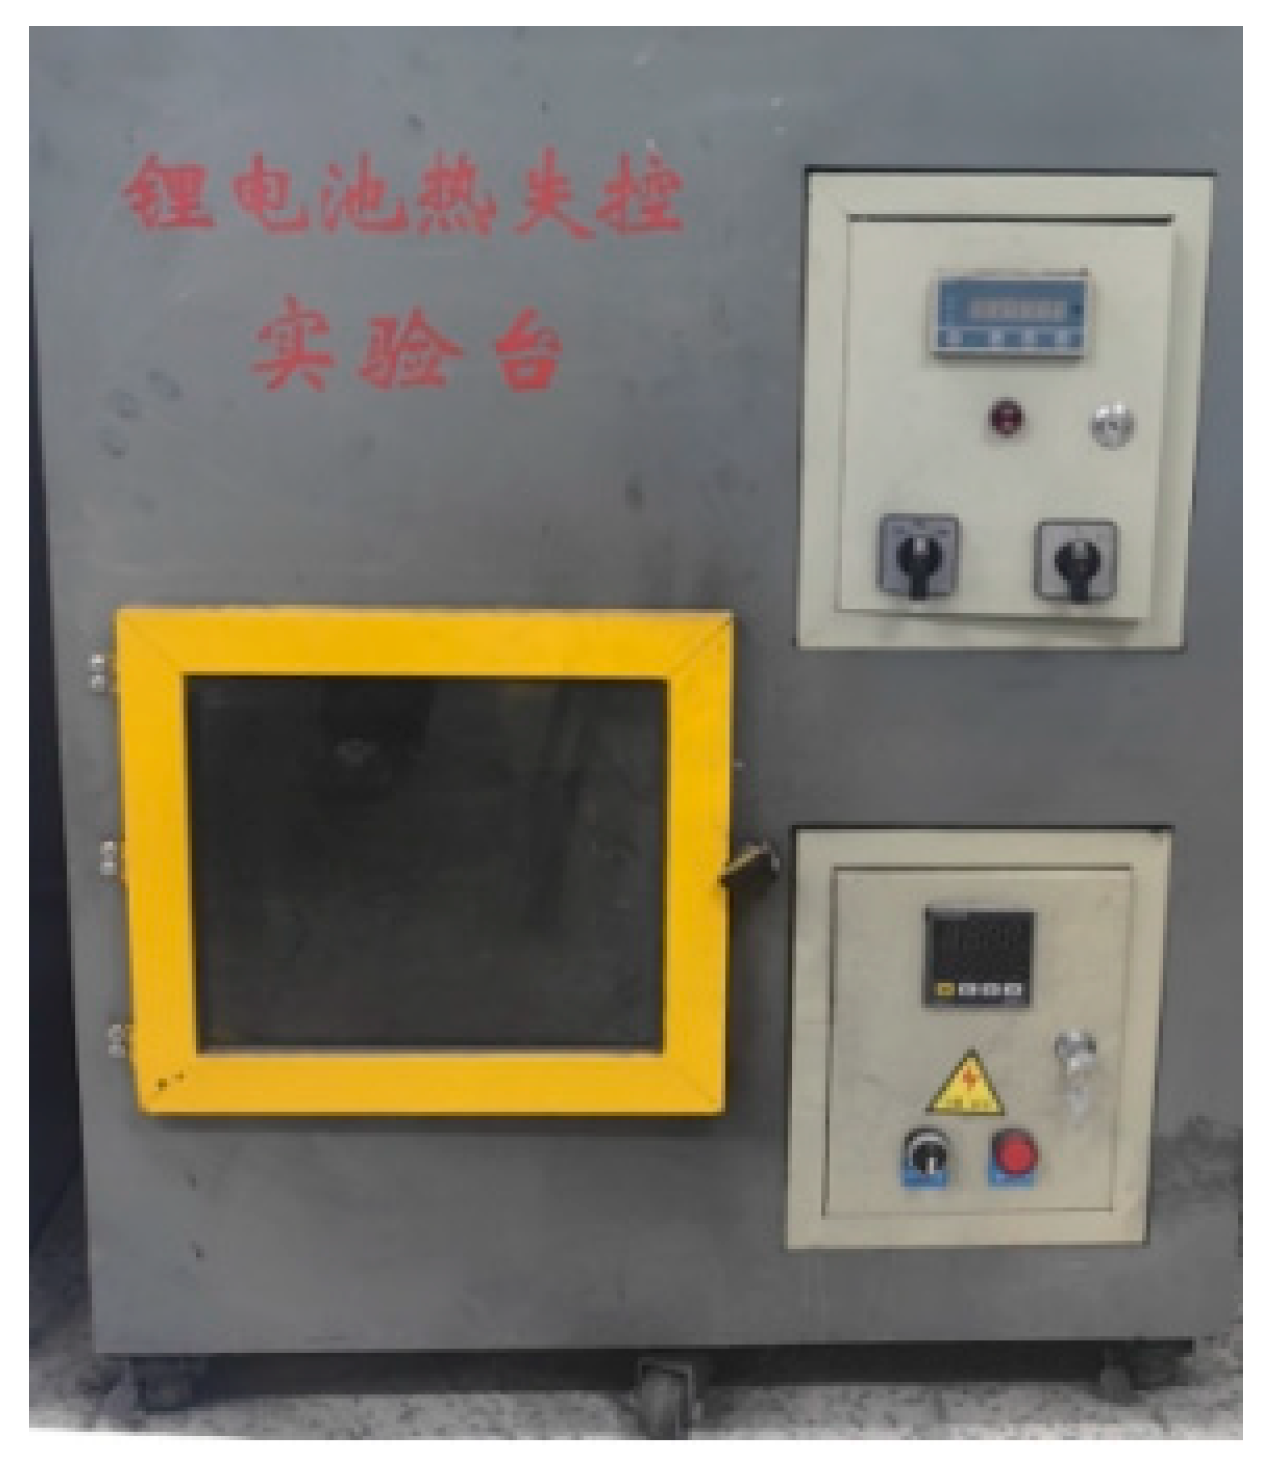
2.2. Thermal Runaway Fault Simulation Platform
2.3. Data Acquisition System
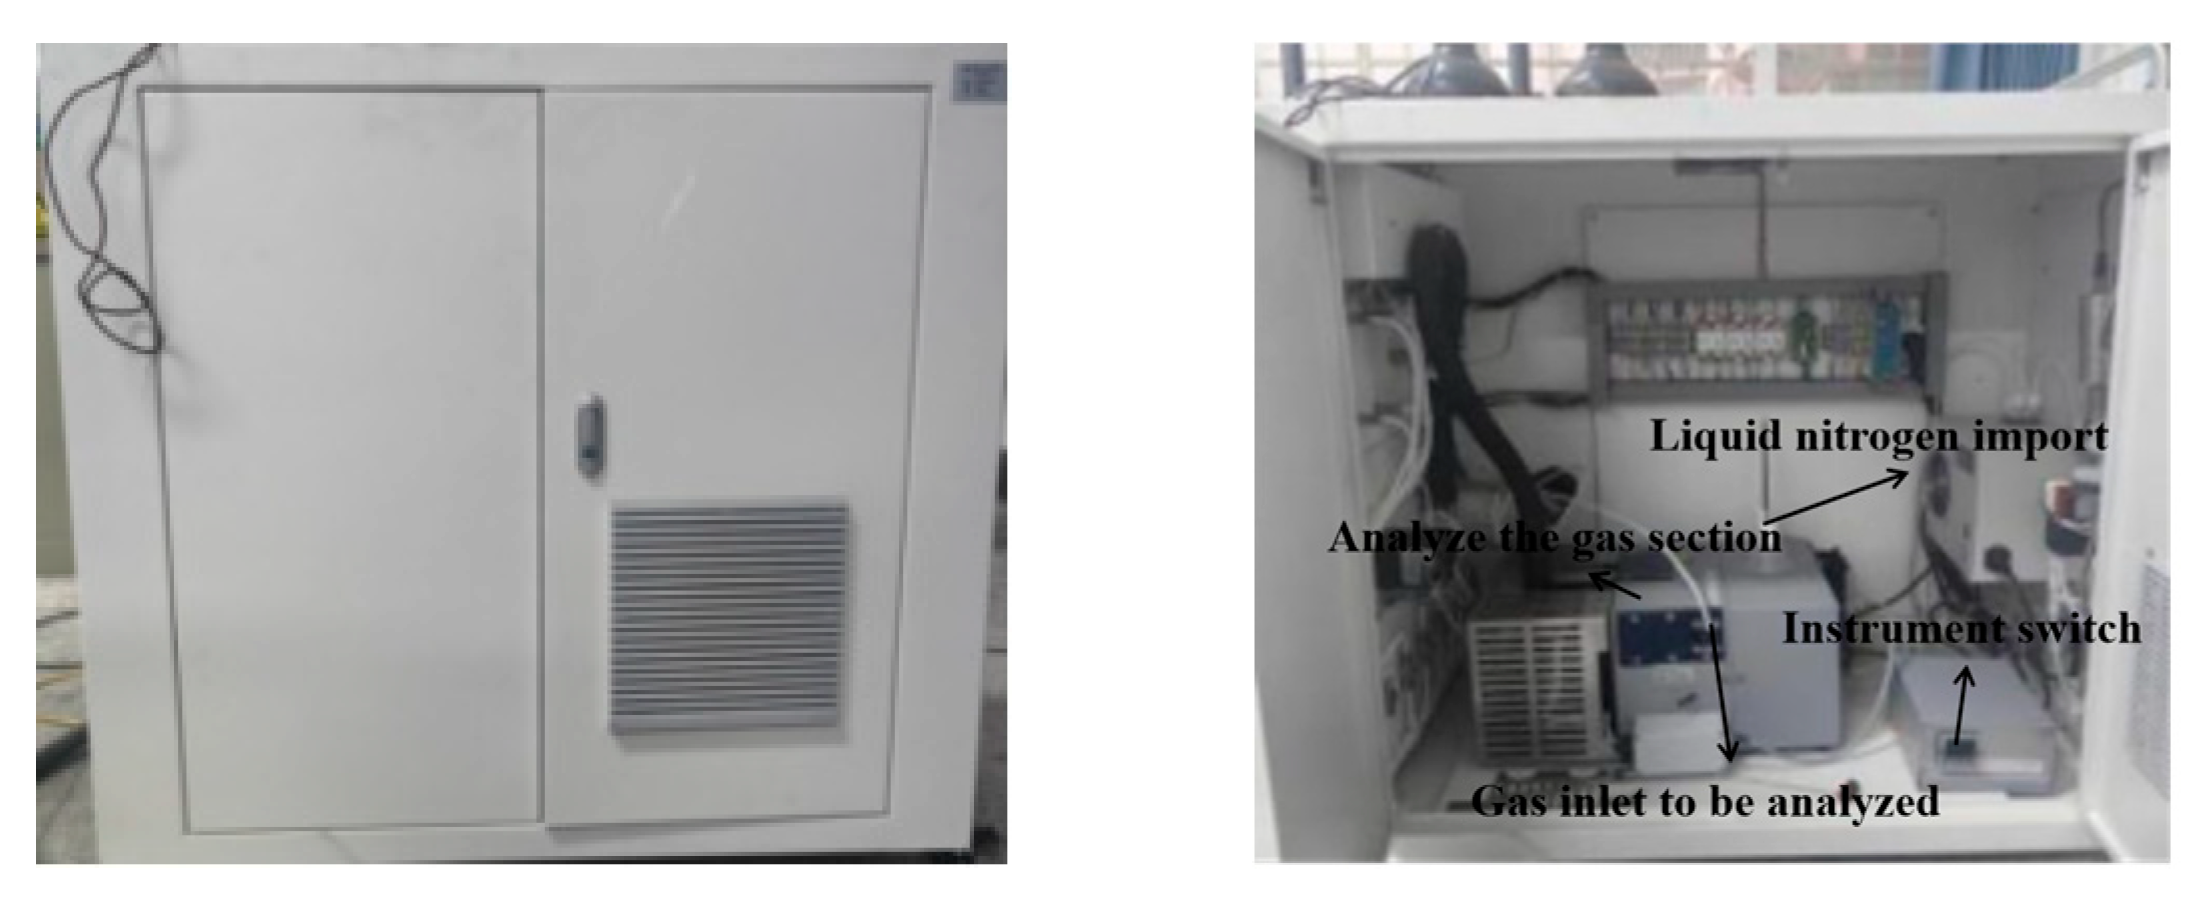
2.4. Fourier Gas Analyzer
3. Experimentation
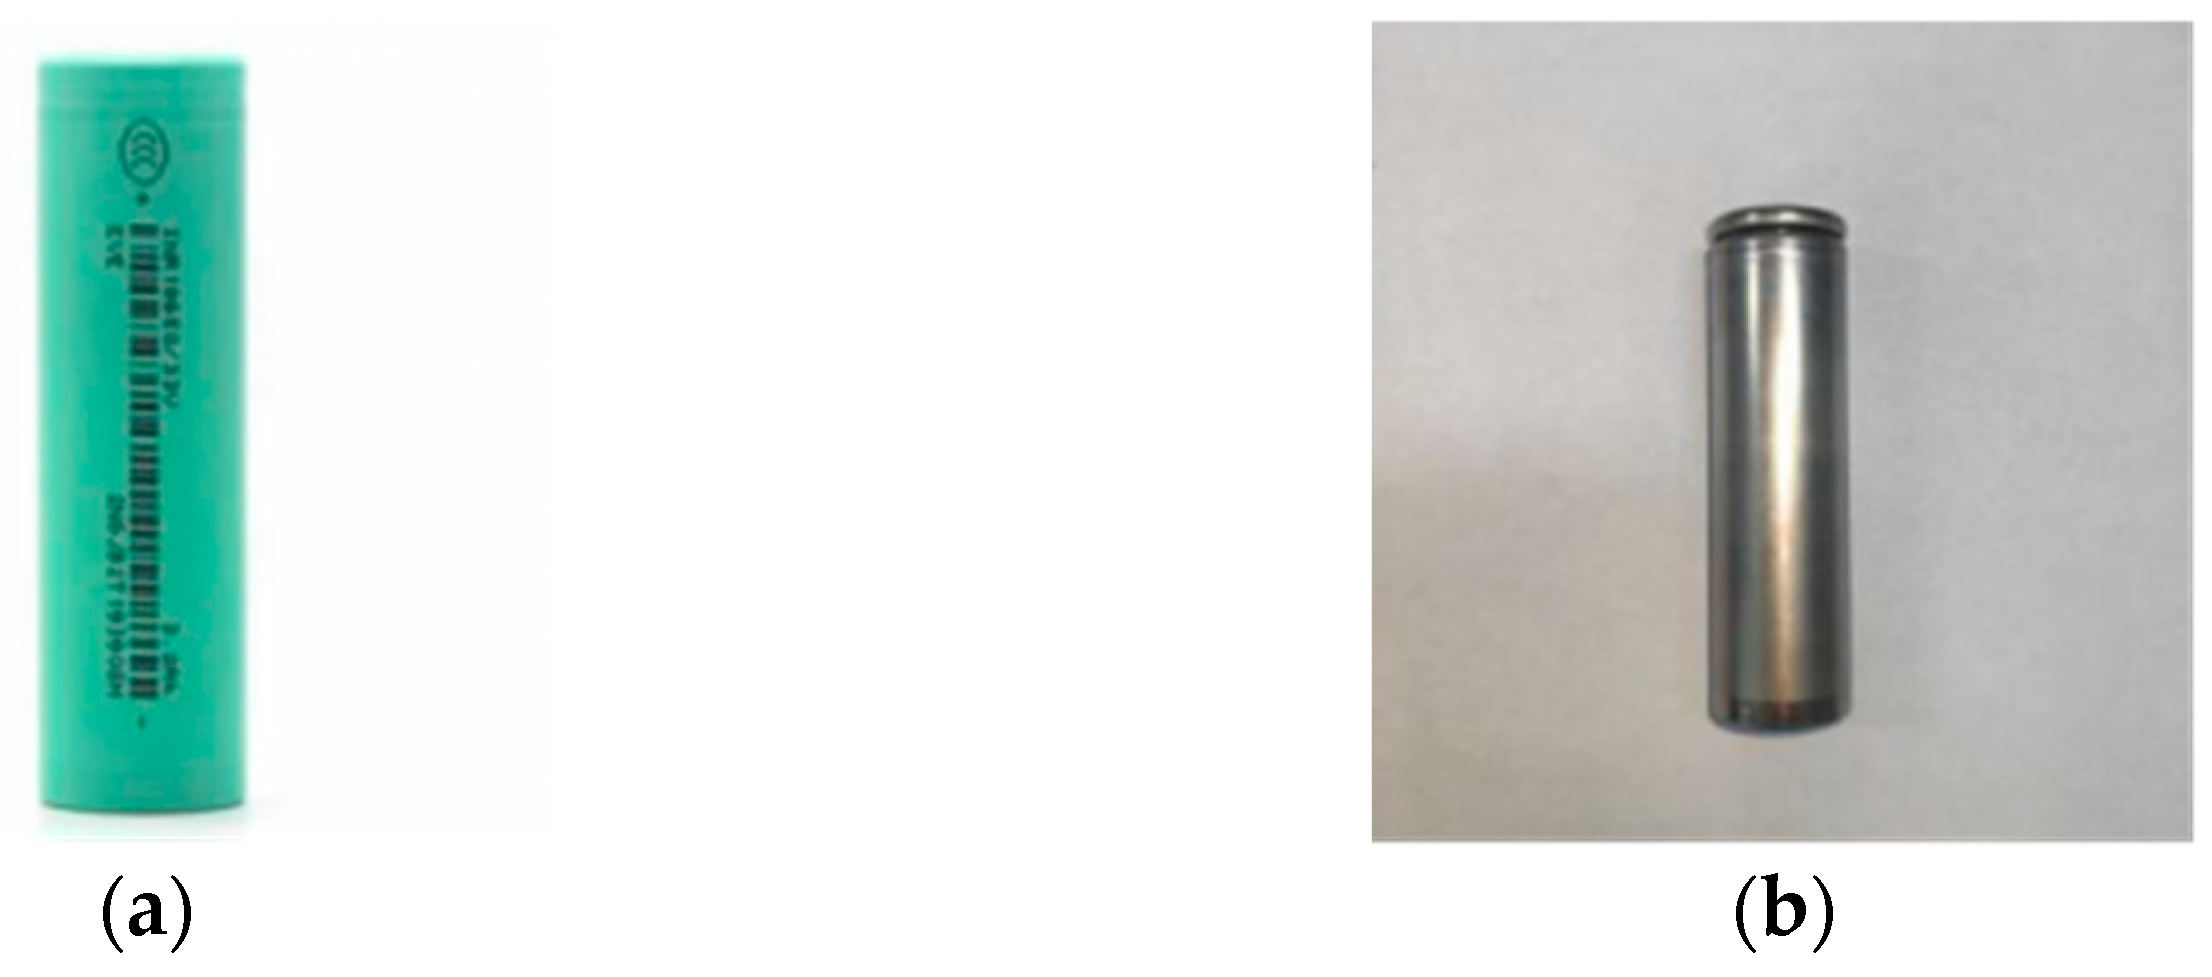
3.1. Samples
3.2. Experimental Procedure
3.3. Test Conditions for Lithium Battery Thermal Runaway
4. Results and Discussion
4.1. Thermal Image Analysis of Thermal Runaway
4.2. Thermal Runaway Mass Loss Analysis
4.3. Thermal Runaway Surface Temperature Analysis
4.4. Analysis of Gas Release Characteristics of Thermal Runaway
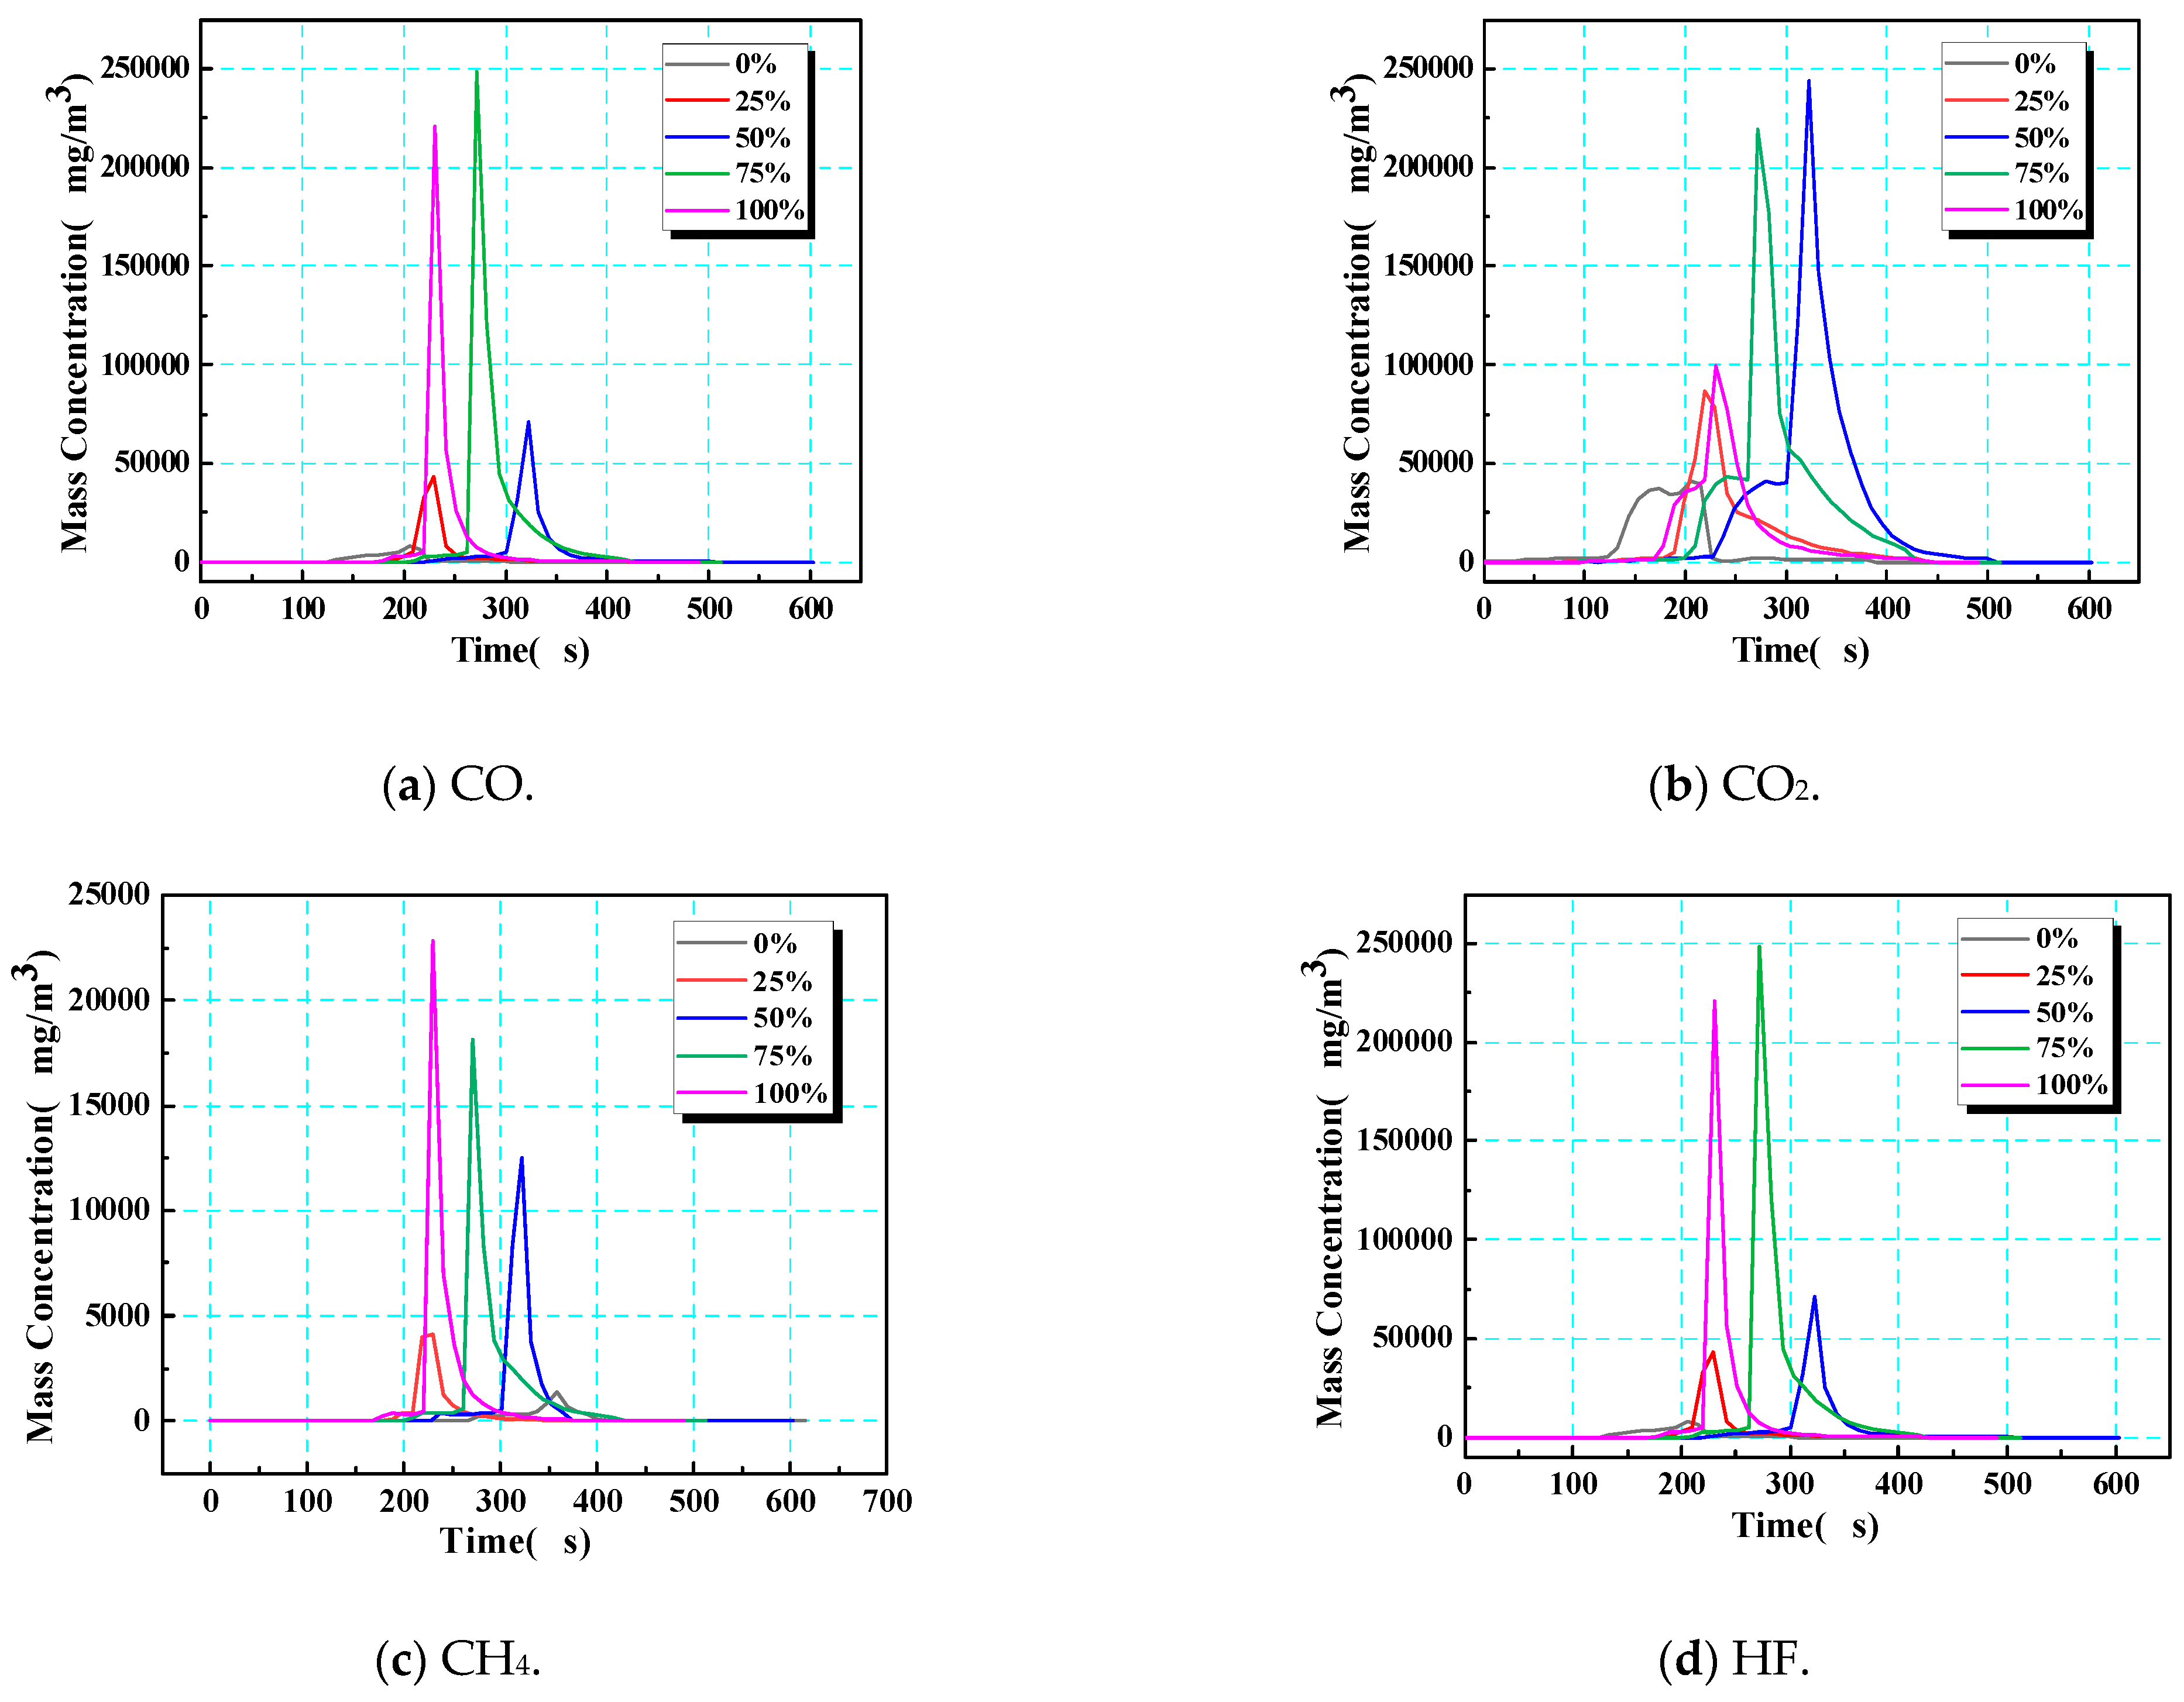
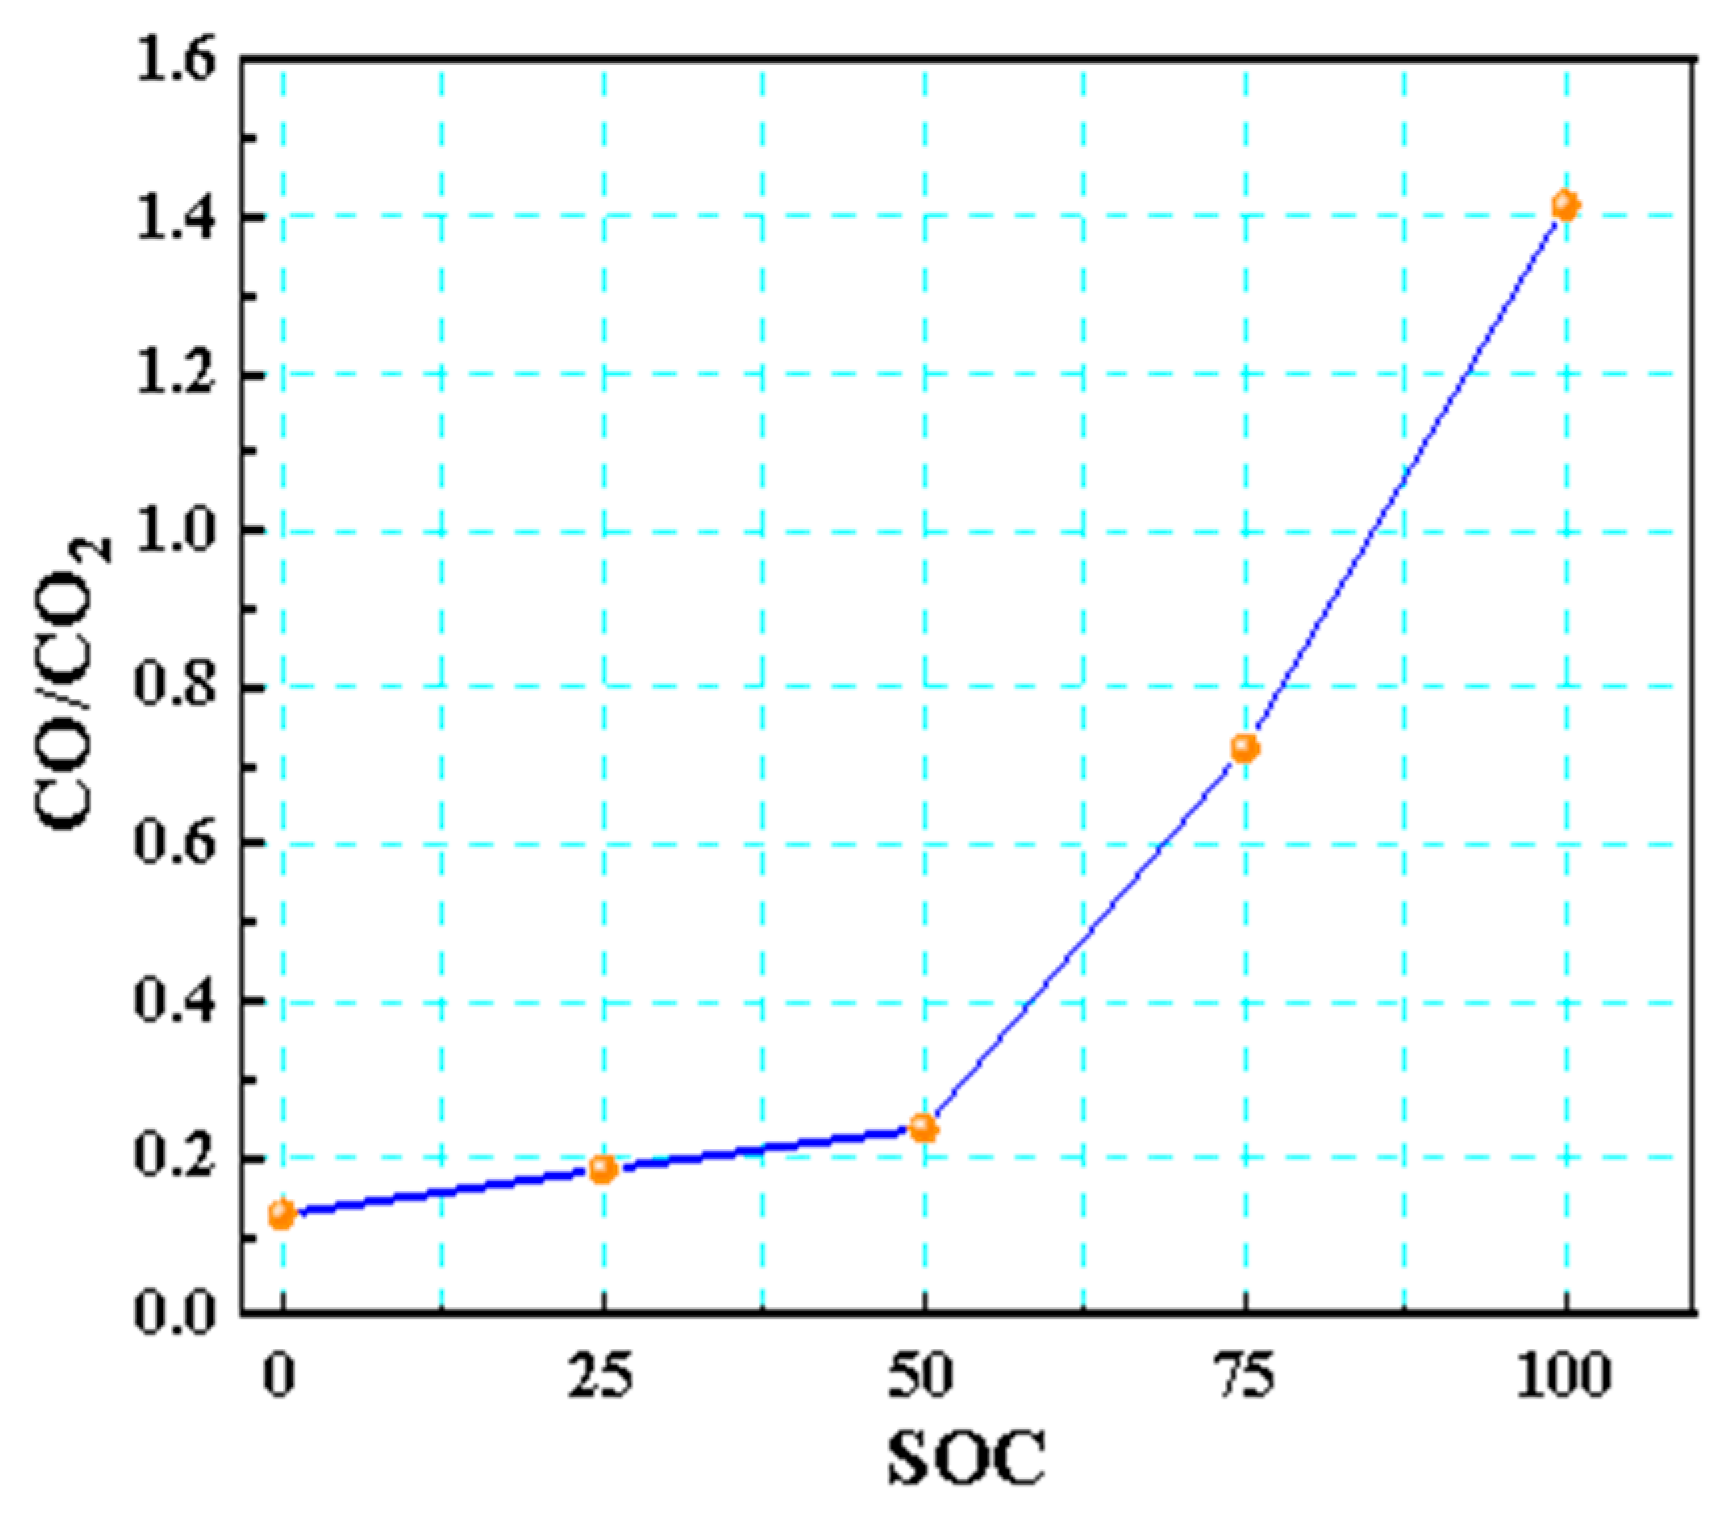
4.4.1. Real-Time Gas Composition Analysis of Thermal Runaway
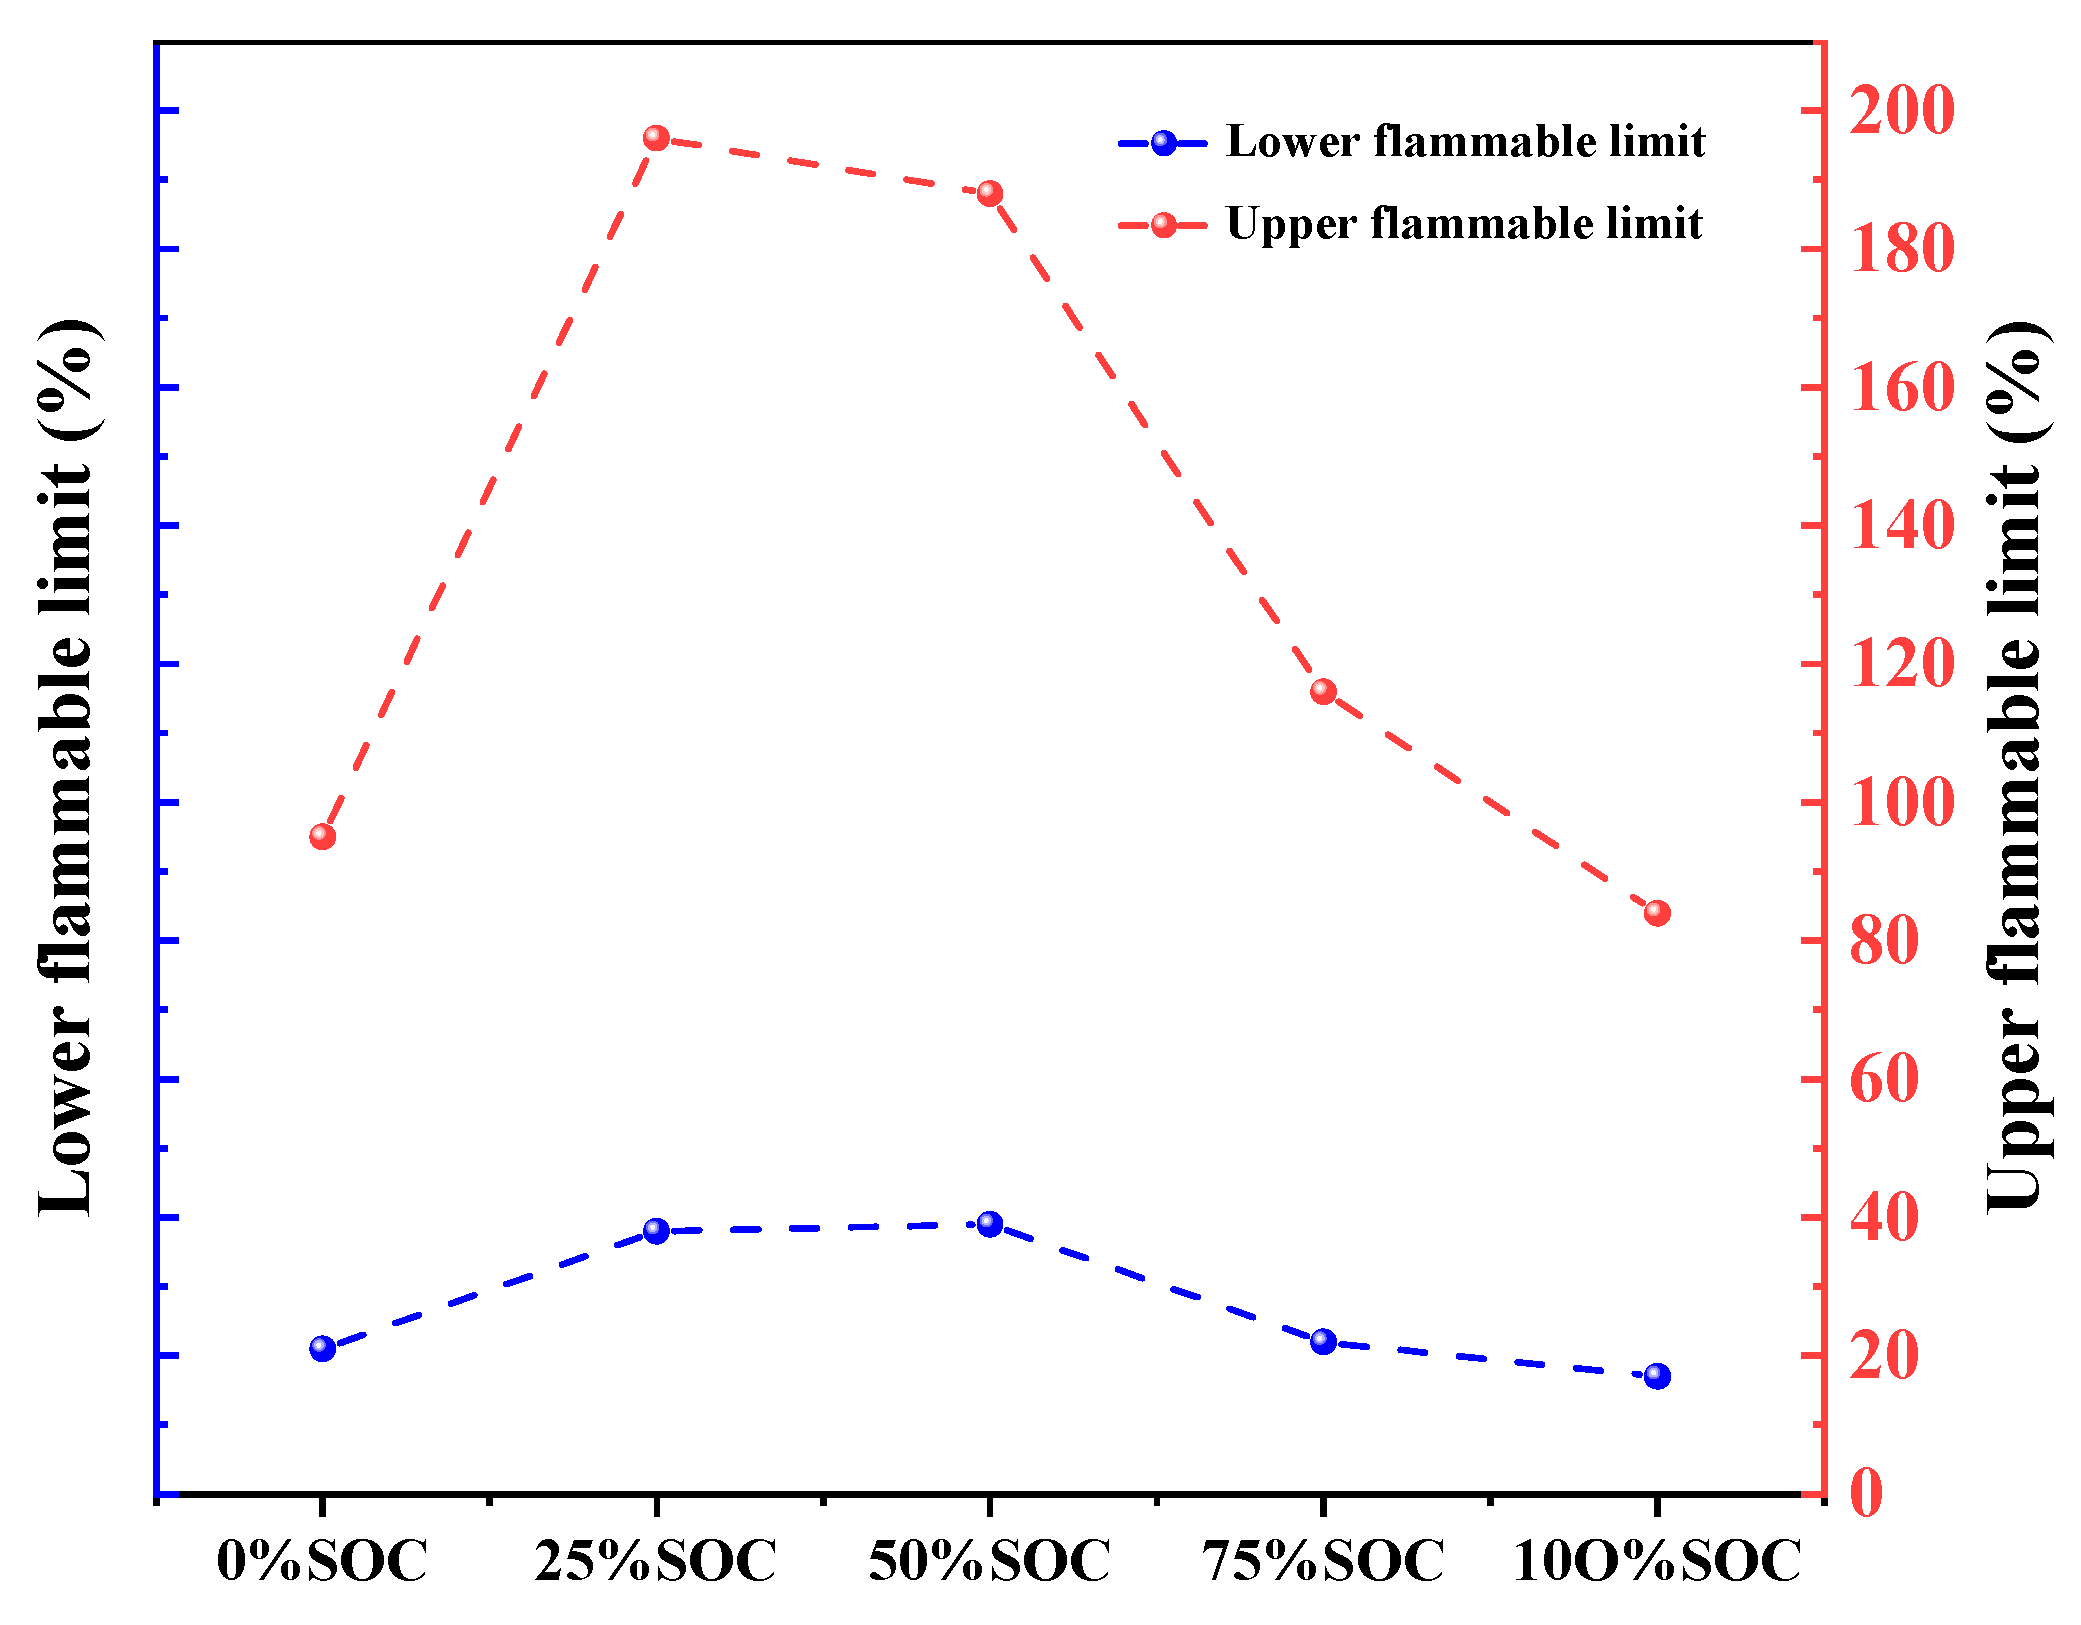
4.4.2. Analysis of the Gas Explosion Limit in Thermal Runaway
5. Conclusions
- Temperature response and gas eruption: After the safety valve was opened, the accumulated gas erupted, forming a combustible mixture and igniting, and the higher the SOC, the more intense the temperature distribution of the infrared thermal image, indicating that the charged state had a notable impact on the thermal runaway temperature distribution of 18,650 LIBs. Quantifying gas explosion risks via flammability limit calculations revealed lower explosive limits (17–21%) at extreme SOCs. Spatial thermal evolution ascertained through synchronized multi-point monitoring showed high-SOC-induced cathode-side dominance.
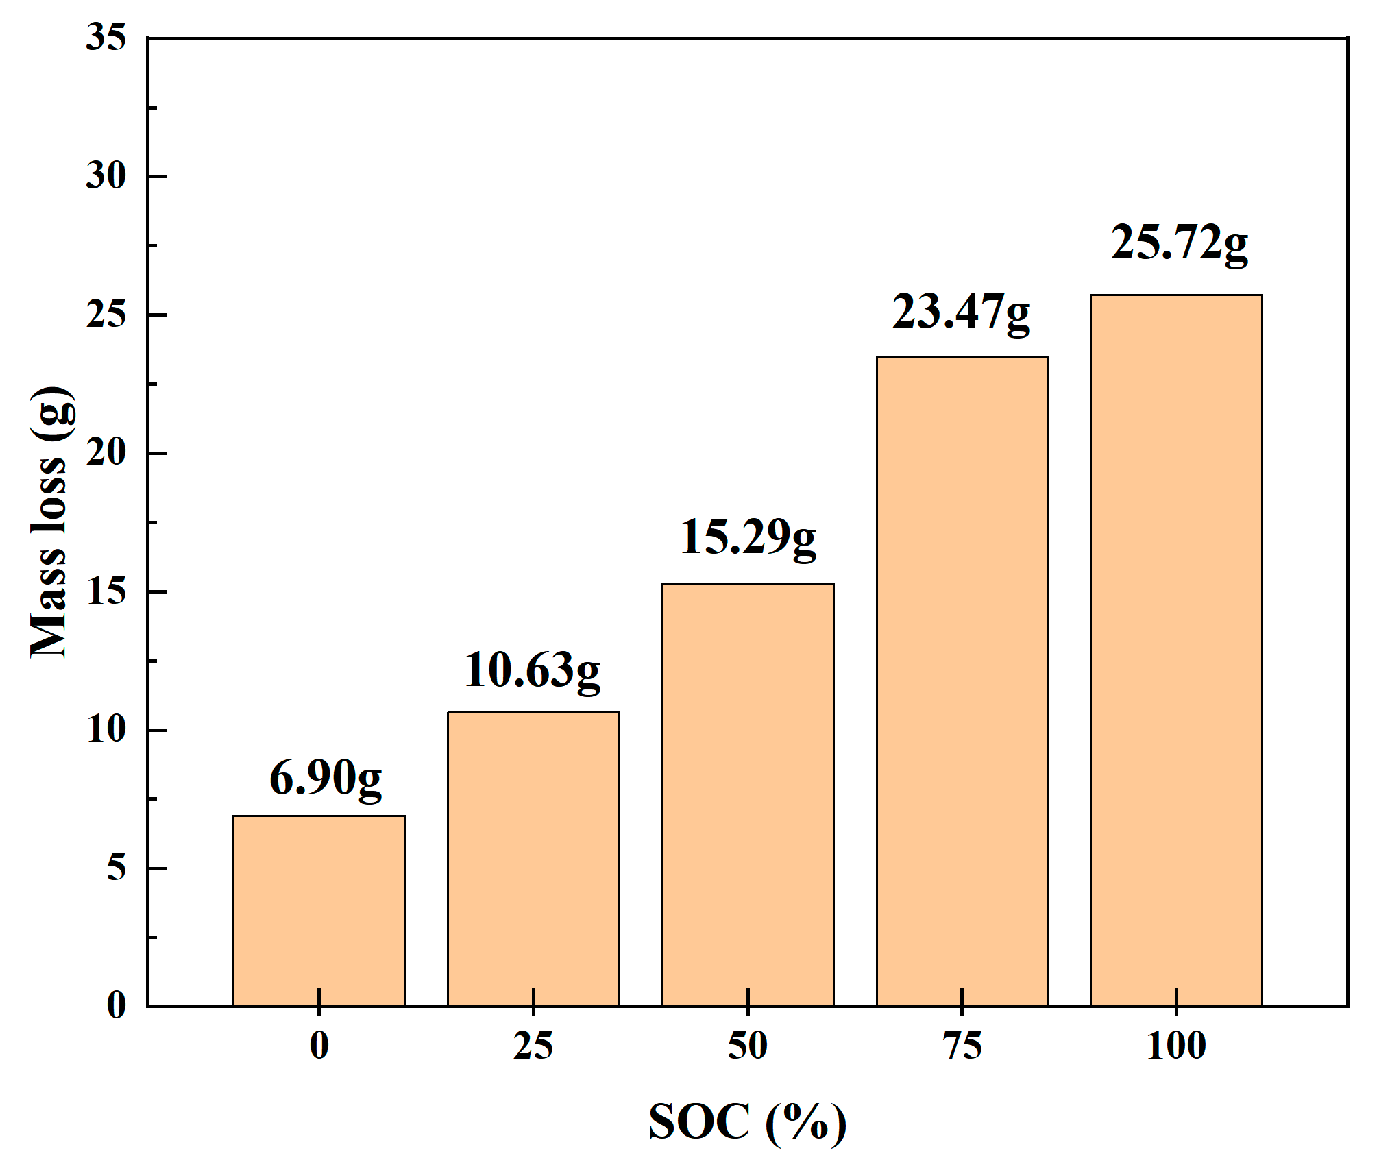
- Law of mass loss: Mass loss after thermal runaway was strongly positively correlated with the SOC (6.90–25.75 g corresponds to a 0–100% SOC), indicating that the SOC is the key factor affecting mass loss during thermal runaway in 18,650 LIBs.
- Reaction intensity classification: Batteries with high SOCs (≥50%) generally exhibited elevated critical and maximum temperatures, though the 75% SOC LIB showed a slight deviation in critical temperature (Table 5). The rate of temperature rise accelerated markedly at a 100% SOC, triggering chain exothermic reactions.
- Gas generation characteristics and fire risk: CO, CO2, and CH4 accounted for over 90% of the gases generated, with incomplete combustion being prominent at a 100% SOC, making this SOC the most hazardous for fires; the lower limit of flammability was low (gas readily ignited but with a narrow concentration window) at low/high SOCs, while the flammability range was wide at a 25–50% SOC, indicating that gas hazards were relatively low during thermal runaway but the potential for combustion remained high. Therefore, the SOC influences the intensity of energy release, gas toxicity, and fire dynamics by regulating the distribution and reaction pathways of active materials.
Author Contributions
Funding
Data Availability Statement
Conflicts of Interest
References
- Guo, F.; Wu, X.-W.; Liu, L.-L.; Ye, J.-L.; Wang, T.; Fu, L.-J.; Wu, Y.-P. Prediction of remaining useful life and state of health of lithium batteries based on time series feature and Savitzky-Golay filter combined with gated recurrent unit neural network. Energy 2023, 270, 126880. [Google Scholar] [CrossRef]
- Ren, W.-H.; Ding, C.-F.; Fu, X.-W.; Huang, Y. Advanced gel polymer electrolytes for safe and durable lithium metal batteries: Challenges, strategies, and perspectives. Energy Storage Mater. 2021, 34, 515–535. [Google Scholar] [CrossRef]
- Liu, Z.J.; Han, K.-H.; Zhang, Q.; Li, M.-H. Thermal safety focus and early warning of lithium-ion batteries: A systematic review. Energy Storage 2025, 115, 115944. [Google Scholar] [CrossRef]
- Shan, T.-X.; Zhang, P.C.; Wang, Z.P.; Zhu, X.-Q. Insights into extreme thermal runaway scenarios of lithium-ion batteries fire and explosion: A critical review. Energy Storage 2024, 88, 111532. [Google Scholar] [CrossRef]
- Li, P.-C.; Ju, S.-X.; Bai, S.-X.; Zhao, H.; Zhang, H.-Y. State of charge estimation for lithium-ion batteries based on physics-embedded neural network. Power Sources 2025, 640, 236785. [Google Scholar] [CrossRef]
- Kim, J.; Bae, D.; Park, C.; Park, H. Pre-detection of thermal runaway in Li-ion 18,650 batteries via temperature and voltage: The importance of temperature measurement location. Appl. Therm. Eng. 2025, 269, 125991. [Google Scholar] [CrossRef]
- Feng, X.-N.; Zheng, S.-Q.; Ren, D.-S.; He, X.-M.; Wang, L.; Cui, H.; Liu, X.; Jin, C.-Y.; Zhang, F.-S.; Xu, C.-S.; et al. Investigating the thermal runaway mechanisms of lithium-ion batteries based on thermal analysis database. Appl. Energy 2019, 246, 53–64. [Google Scholar] [CrossRef]
- Li, K.-J.; Chen, L.; Gao, X.-L.; Lu, Y.; Wang, D.-P.; Zhang, W.-X.; Wu, W.-X.; Han, X.-B.; Cao, Y.-C.; Wen, J.-Y.; et al. Implementing expansion force-based early warning in LiFePO4 batteries with various states of charge under thermal abuse scenarios. Appl. Energy 2024, 362, 122998. [Google Scholar] [CrossRef]
- Liu, X.; Wu, Z.-B.; Stoliarov, S.-I.; Denlinger, M.; Masias, A.; Snyder, K. Heat release during thermally-induced failure of a lithium-ion battery: Impact of cathode composition. Fire Saf. J. 2016, 85, 10–22. [Google Scholar] [CrossRef]
- Li, Y.-X.; Jiang, L.-H.; Zhang, N.-J.; Wei, Z.; Mei, W.-X.; Duan, Q.-L.; Sun, J.-H.; Wang, Q.-S. Early warning method for thermal runaway of lithium-ion batteries under thermal abuse condition based on online electrochemical impedance monitoring. Energy Chem. 2024, 92, 74–86. [Google Scholar] [CrossRef]
- Mao, N.; Gadkari, S.; Wang, Z.-R.; Zhang, T.; Bai, J.-L.; Cai, Q. A comparative analysis of lithium-ion batteries with different cathodes under overheating and nail penetration conditions. Energy 2023, 278, 128027. [Google Scholar] [CrossRef]
- Zhou, Z.-Z.; Li, M.-Y.; Zhou, X.-D.; Li, L.; Ju, X.-Y.; Yang, L.-Z. Investigating thermal runaway triggering mechanism of the prismatic lithium iron phosphate battery under thermal abuse. Renew. Energy 2024, 220, 119674. [Google Scholar] [CrossRef]
- Lin, C.-J.; Mao, J.-B.; Yang, J.; Qi, C.; Zhang, Y.-M.; Dan, S.; Liu, X. Early warning for thermal runaway of Li [Ni0.5Co0.2Mn0.3] O2 and LiFePO4 batteries under external heating, penetration and overcharging conditions. Energy Storage 2025, 109, 115085. [Google Scholar] [CrossRef]
- Ren, D.-S.; Feng, X.-N.; Lu, L.-G.; He, X.-M.; Ouyang, M.-G. Overcharge behaviors and failure mechanism of lithium-ion batteries under different test conditions. Appl. Energy 2019, 250, 323–332. [Google Scholar] [CrossRef]
- Ouyang, D.-X.; Liu, J.-H.; Chen, M.-Y.; Wang, J. Investigation into the fire hazards of lithium-ion batteries under overcharging. Appl. Sci. 2017, 7, 1314. [Google Scholar] [CrossRef]
- Zhou, G.; Lu, H.-H.; Zhang, Q.; Yang, S.-Q.; Liu, Y.; Niu, C.-X.; Kong, Y.; Huang, Q.; Wei, Z.-K. Experimental study on thermal runaway and flame eruption characteristics of NCM523 lithium-ion battery induced by the coupling stimulations of overcharge-penetration. PSEP 2024, 191, 131–145. [Google Scholar] [CrossRef]
- Deng, J.; Chen, B.-H.; Lu, J.-Z.; Zhou, T.-N.; Wu, C.-P. Thermal runaway and combustion characteristics, risk and hazard evaluation of lithium-iron phosphate battery under different thermal runaway triggering modes. Appl. Energy 2024, 368, 123451. [Google Scholar]
- Wang, C.-J.; Zhu, Y.-L.; Gao, F.; Bu, X.-Y.; Chen, H.-S.; Quan, T.; Xu, Y.-B.; Jiao, Q.-J. Internal short circuit and thermal runaway evolution mechanism of fresh and retired lithium-ion batteries with LiFePO4 cathode during overcharge. Appl. Energy 2022, 328, 120224. [Google Scholar] [CrossRef]
- Yuan, Q.-F.; Zhao, F.-G.; Wang, W.-D.; Zhao, Y.-M.; Liang, Z.-Y.; Yan, D.-L. Overcharge failure investigation of lithium-ion batteries. Electrochim. Acta 2015, 178, 682–688. [Google Scholar] [CrossRef]
- Zhang, J.-Y.; Yang, X.-Q.; Zhang, G.-Q.; Huang, Q.-Q.; Xiao, C.-R.; Yang, C. Investigation on the root cause of the decreased performances in the overcharged lithium iron phosphate battery. Int. J. Energy Res. 2018, 42, 2448–2455. [Google Scholar] [CrossRef]
- Parasumanna, A.-B.-K.; Karle, U.-S.; Saraf, M.-R. Material characterization and analysis on the effect of vibration and nail penetration on lithium-ion battery. WEVJ 2019, 10, 69. [Google Scholar] [CrossRef]
- Li, A.-X.; Cui, Y.; Wang, G.-H.; He, X.-H.; Guo, Z.-L.; Wang, J.; Mao, Y.-Z. Pyrolysis pretreatment for recycling spent LiFePO4 batteries in argon gas: Kinetic behaviors and reaction mechanism. J. Environ. Chem. Eng 2025, 13, 117019. [Google Scholar] [CrossRef]
- Li, Y.; Du, J.-H.; Yang, S.-Z.; Zhang, M.-Q.; Tu, R.; Zhang, R.-C.; Bi, K. Study on thermal runaway of cylindrical lithium iron phosphate battery under needle prick. ESST 2019, 8, 559–566. [Google Scholar]
- Abaza, A.; Ferrari, S.; Wong, H.-K.; Lyness, C.; Moore, A.; Weaving, J.-L.; Blanco-Martin, M.; Dashwood, R.; Bhagat, R. Experimental study of internal and external short circuits of commercial automotive pouch lithium-ion cells. Energy Storage 2018, 16, 211–217. [Google Scholar] [CrossRef]
- Feng, X.-N.; Ouyang, M.-G.; Liu, X.; Lu, L.-G.; Xia, Y.; He, X.-M. Thermal runaway mechanism of lithium-ion battery for electric vehicles: A Review. Energy Storage Mater. 2018, 10, 246–267. [Google Scholar] [CrossRef]
- Zhang, Y.; Ping, P.; Dai, X.-Y.; Li, C.-T.; Li, Z.; Zhuo, P.; Tang, L.; Kong, D.-D.; Yin, X.K. Failure mechanism and thermal runaway behavior of lithium-ion battery induced by arc faults. RSER 2025, 207, 114914. [Google Scholar] [CrossRef]
- Huang, Y.-J.; Zhao, Y.-Q.; Bai, W.; Cao, Y.; Xu, W.-F.; Shen, X.-Q.; Wang, Z.-R. Study on the influence of high rate charge and discharge on thermal runaway behavior of lithium-ion battery. PSEP 2024, 191, 1483–1494. [Google Scholar] [CrossRef]
- Gachot, G.; Grugeon, S.; Eshetu, G.-G.; Mathiron, D.; Ribière, P.; Armand, M.; Laruelle, S. Thermal behaviour of the lithiated-graphite/electrolyte interface through GC/ MS analysis. Electrochimica. Acta 2012, 83, 402–409. [Google Scholar] [CrossRef]
- Gachot, G.; Ribière, P.; Mathiron, D.; Grugeon, S.; Armand, M.; Leriche, J.-B.; Pilard, S.; Laruelle, S. Gas chromatography and mass spectrometry as a suitable tool for the Li-ion battery electrolyte degradation mechanisms study. Anal. Chem. 2011, 83, 478–485. [Google Scholar] [CrossRef]
- Gerelt-Od, B.; Kim, J.; Shin, E.; Kang, H.; Kim, N.; Jo, C.; Son, H.; Yoon, S. In situ raman investigation of resting thermal effects on gas emission in charged commercial 18,650 lithium-ion batteries. Ind. Eng. Chem. 2021, 96, 339–344. [Google Scholar] [CrossRef]
- Zhang, Q.-S.; Qu, Y.-R.; Hao, Z.-L.; Liu, T.-T.; Chen, D. In situ analysis of thermal runaway gas in ternary lithium ion battery. High Volt. Tech. 2022, 48, 2817–2825. [Google Scholar]
- Liu, W.; Zhao, F.-S.; Yin, S.-F.; Ma, T.-Z.; Qing, J. Analysis of solid combustion products to establish a theoretical model of the causes of thermal runaway of ternary lithium-ion battery overcharge and heating. Fire Sci. 2023, 41, 3–15. [Google Scholar] [CrossRef]
- Diaz, F.; Wang, Y.; Weyhe, R.; Friedrich, B. Gas generation measurement and evaluation during mechanical processing and thermal treatment of spent Li-ion batteries. Waste Manag. 2019, 84, 102–111. [Google Scholar] [CrossRef]
- Gilaki, M.; Sahraei, E. Modeling state-of-charge dependent mechanical response of lithium-ion batteries with volume expansion. Energy Rep. 2024, 12, 3607–3619. [Google Scholar] [CrossRef]
- Zhang, J.-Q.; Li, F.-Z.; Yu, L.; Wang, Y.-H.; Wang, K.; Chang, C.-Y.; Li, M.-H.; Hao, W.-H.; Qian, X.-M. Research on the explosive characteristics and suppression mechanisms of gas generation during thermal runaway of batteries in a charged state. Chem. Eng. J. 2025, 505, 159699. [Google Scholar] [CrossRef]
- Zhang, Q.-S.; Qu, Y.-R. Study on gas toxicity of thermal runaway in recycled ternary lithium ion battery. Beihang Univ. 2024, 50, 1761–1769. [Google Scholar]
- Wang, Z.; Yin, B.; Zhao, Q.-J.; An, W.-G.; Shi, B.-B.; Jiang, L.-Y. Study on thermal runaway propagation characteristics of lithium iron phosphate battery pack under different SOCs. ELEC 2022, 12, 200. [Google Scholar]
- Wang, Y.; Ren, D.-S.; Feng, X.-N.; Wang, L.; Ouyang, M.-G. Thermal runaway modeling of large format high-nickel/silicon-graphite lithium-ion batteries based on reaction sequence and kinetics. Appl. Energy 2022, 306, 117943. [Google Scholar] [CrossRef]
- Said, A.-O.; Lee, C.; Stoliarov, S.-I.; Marshall, A.W. Comprehensive analysis of dynamics and hazards associated with cascading failure in 18,650 lithium-ion cell arrays. Appl. Energy 2019, 248, 415–428. [Google Scholar] [CrossRef]


| Category | Parameter Value |
|---|---|
| Overall dimensions | (Length) 65 mm × (height) 18 mm |
| Nominal capacity | 3.2 Ah |
| Rated voltage | 3.6 V |
| Charge cut-off voltage | 4.2 V |
| Discharge cut-off voltage | 2.5 V |
| Quality | ±46.0 g |
| Abuse Condition | Charged State | Experimental Project |
|---|---|---|
| Heating | 0% SOC | Gas analysis experiment |
| 25% SOC | Infrared imaging | |
| 50% SOC | SEM-EDS | |
| 75% SOC | XRD | |
| 100% SOC | Industry CT |
| SOC | Total Number of Tests | Number of Effective Residues | Effective Percentage |
|---|---|---|---|
| 0% SOC | 25 | 10 | 40% |
| 25% SOC | 20 | 17 | 85% |
| 50% SOC | 30 | 15 | 50% |
| 75% SOC | 36 | 13 | 36.1% |
| 100% SOC | 42 | 12 | 28.5% |
| SOC | Temperature Variation in Eruption Gas in Thermal Images During Thermal Runaway | Temperature Change in Thermal Images After Thermal Runaway |
|---|---|---|
| 0% SOC | 0–96.8 | 0–261.6 |
| 25% SOC | 0–284.6 | 0–327.1 |
| 50% SOC | 0–565.8 | 0–672.1 |
| 75% SOC | 0–264.7 | 0–634.8 |
| 100% SOC | 0–514.7 | 0–711.3 |
| Trigger Mode | Battery Status | 0% SOC | 25% SOC | 50% SOC | 75% SOC | 100% SOC |
|---|---|---|---|---|---|---|
| Heating | The original battery | 45.77 g | 45.77 g | 45.71 g | 45.76 g | 45.77 g |
| Thermal runaway 1 | 37.15 g | 35.04 g | 32.43 g | 22.76 g | 19.62 g | |
| Thermal runaway 2 | 40.41 g | 35.11 g | 32.00 g | 21.10 g | 20.72 g | |
| Thermal runaway 3 | 39.06 g | 35.20 g | 26.83 g | 23.01 g | 19.81 g |
| Charged State | Temperature Measurement Point | |||||
|---|---|---|---|---|---|---|
| TC1 | TC2 | TC3 | ||||
| Time | Temperature (°C) | Time | Temperature (°C) | Time | Temperature (°C) | |
| 0% SOC | 417 s | 205.0 ± 0.5 | 418 s | 200.0 ± 0.5 | 416 s | 170.4 ± 0.5 |
| 25% SOC | 378 s | 227.6 ± 0.5 | 378 s | 235.6 ± 0.5 | 376 s | 245.3 ± 0.5 |
| 50% SOC | 355 s | 214.7 ± 0.5 | 356 s | 200.6 ± 0.5 | 355 s | 194.5 ± 0.5 |
| 75% SOC | 296 s | 175.1 ± 0.5 | 295 s | 193.5 ± 0.5 | 296 s | 174.0 ± 0.5 |
| 100% SOC | 255 s | 281.5 ± 0.5 | 256 s | 290.7 ± 0.5 | 256 s | 259.1 ± 0.5 |
| SOC | Temperature Measurement Point | |||||
|---|---|---|---|---|---|---|
| TC1 | TC2 | TC3 | ||||
| Time | Temperature (°C) | Time | Temperature (°C) | Time | Temperature (°C) | |
| 0% SOC | 428 s | 630.0 ± 0.5 | 429 s | 592.5 ± 0.5 | 432 s | 610.3 ± 0.5 |
| 25% SOC | 395 s | 699.8 ± 0.5 | 395 s | 714.3 ± 0.5 | 389 s | 704.9 ± 0.5 |
| 50% SOC | 370 s | 759.0 ± 0.5 | 369 s | 755.3 ± 0.5 | 366 s | 651.8 ± 0.5 |
| 75% SOC | 305 s | 837.5 ± 0.5 | 309 s | 749.4 ± 0.5 | 307 s | 731.2 ± 0.5 |
| 100% SOC | 257 s | 1082.1 ± 0.5 | 260 s | 870.1 ± 0.5 | 269 s | 786.0 ± 0.5 |
| 0% SOC | 25% SOC | 50% SOC | 75% SOC | 100% SOC | |
|---|---|---|---|---|---|
| Lower limit of combustible limit vol% | 21 | 38 | 39 | 22 | 17 |
| Upper limit of combustible limit vol% | 95 | 196 | 188 | 116 | 84 |
| Combustible concentration range Vol% | 74 | 158 | 149 | 94 | 67 |
| Gas Type | SOC | ||||
|---|---|---|---|---|---|
| 0% | 25% | 50% | 75% | 100% | |
| CO | + | + | + | + | + |
| CO2 | + | + | + | + | + |
| HF | + | + | + | + | + |
| CH4 | + | + | + | + | + |
| C2H2 | − | + | + | + | + |
| C2H6 | − | − | − | + | + |
| C3H6 | − | − | + | + | + |
| C3H8 | + | + | + | + | + |
Disclaimer/Publisher’s Note: The statements, opinions and data contained in all publications are solely those of the individual author(s) and contributor(s) and not of MDPI and/or the editor(s). MDPI and/or the editor(s) disclaim responsibility for any injury to people or property resulting from any ideas, methods, instructions or products referred to in the content. |
© 2025 by the authors. Licensee MDPI, Basel, Switzerland. This article is an open access article distributed under the terms and conditions of the Creative Commons Attribution (CC BY) license (https://creativecommons.org/licenses/by/4.0/).
Share and Cite
Zhao, J.; Xing, K.; Jiang, X.; Shu, C.-M.; Sun, X. Thermal Runaway Critical Threshold and Gas Release Safety Boundary of 18,650 Lithium-Ion Battery in State of Charge. Processes 2025, 13, 2175. https://doi.org/10.3390/pr13072175
Zhao J, Xing K, Jiang X, Shu C-M, Sun X. Thermal Runaway Critical Threshold and Gas Release Safety Boundary of 18,650 Lithium-Ion Battery in State of Charge. Processes. 2025; 13(7):2175. https://doi.org/10.3390/pr13072175
Chicago/Turabian StyleZhao, Jingyu, Kexin Xing, Xinrong Jiang, Chi-Min Shu, and Xiangrong Sun. 2025. "Thermal Runaway Critical Threshold and Gas Release Safety Boundary of 18,650 Lithium-Ion Battery in State of Charge" Processes 13, no. 7: 2175. https://doi.org/10.3390/pr13072175
APA StyleZhao, J., Xing, K., Jiang, X., Shu, C.-M., & Sun, X. (2025). Thermal Runaway Critical Threshold and Gas Release Safety Boundary of 18,650 Lithium-Ion Battery in State of Charge. Processes, 13(7), 2175. https://doi.org/10.3390/pr13072175