Article

Research on the Damage Evolution Law of Branch Wellbore Based on Damage Mechanics

1
Institute of Ocean Engineering and Technology, Ocean College, Zhejiang University, Zhoushan 316021, China
2
Petroleum Engineering Technology Research Institute, Sinopec Shengli Oilfield Company, Dongying 257001, China
3
Shengli Oilfield Branch of Sinopec, Dongying 257001, China
4
School of Petroleum Engineering, China University of Petroleum (East China), Qingdao 266580, China
*
Author to whom correspondence should be addressed.
Processes 2025, 13(7), 2172; https://doi.org/10.3390/pr13072172
Submission received: 13 May 2025 / Revised: 12 June 2025 / Accepted: 19 June 2025 / Published: 8 July 2025

Abstract

Multilateral wells can effectively develop complex reservoirs at a lower cost, which, in turn, enhances the overall efficiency of oilfield exploitation. However, drilling branch wells from the main wellbore can disrupt the surrounding formation stresses, leading to secondary stress concentration at the junctions, which, in turn, causes wellbore instability. This study established a coupled analysis model for wellbore stability in branch wells by integrating seepage, stress, and damage. The model explained the instability mechanisms of branch wellbores under multi-physics coupling conditions. The results showed that during drilling, the thin, interwall section of branch wells had weak resistance to external loads, with significant stress concentration and a maximum damage factor of 0.267, making it prone to instability. As drilling time progressed, fractures in the surrounding rock mass of the wellbore continuously formed, propagated, and interconnected, causing a sharp increase in the permeability of the damaged area. The seepage direction of drilling fluid in the wellbore tended towards the severely damaged interwall section, leading to a rapid increase in pore pressure there. With increasing distance from the interwall tip, the resistance to external loads strengthened, and the formation damage factor, permeability, pore pressure, and equivalent plastic strain all gradually decreased. When the drilling fluid density increased from 1.0 g/cm3 to 1.5 g/cm3, the maximum equivalent plastic strain around the wellbore decreased from 0.041 to 0.014, a reduction of 65.8%, indicating that appropriately increasing the drilling fluid density can effectively reduce the risk of wellbore instability.

1. Introduction

Branch wells refer to wells drilled from a main wellbore that can penetrate multiple oil and gas reservoirs of varying thicknesses in different directions. As an extension and a development of horizontal well technology, they can effectively exploit complex oil and gas reservoirs at a lower cost and improve the comprehensive development efficiency of oil and gas fields [1,2,3,4,5,6,7].
With the widespread application of branch well technology and the increasing depth of drilling, the stability of the wellbore junctions in branch wells has become a key factor affecting the successful drilling of branch wells. Drilling branch wells from the main wellbore disturbs the surrounding formation stresses, altering the stress distribution at the junctions. The redistribution of stresses in the formation leads to secondary stress concentration at the branch well junctions, narrowing the safe drilling fluid density window and causing wellbore instability [8]. Therefore, the drilling technology for branch wells demands stricter wellbore stability. Failure of the junctions in branch wells is a critical issue, and improper handling can lead to well abandonment. To ensure successful drilling operations in branch wells, it is essential to maintain the stability of the wellbore junctions [8,9].
Regarding the wellbore instability issues in branch wells, Goshtasbi et al. [10] analyzed the stability of multilateral wellbores using the finite difference method, showing that the mud pressure required to stabilize the junction was much higher than that needed for the branch and main wellbores. Goshtasbi et al. [11] assessed the formation stresses, magnitudes, and distributions in branch wells, as well as horizontal trajectory factors, using FLAC3D numerical calculations. The results indicated that as the inclination angle increased, the branch well junctions became more stable, and the maximum principal stress direction became the optimal direction for all considered stress states. Mohamad et al. [12] investigated the wellbore stability of open-hole branch wells using the hyperbolic hardening Mohr–Coulomb failure criterion, finding that a failure zone appeared at the intersection of the main and branch wellbores, with a significantly increased collapse risk near the interwall tip. Wu et al. [13] established a fluid–solid coupling model for the junction of branch wells based on rock mechanics, considering anisotropic formation stresses on the basis of Darcy’s steady-state seepage. Wei et al. [14], based on fluid–solid coupling theory and considering permeability changes, simulated that the permeability of the surrounding rock mass of the wellbore changed significantly at the bottom of the branch well. Xu et al. [15] established a planar dual-branch well model based on the Drucker–Prager criterion, finding that the maximum von Mises stress first decreased and then increased with the increase in the branch well inclination angle and increased with the increase in the angle between the branch well plane and the maximum horizontal formation stress. Hoang et al. [16] developed a branch well model that can solve complex three-dimensional anisotropic stress states, showing that the inclination and azimuth angles of the branch well had a crucial impact on wellbore stability. Zhang et al. [17] established a three-dimensional elastoplastic model for wellbore stability of the formation–cement sheath–casing–branch wellbore using the finite element software ABAQUS 2022 to study the influence of branch well orientation on branch well stability. Oyedokun [18] proposed a new framework that coupled a void growth model with an elastoplastic material model. By considering anti-plane shear stress, this framework achieved simultaneous prediction of the borehole plastic zone and critical collapse pressure. The model’s predicted results showed a high degree of agreement with field data, outperforming the traditional NYZA method. Haghgouei et al. [19], using a customized poro-elastoplastic damage model, revealed that lateral vibrations of the drill string significantly increased the risk of borehole failure. They emphasized that determining the optimal mud pressure requires balancing static and dynamic loads, providing key insights for mud pressure optimization in drilling engineering. Through drop-weight impact tests and a three-dimensional dynamic damage model, Zhang et al. [20] found that reaming conditions facilitated stress concentration and rock fragmentation and that borehole wall damage was minimized at specific reaming ratios, offering theoretical support for bit structure design and construction parameter optimization in practical engineering. Through multiple groups of experiments and a fluid–solid coupling model, Han Lei [21] clarified the influence mechanism of shale hydration on borehole stability, proposing that solving borehole instability requires enhancing the plugging and inhibitory properties of drilling fluids, providing important references for drilling engineering in shale reservoirs. Aiming at fractured coal seams, Ma Chao [22] constructed a planar homogeneous continuity numerical model. Combined with experiments, he obtained a permeability evolution equation, pointed out the critical role of drilling fluid plugging in borehole stability, and obtained the minimum drilling fluid density to prevent borehole collapse.
The key to the instability of branch wellbore lies in the connection section between the branch borehole and the main borehole, which is generally located in sandstone formations. Sandstone is typically a formation without strong anisotropy, so the material is assumed to be a homogeneous and isotropic material. Meanwhile, many researchers also assume the formation to be a homogeneous and isotropic material when studying borehole stability. Ghassemi & Zhang [23] developed a transient virtual stress boundary element method for isotropic porous thermoelastic media. The authors validated the model using homogeneous granite formations, assuming uniform distribution of elastic properties. Zhou & Ghassemi [24] adopted a homogeneous model for chemo-poro-thermoelastic shale to simplify the coupling process. The isotropic parameters of granite in Ghassemi & Zhang’s experiment showed that isotropy was a reasonable approximation for many sedimentary and igneous rocks in small-scale analyses. Zhou & Ghassemi pointed out that the isotropy assumption facilitated analytical solutions, especially when formation anisotropy had minimal impact on wellbore stability. They compared the isotropic model with analytical results to verify its effectiveness.
Since the gradual development of microcracks in rocks under stress is the fundamental cause of rock damage and failure, it is necessary to consider rock damage in the drilling process of branch wells. However, current research on the stability of multilateral boreholes is scarce. The existing branch wellbore stability models generally only consider the stress concentration around the wellbore caused by the branch wells, without considering the damage evolution process induced by the propagation of rock micro-cracks. Additionally, they ignore the impact of damage on permeability, leading to an insufficiently in-depth analysis of the instability mechanism of branch wellbores. This paper, based on the theory of continuous damage mechanics for rocks, introduced plastic damage of rock materials into fluid–solid coupling and established a multi-physical field coupling model of seepage–stress–damage. This model can simulate the initiation, propagation, and penetration processes of micro-cracks in the multilateral borehole, revealing the damage evolution mechanism of the borehole. A permeability evolution equation with damage variables was proposed to quantitatively describe the influence of damage on permeability, accurately predicting the seepage direction of drilling fluids and the distribution of pore pressure. By correlating damage variables with cohesion degradation, the damage-considered Mohr–Coulomb failure criterion was improved, which more realistically reflected the strength degradation process of rocks and provided a more reliable theoretical basis for borehole stability analysis.

2. Multiphysics Coupling Mathematical Model for Wellbore Stability

2.1. Effective Stress Principle

According to Biot’s effective stress principle, the deformation and failure of rocks are related only to the effective stress, which can be expressed as follows [25]:
σ ¯ i j = σ i j + α δ i j χ p p + 1 χ p g
where σ i j is the total stress; σ ¯ i j is the effective stress; p g is the pore gas pressure; p p is the pore fluid pressure; δ i j is the Kronecker delta; and χ is related to the surface tension between saturated soil and liquid–gas, and when the soil is saturated, χ = 1; α is the Biot coefficient, usually close to 1, and its expression is as follows:
α = 1 K V K S
where K S is the compression modulus of the solid particles, and K V is the bulk compression modulus of the rock.
Since χ is a parameter related to saturation and surface tension, and experimental data is difficult to obtain, it can be assumed that χ = s , and the expression for effective stress can be obtained as follows [21]:
σ ¯ i j = σ i j + δ i j s w p p + 1 s w p g = σ i j + δ i j p ¯
where p ¯ is the average value of pore gas pressure and pore water pressure, and s w is the pore water saturation.

2.2. Stress Equilibrium Equation

The stress equilibrium equation for porous media uses the virtual work principle, that is, at a certain moment, taking a control body in the formation V , the virtual work of the rock–soil body is equal to the virtual work produced by the forces acting on the control body, and its expression is as follows [21]:
V δ ε T d σ d V V δ u T d f d V S δ u T d t d S = 0
where δ u is the virtual displacement, δ ε is the virtual strain, t is the surface force, and f is the body force.
The constitutive relationship of porous media can be expressed as follows:
d σ ¯ = D p d ε d ε p
where D p is the elastoplastic matrix, and d ε p represents the compression deformation of rock skeleton particles caused by changes in pore pressure.
d ε p = m d p ¯ 3 K S
where m = 1,1 , 1,0 , 0,0 T .

2.3. Seepage Continuity Equation

Taking any volume of rock, according to the principle of mass conservation, the change in the mass of fluid in the rock within a unit time d t is equal to the difference between the mass of fluid entering and leaving the volume during that time. The seepage of fluid in the formation is described using Darcy’s law, and the continuity equation for rock seepage can be obtained as follows [21]:
s w m T m T D p 3 K S d ε d t T k 0 k r p p ρ w g + ζ n + n s w K w + s w 1 n 3 K S m T D p m 3 K S 2 s w + p p ζ d p p d t = 0
where k 0 is the initial permeability tensor multiplied by the formation fluid density; k r is the relative permeability, which is a function related to formation stress, strain, and damage variables; K S is the compression modulus of the rock skeleton particles; K w is the bulk modulus of the formation fluid; ϕ is the porosity of the formation; and g is the gravitational acceleration vector.

2.4. Elastoplastic Damage Theory

According to previous research, the Mohr–Coulomb failure criterion is well-suited for rock materials, and its results are considered reliable. For rock materials that have undergone damage, the microstructure of the rock changes, and its macroscopic properties also change accordingly. Therefore, the damage state of the rock can be evaluated by some mechanical property parameters. During the damage process, the effective shear strength parameters of the rock, cohesion C , and internal friction angle φ change. Under damage, the Mohr–Coulomb criterion for describing rock failure can be expressed as follows [21]:
τ n 1 D = C + σ n + D p p 1 D t a n φ
where p p is the pore water pressure, σ n is the effective stress on the failure plane, τ n is the effective shear strength on the failure plane, and D is the damage variable, ranging from 0 to 1.
Some scholars have experimentally found that damage affects the cohesion of rock but not the internal friction angle, so the change in internal friction angle is ignored in damage analysis [22].
The cohesion of the rock, when undamaged, is C m , and the cohesion when the damage is at maximum, that is, the residual cohesion, is C r . The expression for cohesion after damage is as follows [26]:
C = C m C m C r D η
where C m is the maximum cohesion value, and η is a material parameter 0 η 1 .

2.5. Damage Evolution Equation

Under coupled action, when the stress and pore pressure in the formation exceed the shear strength of the rock, the rock will undergo plastic deformation. The equivalent plastic strain can be specifically expressed as follows:
ε ¯ p = 2 3 ε p 1 ε p 2 2 + ε p 2 ε p 3 2 + ε p 3 ε p 1 2
where ε p 1 , ε p 2 , and ε p 3 represent the principal plastic strains in three directions, respectively.
The relationship between the damage variable of rock and the equivalent plastic strain can be represented by a first-order exponential decay function. The normalized equivalent plastic strain of rock can be obtained as follows [21]:
D = A 0 e x p ε p n a + B 0
A 0 = 1 e x p 1 a 1
B 0 = 1 e x p 1 a 1
where a is a material parameter.
ε p n is the normalized equivalent plastic strain, and its expression is as follows:
ε p n = ε p ε p e
where ε p is the equivalent plastic strain, and ε p e is the maximum equivalent plastic strain of the formation when the rock cohesion is reduced to the residual cohesion.

2.6. Permeability Evolution Equation

According to previous research [27,28,29,30], after the loading load on rock specimens exceeds the peak strength, the permeability of rock will increase sharply. By introducing a coefficient m to describe the phenomenon of sudden increase in permeability during rock damage, assuming that the permeability of rock when completely damaged is higher than that of undamaged rock by m orders of magnitude, the permeability evolution equation of the formation can be established as follows [26]:
k D = k a 1 0 m β
where k a is the permeability of the rock when undamaged, and β is a function of the damage variable. The relationship between β and the damage variable satisfies the following functional relationship:
β = A ¯ e x p D λ + B ¯
where λ is a material parameter; A ¯ = 1 e x p 1 λ 1 ; and B ¯ = 1 e x p 1 λ 1 .
During the elastic deformation of rock, the main form is compressive deformation. As the normal stress increases, the rock skeleton particles move, the porosity decreases, and the permeability becomes smaller. After the rock enters the yielding and failure stage, internal cracks begin to form. As the cracks propagate and interconnect, the permeability of the rock increases sharply in a very short time. The porosity and permeability evolution equations of the formation under different stress states can be expressed as the following [31]:
ϕ d = 1 1 ϕ 0 ε V , D = 0 ϕ 0 + 0.16 D 3 2 , D > 0
k D = k a 1 ϕ 1 + ε V 3 1 ϕ 0 ϕ 0 1 + ε V 1 3 3 , D = 0 k a 1 0 m ( A ¯ e x p D λ + B ¯ ) , D > 0

2.7. Model Validation

In order to verify the accuracy and reliability of the elastoplastic damage mathematical model, a verification model was established based on the test results of Jia Shanpo [26]. The elastic modulus of the rock was 300 MPa, the Poisson’s ratio was 0.125, the cohesion was 0.3 MPa, the internal friction angle was 18°, the porosity was 0.39, and the permeability coefficient was 3 × 10⁻¹² m·s−1. The geometric model of the verification model is shown in Figure 1, with a radius of 12.5 mm and a height of 50 mm. The side and upper and lower surfaces of the model were all subjected to a confining pressure of 2.5 MPa, a vertical load was applied to the upper surface of the model, and the displacements in three directions were constrained on the lower surface.
Figure 2 shows the comparison diagram of the stress–strain curve of the rock under triaxial compression. It can be seen that the stress–strain curve of the verification model showed a strain-softening phenomenon after the peak, which met the expected results, and the two curves fit well before and after the peak. It can be seen that the fitting condition of the stress–strain curve was good. The numerical simulation results showed that the established elastoplastic damage model was reliable.

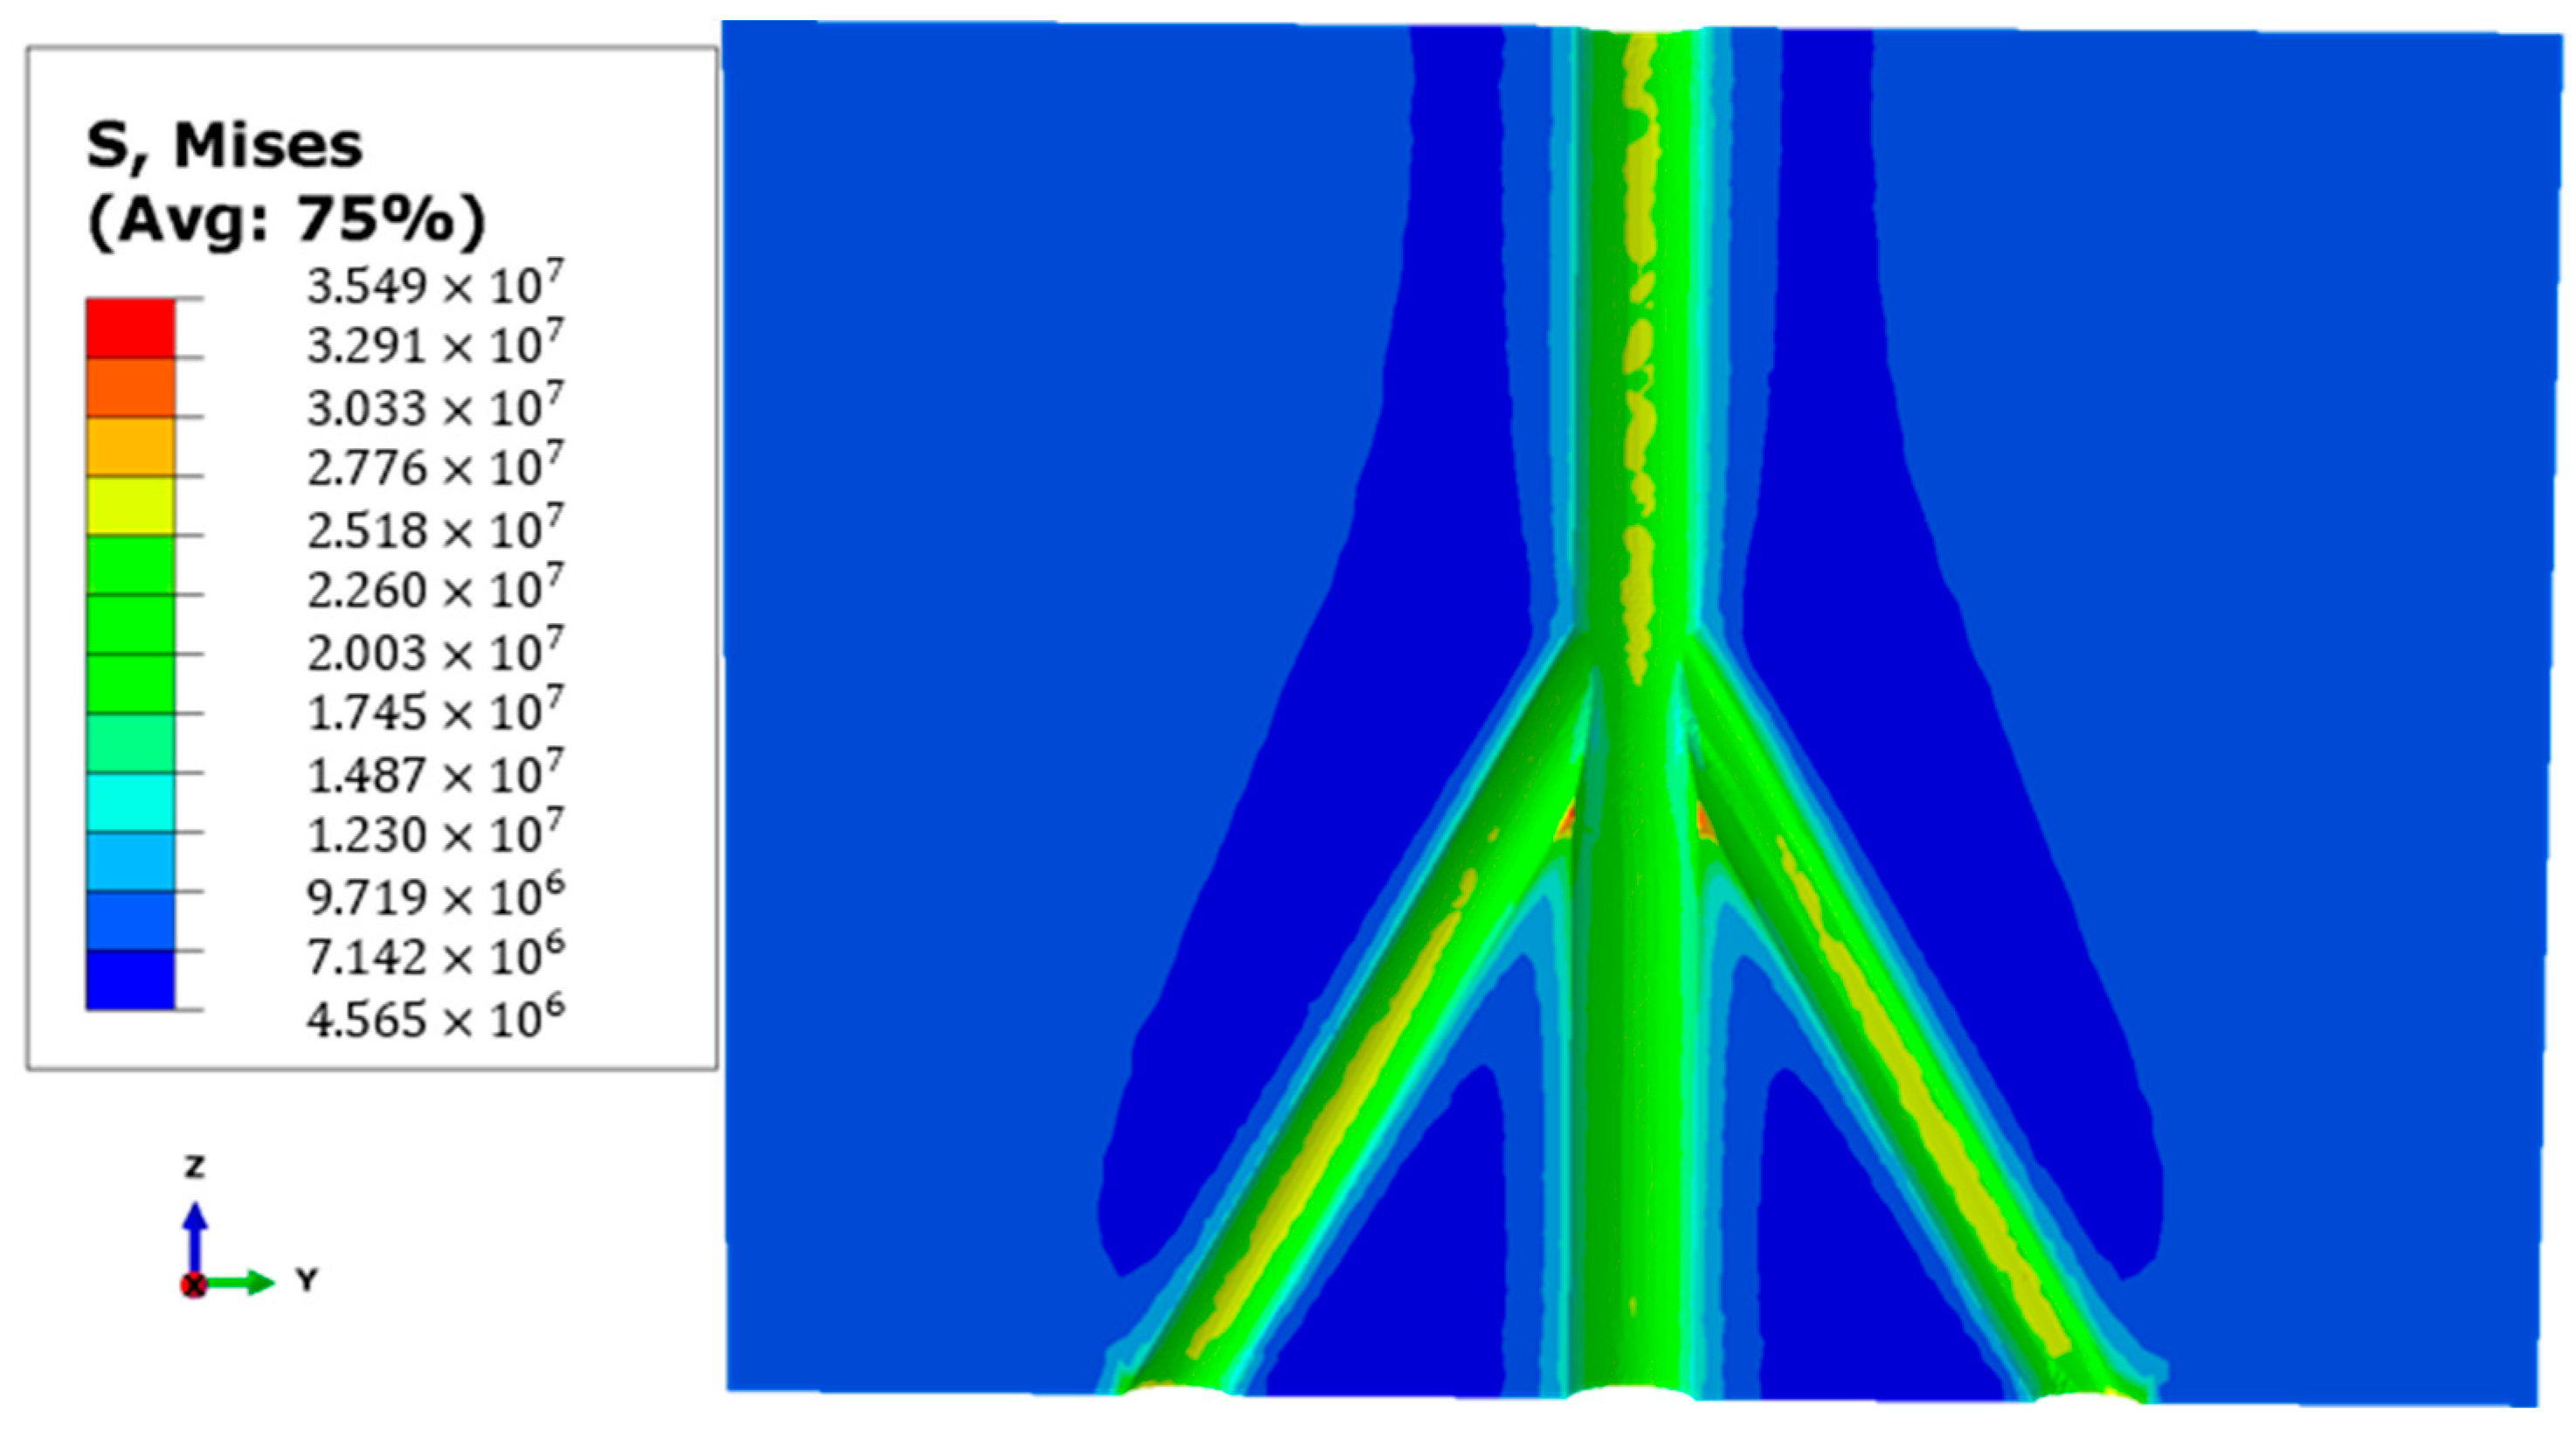
3. Instability Mechanism of Wellbore Under Multiphysics Coupling Conditions

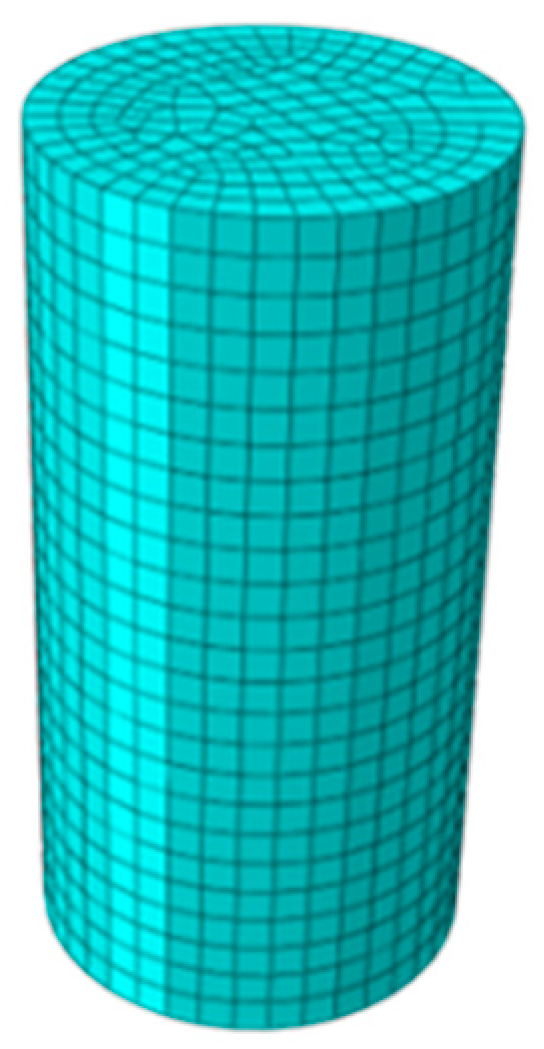
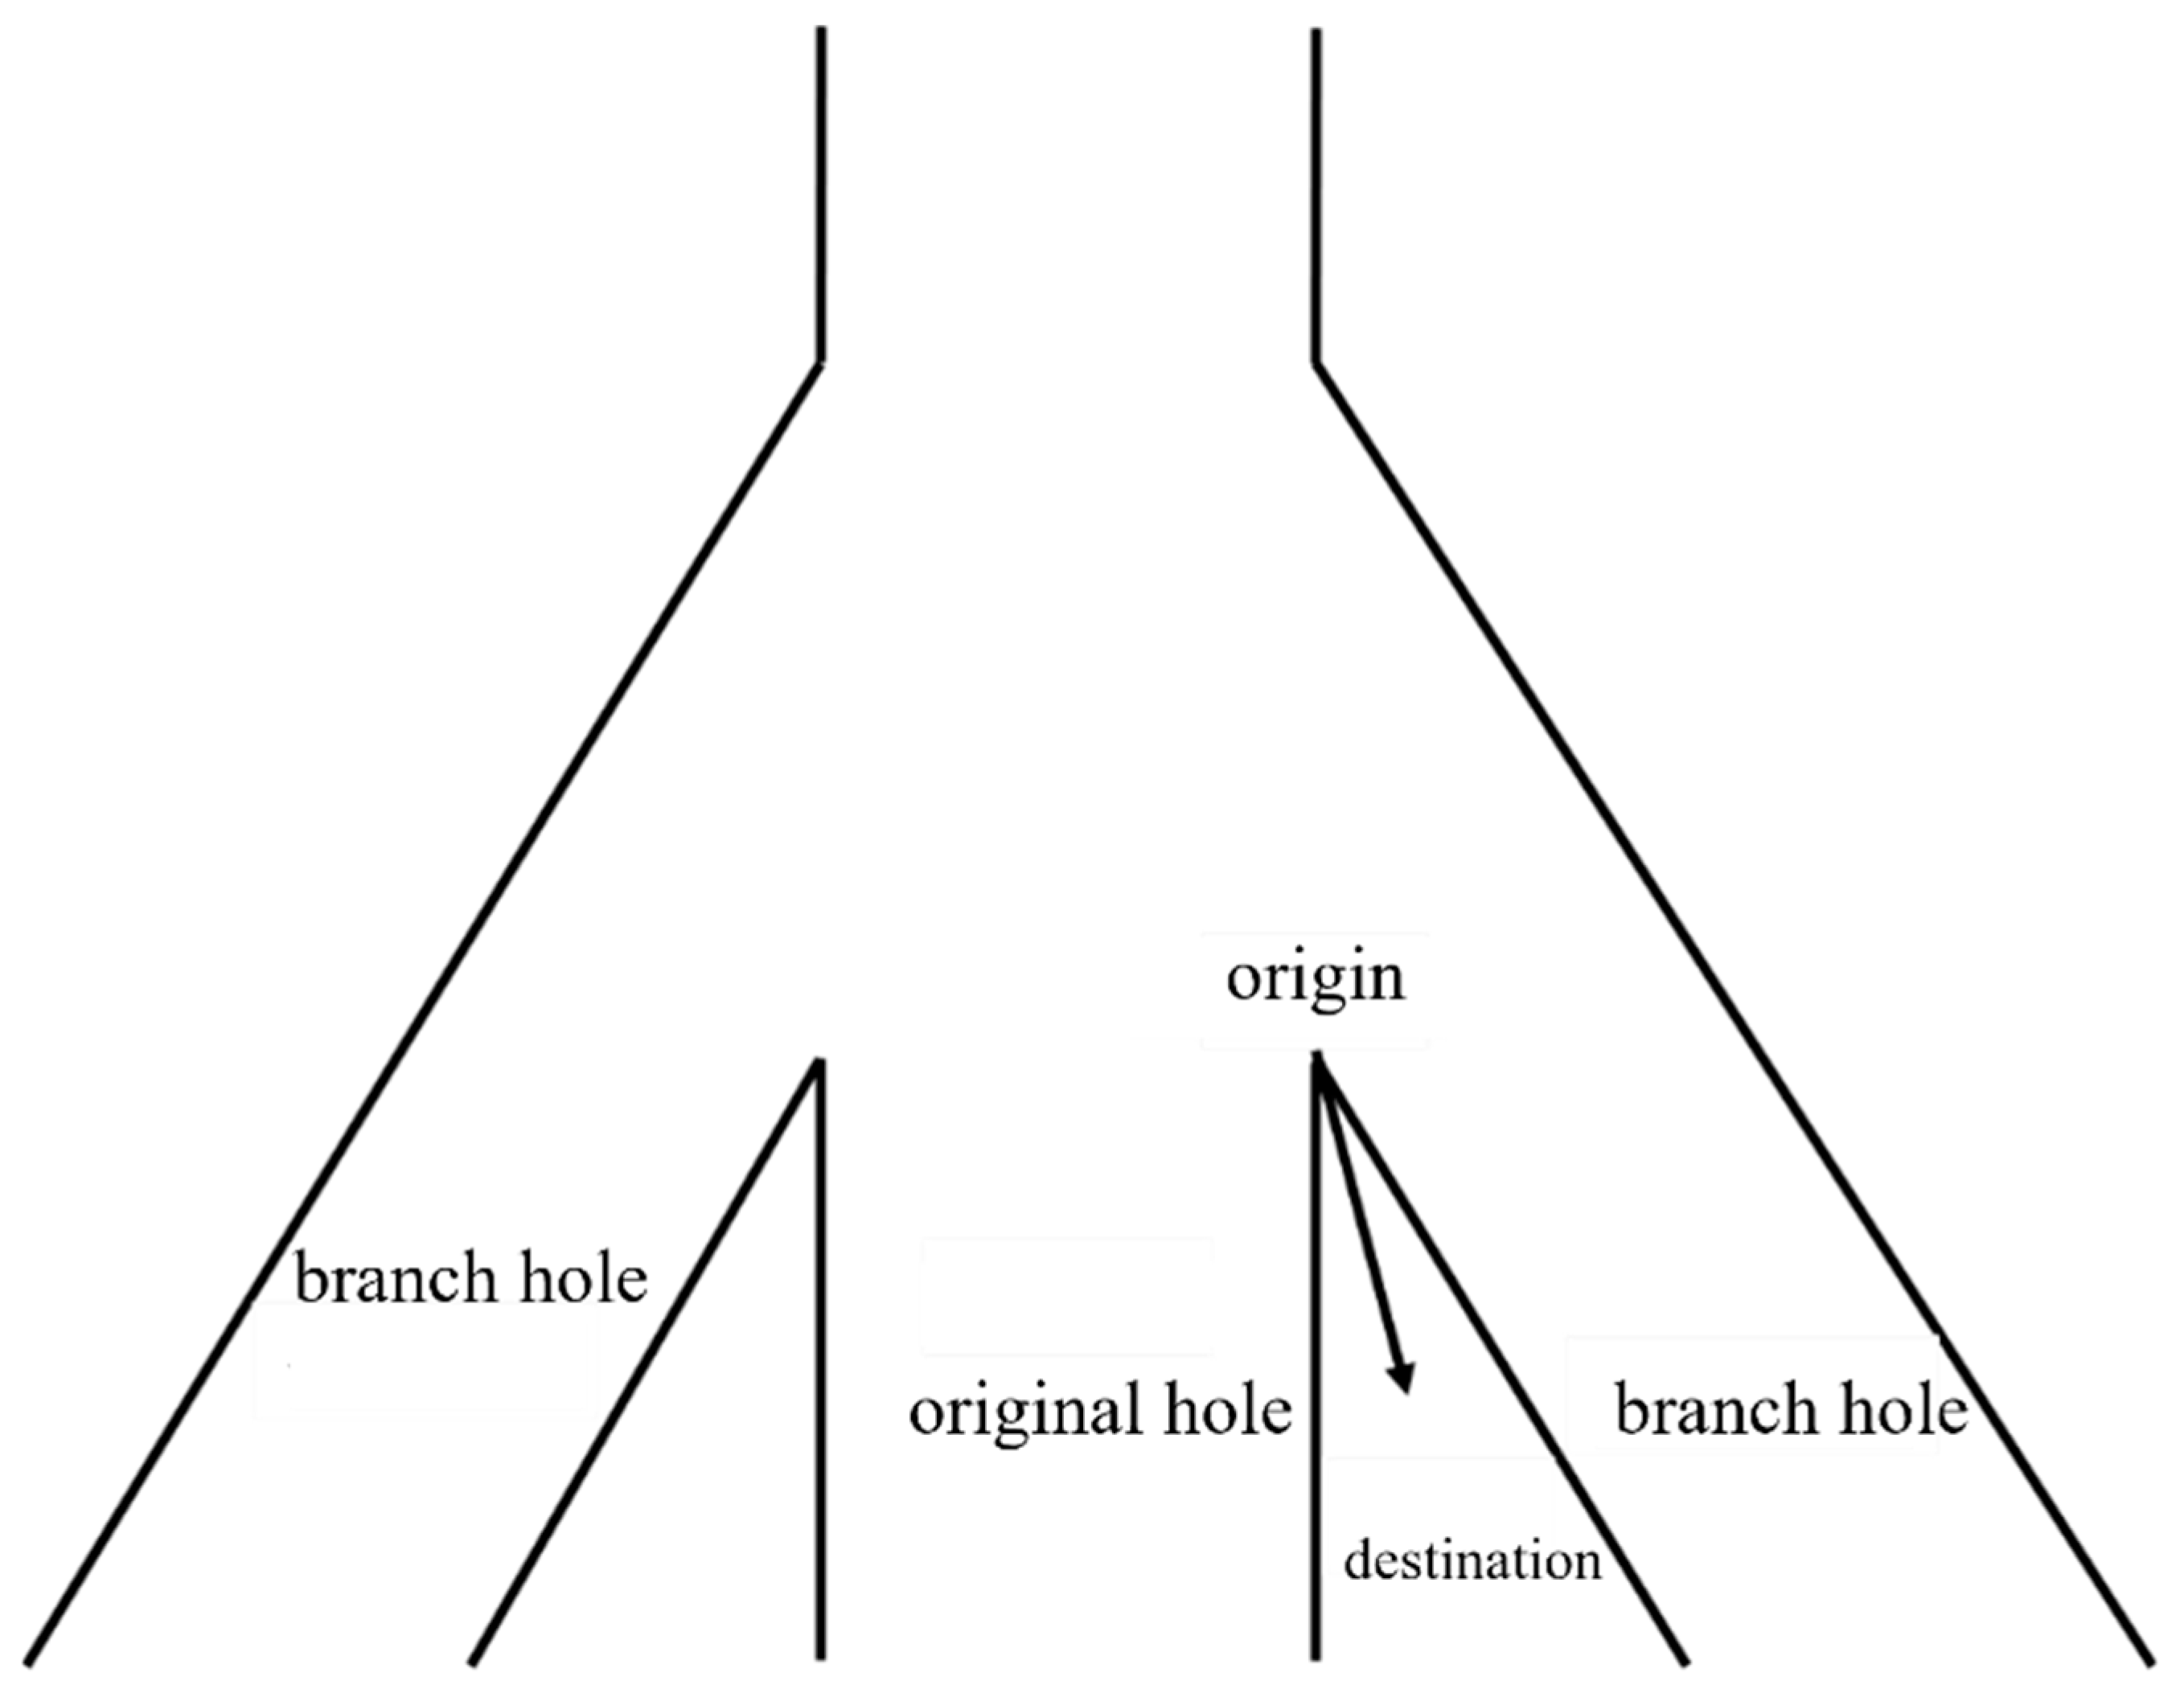
3.1. Geometric Model

The stress state of the rock around the wellbore is very complex and is affected by factors such as changes in wellbore temperature and erosion by drilling fluid during drilling. Therefore, the following basic assumptions were made when establishing the model: (1) The rock layer was homogeneous and isotropic; (2) the temperature was kept constant, considering the stress damage of the rock but not the chemical action of the fluid; (3) the fluid was a stable Darcy seepage; and (4) the main wellbore and branch wellbore were in the same plane, and the branch wellbore was symmetrical about the main wellbore.
Combining the permeability evolution equation and the elastoplastic damage constitutive model, a multi-physics coupling analysis model for seepage–stress–damage was established using finite element analysis software ABAQUS 2022 to study the stability of branch wellbores. A three-dimensional symmetrical wellbore stability analysis model was established. The diameter of the main wellbore was 0.28 m, and the diameter of the branch wellbore was 0.20 m. In rock mechanics, when a tool is used to excavate a part of the underground rock mass to release the load, the influence range of the re-distributed formation stress on the surrounding rock mass of the wellbore is about three times the size of the wellbore and rock mass interaction surface contour [32]. Therefore, the entire model adopted a size of 5 m × 2 m × 4 m, and under this size, the influence of boundary effects on the simulation results can be ignored. The three-dimensional model used a triangular tetrahedral mesh, and the branch wellbore connection section was mesh-refined to improve the accuracy of the calculation results. The model consisted of 35,069 meshes, and the mesh element type was C3D20RP, which was suitable for the seepage–stress coupling model.
The model was geometrically symmetric in structure. According to the principle of symmetry, the model can be simplified by taking half of it as the object of study. This approach reflected the accuracy of the model calculation results and reduced the computational load and redundancy of the simulation process [33].
The reservoir parameters used in the model analysis are shown in Table 1 [34].

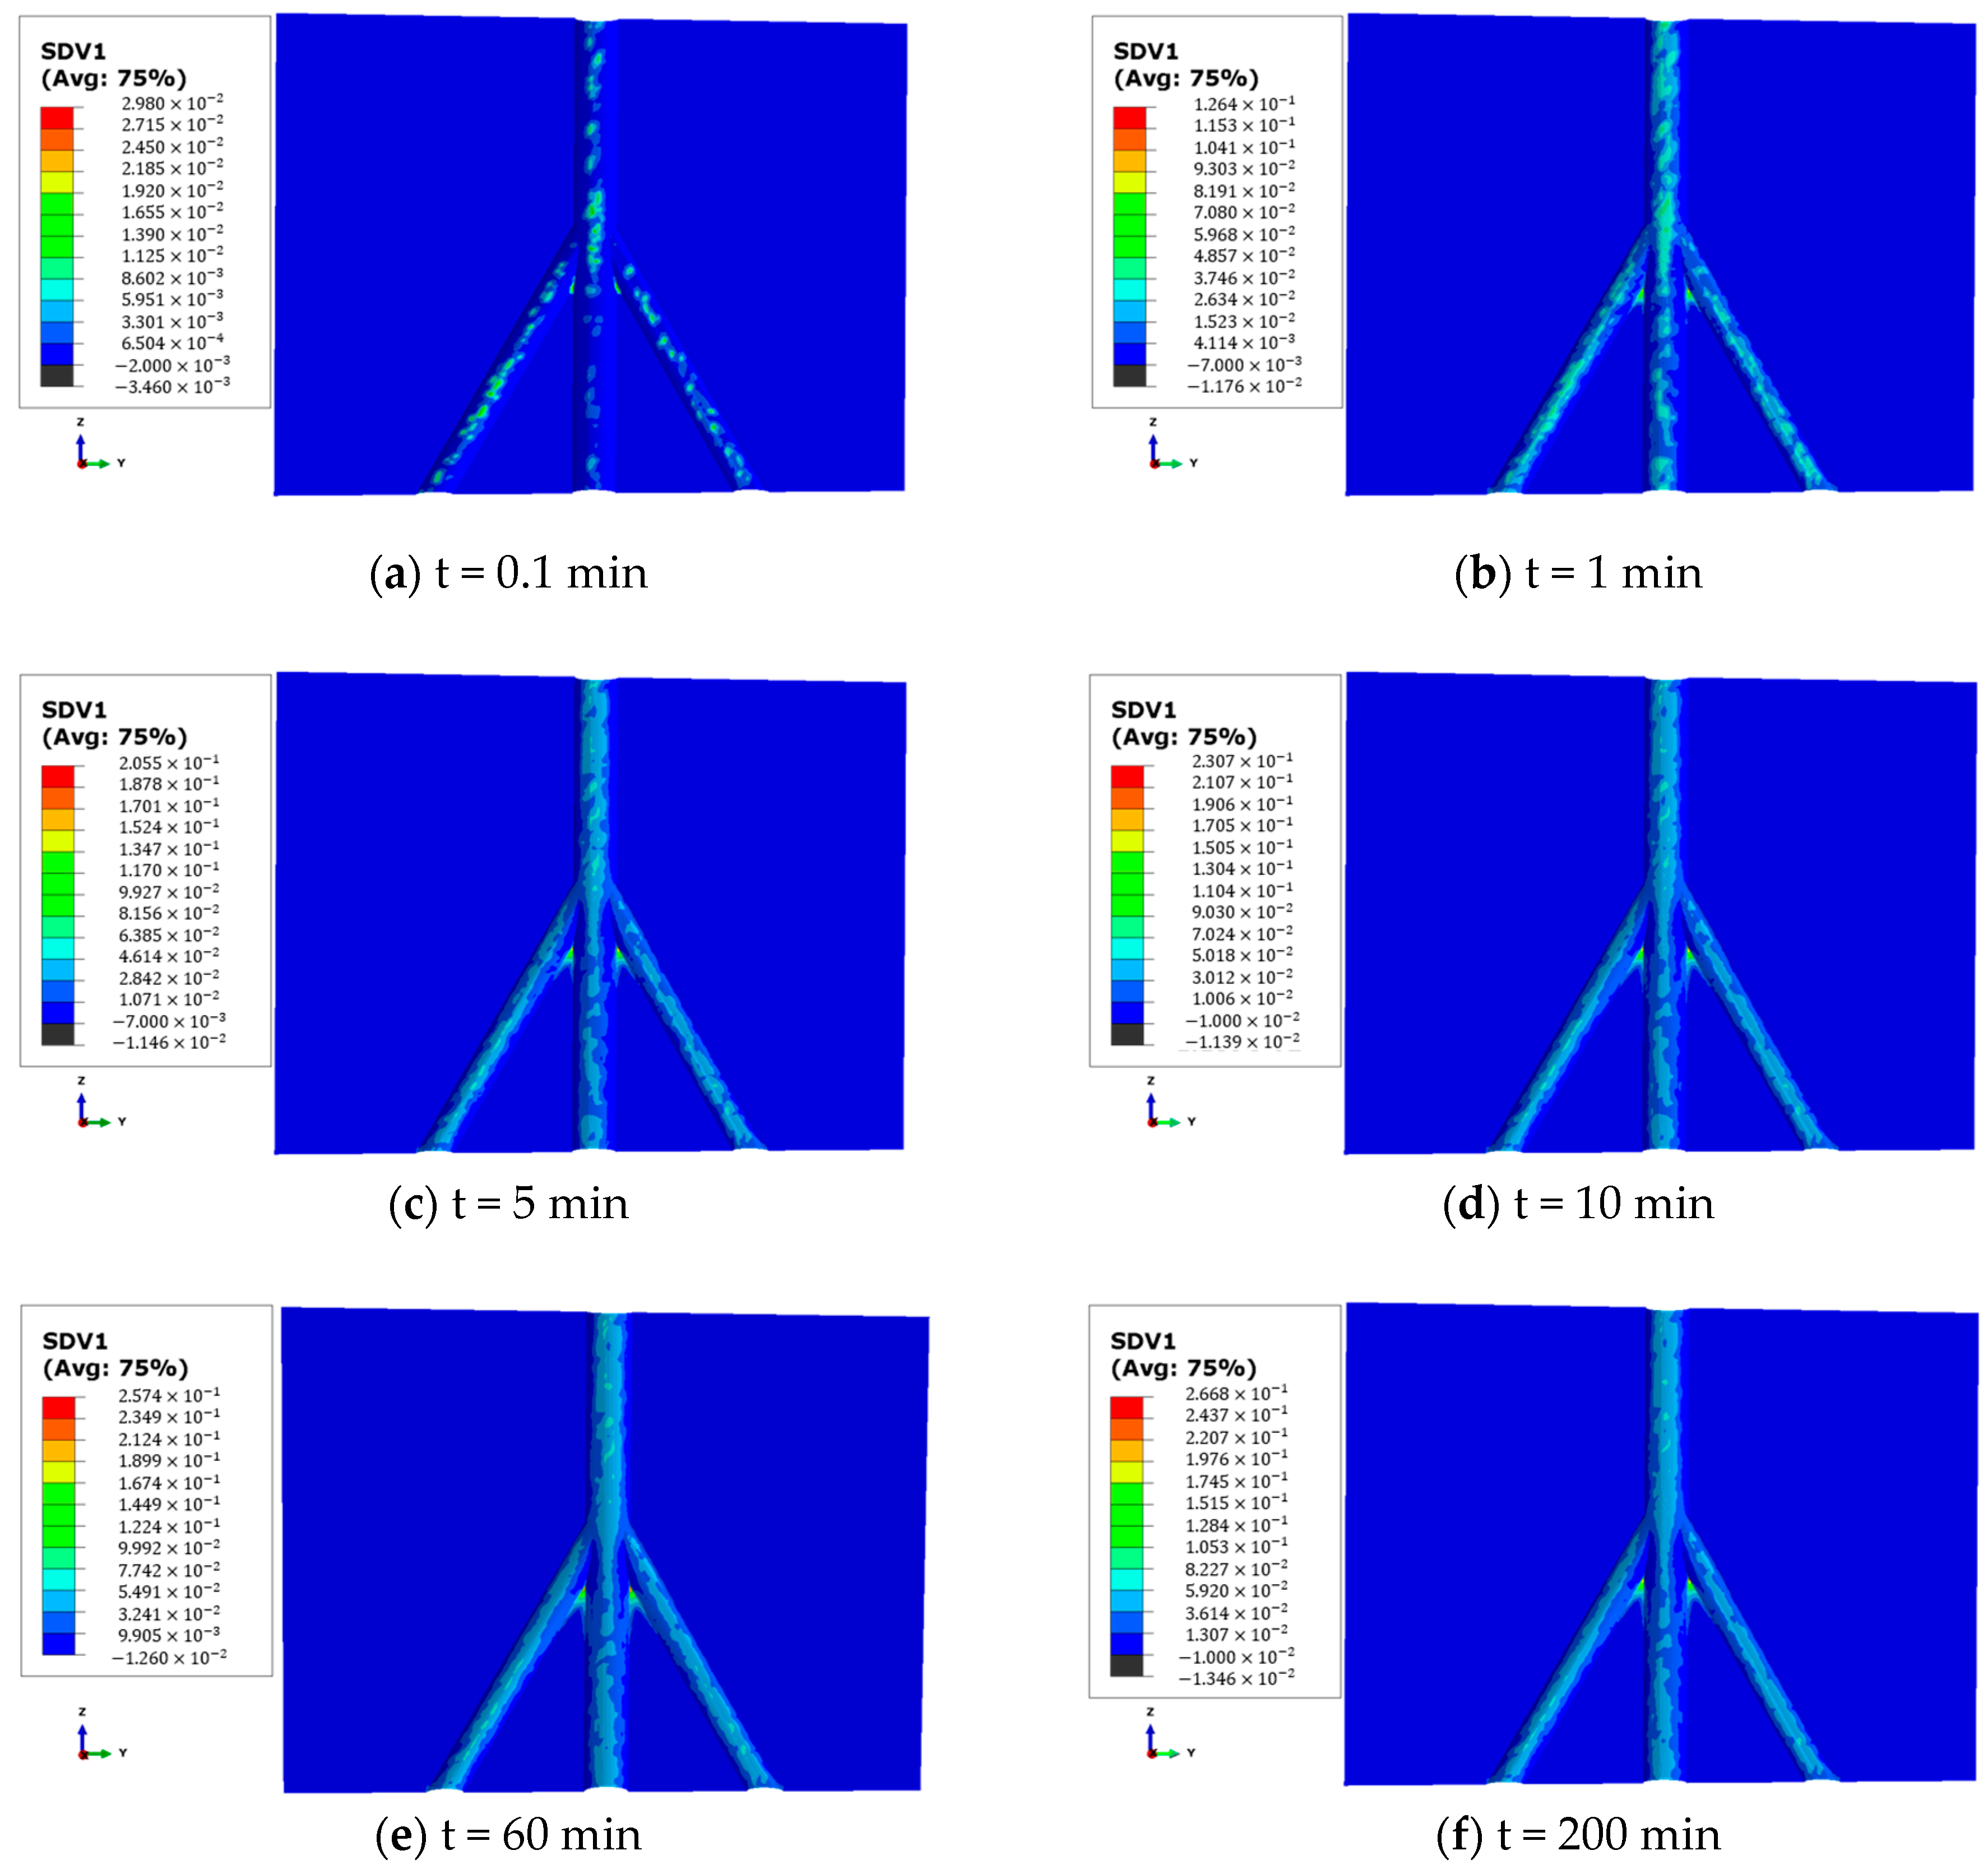
3.2. Evolution of Formation Damage Around Branch Wellbores

Figure 3 shows the Mises stress distribution cloud chart of the branch well when the drilling fluid density was 1.1 g/cm3. It can be seen from the figure that the high-stress area was mainly concentrated near the tip of the interwall section of the branch well. This was because the wellbore thickness at the interwall tip was relatively thin, and the rock’s resistance to external loads was relatively weak, making it prone to stress concentration. Figure 4 shows the evolution of the damage area around the sandstone wellbore with time when the drilling fluid density was 1.1 g/cm3. After the wellbore was drilled, affected by the secondary stress concentration effect, the fractures in the surrounding rock mass of the wellbore continued to expand, forming a certain area of damage zone. Among them, the maximum damage factor was 0.267, located at the interwall tip, indicating that the fracture development degree at the interwall tip was the largest, the stress concentration phenomenon was the most serious, and the instability risk was the highest. It can be seen from Figure 4a–f that within the time range of 0.1 min to 10 min, the area of the damage zone around the wellbore and the interwall section both increased, while in the time range of 10 min to 200 min, the increase in the damage zone of the surrounding rock mass of the wellbore was not obvious. It can be seen that the damage zone in the branch well increased rapidly in the early stage, then increases slightly, and finally, the distribution range of the damage zone tended to be stable.
Figure 5 shows the schematic diagram of the parameter sampling path on the interwall section of the branch well geometric model, extending from the interwall tip to the thicker part of the interwall. Figure 6 shows the variation trend of the damage factor along the path at different times when the drilling fluid density was 1.1 g/cm3. It can be seen from the figure that the damage factor decreased continuously with the increase in the distance from the interwall tip. When the distance exceeded 0.160 m, the damage factor tended to 0. With the increase in time, the damage factor and the range of the damage zone in the surrounding rock mass of the wellbore increased continuously, but the increase gradually decreased. When the time exceeded 10 min, the damage zone almost no longer increased, and when the time exceeded 60 min, the damage factor in the surrounding rock mass of the wellbore no longer increased significantly. The reason for the above phenomenon was that the thickness of the interwall section increased continuously with the increase in the path distance, so the further away from the interwall tip, the greater the resistance of the surrounding rock mass of the wellbore to deformation, the less likely the rock was to be damaged, and the more stable the wellbore was.
Figure 7 shows the variation trend of the damage factor along the path at different drilling fluid densities. With the increase in the distance from the interwall tip, the damage factor along the path decreased rapidly at first and then slowly. When the drilling fluid densities were 1.0 g/cm3 and 1.1 g/cm3, the damage factor was close to 0 when the distance from the interwall tip reached 0.184 m. When the drilling fluid densities were 1.2 g/cm3, 1.3 g/cm3, 1.4 g/cm3, and 1.5 g/cm3, the damage factor tended to 0 when the distance from the interwall tip reached 0.131 m. When the distance from the interwall tip was the same, the lower the drilling fluid density, the greater the damage factor at the same distance. This indicated that the range of the damage zone in the surrounding rock mass of the wellbore increased with the decrease in the drilling fluid density. The lower the drilling fluid density used, the weaker the supporting effect of the drilling fluid column pressure on the wellbore, the greater the stress difference between the wellbore and the formation, the higher the degree of damage to the surrounding rock mass of the wellbore, and the higher the risk of wellbore instability.

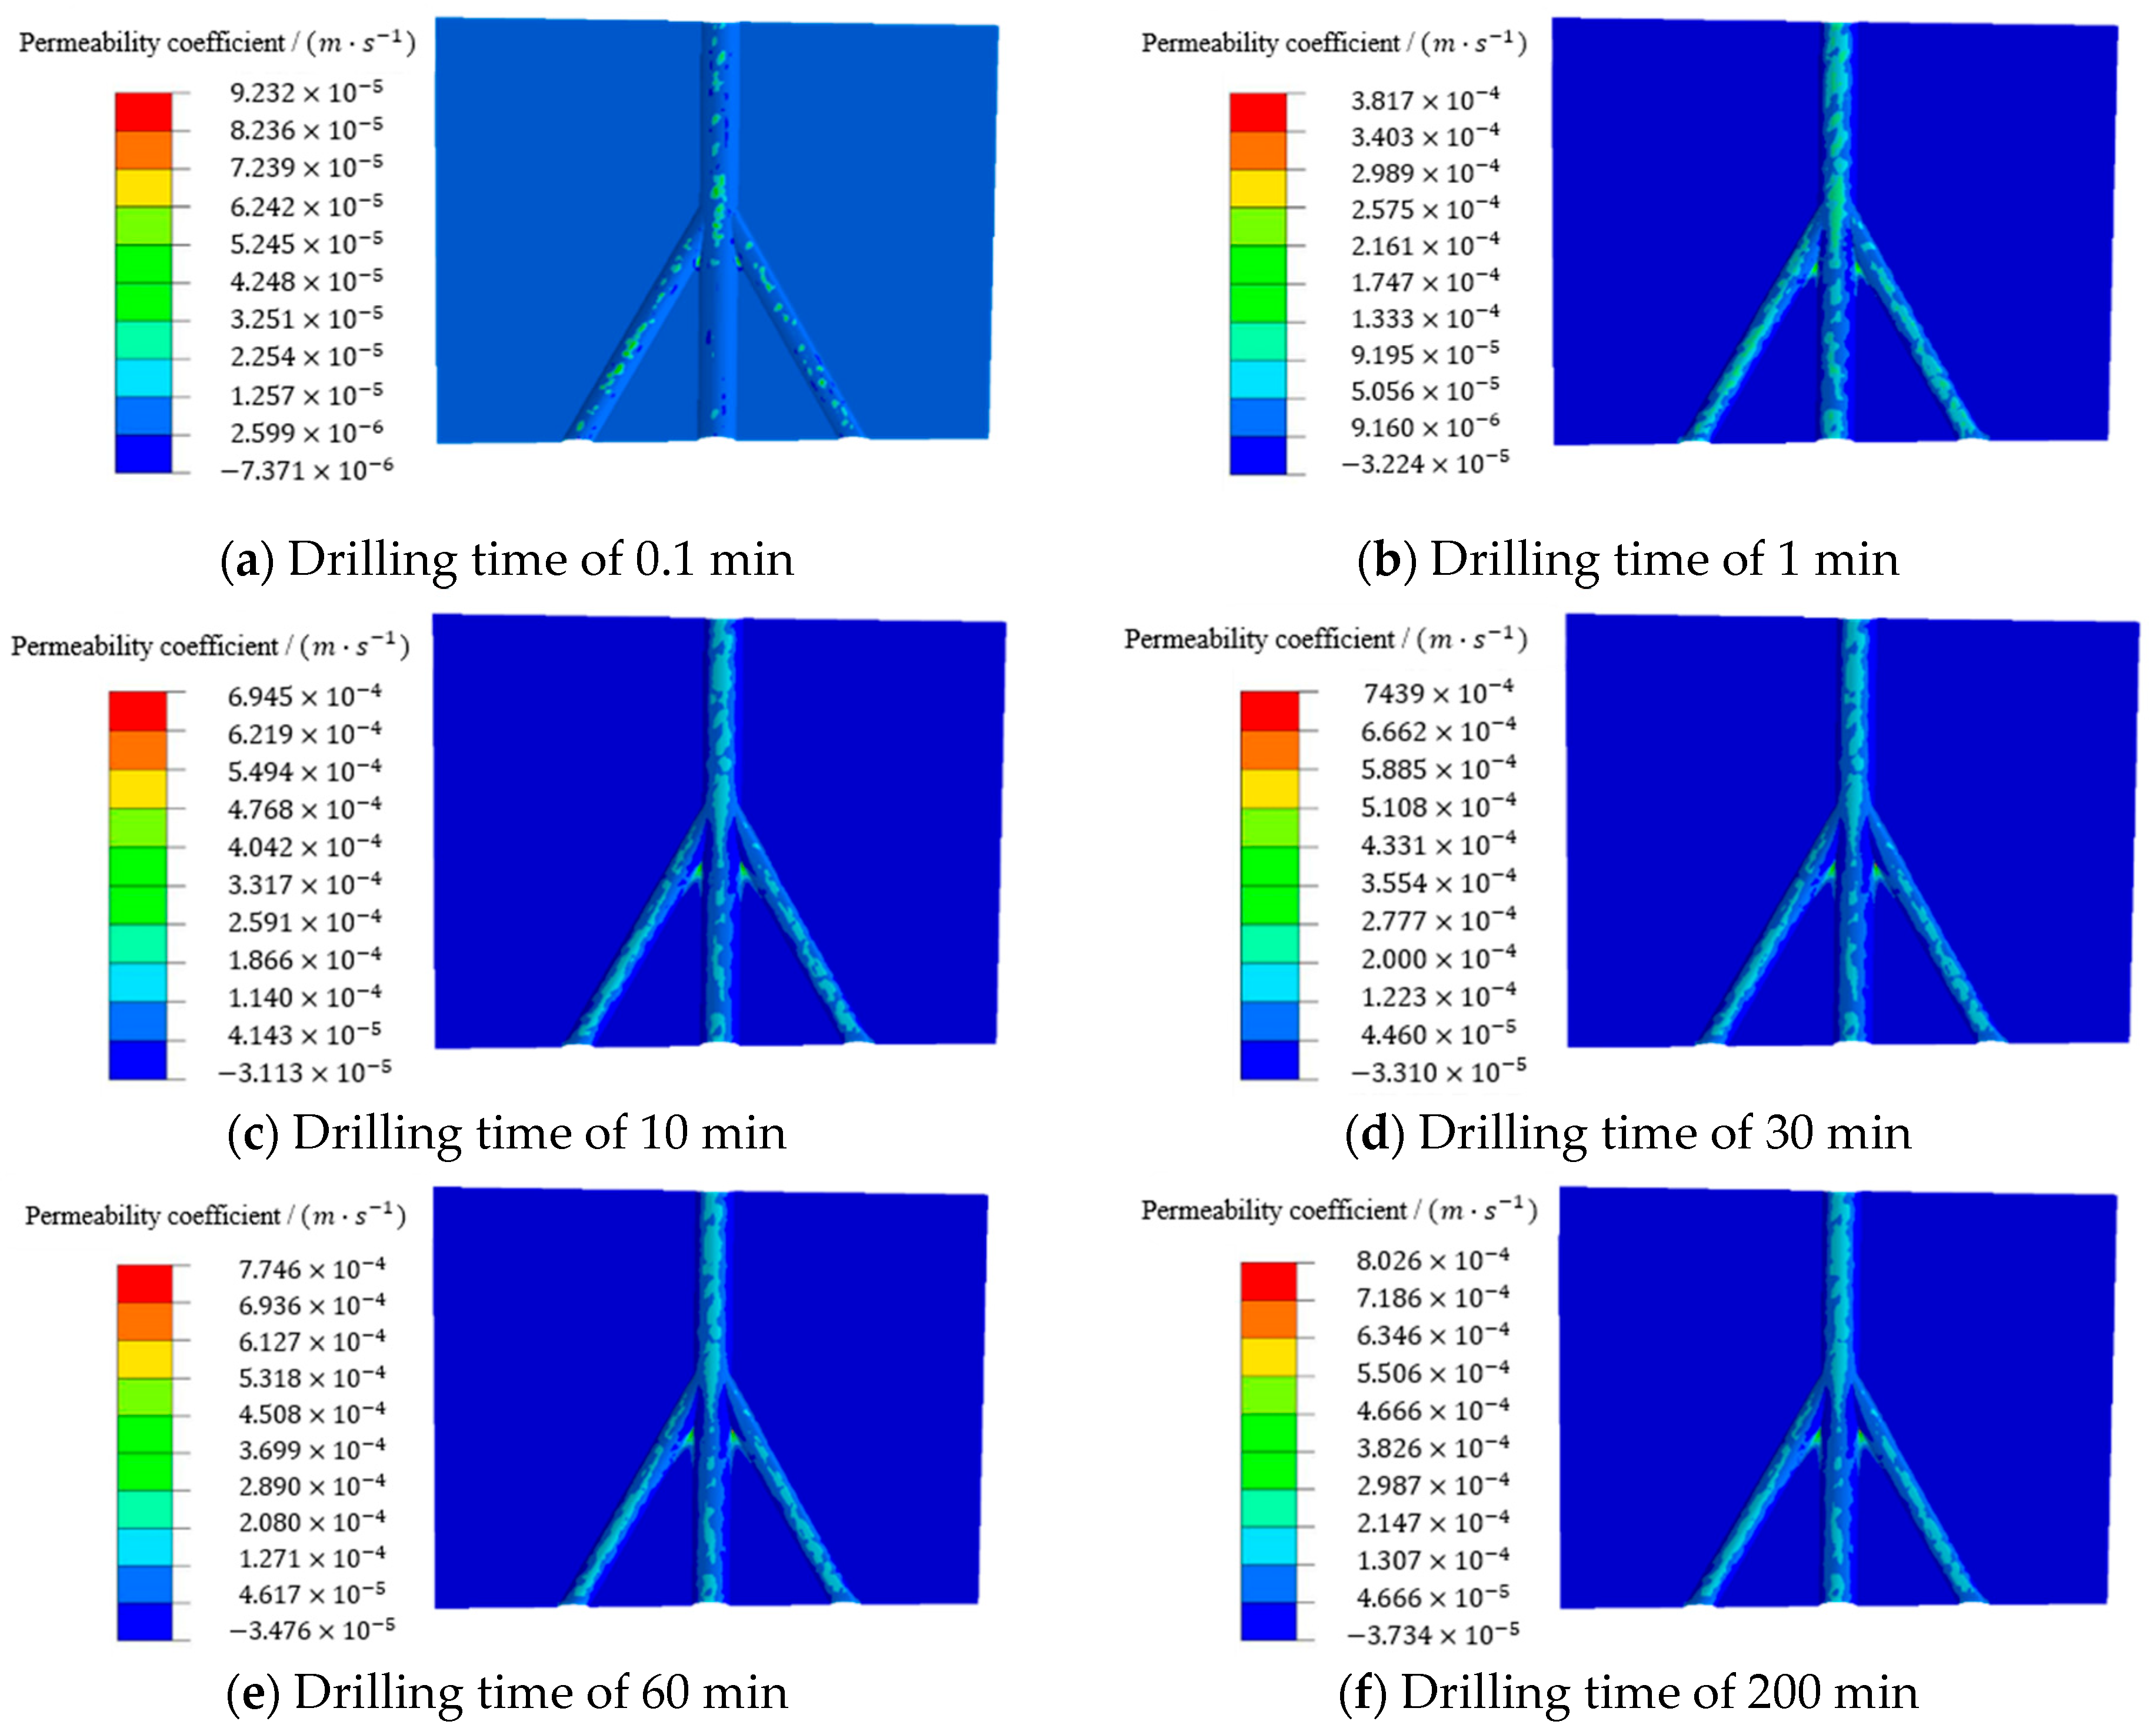
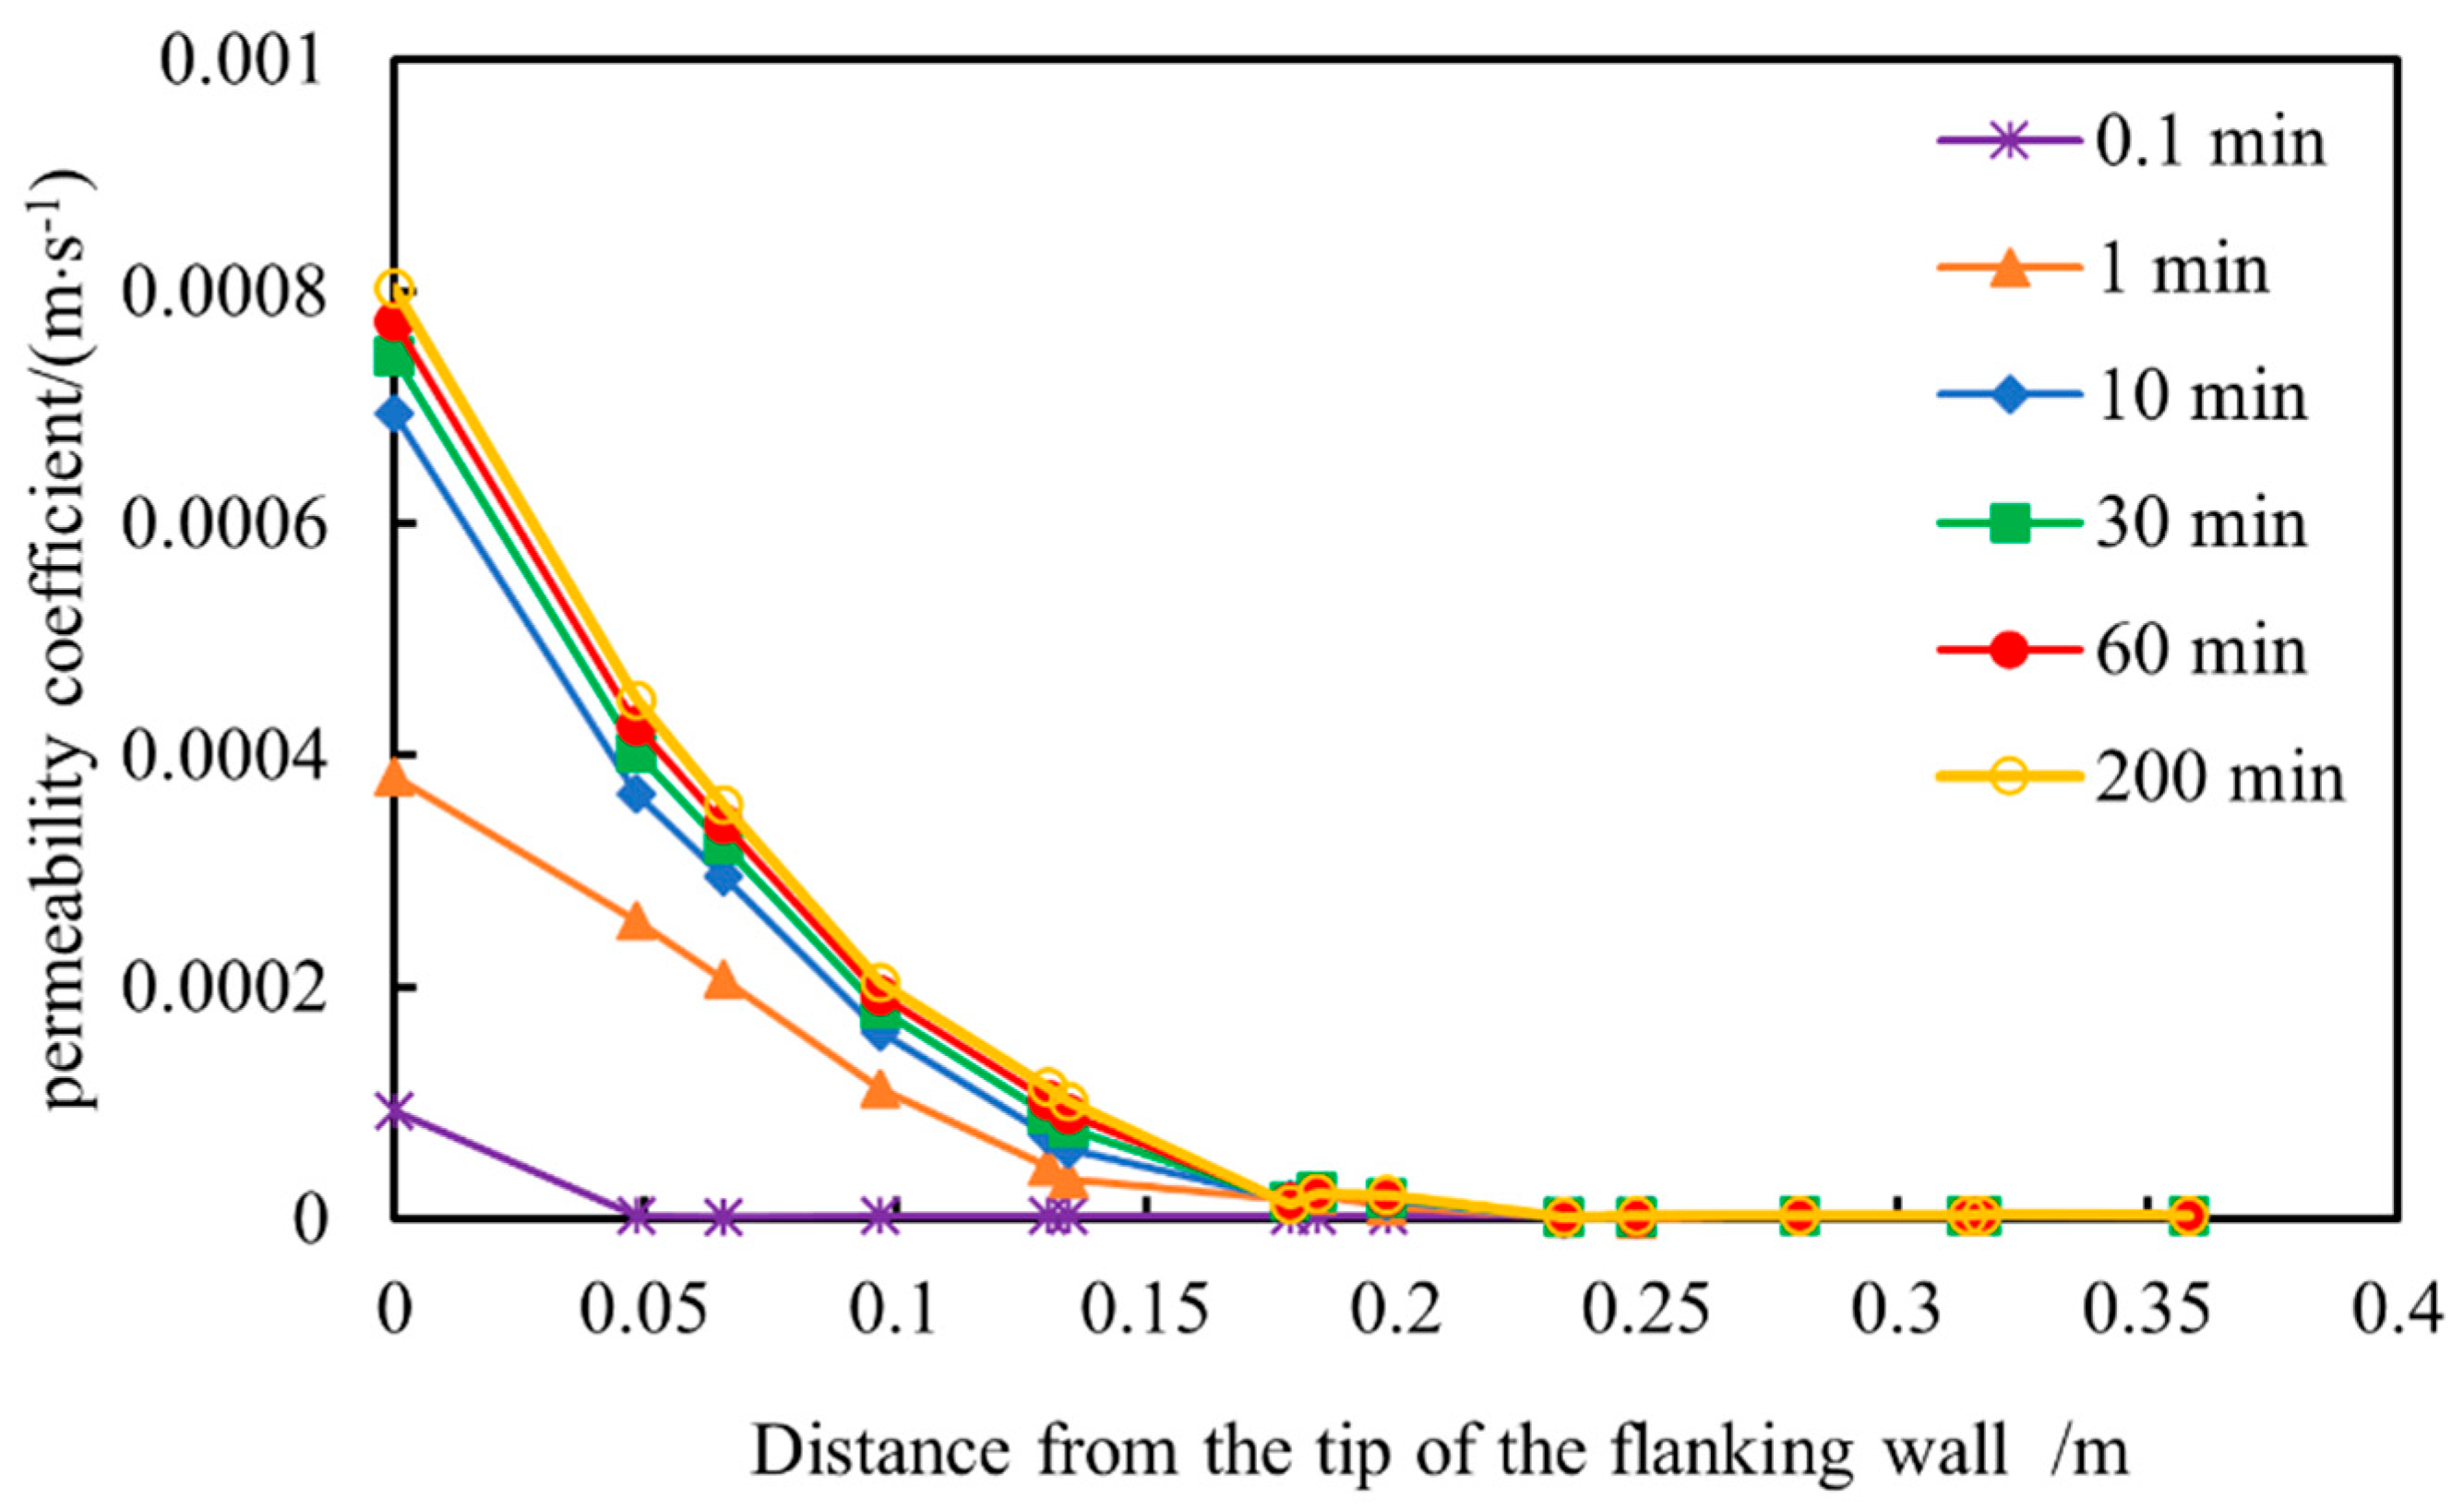
3.3. Evolution of Formation Permeability Around Branch Wellbores

Permeability in isotropic rock materials indicates the unit flow rate under the unit hydraulic gradient and is used to describe the ease with which fluid passes through the pores of the formation rock. Permeability is closely related to the size of rock pores and their degree of interconnection. During drilling, the rock around the wellbore will be damaged due to secondary stress concentration. Under the influence of damage, more microcracks will appear in the surrounding rock mass of the wellbore, and the existing microcracks in the surrounding rock mass of the wellbore will continue to extend and expand, finally connecting and penetrating to form a larger range of cracks, which makes the permeability of the surrounding rock mass of the wellbore increase sharply. Figure 6 and Figure 7 show the permeability distribution cloud chart of the surrounding rock mass of the wellbore and the variation trend of permeability with the distance from the interwall tip at different drilling times when the drilling fluid density was 1.1 g/cm3. It can be seen that in the short time after the damage appeared, the permeability of the surrounding rock mass of the wellbore increased rapidly. During the increase in drilling time from 0.1 min to 10 min, the maximum permeability of the surrounding rock mass of the wellbore increased from 9.2321 × 10⁻⁵ m/s to 6.945 × 10⁻⁴ m/s, an increase of 695 times. With the increase in drilling time, the increase in permeability in the surrounding rock mass of the wellbore gradually decreased, and when the drilling time reached 60 min, the permeability tended to be stable. By comparing with Figure 3, it can be seen that the area where damage occurred in the surrounding rock mass of the wellbore was the same as the area with higher permeability, and the maximum permeability was also located at the interwall tip. Since permeability only changed dramatically when damage occurred and then because the damage factor was small, the change in permeability gradually tended to be stable.

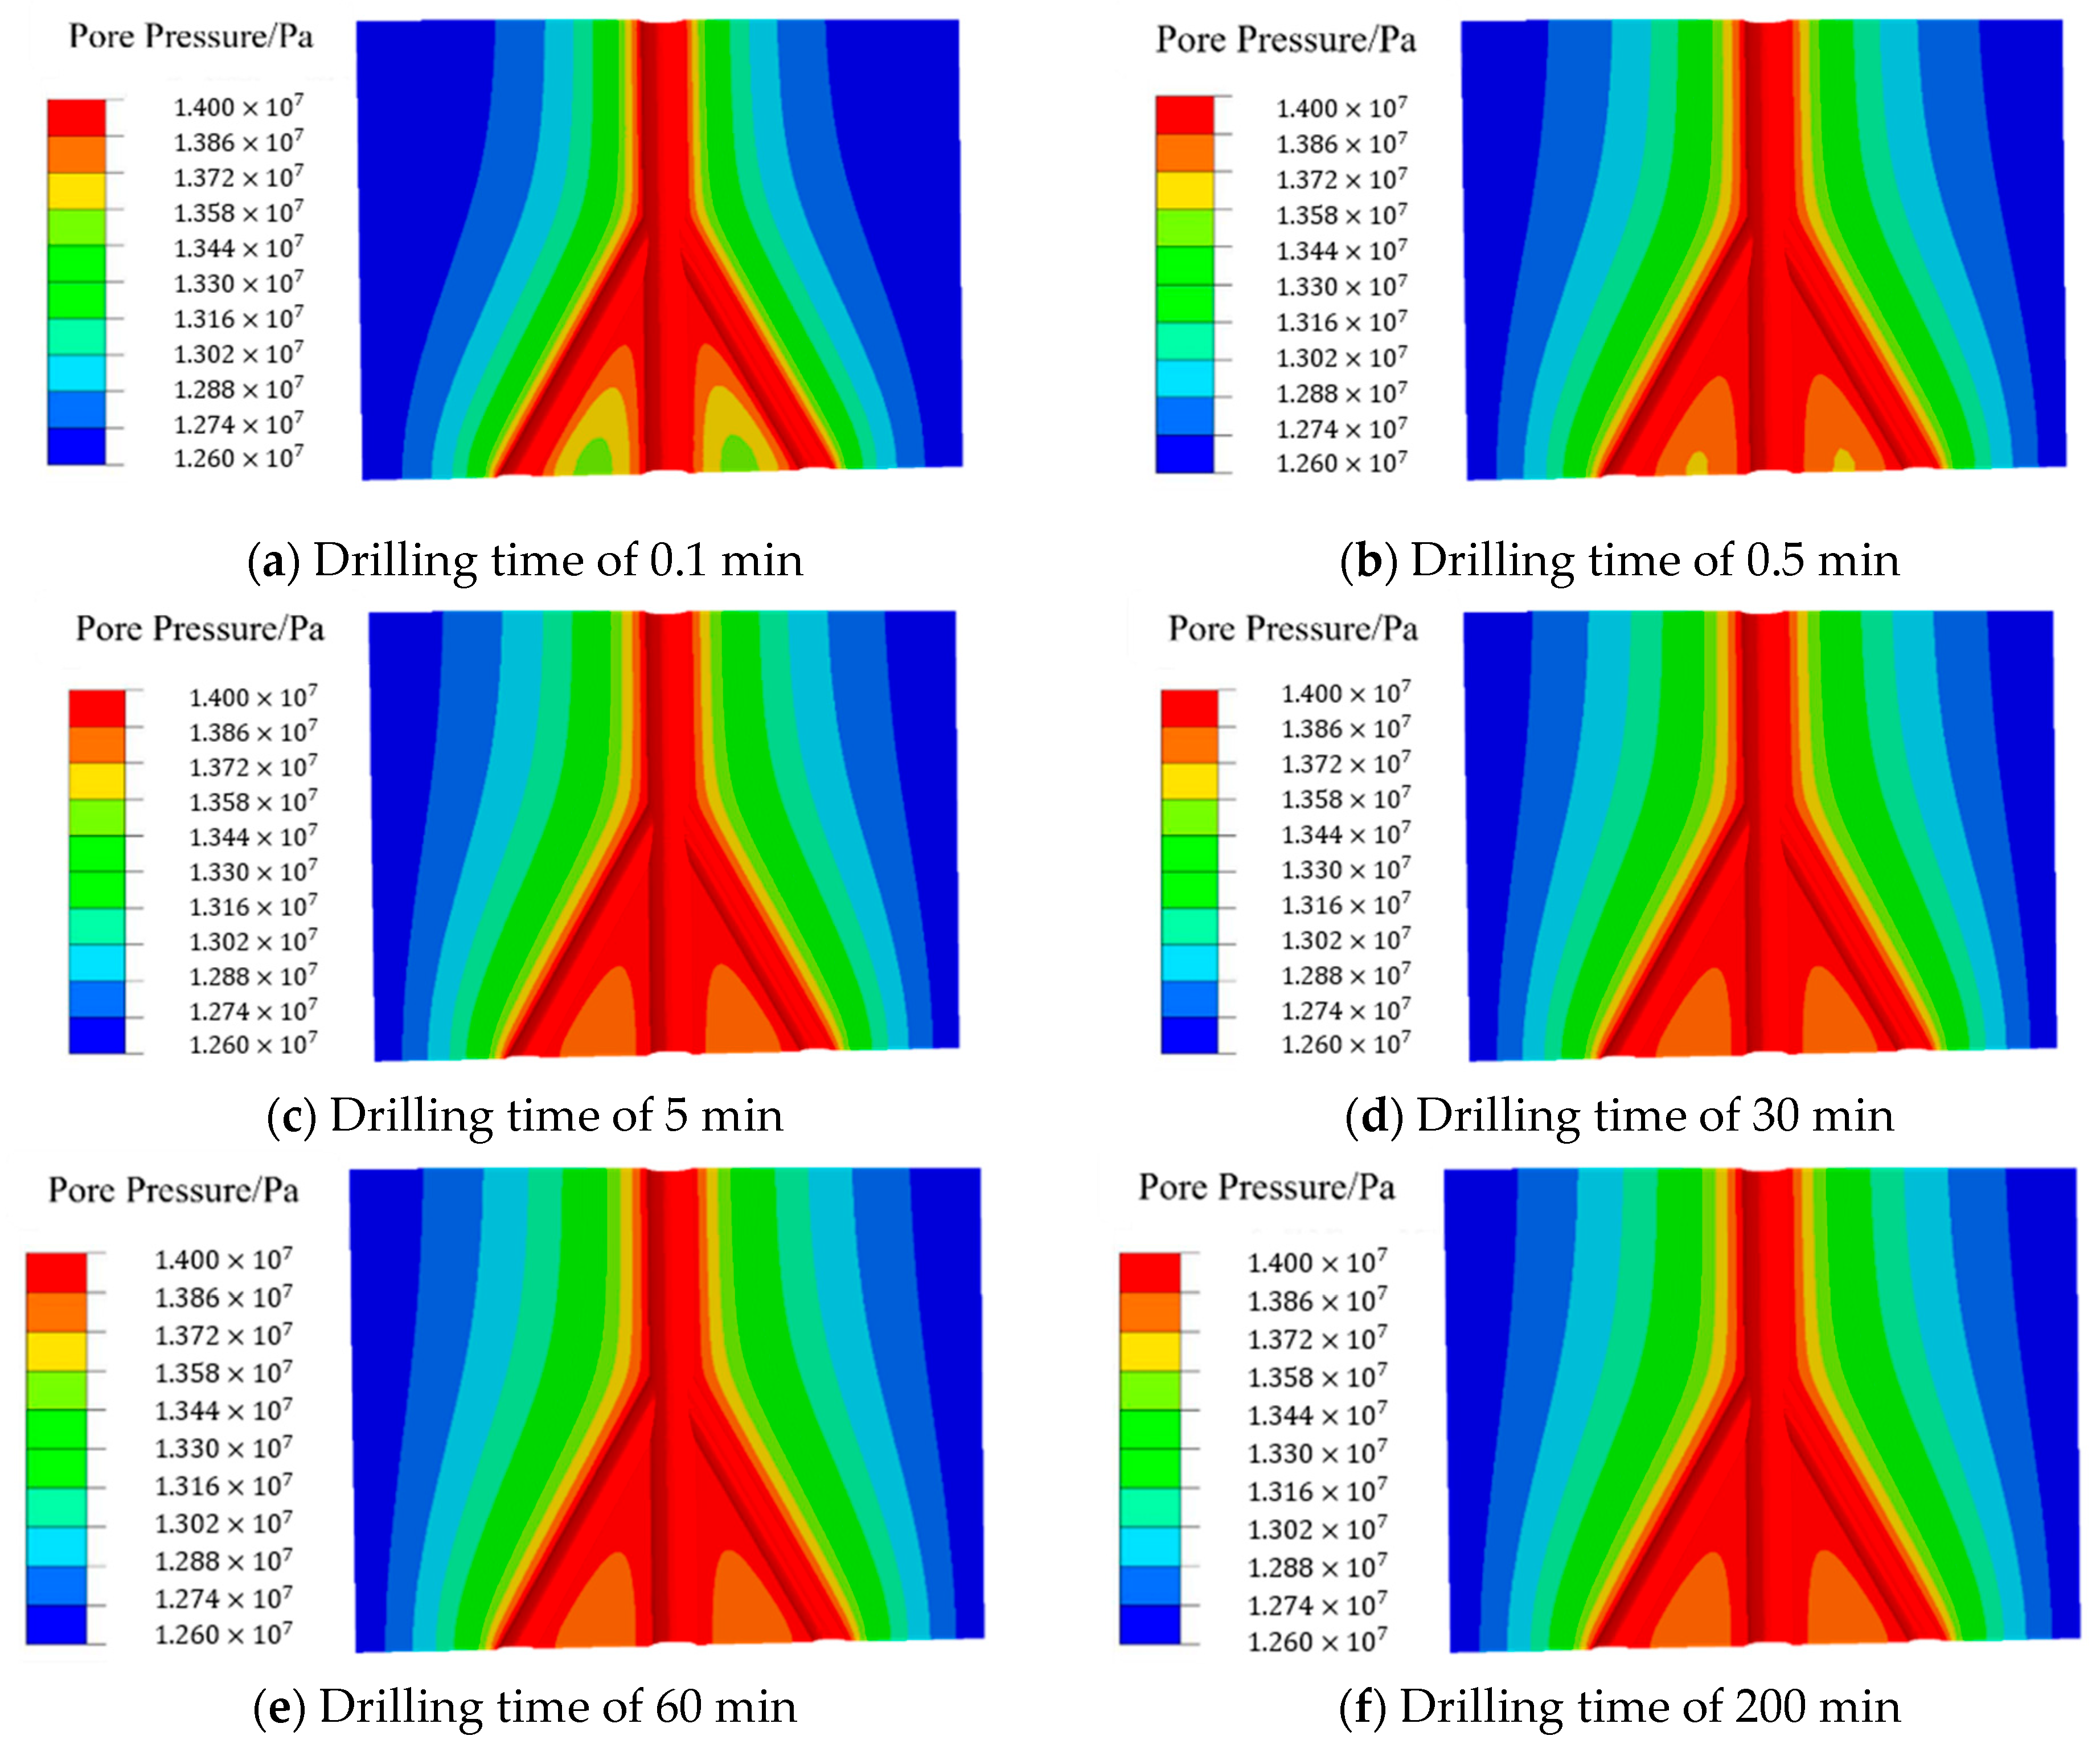
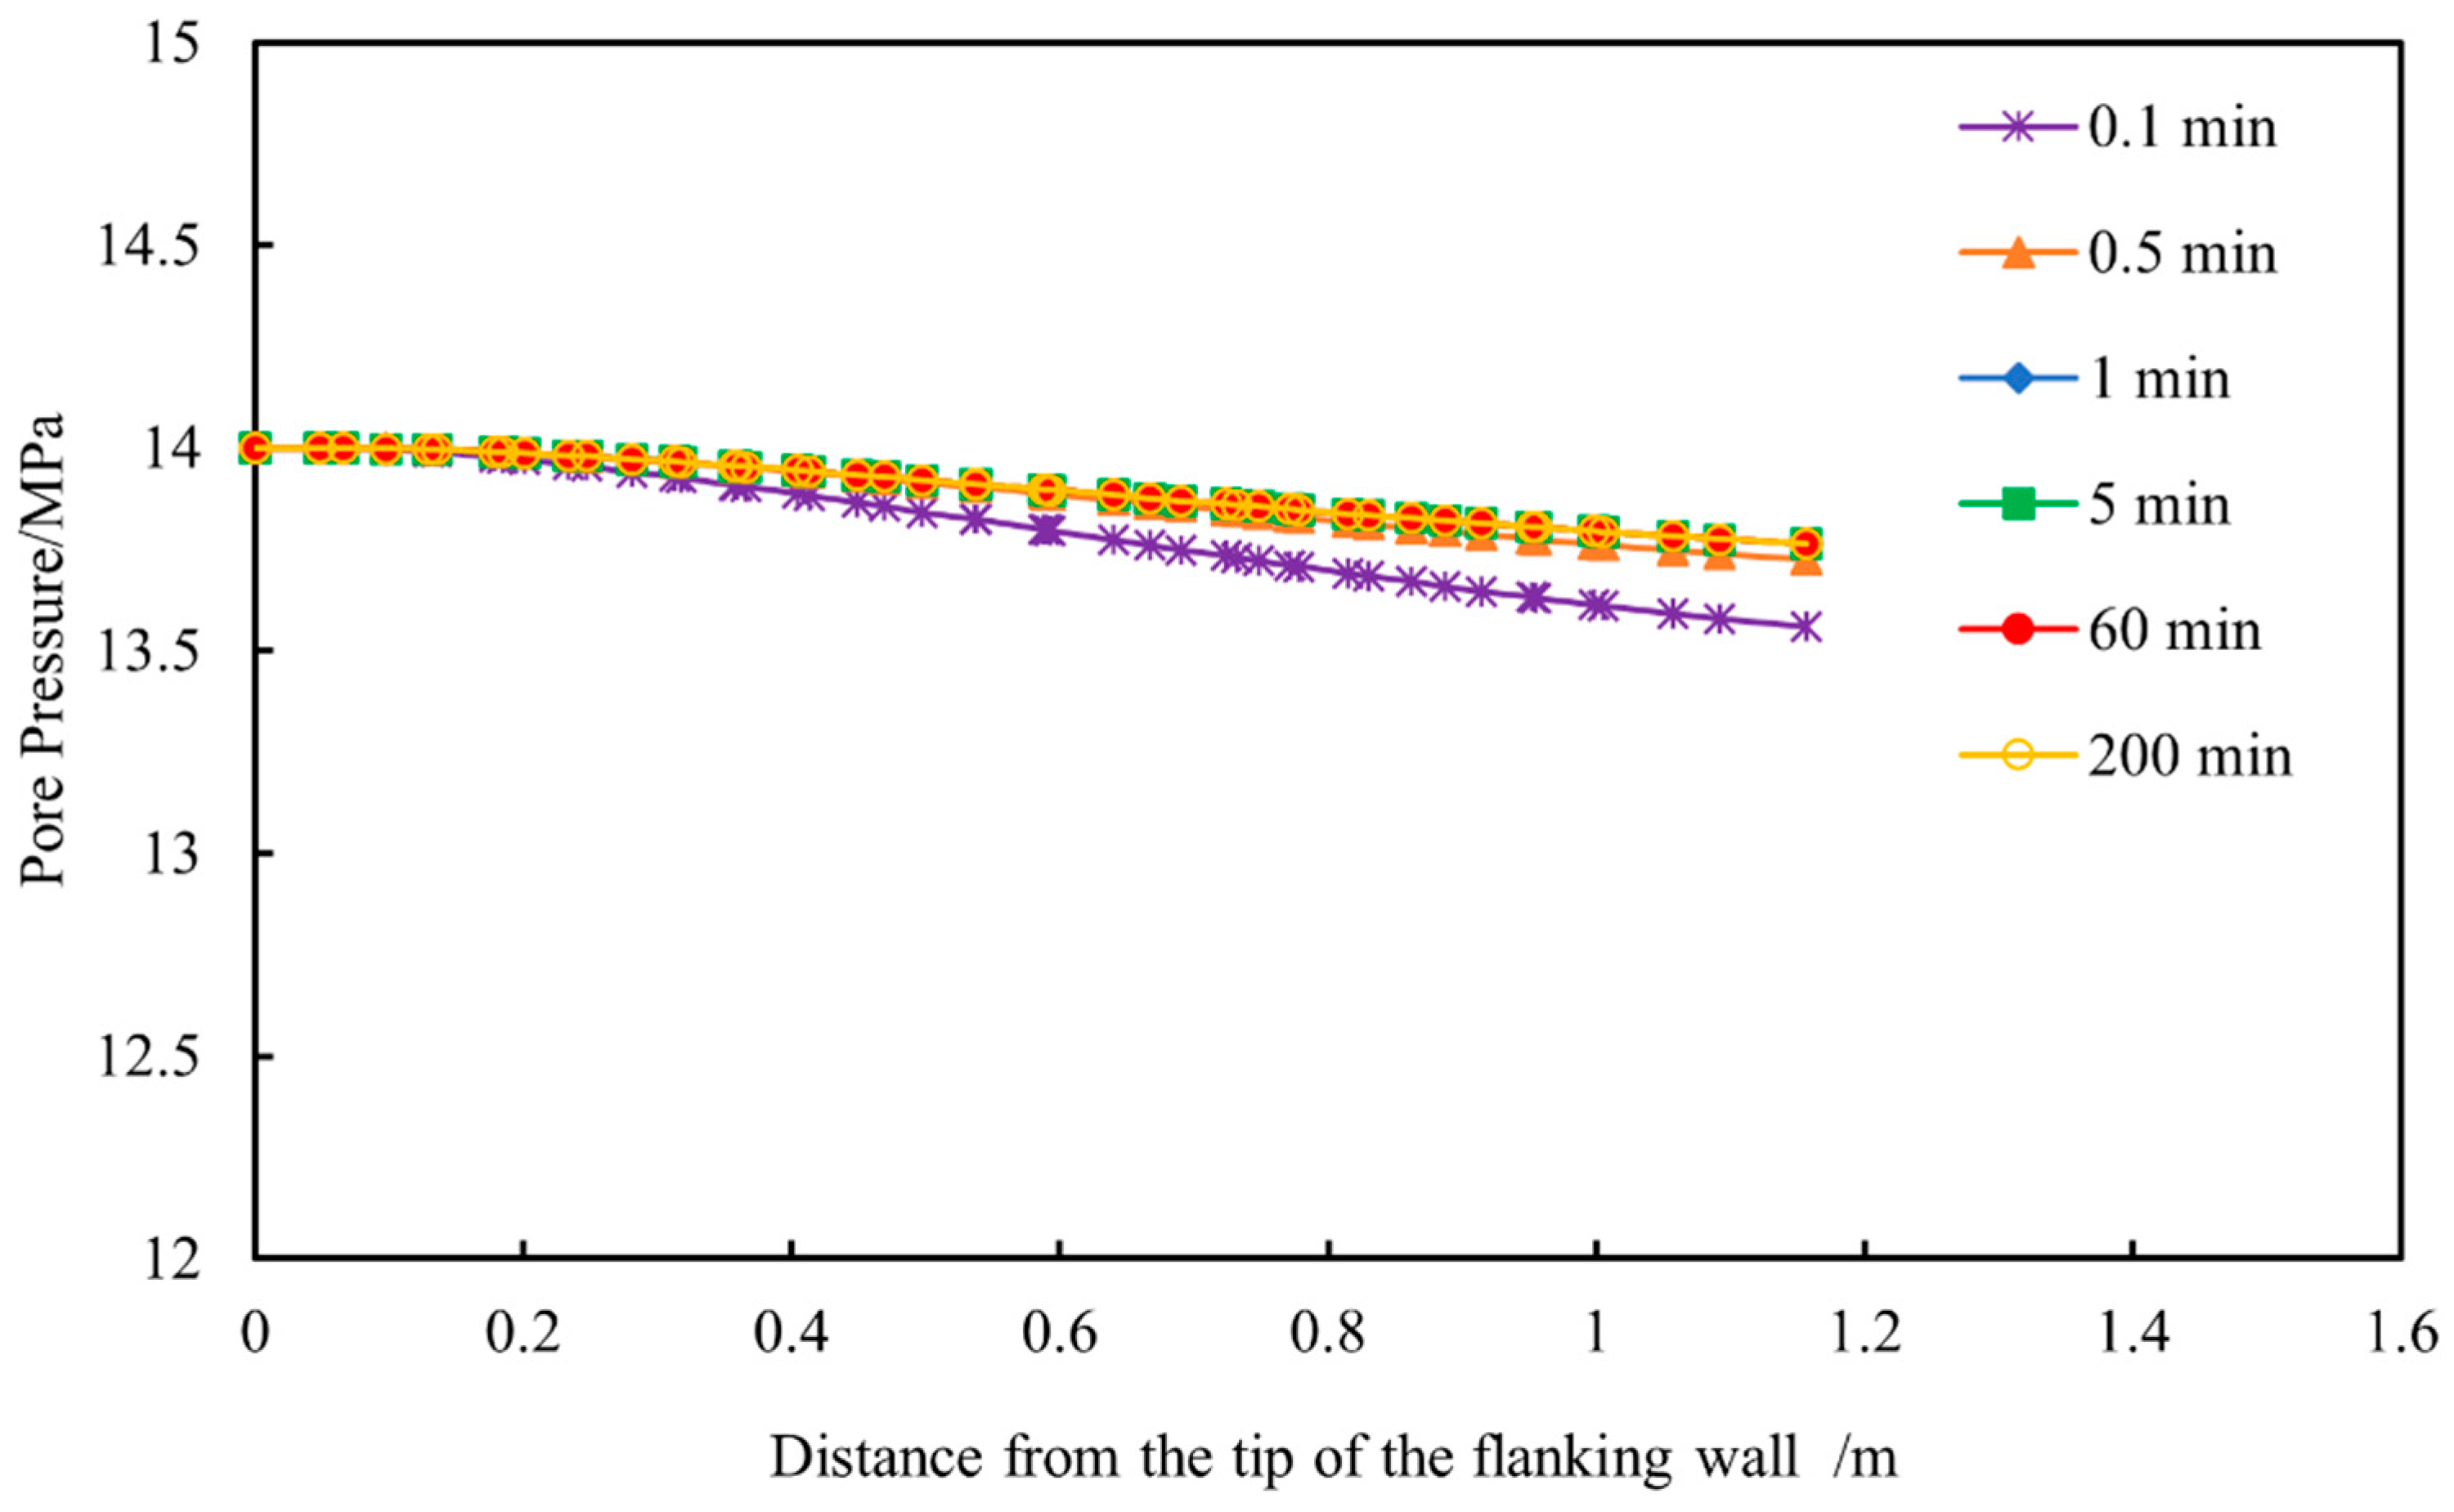
3.4. Distribution of Pore Pressure Around Branch Wellbores

The increase in pore pressure in the surrounding rock mass of the wellbore will continuously reduce the effective stress in the formation, thereby reducing the compressive strength of the formation rock and increasing the risk of wellbore instability. During drilling, under the action of pore pressure, the hydraulic wedging effect of pore fluid in the surrounding rock mass of the wellbore will accelerate the expansion and penetration of internal rock fractures, resulting in a significant decrease in rock shear strength and triggering wellbore instability.
Under a drilling fluid density of 1.1 g/cm3, Figure 8 and Figure 9 show the pore pressure distribution cloud chart of the formation and the variation trend of pore pressure with the distance from the interwall tip at different drilling times, respectively. It can be seen that since the drilling fluid column pressure in the wellbore was higher than the pore pressure of the formation in the branch well, with the increase in drilling time, the drilling fluid column pressure was gradually transmitted from the wellbore to the formation. According to the damage factor distribution cloud chart of the branch well connection section shown in Figure 10, the damage factor was the largest at the place where the thickness of the interwall section between the main wellbore and the branch wellbore was small, there were more fractures in the surrounding rock mass of the wellbore, and the degree of penetration was large. The “deterioration” degree of the rock was higher, so the transmission speed of the drilling fluid column pressure at the interwall tip was faster. According to the data in Figure 11, when the drilling time was 0.1 min, the pore pressure at a distance of 1 m from the interwall tip was 13.6 MPa, while when the drilling time was 5 min, the pore pressure at a distance of 1 m from the interwall tip was 13.9 MPa. The further away from the interwall tip, the lower the pore pressure at the interwall section. With the increase in drilling time, the decrease in pore pressure at the interwall section with the increase in path distance gradually decreased, and finally, the distribution of the pore pressure field at the interwall section also tended to be stable.

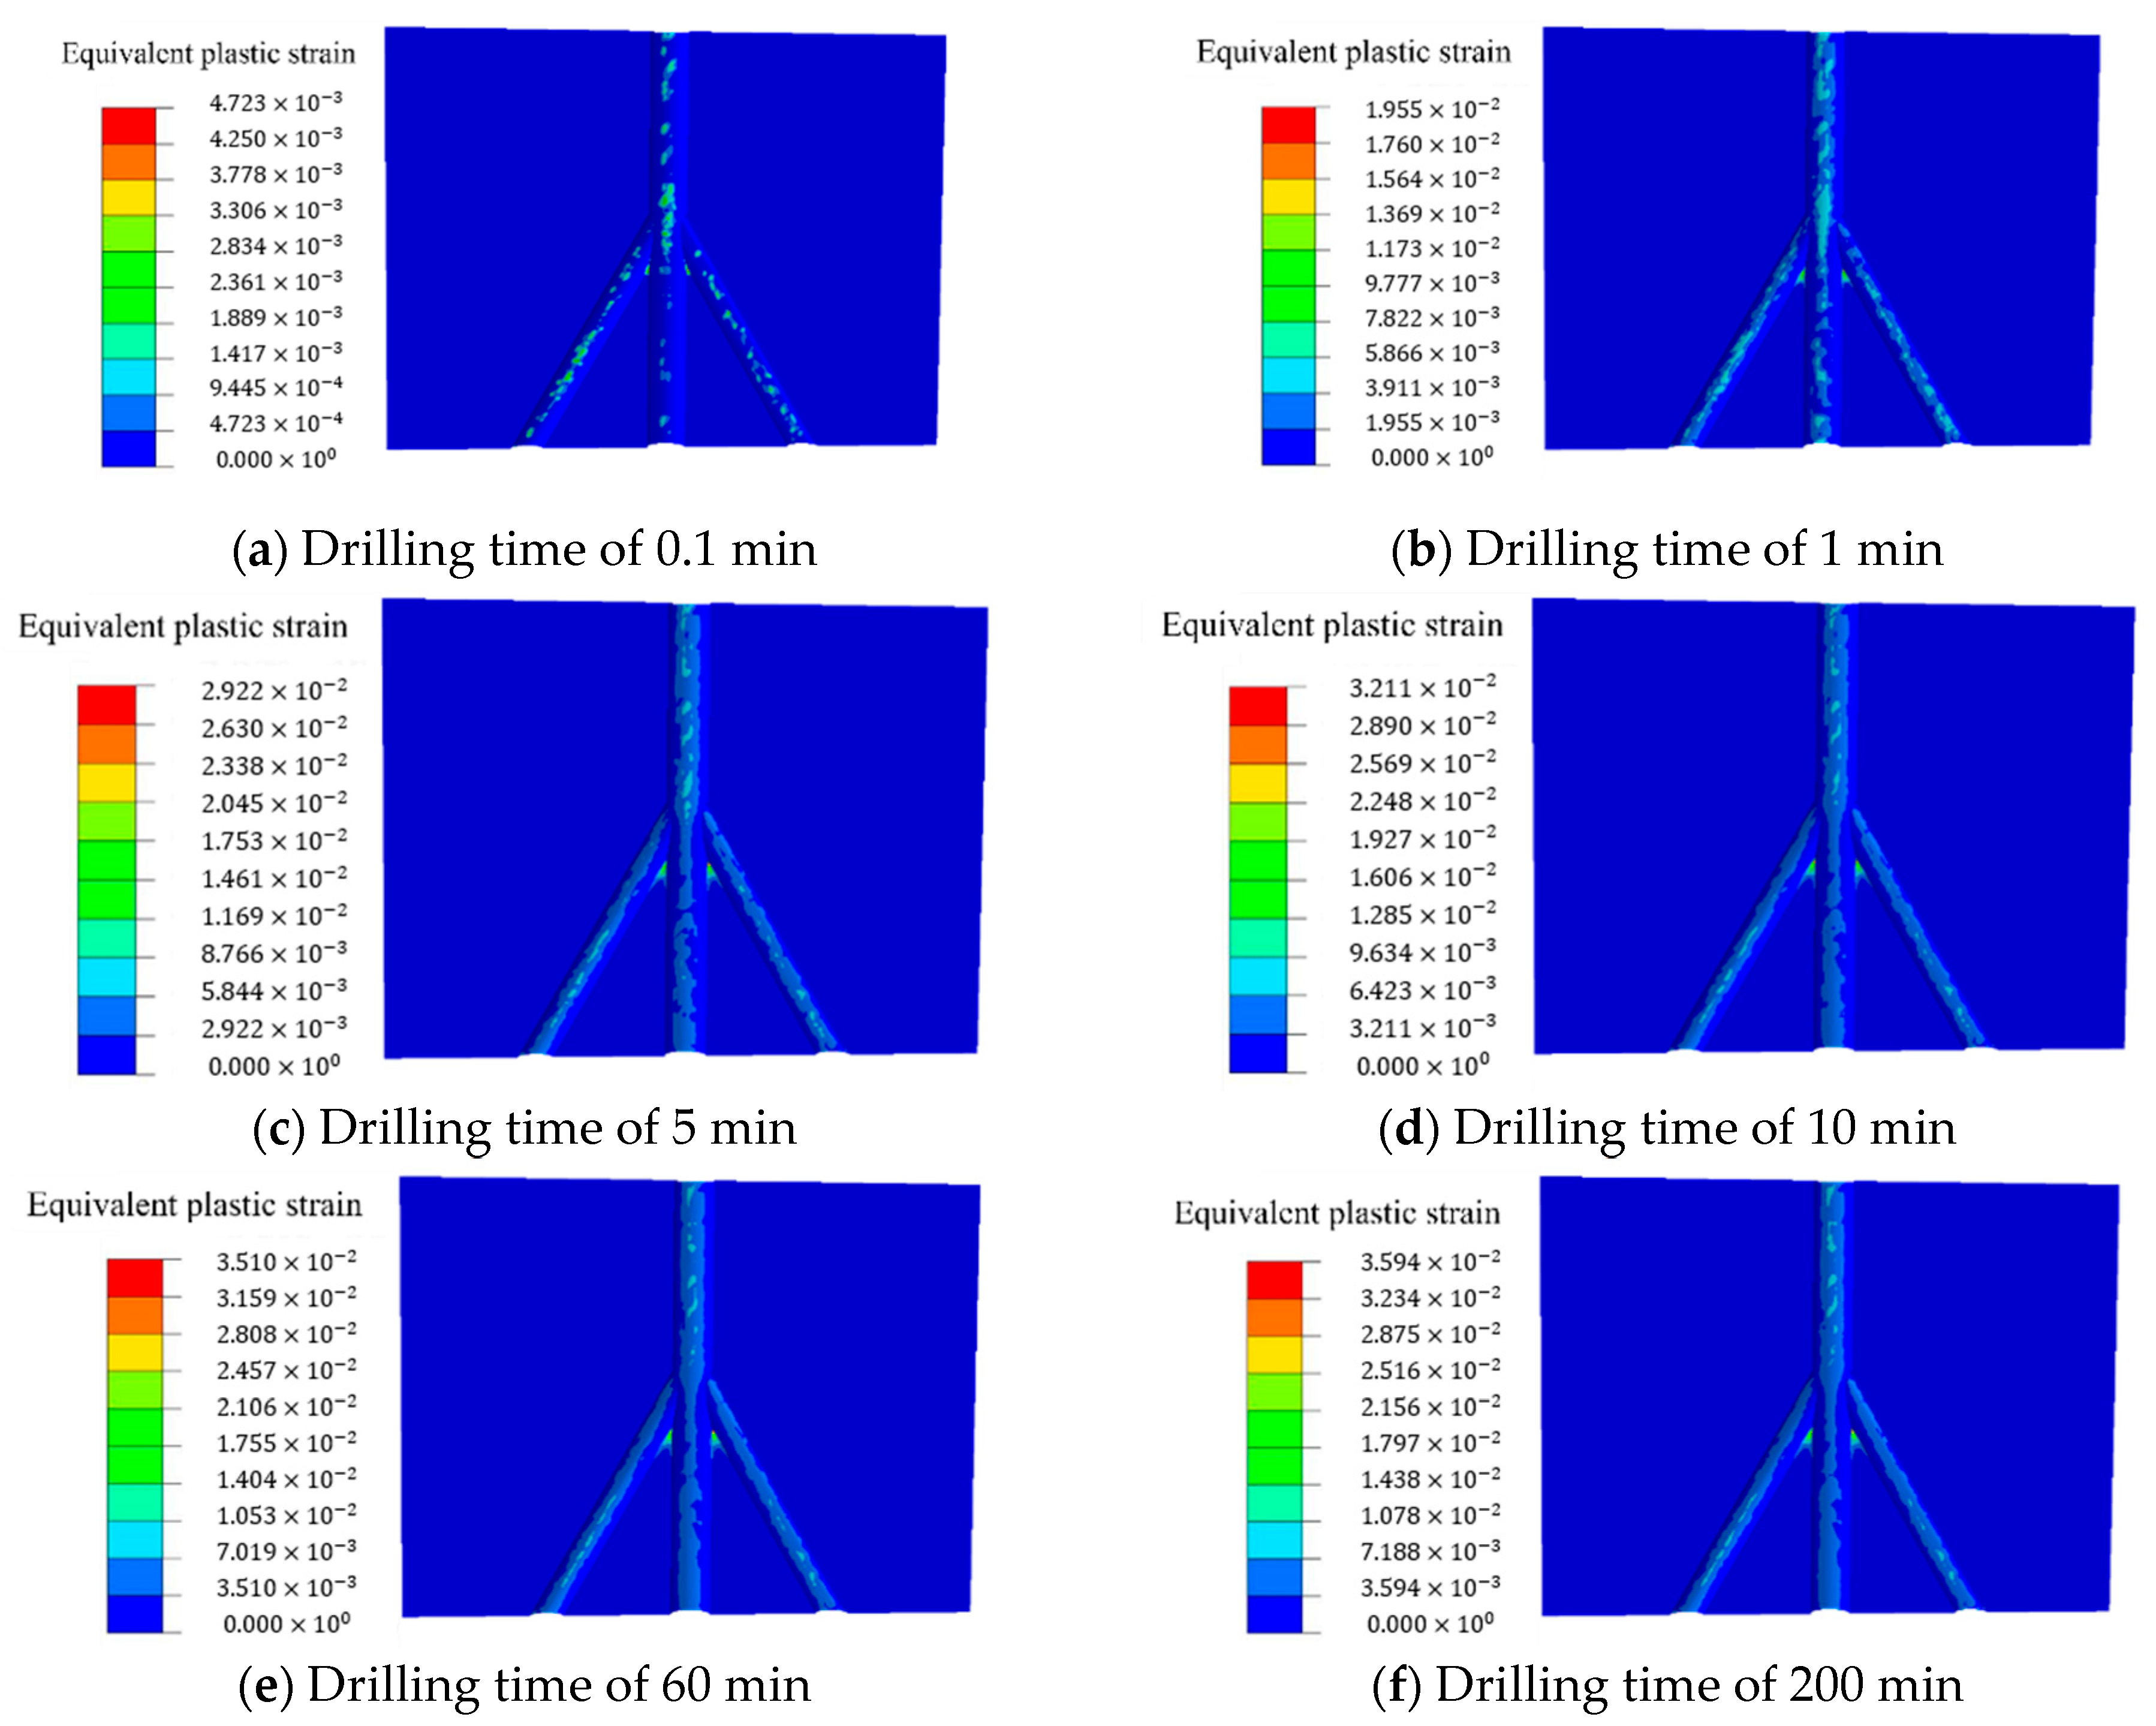
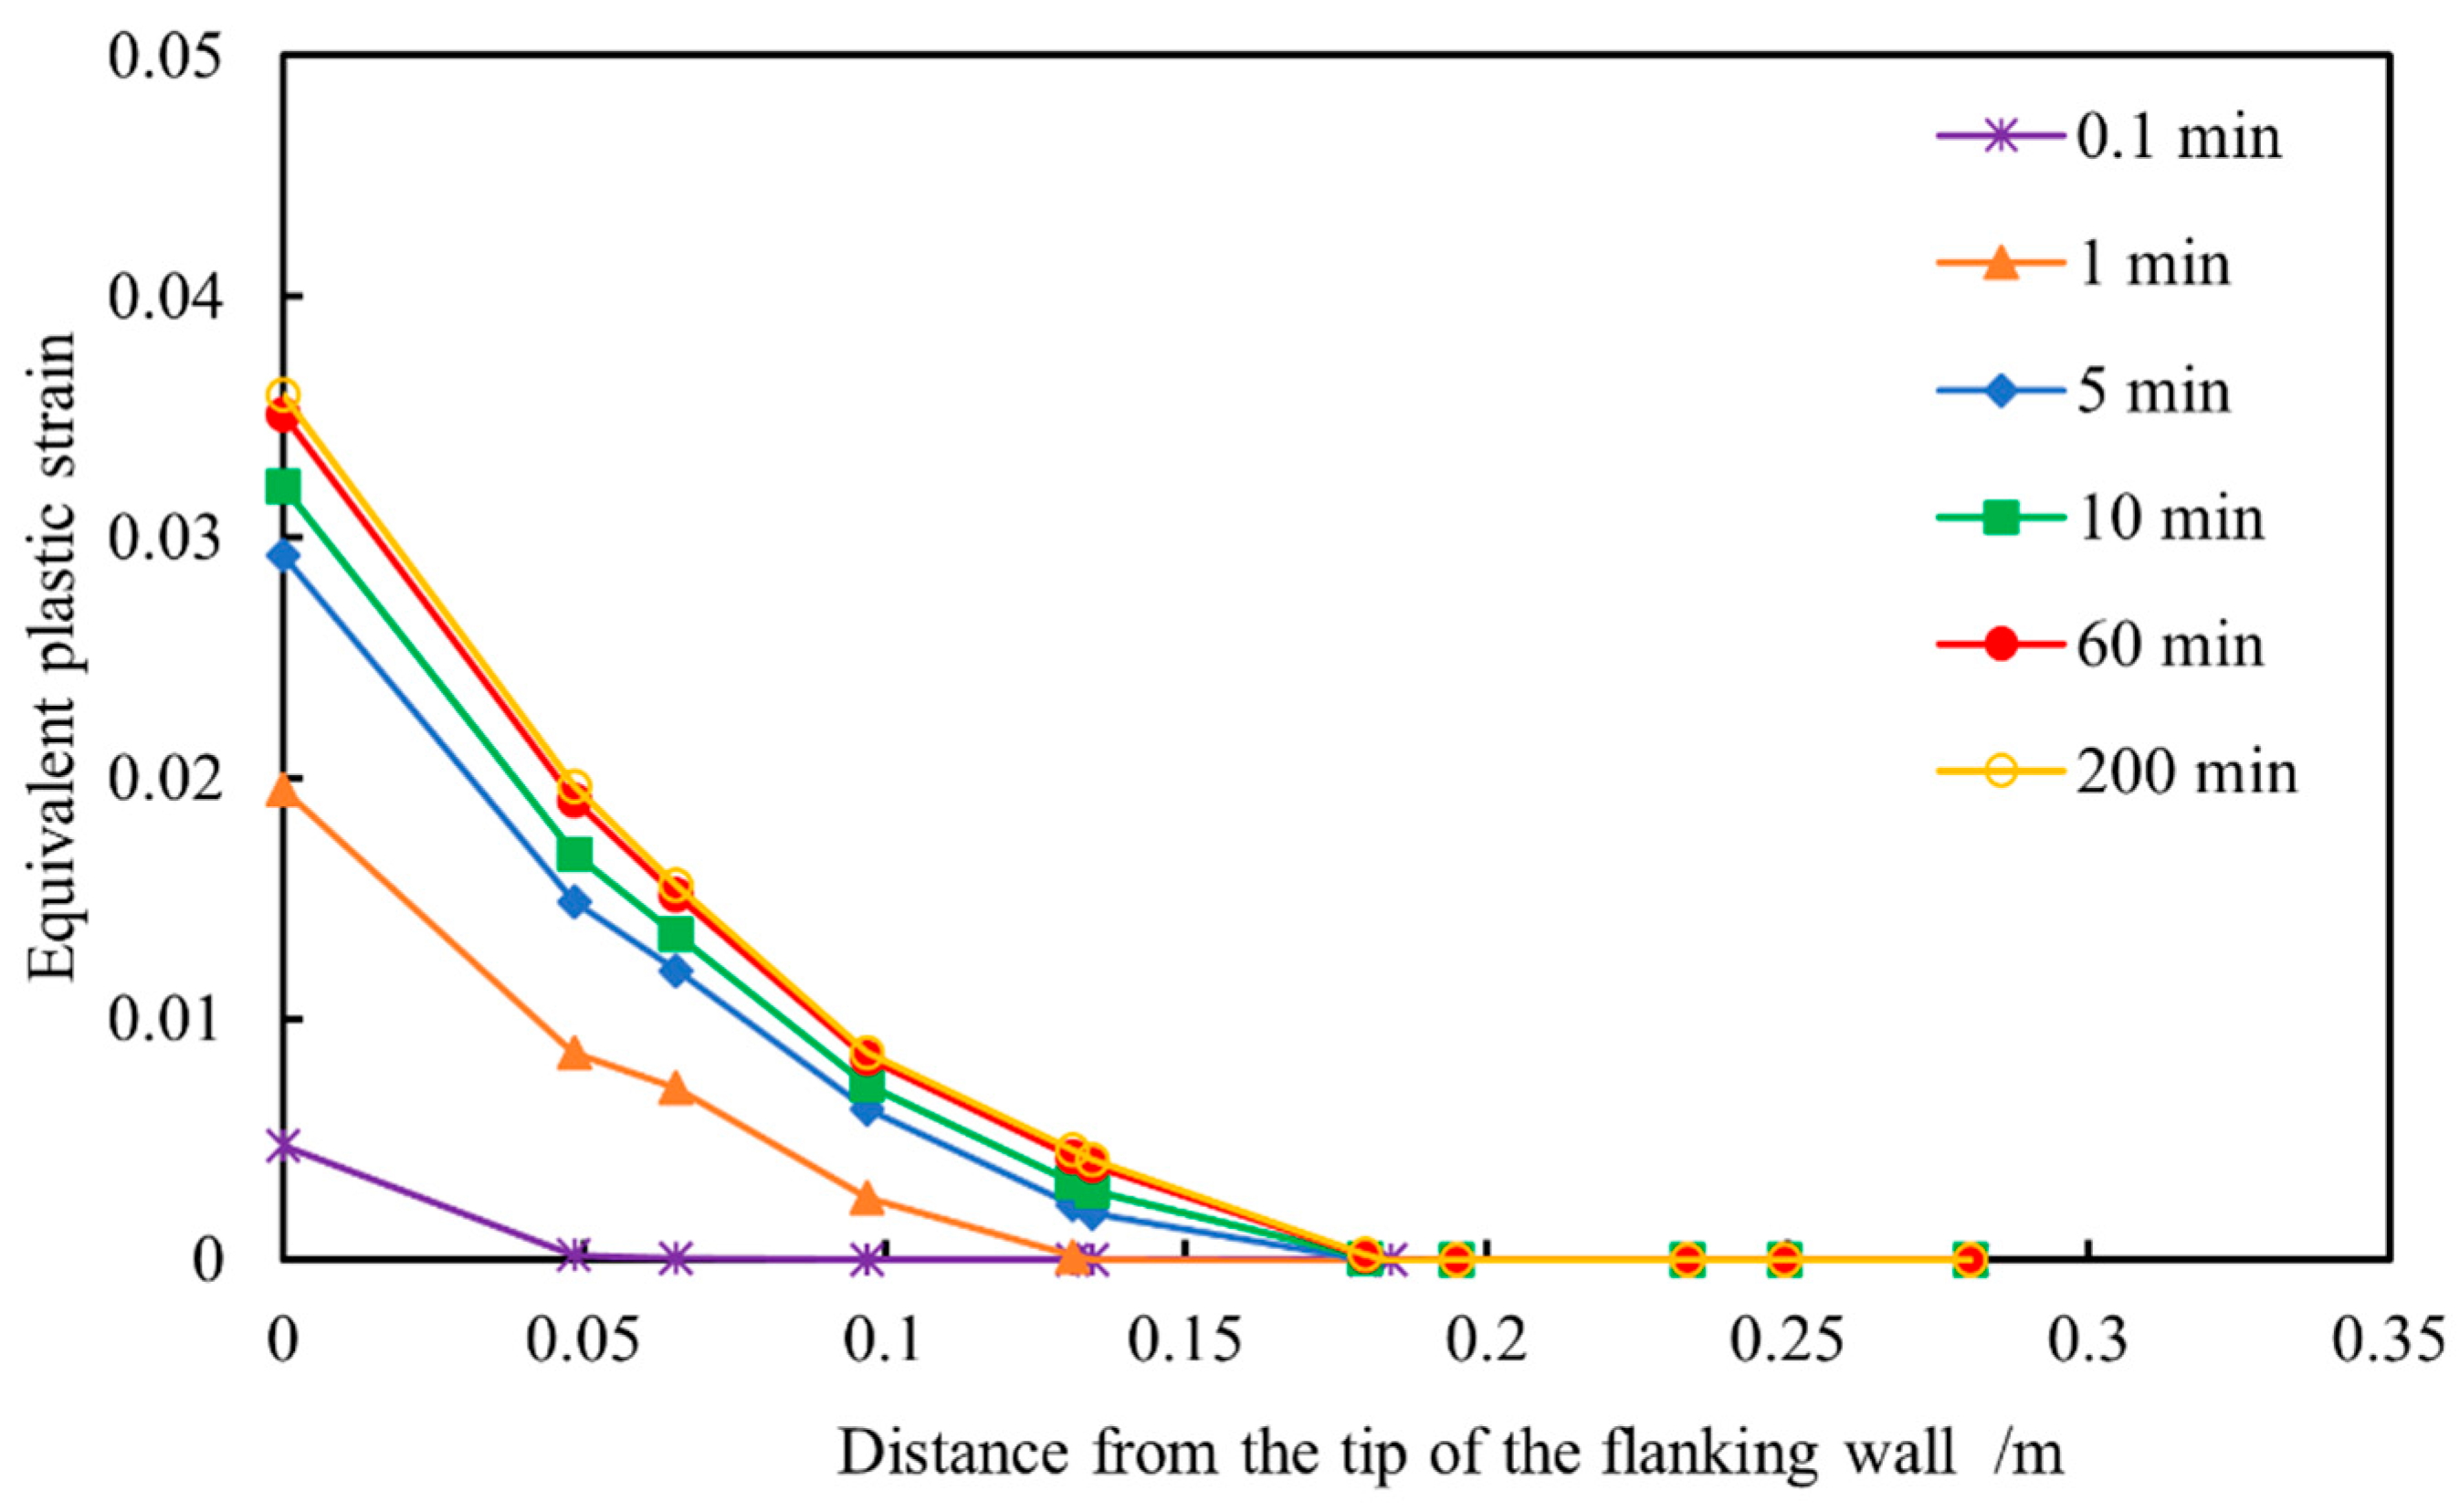
3.5. Evolution of Plastic Strain Around Branch Wellbores

Equivalent plastic strain is a physical quantity used to determine the position of the yield surface of the formation under different stress states. It converts the strain in different directions of the formation under complex three-dimensional stress states into the equivalent strain in a certain specific direction under uniaxial tension of the material. After the wellbore was drilled, since the thickness of the rock at the interwall tip was relatively thin, the rock’s resistance to deformation was small, so the stress concentration phenomenon was the most serious, and the risk of wellbore instability was the highest. Figure 12 shows the variation cloud chart of equivalent plastic strain around the wellbore at different drilling times when the drilling fluid density was 1.1 g/cm3. It can be seen that similar to the evolution law of the formation damage factor, since the thickness of the rock at the interwall section was smaller than that at other positions, the resistance to external loads was weaker, so the area with larger equivalent plastic strain in the branch well was concentrated at the interwall tip. With the increase in drilling time, the maximum equivalent plastic strain around the branch wellbore increased continuously, and the area of the plastic zone also gradually increased, but the increase in equivalent plastic strain at the interwall tip gradually decreased. When the drilling time reached 60 min, the equivalent plastic strain began to tend to being stable.
Figure 13 shows the variation trend of equivalent plastic strain along the path at different drilling times. According to the simulation results, when the drilling times were 0.1 min, 1 min, 5 min, and longer, the ranges of the plastic zone along the interwall path were 0.048 m, 0.131 m, and 0.180 m, respectively. It can be seen that within 0.1 min to 1 min of drilling time, the range of the plastic zone at the interwall section increased nearly twofold, with an increase of 172.9%. When the drilling time increased from 0.1 min to 5 min or even longer, the increase in the range of the plastic zone was only 37.4%, and the increase rate was significantly slowed down. This was because as the path distance of the interwall section increased, the thickness of the interwall section increased continuously, and the rock’s resistance to external loads also increased continuously. Therefore, the instability risk of the interwall section decreased continuously with the increase in path distance. When the formation stress reached a balanced state, the range of the plastic zone gradually stabilized, and no significant changes occurred.

4. Analysis of Sensitive Factors for Borehole Stability in Multilateral Wells

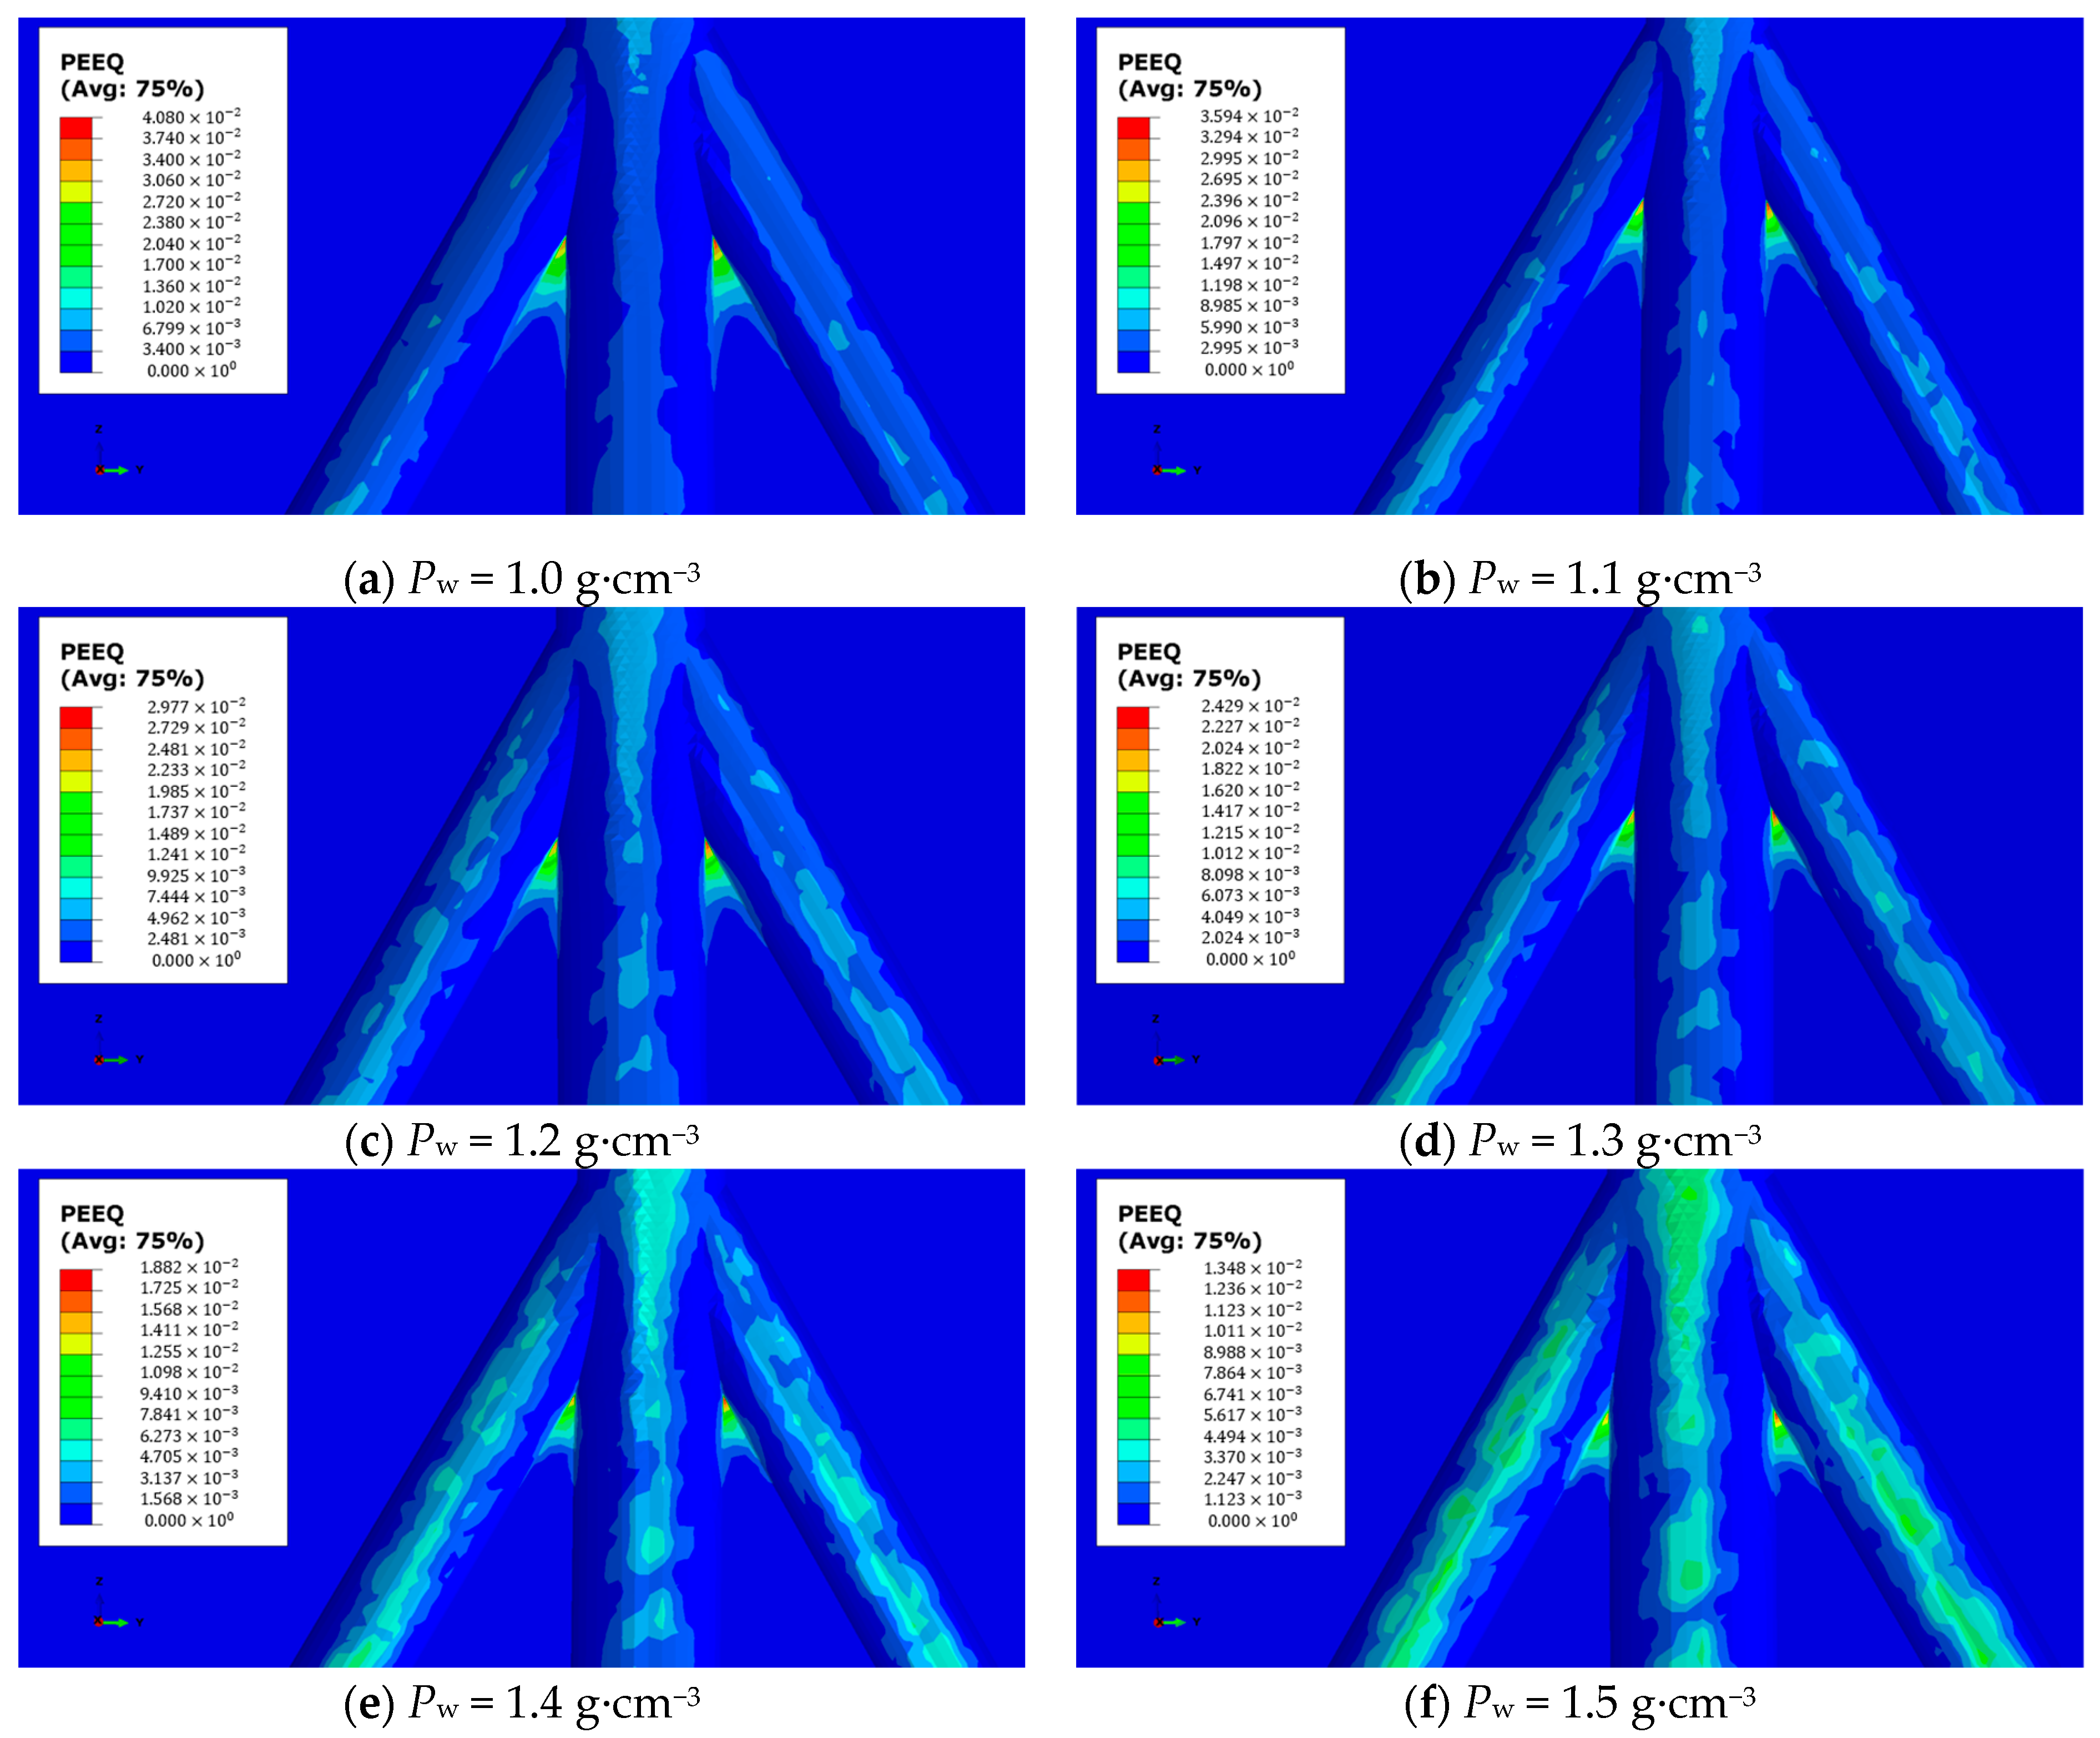
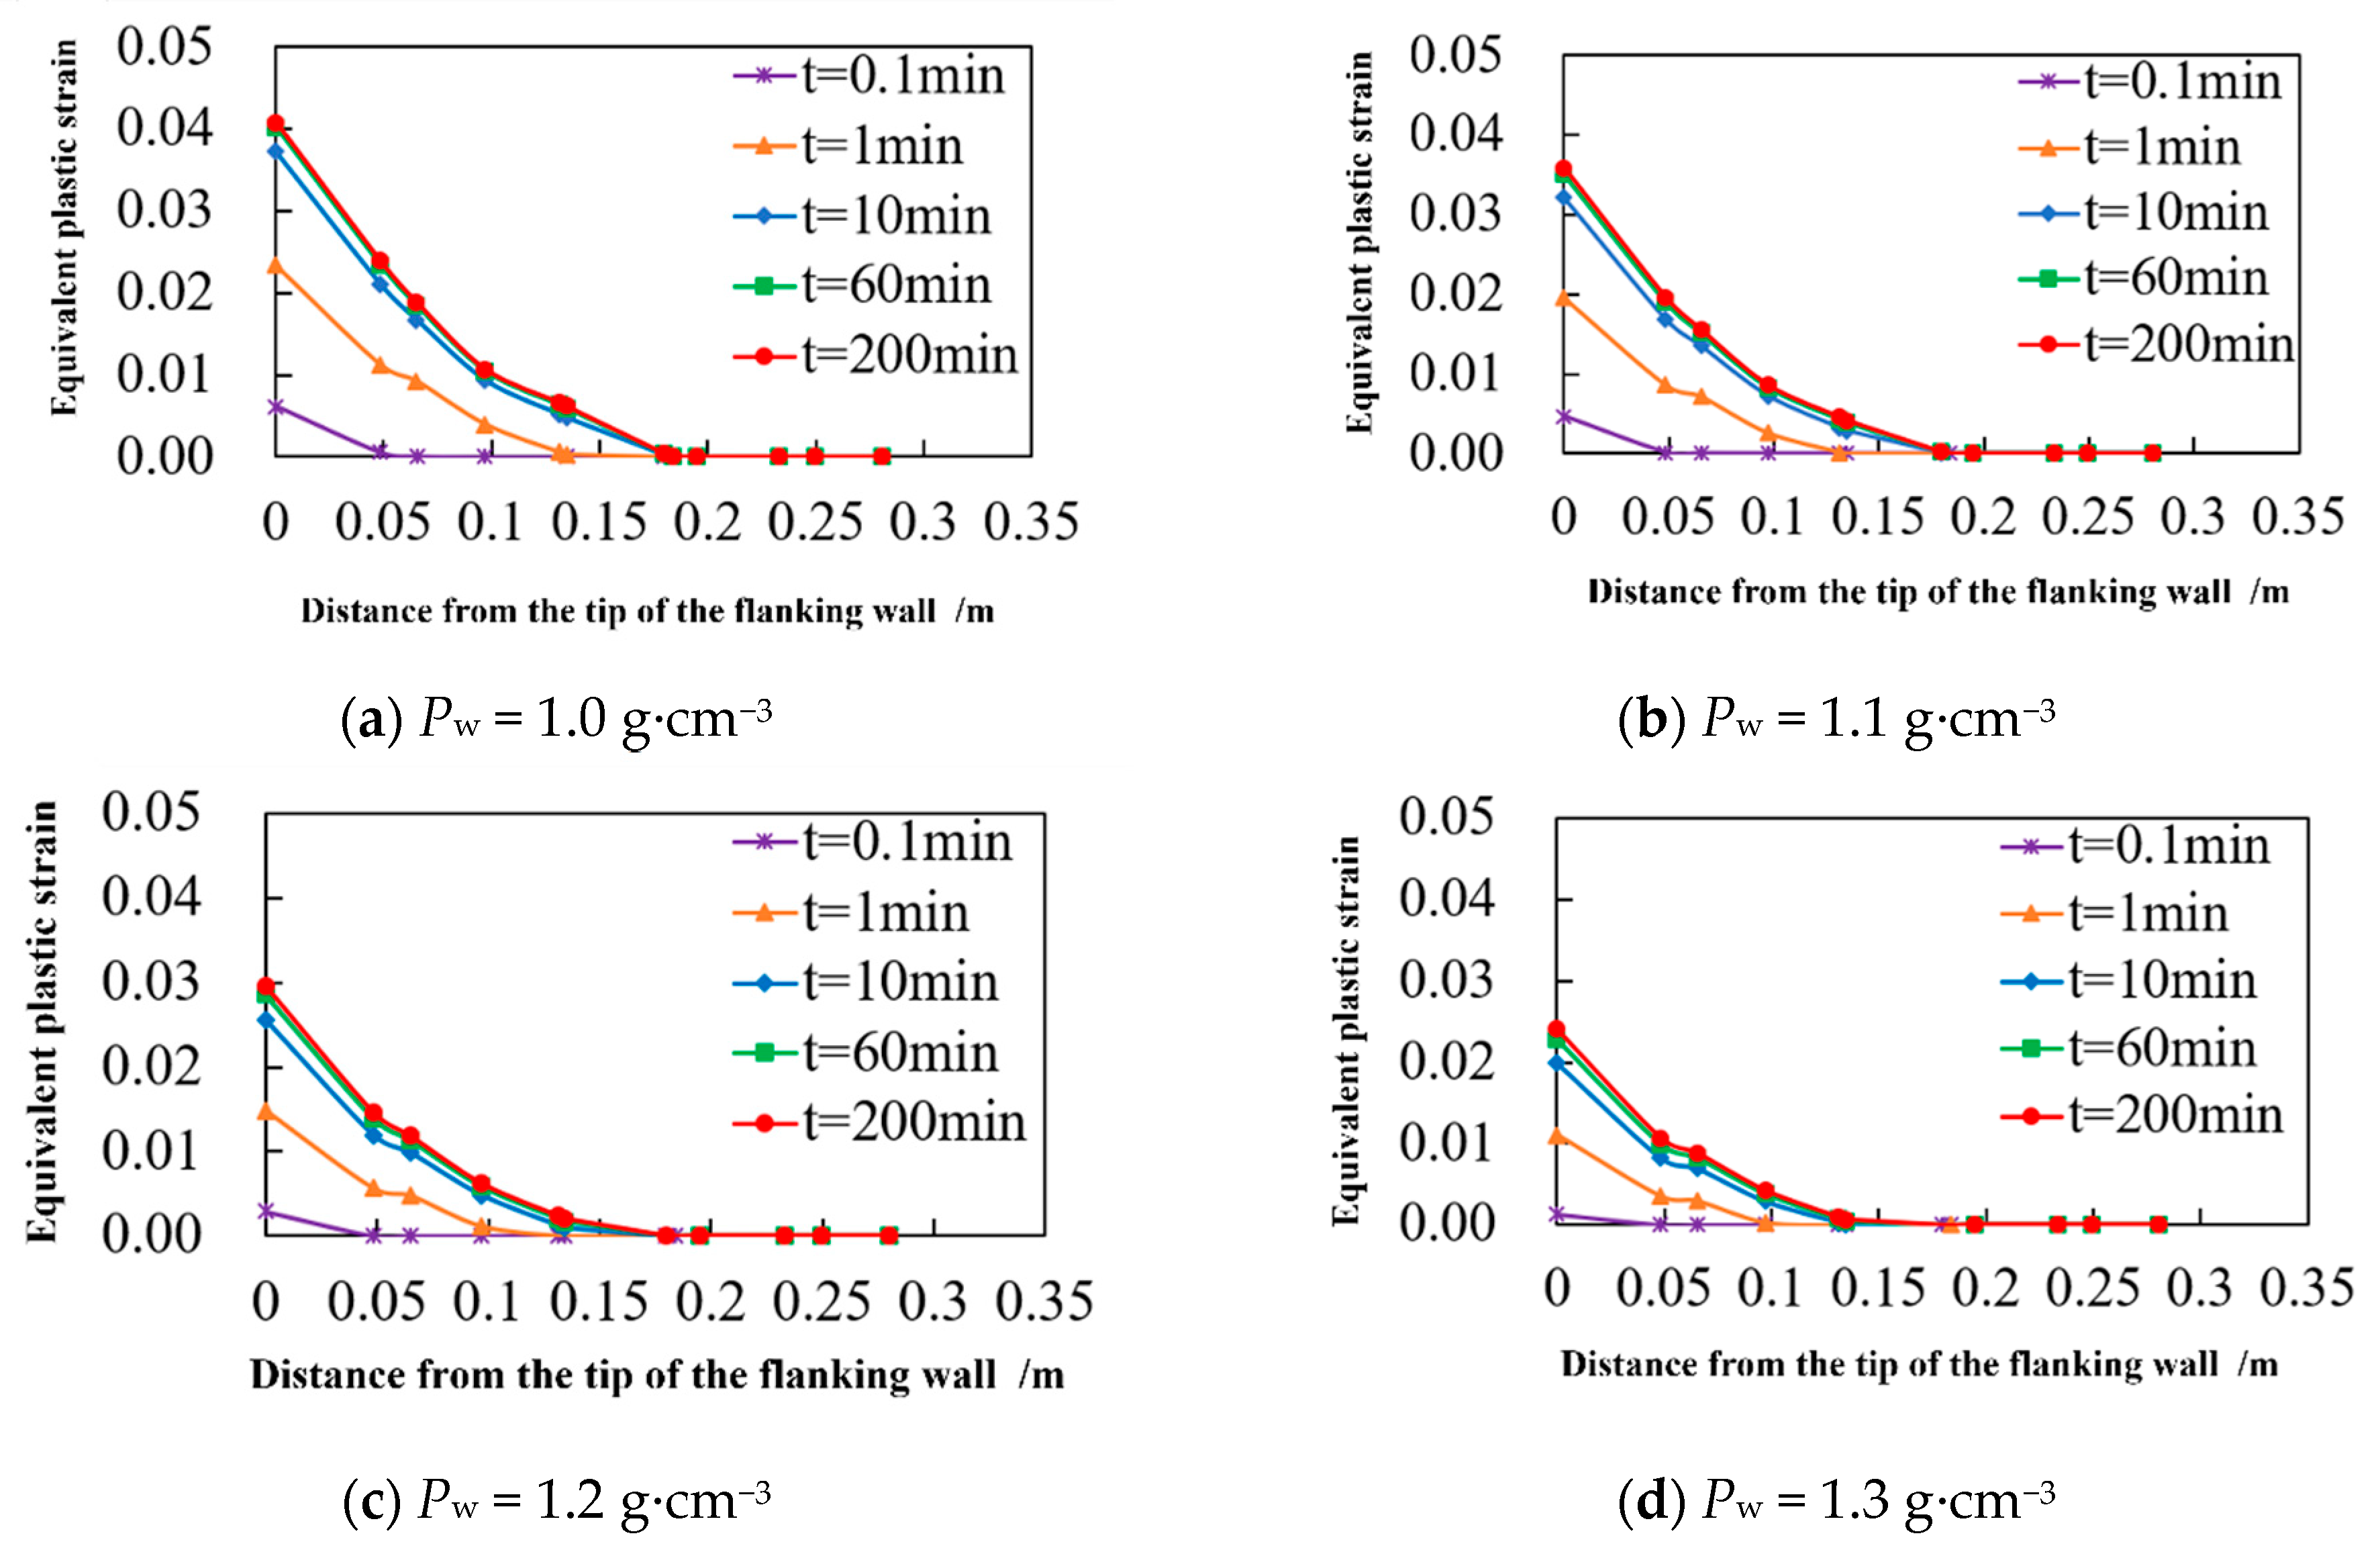
4.1. The Influence of Drilling Fluid Density

During drilling, the drilling fluid in the wellbore generates a hydrostatic pressure that supports the wellbore rock to balance the stress around the wellbore and prevent the surrounding rock mass of the wellbore from being destroyed due to unbalanced stress. If the drilling fluid is used improperly, the surrounding rock mass of the wellbore will be destroyed, and the instability forms of the wellbore include shear failure and tensile failure. When the density of the drilling fluid in the wellbore is too low and less than the formation collapse pressure, the drilling fluid column pressure is not sufficient to balance the formation pore pressure, causing the stress on the surrounding rock mass of the wellbore to exceed the rock’s own strength and leading to shear failure of the surrounding rock mass of the wellbore. For plastic formations, drilling fluid density that is too low can cause plastic deformation of the surrounding rock mass of the wellbore, resulting in wellbore shrinkage. When the density of the drilling fluid in the wellbore is too high and greater than the formation fracture pressure, the hydrostatic pressure generated by the drilling fluid will cause the circumferential stress of the surrounding rock mass of the wellbore to exceed the rock’s tensile strength, resulting in tensile failure of the surrounding rock mass of the wellbore.
Figure 14 shows the equivalent plastic strain distribution cloud chart of sandstone formation at different drilling fluid densities. It can be seen from the figure that with the increase in drilling fluid density, the plastic zone in the wellbore and the equivalent plastic strain near the interwall tip decreased significantly. This was because the higher the drilling fluid density, the stronger the supporting effect of the drilling fluid column pressure on the wellbore, the smaller the stress difference between the surrounding rock mass of the wellbore and the formation, and the lower the risk of wellbore instability. Affected by stress damage, fractures in the surrounding rock mass of the wellbore continuously generated, expanded, and interconnected, which also led to a sharp increase in the permeability of the surrounding rock mass in the damage zone. Therefore, the drilling fluid preferentially seeped into the interwall section, causing the pore pressure at the interwall section to increase rapidly. Therefore, the maximum equivalent plastic strain in the surrounding rock mass of the wellbore appeared at the interwall tip of the branch well, indicating that wellbore instability was likely to first occur at this location.
Figure 15 shows the variation curve of the maximum equivalent plastic strain in sandstone formation with different drilling fluid densities. It can be seen that with the increase in drilling fluid density, the maximum equivalent plastic strain at the branch well connection section decreased linearly. When the drilling fluid density in the branch wellbore increased from 1.0 g/cm3 to 1.5 g/cm3, the maximum equivalent plastic strain decreased from 0.041 to 0.014, a decrease of 65.8%. It can be seen that the drilling fluid density had a significant impact on the stability of the branch wellbore. The lower the drilling fluid density, the weaker the supporting effect of the drilling fluid in the wellbore on the wellbore, the greater the stress difference between the wellbore and the formation, the higher the degree of damage to the surrounding rock mass of the wellbore, and the higher the risk of wellbore instability.
Figure 16 shows the variation trend of equivalent plastic strain along the path at six different drilling fluid densities. According to the simulation results, the higher the drilling fluid density, the smaller the equivalent plastic strain, and consequently, the more stable the wellbore. The equivalent plastic strain decreased continuously with the increase in path distance, with the decrease rate gradually diminishing until it approached 0. When the drilling fluid density was 1.0 g/cm3 and the drilling time reached 1 min, the maximum equivalent plastic strain along the interwall path was 0.023, and the influence range of the plastic zone reached 0.134 m. When the drilling fluid density was 1.5 g/cm3 and the drilling time reached 1 min, the maximum equivalent plastic strain along the interwall path was 0.005, and the influence range of the plastic zone reached 0.065 m. It can be seen that with the increase in drilling fluid density, the influence range of plastic strain and equivalent plastic strain at the interwall section under the same time continuously decreased, and the stability of the branch wellbore gradually increased.
Figure 17 shows the variation curve of the maximum equivalent plastic strain with time in sandstone formation at different drilling fluid densities. It can be seen that with the increase in time, the maximum equivalent plastic strain at different drilling fluid densities increased rapidly at first and then slowly. When the drilling time exceeded 60 min, the maximum equivalent plastic strain tended to be stable, and no significant changes occurred. The maximum equivalent plastic strain at different drilling fluid densities increased significantly with time, and the lower the drilling fluid density, the greater the increase in the maximum equivalent plastic strain with time. This was because the lower the density of the drilling fluid in the wellbore, the weaker the supporting effect of the drilling fluid column pressure on the surrounding rock mass of the wellbore, the greater the stress difference between the formation and the wellbore, the more serious the stress concentration phenomenon in the surrounding rock mass of the wellbore, and the greater the degree of damage to the formation around the wellbore.
Although a higher drilling fluid density can reduce the risk of wellbore instability, increasing the drilling fluid density may also face the risk of well leakage or differential pressure sticking, and the mechanical drilling rate can be reduced. Therefore, it was necessary to take into account all factors comprehensively and effectively reduce the risk of wellbore instability by appropriately increasing the drilling fluid density.
The borehole fluid pressure used in this model was the static bottom-hole pressure, while in actual drilling, the circulating pressure loss caused by the continuous circulation of drilling fluid makes the bottom-hole pressure not exactly equal to the fluid column pressure. When converting the bottom-hole pressure into drilling fluid density, the ECD under different drilling fluids and well trajectories should be considered to more accurately provide a basis for the selection of drilling fluid density.

4.2. Influence of Permeability Coefficient

In order to study the influence of the permeability coefficient on wellbore stability, the stability of the branch wellbore was analyzed by changing the permeability coefficient of the rock. As shown in Figure 18, Figures (a) to (c) show the equivalent plastic strain nephograms of the branch well when the rock permeability coefficients were 1 × 10⁻¹⁰ m·s−1, 1 × 10⁻⁸ m·s−1, and 1 × 10⁻⁶ m·s−1, respectively. It can be seen that plastic zones were generated near the wellbore and the tip of the interwall, but the plastic zone did not change significantly with the increase in the permeability coefficient. The equivalent plastic strain at the tip of the branch well interwall was the largest, so the risk of wellbore instability here was the greatest, which is the place that needs the most attention and protective measures in the drilling process.
Five groups of permeability coefficients were selected to obtain the change trend diagram of the maximum equivalent plastic strain shown in Figure 19. The results showed that with the increase in the permeability coefficient, the maximum equivalent plastic strain gradually increased, but the increase rate continued to decrease. When the permeability coefficient was 1 × 10⁻¹⁰ m·s−1, the maximum equivalent plastic strain of the wellbore surrounding rock was 0.036, and when the permeability coefficient was 1 × 10⁻⁶ m·s−1, the maximum equivalent plastic strain of the wellbore surrounding rock was 0.038. During this process, the maximum equivalent plastic strain increased by 0.002, with an increase rate of 5.6%. It can be seen that the influence of the permeability coefficient on the stability of the branch wellbore was very limited.
In the formation rock with a low permeability coefficient, the fluid was difficult to pass through, so the various damages caused by the fluid flow in the rock under low flow were relatively small, which was more conducive to the stability of the wellbore. Therefore, the smaller the permeability coefficient, the better the stability of the branch wellbore. Therefore, the formation with a smaller permeability coefficient should be selected as the side drilling position for drilling the branch wellbore.

4.3. Influence of Cohesion

In order to study the influence of cohesion on the stability of the branch wellbore, the influence law of the cohesion of the rock material on the stability of the branch wellbore was analyzed by changing it. As shown in Figure 20, Figures (a) to (c) show the equivalent plastic strain nephograms of the branch well when the cohesions of the rock were 5 MPa, 6 MPa, and 7 MPa, respectively. It can be seen that with the increase in cohesion, the original cohesion and solidified cohesion of the wellbore surrounding rock continued to increase, the formation strength was greater, and the equivalent plastic strain area generated in the main wellbore and the branch wellbore was rapidly reduced. When the cohesion of the formation rock was 7 MPa, the equivalent plastic strain area in the branch wellbore disappeared, and the risk of wellbore instability in the branch wellbore was reduced to the minimum. Only a small part of the plastic area existed near the tip of the interwall. Therefore, in the drilling process, it is necessary to select the formation with a large cohesion of the rock for the drilling operation of the branch wellbore.
Five groups of cohesion forces of 5 MPa, 5.5 MPa, 6 MPa, 6.5 MPa, and 7 MPa were selected to obtain the change trend diagram of the maximum equivalent plastic strain of the branch well under different rock cohesion forces, as shown in Figure 21. The simulation results showed that with the increase in the rock cohesion, the maximum equivalent plastic strain at the connection section of the branch well continued to decrease. When the rock cohesion increased from 5 MPa to 7 MPa, the maximum equivalent plastic strain at the connection section of the branch well decreased from 0.042 to 0.033, and the decrease rate of the maximum equivalent plastic strain was 21.4%. It can be seen that the cohesion of the formation rock had a great influence on the plastic zone area and the maximum equivalent plastic strain in the branch well. The greater the cohesion of the formation rock, the stronger the ability of the rock to resist the shear failure of external stress, that is, the smaller the plastic strain area near the wellbore, the smaller the maximum equivalent plastic strain, and the more stable the wellbore.

5. Conclusions

(1) After the branch wellbore was drilled, a damaged area appeared in the surrounding rock of the wellbore, which was distributed in the main borehole, branch borehole, and the barrier wall. The most severe damage was concentrated at the tip of the barrier wall. Affected by stress damage, cracks in the surrounding rock of the wellbore continued to generate, propagate, and connect, which also led to a sharp increase in the permeability coefficient of the surrounding rock in the damaged area. Therefore, drilling fluid preferentially seeped towards the barrier wall, causing a rapid increase in pore pressure at the barrier wall.
(2) The thickness of the wellbore near the tip of the branch well barrier wall was thin, so the stress concentration was the most severe. As the distance from the tip of the barrier wall increased, the thickness of the barrier wall continued to increase, and the ability of the rock to resist external loads gradually strengthened. Therefore, with the increase in the path distance at the barrier wall, the damage factor, permeability coefficient, pore pressure, and equivalent plastic strain of the surrounding rock of the wellbore all decreased continuously.
(3) With the increase in drilling time, the damage factor, pore pressure, and equivalent plastic strain in the branch well showed a trend of increasing first rapidly, then slowly, and finally tended to be stable. Therefore, when drilling a branch well, the method of gradually increasing the density of the drilling fluid can be adopted, which can not only ensure the stability of the wellbore but also avoid affecting the rate of penetration due to excessive density.
(4) With the increase in drilling fluid density, under the supporting effect of the drilling fluid column pressure, the ability of the surrounding rock of the wellbore to resist external loads was enhanced, and the stress difference between the wellbore and the formation gradually decreased. Therefore, the maximum equivalent plastic strain of the surrounding rock of the wellbore continued to decrease, and the stability of the wellbore was improved. Therefore, when the branch wellbore is unstable, the stability of the wellbore can be maintained by increasing the density of the drilling fluid.
The smaller the permeability coefficient, the better the stability of the branch wellbore. This is mainly because fluids in formation rocks with low permeability coefficients are difficult to pass through, so various damages caused by fluid flow in rocks under low flow rates are relatively small, which is more conducive to wellbore stability. Therefore, the formation with a smaller permeability coefficient should be selected as the sidetrack position for drilling the branch wellbore.
The greater the cohesion of the formation rock, the stronger the ability of the rock to resist shear failure by external stress, that is, the smaller the plastic yield area near the wellbore, the more stable the wellbore.
(5) Since damage cracks are prone to occur at the connection of the branch well, which aggravates the seepage of drilling fluid and the instability of the wellbore, plugging materials can be added with the drill in the early stage of branch well drilling to reduce the seepage of drilling fluid at the connection section and the subsequent instability of the wellbore. However, it should be noted that the dosage of plugging materials should be reduced during the subsequent drilling of the reservoir section to prevent reservoir pollution.
(6) This study did not consider engineering factors such as the influence of rotating drill string, the plugging effect of drilling fluid filter cake filtration, and the impact of polymer inhibitors. In practical engineering, these influences cannot be ignored. This was the limitation of this paper, and future research can further improve the model by incorporating the above factors.

Author Contributions

Conceptualization, Q.T. and C.Y.; methodology, Q.T., C.H., and Y.M.; formal analysis, Q.T., R.D., and H.H.; investigation, R.D., H.H., and Q.T.; resources, J.C.; writing—original draft preparation, Q.T.; writing—review and editing, C.H., Y.M., and C.Y.; visualization, Q.T.; supervision, J.C. and C.Y.; project administration, C.Y.; funding acquisition, C.Y. All authors have read and agreed to the published version of the manuscript.

Funding

This research was supported by the Taishan Scholars Program of Shandong Province and Youth Innovation and Technology Support Program for Shandong Provincial Universities (2022KJ072) and the Fundamental Research Funds for the Central Universities (24CX05002A).

Data Availability Statement

The original contributions presented in this study are included in the article. Further inquiries can be directed to the corresponding authors.

Acknowledgments

This research was supported by the National Key Research and Development Program of China (2021YFC2800905), Taishan Scholars Program of Shandong Province, Youth Innovation and Technology Support Program for Shandong Provincial Universities (2022KJ072), and Fundamental Research Funds for the Central Universities (24CX05002A).

Conflicts of Interest

Authors Chao Han and Rongdong Dai were employed by the Sinopec Shengli Oilfield Company. Author Yang Meng was employed by the Shengli Oilfield Branch of Sinopec. The remaining authors declare that the research was conducted in the absence of any commercial or financial relationships that could be construed as a potential conflict of interest.

References

  1. Zhang, S.H. New development on multi-lateral drilling and completion technologies. Oil Drill. Prod. Technol. 1900, 23, 1–3. [Google Scholar]
  2. Song, X.Z.; Zhang, C.K.; Shi, Y.; Li, G. Production performance of oil shale in-situ conversion with multilateral wells. Energy 2019, 189, 116145. [Google Scholar] [CrossRef]
  3. Almedallah, M.; Altaheini, S.K.; Clark, S.; Walsh, S. Combined stochastic and discrete simulation to optimise the economics of mixed single-horizontal and multilateral well offshore oil developments. Pet. Explor. Dev. 2021, 48, 1183–1197. [Google Scholar] [CrossRef]
  4. Wang, G.Y. The Multi-branch Well Drilling Technical Overview and the Latest Progress. Offshore Oil 2006, 26, 100–104. [Google Scholar]
  5. Chen, J.; Wu, G.; Zuo, K. The technology development of level 5 multilateral well. Oil Field Equip. 2019, 48, 80–84. [Google Scholar]
  6. Diggins, E. Classification provides framework for ranking multilateral complexity and well type. Oil Gas J. 1997, 95, 97. [Google Scholar]
  7. JPT Staff. Multilateral TAML levels reviewed, slightly modified. J. Pet. Technol. 2002, 54, 24–28. [Google Scholar] [CrossRef]
  8. Yin, H.; Huang, J.Z.; Liu, H. Wellbore stability of juncture of multilateral drilling well. Sci. Technol. Eng. 2012, 12, 4616–4619. [Google Scholar]
  9. Li, W.F. Analysis of stability of wellface of fish-bone multiple lateral horizontal wells. China Coalbed Methane 2012, 9, 17–20. [Google Scholar]
  10. Goshtasbi, K.; Elyasi, A.; Naeimipour, A. 3D numerical stability analysis of multi-lateral well junctions. Arab. J. Geosci. 2013, 6, 2981–2989. [Google Scholar] [CrossRef]
  11. Goshtasbi, K.; Elyasi, A.; Naeimipour, A. Stability assessment of a dual-opposing well junction. Pet. Sci. Technol. 2014, 32, 790–796. [Google Scholar] [CrossRef]
  12. Mohamad-Hussein, A.; Heiland, J. 3D finite element modelling of multilateral junction wellbore stability. Pet. Sci. 2018, 15, 801–814. [Google Scholar] [CrossRef]
  13. Wu, X.Y.; Lian, Z.H.; Jiang, W.; Ren, R.K. The fluid-solid coupling modelling and analysis of the connecting section in multilateral wells. China Pet. Mach. 2011, 39, 28–31. [Google Scholar]
  14. Wei, C.X.; Lian, Z.H.; Lin, T.J.; Wang, Y.M.; Guo, Y.R. Analysis of fluid-solid coupling seepage field for branch wells. Spec. Oil Gas Reserv. 2012, 19, 100–102+156. [Google Scholar]
  15. Xu, K.; Xiong, J.; Xu, H.; Lue, F.; Liu, H. Borehole stability research of plane dual-opposing laterals junction. J. Southwest Pet. Univ. (Sci. Technol. Ed.) 2012, 34, 132–138. [Google Scholar]
  16. Hoang, S.K.; Abousleiman, Y.N.; Ashraf, A.T. Multilaterals Drilling and Sustainable Openhole Production from Theory to Field-Case Studies. SPE J. 2010, 15, 878–892. [Google Scholar] [CrossRef]
  17. Zhang, G.Q. Plastic mechanics model for wellbore stability analysis of branched wells. J. China Univ. Pet. (Ed. Nat. Sci.) 2013, 37, 81–87. [Google Scholar]
  18. Oyedokun, O. Coupling a Void Growth Model with an Elastoplastic Material Model for a Simultaneous Prediction of the Borehole Plastic Zone and Critical Collapse Pressure. Geoenergy Sci. Eng. 2024, 233, 212448. [Google Scholar] [CrossRef]
  19. Haghgouei, H.; Lavrov, A.; Nermoen, A. Effect of Drill String Lateral Vibrations on Wellbore Stability and Optimal Mud Pressure Determination. Geoenergy Sci. Eng. 2025, 247, 213691. [Google Scholar] [CrossRef]
  20. Zhang, C.; Zhao, Y.; Gao, K.; Tian, B.; He, H.; Wang, J.; Qin, J.; Yin, Q. Experimental and Numerical Analyses of Rock Damage Behavior and Fragmentation Mechanism Under Enlarged Hole Impact Conditions. Geoenergy Sci. Eng. 2025, 249, 213778. [Google Scholar] [CrossRef]
  21. Han, L. Study on Stability of Shale Well Walls Based on Fluid-Structure Interaction Theory. Master’s Thesis, China University of Petroleum, Dongying, China, 2021. [Google Scholar]
  22. Ma, C. Wellbore Stability of Fragmented Coal Evaluation Under the Couple Effect of Seepage And Stress. Master’s Thesis, China University of Petroleum, Beijing, China, 2016. [Google Scholar]
  23. Ghassemi, A.; Zhang, Q. A Transient Fictitious Stress Boundary Element Method for Porothermoelastic Media. Eng. Anal. Bound. Elem. 2004, 28, 1363–1373. [Google Scholar] [CrossRef]
  24. Zhou, X.; Ghassemi, A. Finite Element Analysis of Coupled Chemo-Poro-Thermo-Mechanical Effects around a Wellbore in Swelling Shale. Int. J. Rock Mech. Min. Sci. 2009, 46, 769–778. [Google Scholar] [CrossRef]
  25. Zeng, Y.; Cai, M.; Zhong, L. A Coupled Method Combining Crouzeix-Raviart Nonconforming and Node Conforming Finite Element Spaces for Biot Consolidation Model. J. Comput. Math. 2024, 42, 911–931. [Google Scholar] [CrossRef]
  26. Jia, S.P. Hydro-mechanical coupled creep damage constitutive model of Boom clay, back analysis of model parameters and its engineering application. Chin. J. Rock Mech. Eng. 2009, 28, 2594. [Google Scholar]
  27. Souley, M.; Homand, F.; Pepa, S.; Hoxha, D. Damage-induced permeability changes in granite: A case example at the URL in Canada. Int. J. Rock Mech. Min. Sci. 2001, 38, 297–310. [Google Scholar] [CrossRef]
  28. Oda, M.; Takemura, T.; Aoki, T. Damage growth and permeability change in triaxial compression tests of Inada granite. Mech. Mater. 2002, 34, 313–331. [Google Scholar] [CrossRef]
  29. Sun, Q.; Jiang, Z.Q.; Zhu, S.Y. Experimental study on permeability of soft rock of Beizao Coal Mine. Chin. J. Geotech. Eng. 2012, 34, 540–545. [Google Scholar]
  30. Zhao, Z.Y.; Yan, C.L.; Xue, M.Y.; Sun, B.; Cheng, Y.; Han, Z.; Yang, J.; Chen, Y.; Zhang, Q. Geological Carbon Sequestration: Experimental Study of the Mechanical Response and Microscopic Mechanism of Shales Subjected to Gaseous CO2 and ScCO2. Energy Fuels 2025, 39, 6388–6399. [Google Scholar] [CrossRef]
  31. Jia, S.P.; Chen, W.Z.; Yu, H.D.; Li, X.L. Research on seepage-stress coupling damage model of Boom clay during tunneling. Rock Soil Mech. 2009, 30, 19–26. [Google Scholar]
  32. Liu, S.G.; Peng, Z.G.; Li, Z.G.; Chen, H. Numerical analysis of coalbed methane horizontal branch well stability. J. Liaoning Tech. Univ. Nat. Sci. 2015, 34, 769–773. [Google Scholar]
  33. Jing, L. A Review of Techniques, Advances and Outstanding Issues in Numerical Modelling for Rock Mechanics and Rock Engineering. Int. J. Rock Mech. Min. Sci. 2003, 40, 283–353. [Google Scholar] [CrossRef]
  34. Huang, S.H. The Analysis of Mechanical Parameters in Unconsolidated Sandstone. Master’s Thesis, China University of Petroleum, Beijing, China, 2016. [Google Scholar]
Figure 1. Schematic diagram of the validation model.
Processes 13 02172 g001
Figure 2. Stress-strain curve under triaxial compression.
Processes 13 02172 g002
Figure 3. Mises stress distribution cloud chart with a drilling fluid density of 1.1 g/cm3.
Processes 13 02172 g003
Figure 4. Evolution of the formation damage factor with time.
Processes 13 02172 g004
Figure 5. Schematic diagram of the path.
Processes 13 02172 g005
Figure 6. Variation of the formation damage factor along the path at different times.
Processes 13 02172 g006
Figure 7. Variation of damage along the path at different drilling fluid densities.
Processes 13 02172 g007
Figure 8. Evolution of formation permeability with time.
Processes 13 02172 g008
Figure 9. Variation of formation permeability along the path at different times.
Processes 13 02172 g009
Figure 10. Evolution of the formation pore pressure with time.
Processes 13 02172 g010
Figure 11. Variation of formation pore pressure along the path at different times.
Processes 13 02172 g011
Figure 12. Evolution of equivalent plastic strain around the wellbore with drilling time.
Processes 13 02172 g012
Figure 13. Variation of equivalent plastic strain along the path at different drilling times.
Processes 13 02172 g013
Figure 14. Evolution of equivalent plastic strain around the wellbore with drilling fluid density.
Processes 13 02172 g014
Figure 15. Variation of maximum equivalent plastic strain with drilling fluid density.
Processes 13 02172 g015
Figure 16. Variation of equivalent plastic strain along the path at different drilling fluid densities.
Processes 13 02172 g016aProcesses 13 02172 g016b
Figure 17. Variation of maximum equivalent plastic strain with time at different drilling fluid densities.
Processes 13 02172 g017
Figure 18. Equivalent plastic strain distribution under different permeability coefficients.
Processes 13 02172 g018aProcesses 13 02172 g018b
Figure 19. Variation curve of the equivalent plastic strain with different permeability coefficients.
Processes 13 02172 g019
Figure 20. Equivalent plastic strain distribution under different cohesion forces.
Processes 13 02172 g020aProcesses 13 02172 g020b
Figure 21. Change curve of the equivalent plastic strain under different cohesions.
Processes 13 02172 g021
Table 1. Basic parameters of model analysis.
Model ParameterValue
Density/(kg·m−3)2300
Elastic Modulus/MPa6000
Poisson’s Ratio0.25
Permeability/(m·s−1)1 × 10−6
Porosity0.5
Internal Friction Angle/°35
Effective Stress Coefficient0.8
Cohesion/MPa5.5
Formation Pressure/MPa12.6
Overburden Pressure MPa29
Maximum Horizontal Principal Stress/MPa26
Minimum Horizontal Principal Stress/MPa21
Disclaimer/Publisher’s Note: The statements, opinions and data contained in all publications are solely those of the individual author(s) and contributor(s) and not of MDPI and/or the editor(s). MDPI and/or the editor(s) disclaim responsibility for any injury to people or property resulting from any ideas, methods, instructions or products referred to in the content.

