Article

Gas Prediction in Tight Sandstone Reservoirs Based on a Seismic Dispersion Attribute Derived from Frequency-Dependent AVO Inversion

1
Sinopec Geophysical Corporation, Beijing 100013, China
2
College of Geophysics, Chengdu University of Technology, Chengdu 610059, China
3
College of Geoexploration Science and Technology, Jilin University, Changchun 130026, China
*
Author to whom correspondence should be addressed.
Processes 2025, 13(7), 2210; https://doi.org/10.3390/pr13072210
Submission received: 30 April 2025 / Revised: 20 June 2025 / Accepted: 7 July 2025 / Published: 10 July 2025

Abstract

Accurate gas prediction is crucial for identifying gas-bearing zones in tight sandstone reservoirs. Traditional seismic techniques, primarily grounded in elastic theory, often overlook inelastic dispersion effects inherent to such formations. To overcome this limitation, we introduce a gas prediction approach utilizing a dispersion attribute derived from frequency-dependent inversion based on an AVO equation parameterized by a gas indicator and related properties. Rock physics modeling, based on multi-scale fracture theory, reveals the frequency-dependent gas indicator is highly responsive to variations in porosity and gas saturation. Seismic AVO simulations exhibit distinguishable signatures corresponding to these variations, supporting the potential to estimate reservoir properties from pre-stack seismic data. Synthetic data tests confirm that the values of the proposed dispersion attribute increase with increasing porosity and gas saturation. Additionally, the calculated dispersion attribute exhibits a strong positive correlation with gas content, validating its effectiveness for gas evaluation. Field application results further demonstrate that the proposed dispersion attribute shows prominent anomalies in sandstone reservoirs with high gas content. Compared to the conventional P-wave dispersion attribute, the proposed dispersion attribute exhibits superior reliability in detecting gas-rich zones. These results demonstrate the utility of the method in predicting gas-bearing regions in tight sandstone reservoirs.

1. Introduction

With the continuous rise in global energy demand, tight sandstone gas reservoirs have emerged as a vital unconventional hydrocarbon resource, offering substantial exploration potential and favorable development prospects. The basis for high-quality tight sandstone reservoirs is significant gas enrichment, as sufficient gas accumulation is essential to sustain productivity. However, tight sandstone reservoirs are often characterized by low porosity, low permeability, intricate pore structures, and strong heterogeneity. Such geological complexities pose significant challenges to the accurate identification of sweet spots [1,2].
At present, the integration of rock physics methodologies provides an effective framework for quantifying fluid-related variations in elastic and seismic responses. Rock physics templates (RPTs) have been extensively utilized for the identification of porosity and fluid [3,4,5,6]. Additionally, numerous fluid indicators, derived from various combinations of elastic parameters, have demonstrated success in identifying reservoir fluids [7,8,9,10,11]. Concurrently, the direct estimation of reservoir properties from pre-stack seismic data has gained prominence due to its potential to minimize cumulative interpretation errors. As a result, AVO equations incorporating different fluid indicators have been developed to facilitate the direct inversion of reservoir parameters [12,13,14,15,16,17].
The aforementioned approaches primarily depend on elastic properties for fluid prediction. However, numerous studies have shown that gas saturation and porosity can induce observable seismic wave dispersion and attenuation. Laboratory experiments have validated the significant influence of fluids on P-wave velocity dispersion and attenuation behavior [18]. Concurrently, several theories have been proposed to describe frequency-dependent velocity variations resulting from fluid mobility within hydrocarbon-bearing formations [19,20,21,22,23]. Moreover, studies that integrate rock physics with seismic forward modeling have revealed that fluid-induced dispersion and attenuation exert notable effects on AVO responses [24,25]. These findings suggest that incorporating seismic wave dispersion into the development of seismic analysis methods offers a promising avenue for improving gas detection in tight sandstone reservoirs.
Contemporary seismic analysis techniques often utilize a frequency-dependent amplitude variation with offset (FD-AVO) methods to extract dispersion attributes from seismic data. The foundational FD-AVO framework was initially proposed by Wilson [26], and subsequent developments have introduced a range of dispersion attributes linked to P-wave reflection behavior [27,28,29,30,31,32,33,34,35,36] and fluid bulk modulus variations [37,38], primarily aimed at hydrocarbon detection. In recent years, machine learning methods have been incorporated into the framework of the FD-AVO inversion method [39,40]. Nonetheless, a key limitation of these existing approaches is their predominant focus on fluid effects while neglecting the influence of porosity in gas prediction. To achieve a more accurate evaluation of gas content, it is crucial to design dispersion attributes that account for the combined influence of fluid properties and porosity. The aforementioned approaches have been applied across different lithologies, including carbonates [3,4,5], sandstone [6,9,10,11,12,13,14,15,17,18,28,29,30,31,33,35,37,38,39,40], shale [27,34], and volcanic rocks [32,36]. Furthermore, seismic methods for fluid detection in various reservoirs have been thoroughly summarized and reviewed [41].
This study introduces a method for gas prediction in tight sandstone reservoirs using seismic dispersion attributes derived from a FD-AVO inversion method. Initially, an FD-AVO inversion framework is established by extending an AVO equation parameterized by a gas indicator and other elastic properties into the frequency domain to extract a dispersion attribute linked to gas content. The effectiveness of the proposed dispersion attribute for gas content identification is then assessed using synthetic seismic data. Subsequently, the method is applied to field data for gas prediction, with well log-derived gas content values serving to validate the reliability of the inversion results. Finally, a comparative analysis is conducted to demonstrate the advantages of the proposed dispersion attribute over conventional P-wave velocity dispersion.

2. Methods

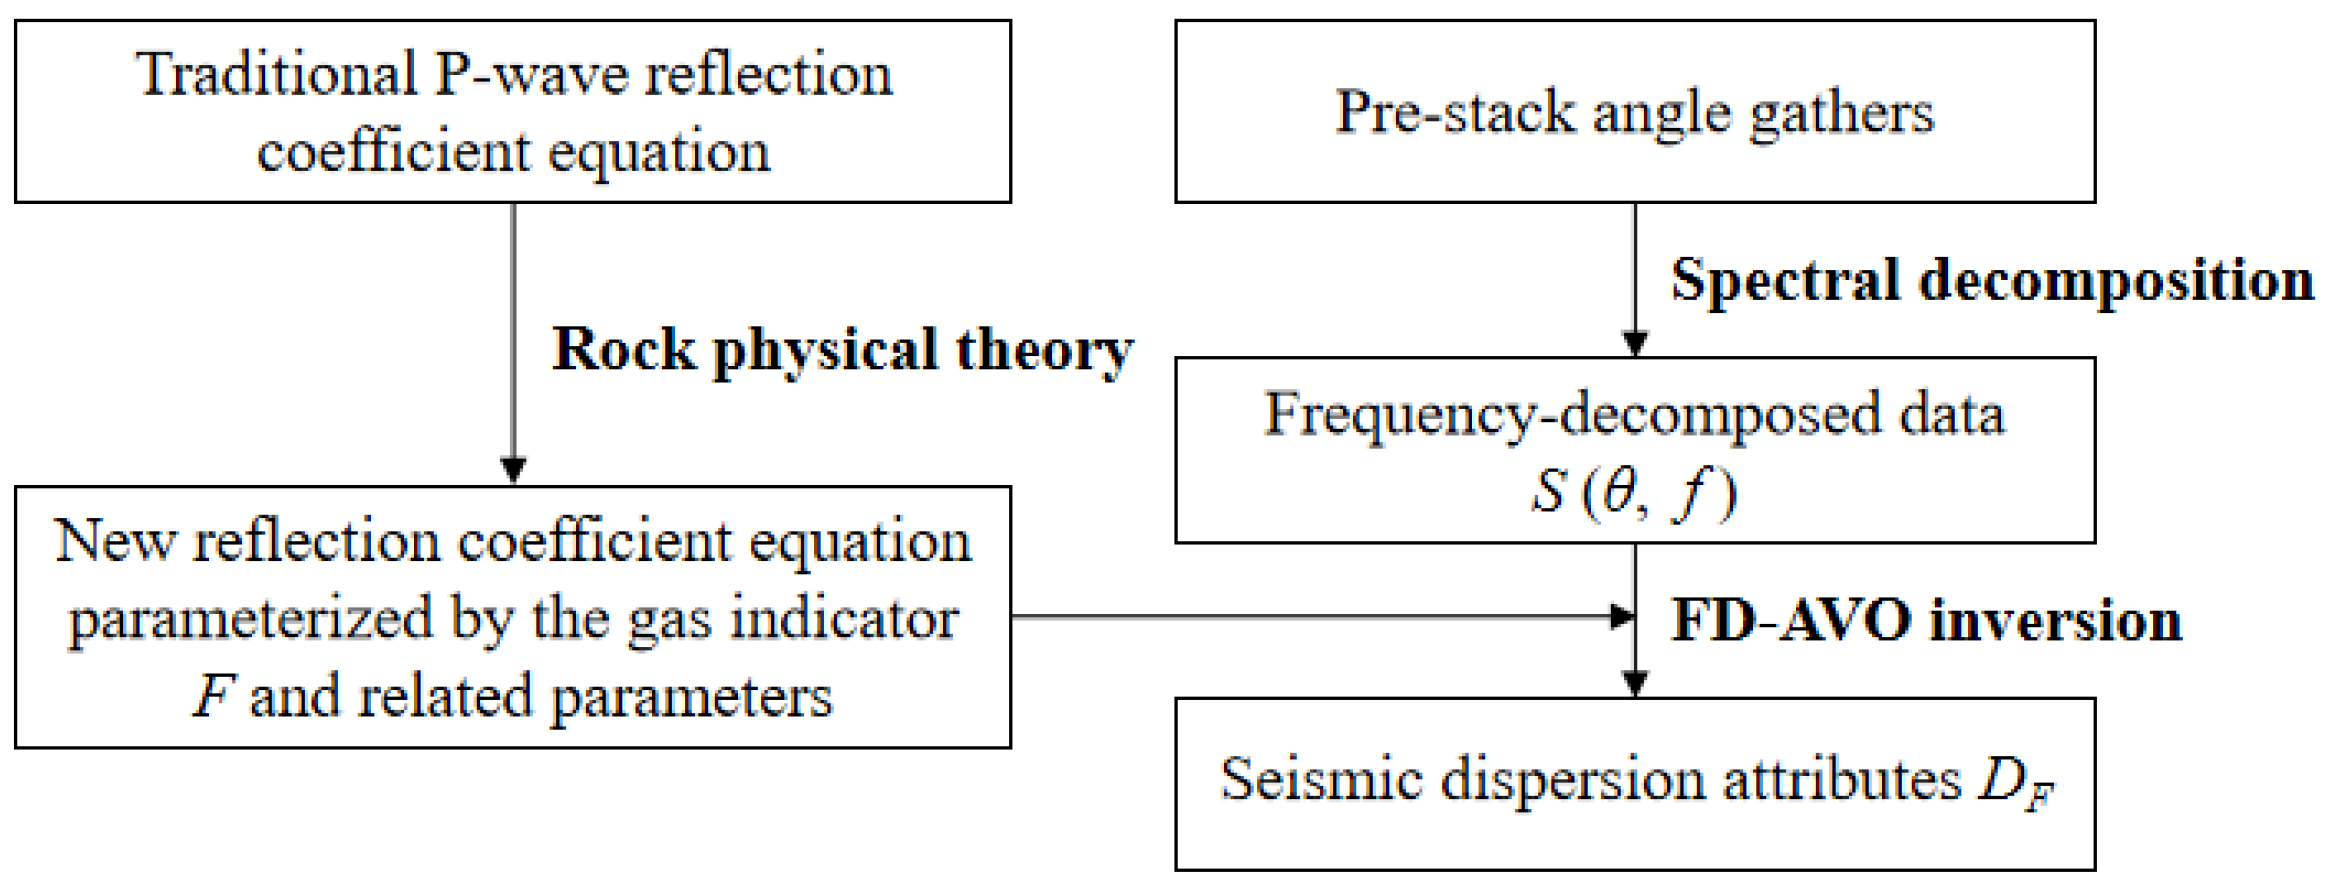
2.1. FD-AVO Inversion of Dispersion Attribute DF for Gas Prediction

Figure 1 illustrates the framework for extracting the dispersion attribute DF using the FD-AVO inversion method. Based on the traditional P-wave reflection coefficient equation, a new AVO equation parameterized by indicators of gas content, porosity, and related elastic parameters has been proposed. Subsequently, the pre-stack seismic data are subjected to spectral decomposition. The resulting spectral components are used to compute the dispersion attribute DF through the FD-AVO inversion method.
Jin et al. [17] introduced a gas indicator F for the prediction of gas content in tight sandstones:
F = 1 K f μ
where Kf represents the fluid bulk modulus and μ denotes the shear modulus of the rock skeleton. Based on this, an AVO approximation was proposed to enable the direct inversion of the indicator F:
R PP θ = 1 + tan 2 θ γ s a t 2 γ d r y 2 4 γ s a t 2 Δ F F 1 + tan 2 θ γ s a t 2 2 γ d r y 2 + 8 sin 2 θ 2 γ s a t 2 Δ ϕ I S ϕ I S + 1 + tan 2 θ γ s a t 2 γ d r y 2 + 4 sin 2 θ 2 γ s a t 2 tan 2 θ 2 Δ ρ ρ + 1 + tan 2 θ 3 γ s a t 2 5 γ d r y 2 + 16 sin 2 θ 4 γ s a t 2 Δ ϕ ϕ
where IS is the S-wave impedance, ρ represents density, ϕ is porosity, and θ denotes incidence angle; γsat and γdry are the P- and S-wave velocity ratio of saturated rock and dry frame, respectively.
Based on Equation (2), the frequency-dependent AVO equation can be expressed as follows:
R PP θ , ω R PP θ , ω 0 + A θ ω ω 0 D F + B θ ω ω 0 D ϕ I S
where
A θ = 1 + tan 2 θ γ sat 2 γ dry 2 4 γ sat 2
B θ = 1 + tan 2 θ γ sat 2 2 γ dry 2 + 8 sin 2 θ 2 γ sat 2
D F = ω Δ F F
D ϕ I S = ω Δ ϕ I S ϕ I S
Derivations from Equation (2) to (7) are provided in Appendix A.

2.2. Multi-Scale Fracture Theory

Within the multi-scale fracture theory proposed by Chapman [42,43], the effective stiffness matrix for an equivalent medium containing pores, microcracks, and fractures is expressed as follows:
C ijkl = C ijkl 0 ϕ p C ijkl 1 ε c C i ijkl 2 ε f C ijkl 3
where C0ijkl corresponds to the isotropic background stiffness coefficient; C1ijkl, C2ijkl, and C3ijkl characterize the contributions of pore, microcrack, and fracture, respectively; ϕp represents porosity; εc quantifies microcrack density; and εf describes fracture density.
Scanning Electron Microscopy (SEM) analysis (Figure 2a) of the study area reveals a variety of pore types within the tight sandstones, including dissolution-enhanced intragranular pores, dissolved intergranular pores, and tectonic fractures. This pore system can be effectively modeled using a dual-porosity approach, where total porosity (ϕ) is partitioned into spherical pores (ϕp) and microcrack porosity (ϕc), as illustrated in Figure 2b. Accordingly, Equation (8) can be simplified by omitting the large-scale fracture parameter εf:
C ijkl = C ijkl 0 ϕ p C i ijk 1 ε c C ijkl 2
The frequency-dependent P-wave velocity VP(ω) and S-wave velocity VS(ω) are obtained from the stiffness components C3333(ω) and C4444(ω) in Equation (9):
V P ω = C 3333 ω ρ s
V S ω = C 2323 ω ρ s
where ρs denotes the density of the fluid-saturated tight sandstone.

3. Results

3.1. Synthetic Data Tests

Based on the multi-scale fracture theory outlined in Section 2.2, we quantitatively analyze the frequency-dependent characteristics of the elastic wave velocity and the indicator F in tight sandstone reservoirs. Figure 3a shows the computed VP dispersion curves at three different porosity (ϕ) values while maintaining a constant gas saturation (Sg). The corresponding frequency-dependent variations in the indicator F are presented in Figure 3b. The analysis reveals that the dispersion characteristics gradually intensify as porosity increases.
Figure 4 further explores the frequency-dependent VP and F characteristics under varying Sg conditions, with a constant ϕ. Both VP and F exhibit notable frequency-dependent variations as Sg increases. The observed frequency-dependent behaviors of VP and F under different gas saturations and porosities provide valuable insights for gas prediction using seismic dispersion attributes.
Moreover, the efficacy of the proposed dispersion attributes derived from FD-AVO inversion is validated through synthetic data tests. A layered model of a tight sandstone layer encased in mudstone is depicted in Figure 5. The P-wave velocity, S-wave velocity, and density of the mudstone are 4200 m/s, 2000 m/s, and 2600 kg/m3, respectively. In contrast, the P-wave velocity, S-wave velocity, and density of the tight sandstone are 4500 m/s, 2200 m/s, and 2460 kg/m3. Synthetic seismic data are generated by integrating the propagator matrix method with rock physics modeling [44,45]. The tight sandstone reservoir is modeled with a thickness of 10 m. For seismic simulation, a Ricker wavelet with a central frequency of 40 Hz is employed, and the incidence angles range up to 30°.
Figure 6a–c show the simulated AVO responses for three reservoir models with different porosities (ϕ = 0.05, 0.1, and 0.15) at a fixed gas saturation (Sg = 0.7). The tight sandstone reflection signatures exhibit clear angle-dependent amplitude variations. Analysis reveals that reflection amplitudes attenuate with an increasing incidence angle across all porosity conditions. Additionally, models with higher porosity show enhanced amplitude attenuation at higher angles, indicating porosity-dependent AVO response characteristics. Figure 6d presents the variations in the dispersion attribute DF for the three models with different porosities. The inversion process was carried out using the method outlined in Section 2.1, with a frequency bandwidth of 5–100 Hz. Quantitative analysis shows more pronounced DF responses in models with higher porosity in the tight sandstone.
Figure 7a–c present the modeled AVO responses for distinct gas saturation values (Sg = 0.3, 0.5, and 0.7) at a fixed porosity (ϕ = 0.15). The analysis reveals that waveform polarity reversals occur at high incidence angles for the low gas saturation model (Sg = 0.3). Additionally, reflection amplitudes increase at higher angles for models with higher Sg values. Figure 7d shows the calculated DF values, which progressively increase with higher Sg conditions.
Figure 8 further illustrates the root-mean-square (RMS) magnitudes of the dispersion attribute DF under conditions of varying ϕ and Sg. The DF response shows a clear enhancement with increasing values of both ϕ and Sg, indicating its dependence on these parameters. This behavior supports the conclusion that DF serves as an effective indicator for estimating gas content (Sg × ϕ).
Furthermore, the dispersion attribute DF, computed for varying Sg and ϕ conditions in Figure 8, is transformed into a cross-plot of DF versus Sg × ϕ, as shown in Figure 9. The relationship demonstrates a nonlinear growth pattern, characterized by an initial steep increase followed by a more gradual rise. The red trendline represents the central tendency, and these results confirm a distinct positive correlation between DF and Sg × ϕ.

3.2. Real Data Applications

The methodology developed in this study is applied to field data from a tight sandstone gas reservoir. Figure 10 shows the two-way travel time (TWT) contours of the target reservoir horizon. The TWT distribution reveals a relatively smooth structural relief across the study area, with three gas-producing wells (B, C, and D) and two no gas-producing wells (A and E) indicated.
Figure 11, Figure 12 and Figure 13 present comparative analyses of logging data, cross-well pre-stack seismic traces, predicted dispersion attribute DF, DVp results, and the volumetric fraction of minerals for the three wells. The elastic properties of clay and quartz are shown in Table 1 [46]. The seismic inversion process utilizes a frequency bandwidth of 5–100 Hz. The frequency range used is optimized empirically, according to the bandwidth and characteristics of real seismic data. Notably, compared to DVp, the seismically derived DF shows a strong agreement with logging data for gas content (Sg × ϕ). The intuitive comparison results confirm the superiority of DF over DVp. The target intervals with high Sg × ϕ values can be consistently identified by high-value DF anomalies. In comparison, Figure 14 presents a cross-plot of Sg × ϕ versus VP/VS and Sg × ϕ versus λρ, demonstrating that the conventional elastic parameters VP/VS and λρ show less sensitivity in effectively indicating gas content. These results emphasize the potential of DF as a more effective indicator for identifying gas-bearing zones than both DVp and traditional elastic parameters.
Figure 15 presents the seismic profile across wells A, B, and C, with the bounding surfaces of the target reservoir delineated by two black horizons. Additionally, Figure 16 shows the corresponding time–frequency analysis results obtained through continuous wavelet transform (CWT), displaying spectral decompositions at six discrete frequencies: 10, 20, 30, 40, 50, and 60 Hz. These spectrally decomposed seismic attributes serve as the foundational data for FD-AVO inversion.
For comparison, Figure 17 and Figure 18 show the dispersion attributes DF calculated using the method presented in this study and DVp derived from the conventional framework [34]. Figure 19 and Figure 20 display the VP/VS and λρ, both computed from the elastic inversion results. The results are superimposed with Sg × ϕ logging data. It is observed that gas-bearing tight sandstone formations within the target zones exhibit high DF and DVp and low VP/VS and λρ responses. In comparison, DF anomalies demonstrate an improved sensitivity to the zones with high gas content than DVp, VP/VS, and λρ, as evidenced by the close alignment between elevated DF values and productive intervals with high Sg × ϕ in Wells B, C, and D. Meanwhile, the tight formations in dry wells A and E with very low Sg × ϕ show no DF anomalies in the target interval.

4. Discussion

Accurate gas prediction is crucial for delineating gas-bearing zones in tight sandstone reservoirs. This study proposes a gas prediction methodology utilizing a dispersion attribute derived from frequency-dependent inversion. To verify the effectiveness of the proposed method with the theoretical test, this study adopts the multi-scale fracture theory [42,43] to calculate the frequency-dependent P-wave and S-wave velocities, which are then used to generate synthetic data. The multi-scale fracture theory primarily focuses on the dispersion mechanism caused by fluid squirt flow within complex pore structures. In future research, additional rock physics models can be incorporated to investigate other dispersion mechanisms. Using multi-scale fracture theory, we conducted rock physics modeling to analyze the frequency-dependent characteristics of indicator F under different porosity and gas saturation conditions [Figure 3b]. The modeling results reveal the significant sensitivity of indicator F to variations in both ϕ and Sg. However, conventional seismic inversion and interpretation methods have typically relied on elastic theories for fluid identification, overlooking inelastic dispersion effects in tight sandstone reservoirs. To address these challenges, this paper presented a frequency-dependent pre-stack inversion method to extract seismic dispersion attributes, enhancing gas prediction by utilizing the inelastic properties of tight sandstones. This method is based on an AVO equation specifically parameterized by the gas indicator F and associated properties.
As demonstrated in Figure 6a–c and Figure 7a–c, we simulated and analyzed the seismic AVO responses of tight sandstone reservoirs with varying ϕ and Sg configurations by integrating rock physics modeling with the propagator matrix method. In these simulations, the tight sandstone exhibits inelastic properties due to fluid flow within multi-scale fracture systems. The results revealed distinct AVO signatures associated with variations in ϕ and Sg, indicating the feasibility of identifying porosity and fluid using pre-stack seismic data. Furthermore, based on the method outlined in Section 2.1, we computed the seismic dispersion attribute DF for gas content (Sg × ϕ) assessment in tight sandstones. Synthetic data tests validated the capability of the proposed DF for reliably estimating variations in ϕ and Sg [Figure 6d and Figure 7d]. Quantitative analysis systematically demonstrated a significant increase in DF values with higher ϕ and Sg values (Figure 8), confirming the sensitivity of DF to both parameters. Notably, DF exhibited a clear positive correlation with the product Sg × ϕ, as shown in Figure 9, further supporting its reliability for gas content assessment.
Finally, the proposed method and dispersion attribute DF were applied to field data for gas prediction in the study area, as shown in Figure 10. As illustrated in Figure 11, Figure 12 and Figure 13, the results indicate that the seismically derived DF demonstrates a strong correlation with the well log-derived Sg × ϕ. Target sandstones with high Sg × ϕ values were identified by high-value DF anomalies in all three wells. These findings support the feasibility of using DF as a reliable indicator for predicting gas-bearing tight sandstones in the investigated region. Comparative analysis further revealed that DF anomalies (Figure 17) exhibit a significantly stronger correlation with gas-enriched intervals than the conventional P-wave dispersion attribute DVp (Figure 18), confirming the superior reliability of DF for gas content prediction in tight sandstones.
Seismic elastic inversion and quantitative seismic interpretation methods have been employed to estimate porosity and gas saturation [4,6,17]. Different from the aforementioned conventional elastic inversion approaches, this study proposes a dispersion attribute obtained from frequency-dependent inversion. A key advantage of this method lies in its utilization of inelastic properties derived from seismic frequency information, offering a method for characterizing gas content (Sg × ϕ). However, the presented dispersion attribute provides a qualitative evaluation of gas content. Future research could focus on developing quantitative indicators to achieve a more accurate characterization of reservoir properties by using formal uncertainty quantification methods such as the Bayesian inversion or Monte Carlo simulations.
Meanwhile, rock physics modeling approaches that account for various factors such as mineralogical heterogeneity and elastic–inelastic coupling effects may be incorporated, offering deeper insights into the seismic dispersion characteristics associated with porosity and fluid. In addition, further research will explore the simultaneous inversion for multiple reservoir parameters (such as porosity, gas saturation, and fluid type) and combine seismic dispersion attributes with other seismic indicators to enhance predictive reliability and compensate the limitations of single-attribute approaches. Finally, the proposed method can be further applied to diverse geological settings, reservoir types, and well data in further study.

5. Conclusions

This study presents a gas prediction methodology based on a dispersion attribute derived from frequency-dependent inversion, utilizing an AVO equation specifically parameterized by the gas indicator F and associated properties. Rock physics modeling, grounded in multi-scale fracture theory, demonstrated the significant sensitivity of the frequency-dependent indicator F to variations in both porosity (ϕ) and gas saturation (Sg). Seismic AVO modeling results revealed distinct signatures linked to variations in ϕ and Sg, suggesting the feasibility of predicting porosity and fluid using pre-stack seismic data. Synthetic data tests confirmed the ability of the proposed seismic dispersion attribute DF to reliably estimate variations in ϕ and Sg. Moreover, DF showed a clear positive correlation with the product of Sg × ϕ, underscoring its effectiveness in gas content evaluation. Field data applications indicated that target sandstones with high well log-derived Sg × ϕ values were identified by elevated DF anomalies. Comparative analysis further demonstrated that DF anomalies exhibited a significantly stronger correlation with gas-enriched intervals than the conventional P-wave dispersion attribute DVp, validating the superior reliability of DF for gas content prediction in tight sandstones. These findings suggest that the proposed seismic dispersion attribute provides an effective indicator for identifying gas-bearing areas in tight sandstones.

Author Contributions

Conceptualization, L.H., M.C. and H.J.; methodology, H.J.; software, H.J.; validation, M.C. and H.J.; formal analysis, L.H., M.C. and H.J.; investigation, L.H., M.C. and H.J.; resources, L.H. and M.C.; data curation, H.J.; writing—original draft preparation, L.H., M.C. and H.J.; writing—review and editing, L.H., M.C. and H.J.; visualization, H.J.; supervision, L.H. and M.C.; project administration, L.H. and M.C. All authors have read and agreed to the published version of the manuscript.

Funding

This research was funded by the National Natural Science Foundation of China, grant numbers 42274160 and 42074153.

Data Availability Statement

The datasets presented in this article are not readily available because they are not permitted to be shared.

Conflicts of Interest

Authors Laidong Hu and Mingchun Chen were employed by the company Sinopec Geophysical Corporation. The remaining authors declare that the research was conducted in the absence of any commercial or financial relationships that could be construed as a potential conflict of interest.

Nomenclature

AVOAmplitude variation with offset
FD-AVOFrequency-dependent amplitude variation with offset
KfFluid bulk modulus
μShear modulus of rock skeleton
FGas indicator
ISS-wave impedance
ρDensity
ϕPorosity
θIncidence angle
γsatP- and S-wave velocity ratio of saturated rock
γdryP- and S-wave velocity ratio of dry frame
ω0Reference frequency
DFDispersion attribute related to gas content
DϕISDispersion attribute related to porosity and S-wave impedance
ΔSDecomposed spectral components
ΔRReflection coefficient difference term
WWavelet spectrum
C0ijklIsotropic background stiffness coefficients
C1ijklThe contributions of pore to stiffness coefficients
C2ijklThe contributions of microcrack to stiffness coefficients
C3ijklThe contributions of fracture to stiffness coefficients
ϕpPorosity
εcMicrocrack density
εfFracture density
VP(ω)Frequency-dependent P-wave velocity
VS(ω)Frequency-dependent S-wave velocity
ρsDensity of the fluid-saturated tight sandstone

Appendix A

Jin et al. [17] introduced a gas indicator F for the prediction of gas content in tight sandstones:
F = 1 K f μ
where Kf represents the fluid bulk modulus and μ denotes the shear modulus of the rock skeleton. Based on this, a new AVO approximation was proposed to enable the direct inversion of the indicator F:
R PP θ = 1 + tan 2 θ γ s a t 2 γ d r y 2 4 γ s a t 2 Δ F F 1 + tan 2 θ γ s a t 2 2 γ d r y 2 + 8 sin 2 θ 2 γ s a t 2 Δ ϕ I S ϕ I S + 1 + tan 2 θ γ s a t 2 γ d r y 2 + 4 sin 2 θ 2 γ s a t 2 tan 2 θ 2 Δ ρ ρ + 1 + tan 2 θ 3 γ s a t 2 5 γ d r y 2 + 16 sin 2 θ 4 γ s a t 2 Δ ϕ ϕ
where IS is the S-wave impedance, ρ represents density, ϕ is porosity, and θ denotes incidence angle; γsat and γdry are the P- and S-wave velocity ratio of saturated rock and dry frame, respectively.
Additionally, the frequency-dependent behavior of the indicators F and IS is incorporated, while density ρ and ϕ are reasonably assumed to remain constant across different frequencies ω [38]. This assumption facilitates the derivation of the FD-AVO equation, expressed as follows:
R PP θ , ω = A θ Δ F F ω + B θ Δ ϕ I S ϕ I S ω + C θ Δ ρ ρ + D θ Δ ϕ ϕ
where
A θ = 1 + tan 2 θ γ sat 2 γ dry 2 4 γ sat 2
B θ = 1 + tan 2 θ γ sat 2 2 γ dry 2 + 8 sin 2 θ 2 γ sat 2
C θ = 1 + tan 2 θ γ sat 2 γ dry 2 + 4 sin 2 θ 2 γ sat 2 tan 2 θ 2
D θ = 1 + tan 2 θ 3 γ sat 2 5 γ dry 2 + 16 sin 2 θ 4 γ sat 2
By applying a first-order Taylor series expansion to Equation (A3) around a reference frequency ω0, the following expression is obtained:
R PP θ , ω R PP θ , ω 0 + ω ω 0 A θ ω Δ F F + ω ω 0 B θ ω Δ ϕ I S ϕ I S
where
R PP θ , ω 0 = A θ Δ F F ω 0 + B θ Δ ϕ I S ϕ I S ω 0 + C θ Δ ρ ρ + D θ Δ ϕ ϕ
The dispersion attributes corresponding to F and ϕIS are defined as follows:
D F = ω Δ F F
D ϕ I S = ω Δ ϕ I S ϕ I S
Meanwhile, by defining
Δ R PP θ , ω = R PP θ , ω R PP θ , ω 0
Equation (A8) can be reformulated as follows:
Δ R PP θ , ω = ω ω 0 A θ D F + B θ D ϕ Is
Building upon Equation (A13), the inversion framework for dispersion attributes DF and DϕIs can be expressed in matrix form to facilitate the application to real seismic data:
d = G D F D ϕ Is
where
d = Δ S θ 1 , ω 1 Δ S θ 1 , ω m Δ S θ n , ω 1 Δ S θ n , ω m
G = W ω 1 ω 1 ω 0 A θ 1 W ω 1 ω 1 ω 0 B θ 1 W ω m ω m ω 0 A θ 1 W ω m ω m ω 0 B θ 1 W ω 1 ω 1 ω 0 A θ n W ω 1 ω 1 ω 0 B θ n W ω m ω m ω 0 A θ n W ω m ω m ω 0 B θ n
The decomposed spectral components ΔS in Equation (A15) are related to the reflection coefficient difference term ΔR in Equation (A13) through incorporating the wavelet spectral matrix [W(ω1), W(ω2), …, and W(ωm)] shown in Equation (A16).

References

  1. Liu, L.; Tang, D.Z.; Wo, Y.J.; Liu, L.H.; Sun, W.; Lu, H.M.; Yekikang, M.Q. Favorable area prediction of tight sandstone: A case study of the He8 formation in the Kangning area, Eastern Ordos Basin, China. J. Pet. Sci. Eng. 2019, 175, 430–443. [Google Scholar]
  2. Shu, Y.; Sang, S.X.; Lin, Y.X.; Zhou, X.Z.; Wang, H.; Wang, Z.L. The influence of magmatic-hydrothermal activities on porosity and permeability of sandstone reservoirs in the Linxing area, Ordos Basin, Northern China. J. Asian Earth Sci. 2021, 213, 104741. [Google Scholar] [CrossRef]
  3. Ba, J.; Cao, H.; Carcione, J.M.; Tang, G.; Yan, X.F.; Sun, W.T.; Nie, J.X. Multiscale rock-physics templates for gas detection in carbonate reservoirs. J. Appl. Geophys. 2013, 93, 77–82. [Google Scholar] [CrossRef]
  4. Pang, M.Q.; Ba, J.; Carcione, J.M.; Picotti, S.; Zhou, J.; Jiang, R. Estimation of porosity and fluid saturation in carbonates from rock-physics templates based on seismic Q. Geophysics 2019, 84, M25–M36. [Google Scholar] [CrossRef]
  5. Pang, M.Q.; Ba, J.; Fu, L.Y.; Carcione, J.M.; Markus, U.I.; Zhang, L. Estimation of microfracture porosity in deep carbonate reservoirs based on 3D rock-physics templates. Int. J. Subsurf. Charact. 2021, 8, SP43–SP52. [Google Scholar] [CrossRef]
  6. Guo, Z.Q.; Qin, X.Y.; Liu, C. Quantitative characterization of tight gas sandstone reservoirs using seismic data via an integrated rock-physics-based framework. Pet. Sci. 2023, 20, 3428–3440. [Google Scholar] [CrossRef]
  7. Goodway, W.N.; Chen, T.; Downton, J. Improved AVO fluid detection and lithology discrimination using Lamé petrophysical parameters; “λρ”, μρ, λ/μ Fluid Stack,” from P and S inversions. In Proceedings of the 67th SEG Annual Meeting, Dallas, TX, USA, 2–7 November 1997; pp. 183–186. [Google Scholar]
  8. Quakenbush, M.; Shang, B.; Tuttle, C. Poisson impedance. Lead. Edge 2006, 25, 128–138. [Google Scholar] [CrossRef]
  9. Xu, C.X.; Ma, P.S.; Lai, L.B.; Sun, Y.H.; Li, Z.C. Sensitivity parameters of tight sand gas: A case study of Lower Cretaceous Yingcheng Formation of Yingtai gas field in Songliao Basin, NE China. Pet. Explor. Dev. 2014, 41, 712–716. [Google Scholar] [CrossRef]
  10. Huang, X.R.; Huang, J.P.; Li, Z.C. High-Sensitivity Fluid Identification Factor in Anisotropic Tight-Oil Sandstone Reservoirs. In SEG Annual Meeting; SEG: Houston, TX, USA, 2015; pp. 2688–2692. [Google Scholar]
  11. Wang, P.; Chen, X.H.; Li, X.Y.; Cui, Y.A.; Li, J.Y.; Wang, B.F. Analysis and Estimation of an Inclusion-Based Effective Fluid Modulus for Tight Gas-Bearing Sandstone Reservoirs. IEEE. Trans. Geosci. Remote Sens. 2022, 60, 4502710. [Google Scholar] [CrossRef]
  12. Yin, X.Y.; Zhang, S.X.; Zhang, F. Two-term elastic impedance inversion and Russell fluid factor direct estimation method for deep reservoir fluid identification. Chin. J. Geophys. 2013, 7, 2378–2390. [Google Scholar]
  13. Zong, Z.Y.; Yin, X.Y. Direct inversion of Young’s and Poisson impedances for fluid discrimination. Geofluids 2017, 16, 1006–1016. [Google Scholar] [CrossRef]
  14. Jia, L.Y.; Li, L.; Wang, Q.Y.; Ma, J.F.; Wang, H.F.; Wang, D.X. Fluid identification factor inversion based on generalized elastic impedance. Geophys. Prospect. Pet. 2018, 57, 302–311. [Google Scholar]
  15. Gao, G.; Yang, Y.H.; Zhao, B.; Duan, H.L.; Wang, X.Y.; Wei, Y.Z. A method for establishing and directly extracting sensitive identification factors of unconsolidated sandstones. Oil Geophys. Prospect. 2019, 54, 1329–1338. [Google Scholar]
  16. Ma, Z.Q.; Yin, X.Y.; Zong, Z.Y.; Tan, Y.Y.; Ji, L.X.; Yang, Z.F.; Yan, X.F. Sequential Bayesian seismic inversion for fracture parameters and fluid indicator in tilted transversely isotropic media. Geophysics 2023, 88, R355–R371. [Google Scholar] [CrossRef]
  17. Jin, H.; Liu, C.; Guo, Z.Q. Gas prediction in tight sandstones based on the rock-physics-derived seismic amplitude variation versus offset method. Pet. Sci. 2024, 21, 3951–3964. [Google Scholar] [CrossRef]
  18. Yin, H.j.; Zhao, J.G.; Tang, G.Y.; Zhao, L.M.; Ma, X.Y.; Wang, S.X. Pressure and fluid effect on frequency-dependent elastic moduli in fully saturated tight sandstone. J. Geophys. Res. Solid Earth 2017, 122, 8925–8942. [Google Scholar] [CrossRef]
  19. Chapman, M.; Liu, E.; Li, X. The influence of fluid-sensitive dispersion and attenuation on AVO analysis. Geophys. J. Int. 2006, 167, 89–105. [Google Scholar] [CrossRef]
  20. Chapman, M. Modeling the effect of multiple sets of mesoscale fractures in porous rock on frequency-dependent anisotropy. Geophysics 2009, 74, D97–D103. [Google Scholar] [CrossRef]
  21. Ba, J.; Carcione, J.M.; Cao, H.; Du, Q.Z.; Yuan, Z.Y.; Lu, M.H. Velocity dispersion and attenuation of P waves in partially-saturated rocks: Wave propagation equations in double-porosity medium. Chin. J. Geophys. 2012, 55, 219–231. [Google Scholar]
  22. Ba, J.; Xu, W.H.; Fu, L.Y.; Carcione, J.M.; Zhang, L. Rock anelasticity due to patchy saturation and fabric heterogeneity: A double double-porosity model of wave propagation. J. Geophys. Res. Solid Earth 2017, 122, 1949–1976. [Google Scholar] [CrossRef]
  23. Sun, W.T.; Ba, J.; Carcione, J.M. Theory of wave propagation in partially saturated double-porosity rocks: A triple-layer patchy model. Geophys. J. Int. 2016, 205, 22–37. [Google Scholar] [CrossRef]
  24. He, Y.X.; Wu, X.Y.; Fu, K.; Zhou, D.; Wang, S.X. Modeling the Effect of Microscopic and Mesoscopic Heterogeneities on Frequency-Dependent Attenuation and Seismic Signatures. IEEE. Trans. Geosci. Remote Sens. Lett. 2018, 15, 1174–1178. [Google Scholar] [CrossRef]
  25. He, Y.X.; Li, X.L.; Tang, G.Y.; Dong, C.H.; Chen, M.; Wang, S.X. Modeling the effects of fracture infill on frequency-dependent anisotropy and AVO response of a fractured porous layer. Pet. Sci. 2021, 18, 758–772. [Google Scholar] [CrossRef]
  26. Wilson, A.; Chapman, M.; Li, X.Y. Frequency-dependent AVO inversion. In Proceedings of the 79th Annual International Meeting, SEG, Expanded Abstracts, Houston, TX, USA, 25–30 October 2009; pp. 341–345. [Google Scholar]
  27. Pang, S.; Liu, C.; Guo, Z.Q.; Liu, X.W.; Liu, Y.W. Gas identification of shale reservoirs based on frequency-dependent AVO inversion of seismic data. Chin. J. Geophys. 2018, 61, 4613–4624. [Google Scholar]
  28. Liu, W.; Cao, S.Y.; Jin, Z.Y.; Wang, Z.M.; Chen, Y.K. A novel hydrocarbon detection approach via high-resolution frequency-dependent AVO inversion based on variational mode decomposition. IEEE. Trans. Geosci. Remote Sens. 2018, 56, 2007–2024. [Google Scholar] [CrossRef]
  29. Luo, C.; Li, X.Y.; Huang, G.T. Hydrocarbon identification by application of improved sparse constrained inverse spectral decomposition to frequency-dependent AVO inversion. J. Geophys. Eng. 2018, 15, 1446–1459. [Google Scholar] [CrossRef]
  30. Huang, G.T.; Chen, X.H.; Luo, C.; Chen, Y.K. Mesoscopic Wave-Induced Fluid Flow Effect Extraction by Using Frequency-Dependent Prestack Waveform Inversion. IEEE. Trans. Geosci. Remote Sens. 2021, 59, 6510–6524. [Google Scholar] [CrossRef]
  31. Jin, H.; Liu, C.; Guo, Z.Q.; Zhang, Y.M.; Niu, C.; Wang, D.; Ling, Y. Rock physical modeling and seismic dispersion attribute inversion for the characterization of a tight gas sandstone reservoir. Front. Earth Sci. 2021, 9, 641651. [Google Scholar] [CrossRef]
  32. Guo, Z.Q.; Li, Y.D.; Liu, C.; Zhang, D.; Li, A.B. Characterization of a Volcanic Gas Reservoir Using Seismic Dispersion and Fluid Mobility Attributes. Lithosphere 2021, 3, 9520064. [Google Scholar] [CrossRef]
  33. Guo, Z.Q.; Zhao, D.Y.; Liu, C. Gas prediction using an improved seismic dispersion attribute inversion for tight sandstone gas reservoirs in the Ordos Basin, China. J. Nat. Gas. Sci. Eng. 2022, 101, 104499. [Google Scholar] [CrossRef]
  34. Guo, Z.Q.; Zhang, X.D.; Liu, C.; Liu, X.W.; Liu, Y.W. Hydrocarbon Identification and Bedding Fracture Detection in Shale Gas Reservoirs Based on a Novel Seismic Dispersion Attribute Inversion Method. Surv. Geophys. 2022, 43, 1793–1816. [Google Scholar] [CrossRef]
  35. Luo, X.; Chen, X.H.; Lv, B.N.; Liu, J.J.; Wu, H.J.; Wang, P. Frequency-Dependent AVO Inversion Using a Modified Window-Parameter-Optimized S-Transform for High Gas-Saturation Reservoir Delineation. IEEE. Trans. Geosci. Remote Sens. Lett. 2023, 20, 3000805. [Google Scholar] [CrossRef]
  36. Li, Y.D.; Guo, Z.Q.; Liu, C. Characterization of Fluid-Saturated Fractures Based on Seismic Azimuthal Anisotropy Dispersion Inversion Method. IEEE. Trans. Geosci. Remote Sens. 2024, 62, 1–17. [Google Scholar] [CrossRef]
  37. Wang, P.; Li, J.; Chen, X.H.; Wang, K.D.; Wang, B.F. Fluid Discrimination Based on Frequency-Dependent AVO Inversion with the Elastic Parameter Sensitivity Analysis. Feofluis 2019, 2019, 1–14. [Google Scholar] [CrossRef]
  38. Guo, Z.Q.; Zhao, D.Y.; Liu, C. A New Seismic Inversion Scheme Using Fluid Dispersion Attribute for Direct Gas Identification in Tight Sandstone Reservoirs. Remote Sens. 2022, 14, 5326. [Google Scholar] [CrossRef]
  39. Tian, Y.; Gao, J.; Stovas, A.; Meng, C. Frequency-dependent AVO inversion via deep neural network and application on tight reservoir parameters prediction. In Proceedings of the 84th EAGE Annual Conference and Exhibition, Vienna, AT, USA, 5–8 June 2023. [Google Scholar]
  40. Tian, Y.J.; Stovas, A.; Gao, J.H.; Meng, C.J.; Yang, C. Frequency-Dependent AVO Inversion and Application on Tight Sandstone Gas Reservoir Prediction Using Deep Neural Network. IEEE. Trans. Geosci. Remote Sens. 2023, 61, 1–13. [Google Scholar] [CrossRef]
  41. Fawad, M.; Hansen, J.A.; Mondol, N.H. Seismic-fluid detection-a review. Earth Sci. Rev. 2020, 210, 103347. [Google Scholar] [CrossRef]
  42. Chapman, M.; Zatsepin, S.v.; Crampin, S. Derivation of a microstructural poroelastic model. Geophys. J. Int. 2002, 151, 427–451. [Google Scholar] [CrossRef]
  43. Chapman, M. Frequency-dependent anisotropy due to meso-scale fractures in the presence of equant porosity. Geophys. Prospect. 2003, 51, 369–379. [Google Scholar] [CrossRef]
  44. Guo, Z.Q.; Liu, C.; Li, X.Y.; Lan, H.T. An Improved Method for the Modeling of Frequency-Dependent Amplitude-Versus-Offset Variations. IEEE. Geosci. Remote Sens. Lett. 2015, 12, 63–67. [Google Scholar]
  45. Guo, Z.Q.; Liu, X.W. Seismic rock physics characterization of anisotropic shale-a Longmaxi Shale case study. J. Geophys. Eng. 2018, 15, 512–526. [Google Scholar] [CrossRef]
  46. Mavko, G.; Mukerji, T.; Dvorkin, J. The Rock Physics Handbook: Tools for Seismic Analysis in Porous Media; Cambridge University Press: Cambridge, UK, 2009. [Google Scholar]
Figure 1. Framework for extracting the dispersion attribute DF based on the FD-AVO inversion method.
Processes 13 02210 g001
Figure 2. (a) SEM micrographs and (b) conceptual model of tight sandstones in the study area.
Processes 13 02210 g002
Figure 3. Frequency-dependent (a) VP and (b) F in tight sandstones under different ϕ conditions with a fixed Sg = 0.7.
Processes 13 02210 g003
Figure 4. Frequency-dependent (a) VP and (b) F in tight sandstones under different Sg conditions with a fixed ϕ = 0.15.
Processes 13 02210 g004
Figure 5. Theoretical model for synthetic data tests. H represents the thickness of the tight sandstone reservoir.
Processes 13 02210 g005
Figure 6. Synthetic AVO data at different ϕ conditions with fixed Sg = 0.7: (a) ϕ = 0.05, (b) ϕ = 0.1, and (c) ϕ = 0.15; (d) DF values computed from the synthetic data in (ac).
Processes 13 02210 g006
Figure 7. Synthetic AVO data at different Sg conditions with fixed ϕ = 0.15: (a) Sg = 0.3, (b) Sg = 0.5, and (c) Sg = 0.7; (d) DF values computed from the synthetic data in (ac).
Processes 13 02210 g007
Figure 8. Computed DF for varying Sg and ϕ.
Processes 13 02210 g008
Figure 9. Cross-plot between DF and Sg × ϕ, derived from the conversion of the result in Figure 7. The red arrow indicates the trend of DF varying with Sg × ϕ.
Processes 13 02210 g009
Figure 10. Two-way travel time (TWT) map for the target tight sandstone gas reservoir.
Processes 13 02210 g010
Figure 11. Curves of gamma ray (GR), VP/VS, ϕ, Sg, Sg × ϕ, cross-well pre-stack seismic traces, DF, DVp, and volumetric fraction of minerals for well B.
Processes 13 02210 g011
Figure 12. Curves of gamma ray (GR), VP/VS, ϕ, Sg, Sg × ϕ, cross-well pre-stack seismic traces, DF, DVp, and volumetric fraction of minerals for well C.
Processes 13 02210 g012
Figure 13. Curves of gamma ray (GR), VP/VS, ϕ, Sg, Sg × ϕ, cross-well pre-stack seismic traces, DF, DVp, and volumetric fraction of minerals for well D.
Processes 13 02210 g013
Figure 14. Cross-plot of (a) Sg × ϕ and VP/VS, and (b) Sg × ϕ and λρ.
Processes 13 02210 g014
Figure 15. Seismic profile across Wells A, B, C, D, and E with superimposed GR logging curves.
Processes 13 02210 g015
Figure 16. Spectral decomposition results of the seismic profile in Figure 15 at the following frequencies: (a) 10 Hz, (b) 20 Hz, (c) 30 Hz, (d) 40 Hz, (e) 50 Hz, and (f) 60 Hz.
Processes 13 02210 g016aProcesses 13 02210 g016b
Figure 17. Profile of DF across Wells A, B, C, D, and E with superimposed Sg × ϕ logging data.
Processes 13 02210 g017
Figure 18. Profile of DVp across Wells A, B, C, D, and E with superimposed Sg × ϕ logging data.
Processes 13 02210 g018
Figure 19. Profile of VP/VS across Wells A, B, C, D, and E with superimposed Sg × ϕ logging data.
Processes 13 02210 g019
Figure 20. Profile of λρ across Wells A, B, C, D, and E with superimposed Sg × ϕ logging data.
Processes 13 02210 g020
Table 1. The properties of clay and quartz.
ClayQuartz
VP (km/s)3.906.05
VS (km/s)1.503.90
ρ (g/cm3)2.582.65
Disclaimer/Publisher’s Note: The statements, opinions and data contained in all publications are solely those of the individual author(s) and contributor(s) and not of MDPI and/or the editor(s). MDPI and/or the editor(s) disclaim responsibility for any injury to people or property resulting from any ideas, methods, instructions or products referred to in the content.

