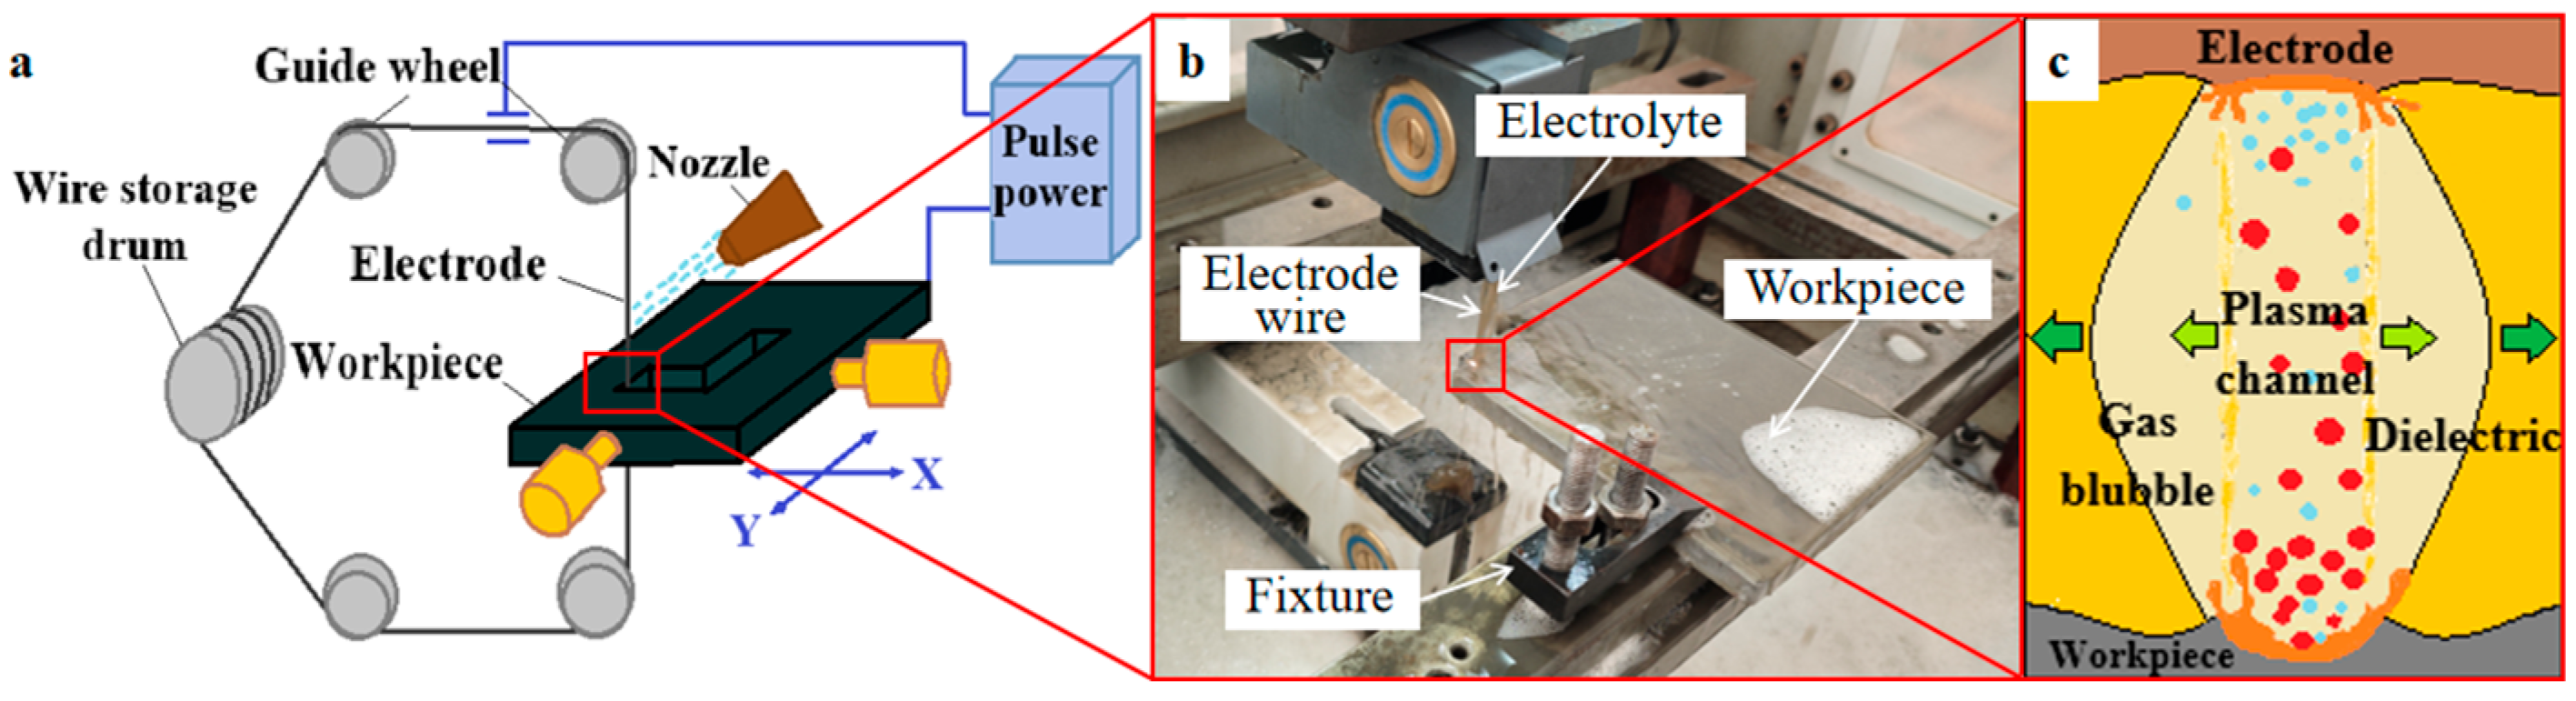
3.1. Experimental Analysis of Working-Fluid Performance
In order to clarify the influence mechanism of the graphene working solution concentration, the baseline process parameters (T
on = 22 μs, DC = 1:4, PT = 3, WS = 2 steps) were selected for the control experiment. The experimental results are shown in
Figure 3, where it can be observed that the effects of different concentrations of the aqueous graphene working fluid on R
a and MRR show a tendency of first increasing and then decreasing. Specifically, when the graphene concentration increases from 0.1% to 0.2%, the R
a value decreases and the MRR value increases, while when the concentration exceeds 0.2%, the R
a value starts to increase, and the MRR value decreases. For MRR, the reason for the appearance of this trend is that, the increase in the graphene concentration is accompanied by a change in the viscosity of the working fluid, and the desirable viscosity can improve the cooling and chip removal ability of the machining fluid, which can improve the MRR [
19]. However, a too-high viscosity may hinder the flow of the machining fluid, affecting the cooling and chip removal effects and leading to a decrease in the MRR. For the R
a, graphene acts as a lubricant during the machining process and optimizes the discharge channel, thus reducing the R
a [
20]. However, when the concentration is too high, graphene flakes may produce aggregation, leading to an increase in the R
a.
The combination of experimental results and theoretical analysis revealed that graphene may provide the best electrical conductivity at a concentration of 0.2 wt%, so in the subsequent one-factor experiments, a graphene working fluid concentration of 0.2 wt% will be used for the experiments.
Then, a set of experiments comparing the ordinary working fluid with the graphene working fluid under fixed parameters (Ton = 22 μs, DC = 1:4, PT = 3, WS = 2 steps) were carried out after determining the graphene concentration, and the results of the experiments are as follows (
Table 4):
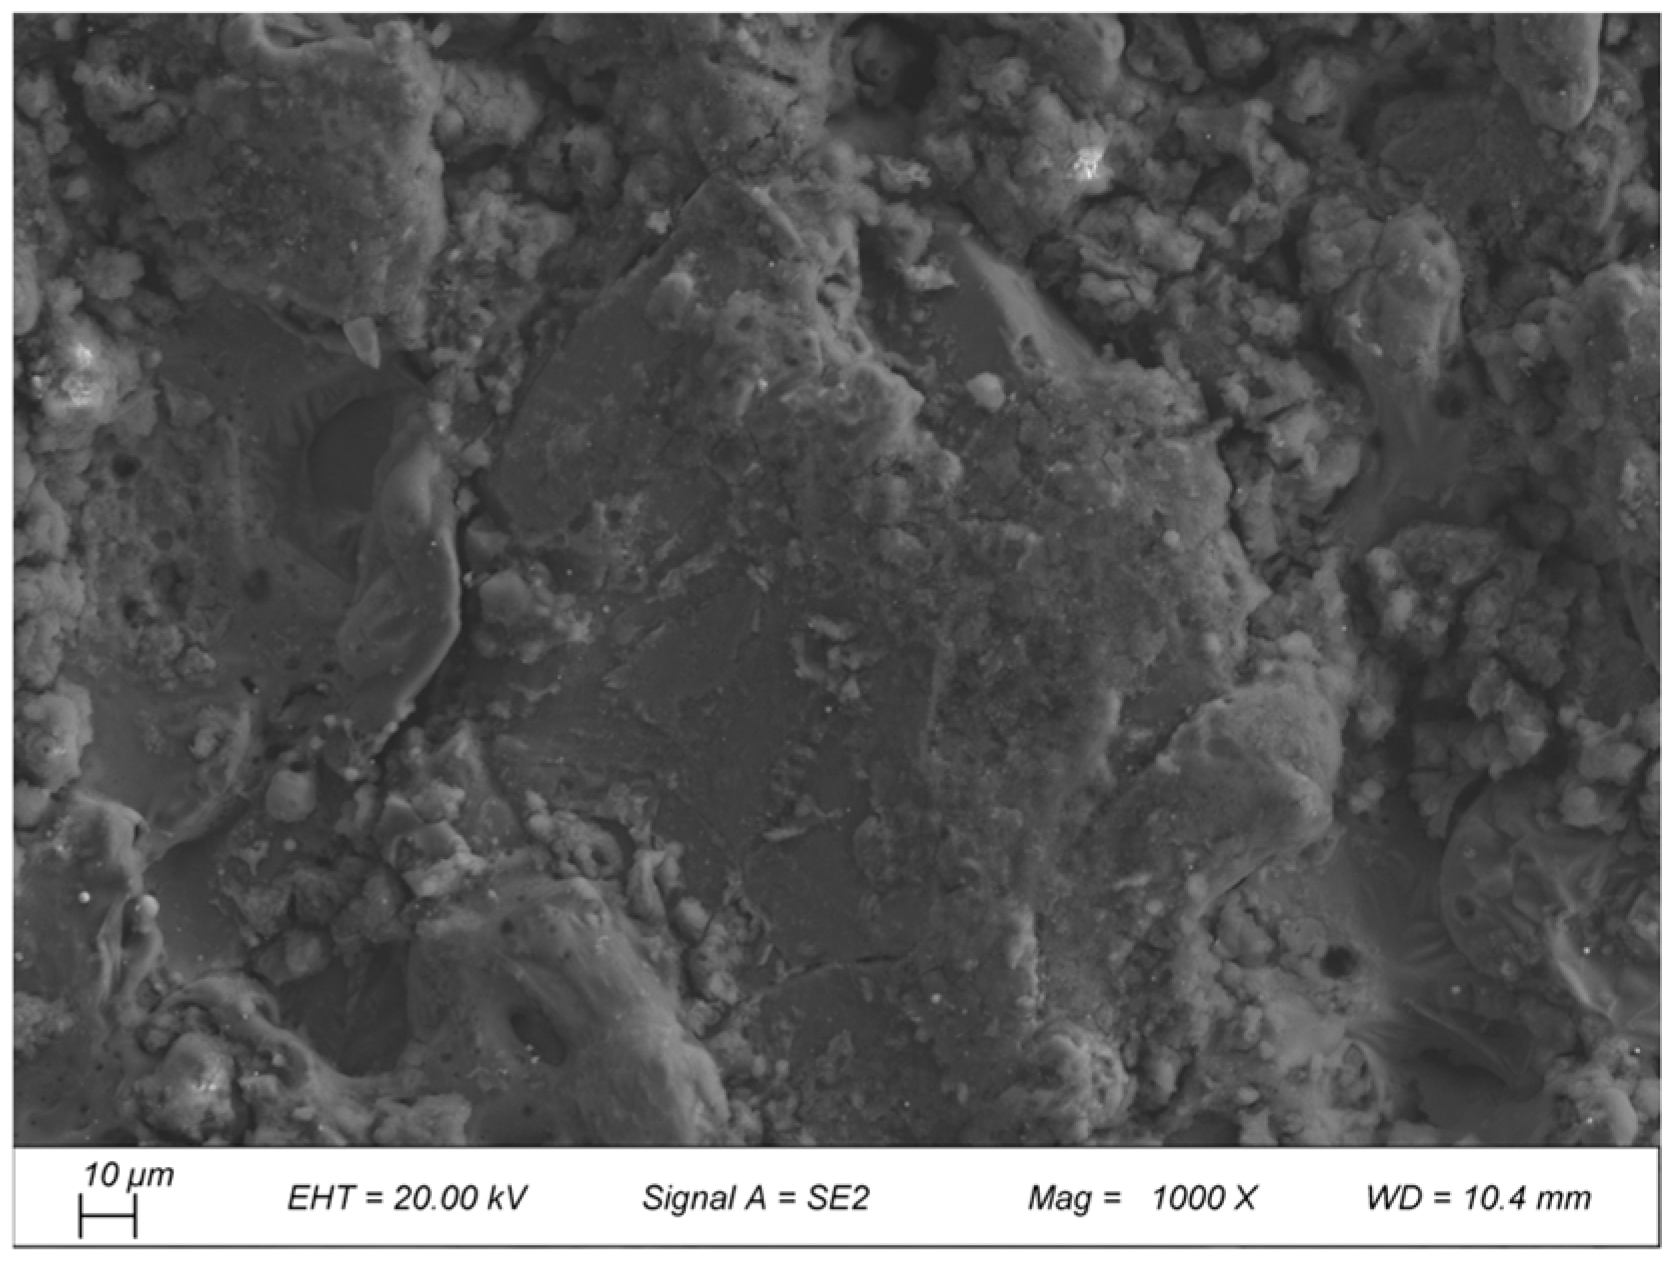
This improvement is mainly due to the triple mechanism of graphene [
21]: (1) the “micro-explosion effect of nanoparticles in the discharge gap promotes the expansion of the discharge channel”, resulting in a more uniform distribution of energy; (2) the high thermal conductivity of graphene accelerates the discharging of etching products, and the SEM shows that the microcracks and exfoliation grooves on the surface of the processed surface are reduced (
Figure 4); (3) the dispersion of discharge energy reduces local overheating, resulting in the selective etching of the Al substrate, which inhibits the over-oxidation of the Al substrate; (4) dispersing the discharge energy, reducing the selective etching of Al substrate caused by local overheating, and suppressing the excessive oxidation of Al substrate.
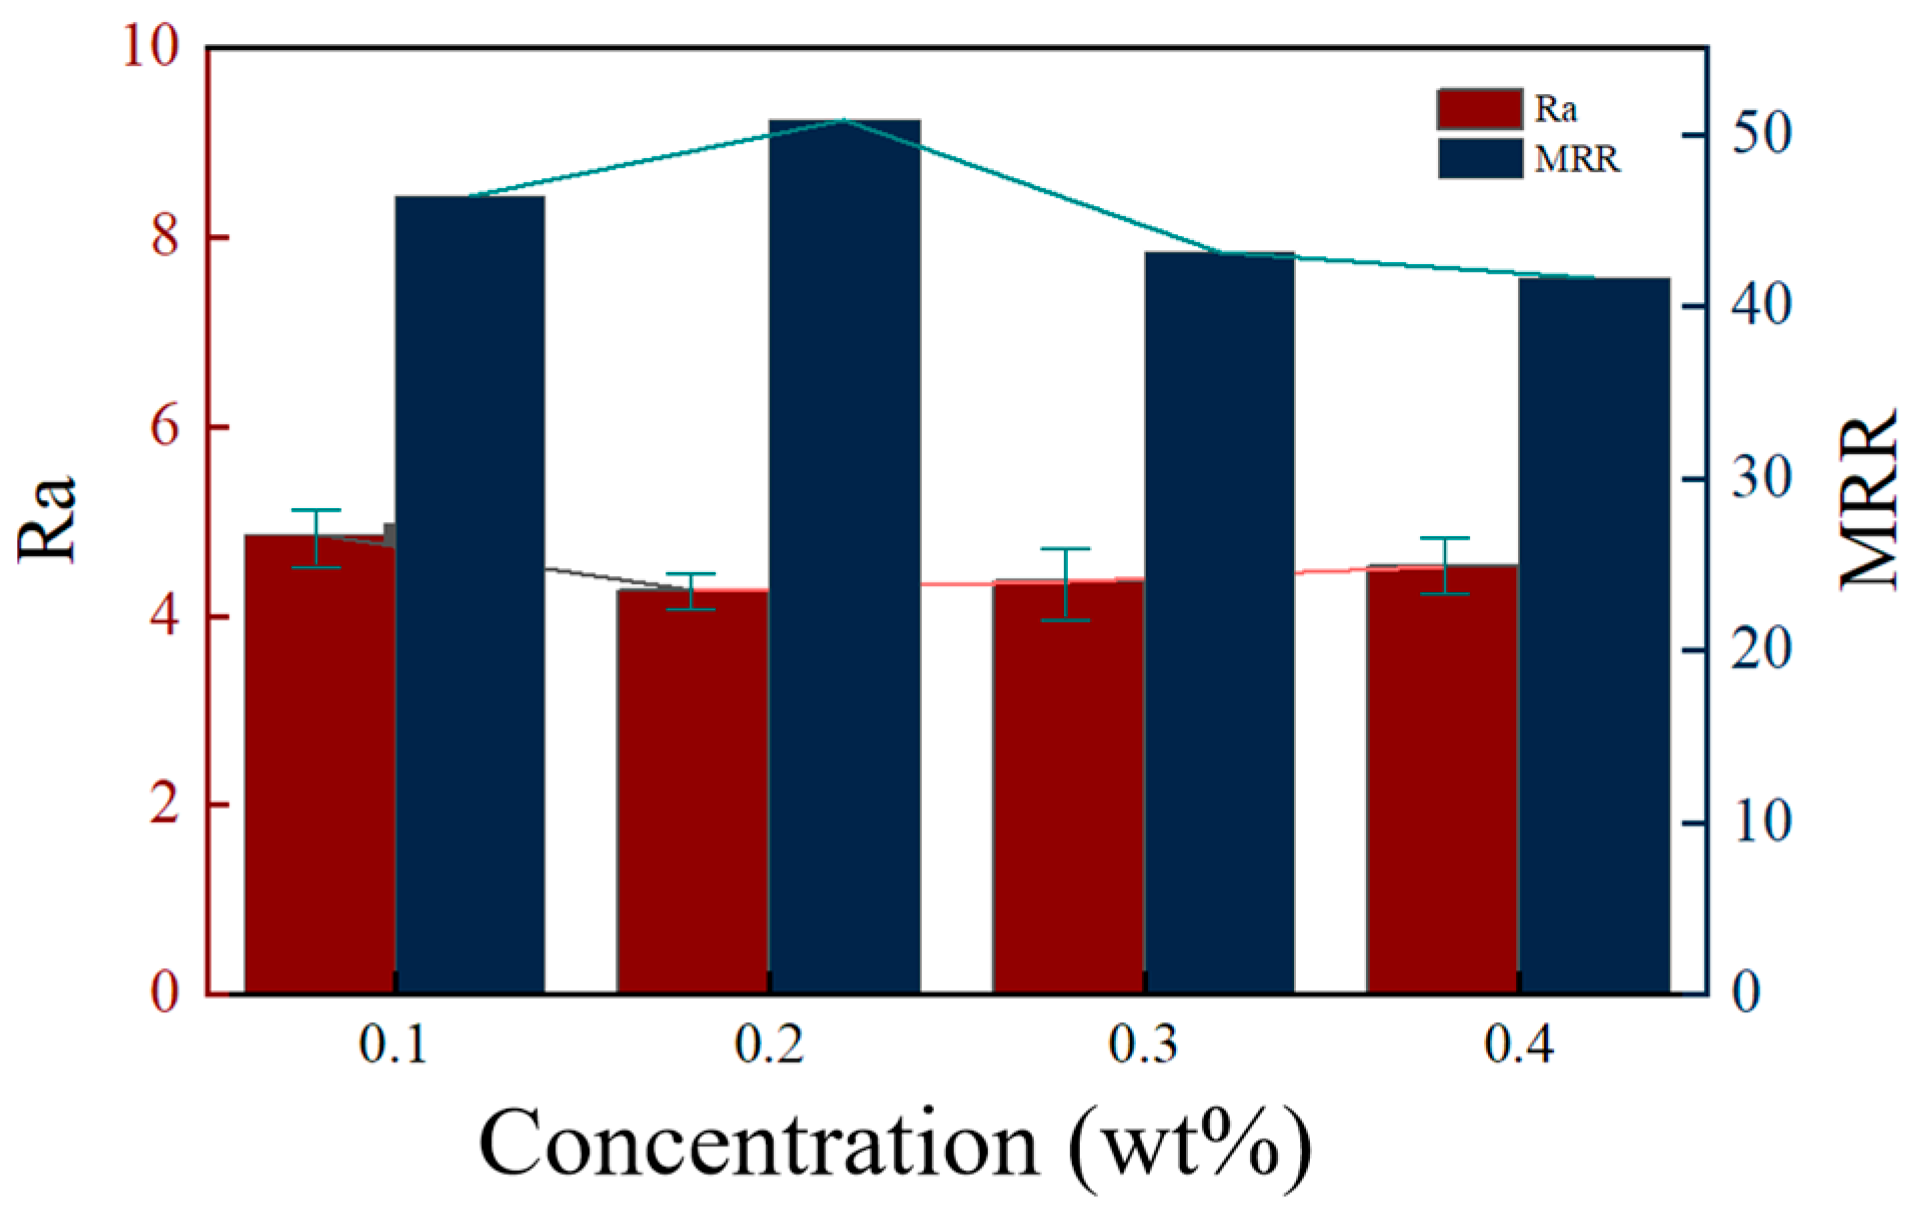
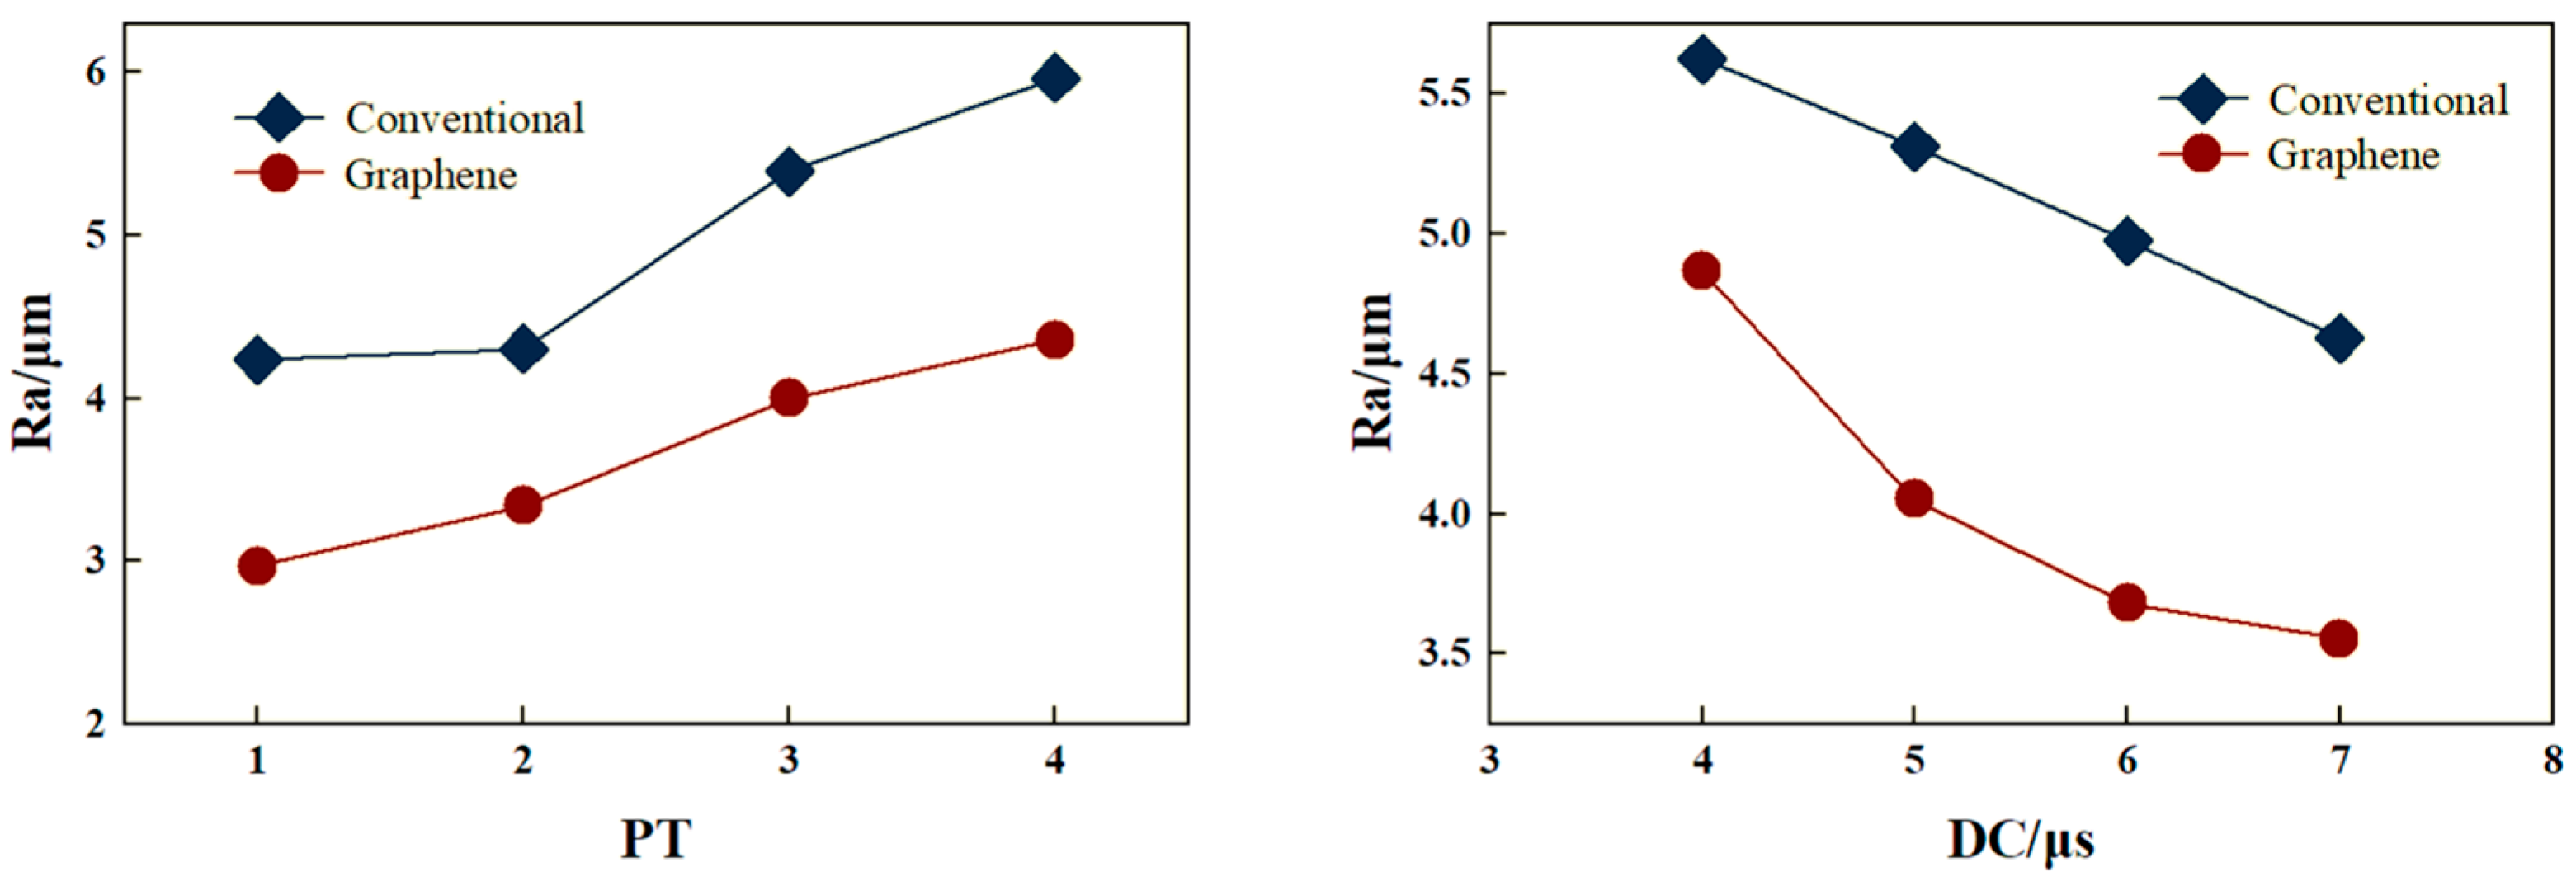
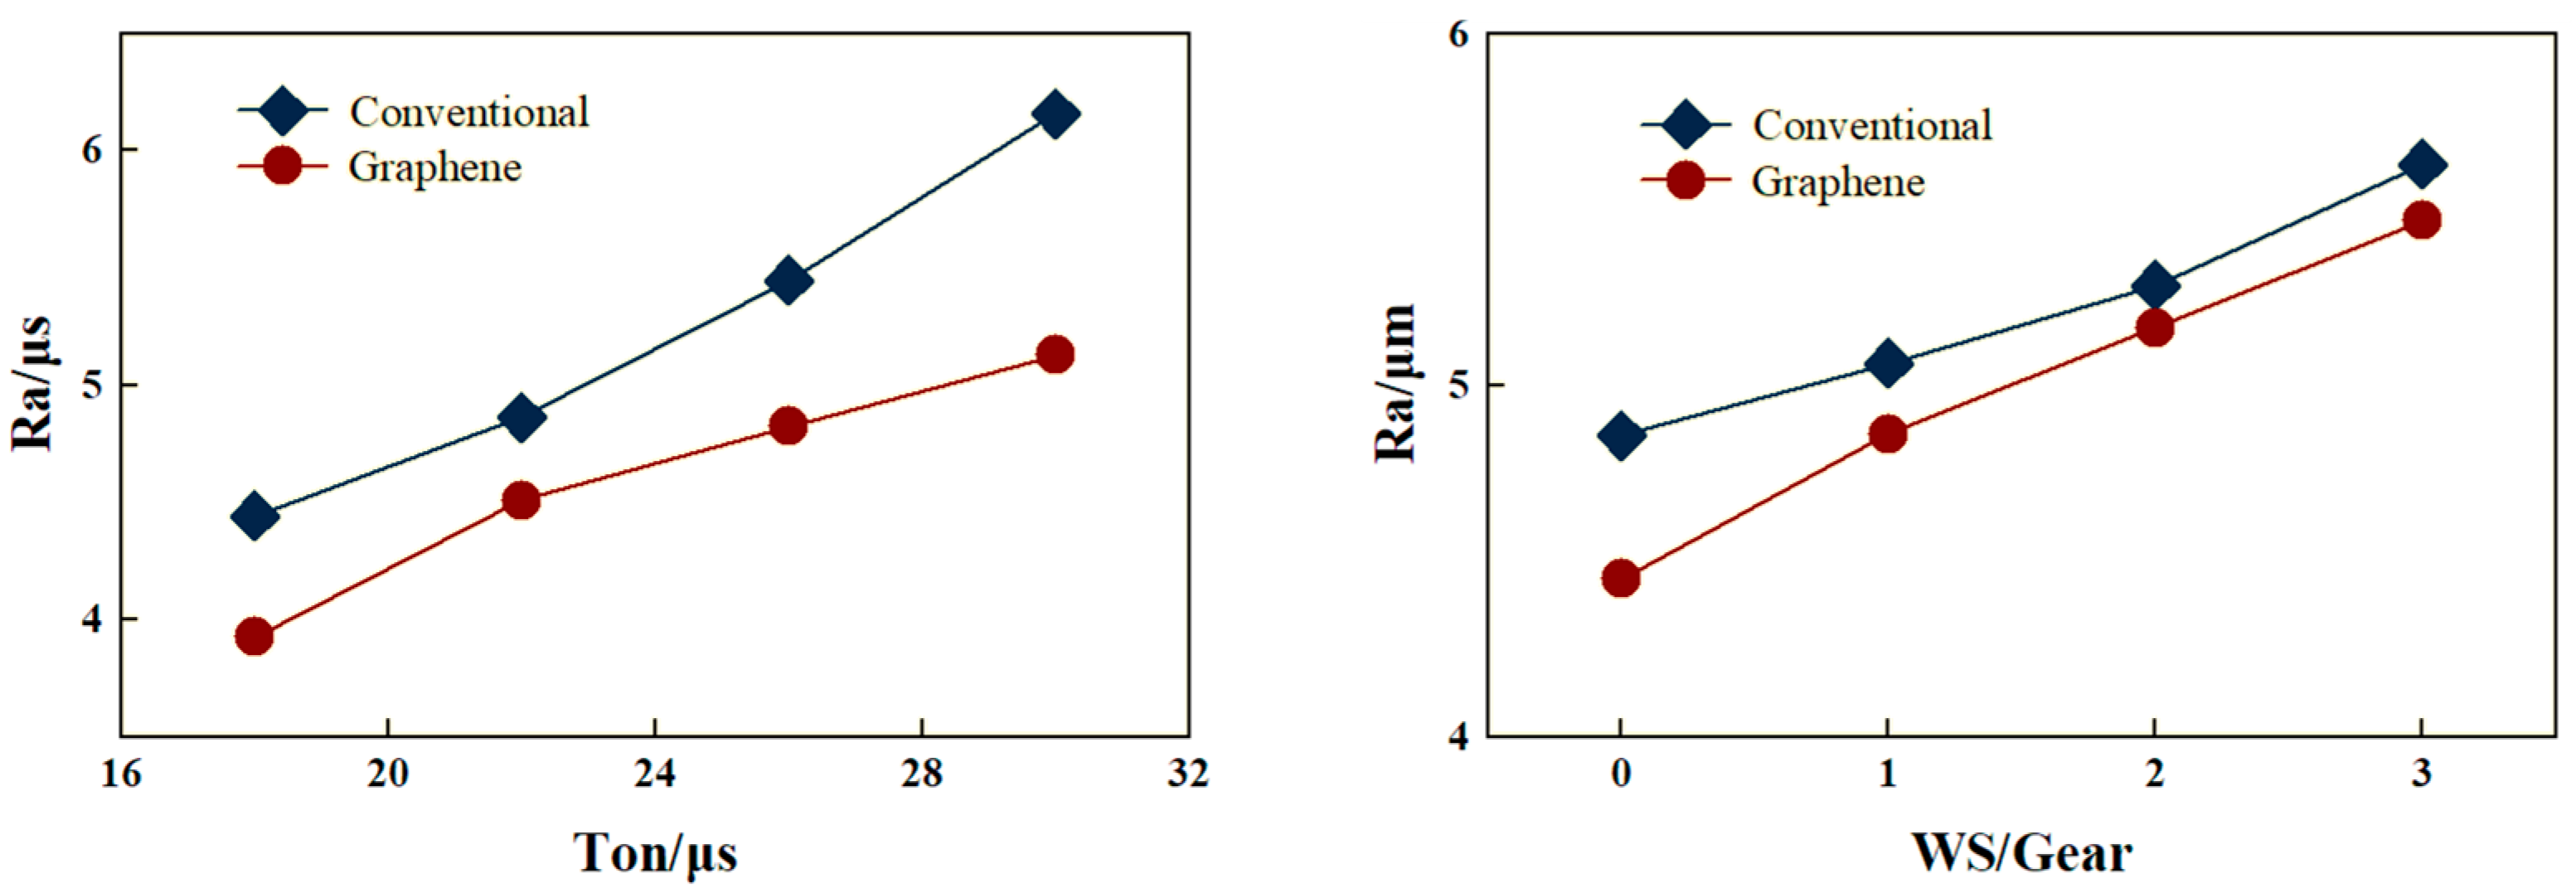
3.2. Results and Analysis of One-Way Comparison Experiments
According to the experimental design, one-factor comparative experiments were carried out using the ordinary working fluid and the graphene mixed-powder working fluid (wt%), respectively, to investigate the effects of the process parameters, such as pulse width (Ton), duty cycle (DC), number of power tubes (PT), and wire-walking speed (WS), on the MRR and Ra. The effects of different working fluids on the MRR and R
a after processing are shown in
Figure 5 and
Figure 6, respectively.
Figure 5 demonstrates the influence pattern of each process parameter on the MRR under different working fluids. The results show that the MRR increases with the increase in Ton, PT, and WS and decreases with the increase in DC. Among them, the most significant effect of the Ton on the MRR is due to the fact that the increase in the Ton directly increases the single-pulse discharge energy, leading to more SiCp/Al melting or vaporization. In addition, the MRR curve of the graphene working fluid is always located above the curve of the conventional working fluid, and its maximum MRR is calculated to be 11.16% higher than that of the conventional working fluid, and this enhancement is mainly attributed to the high electrical conductivity and the field emission effect of graphene, which promotes a uniform distribution of the discharge channels and reduces the local energy concentration, so that the etch rate of the SiC particles and the Al substrate tends to be synchronized. Thus, the MRR was effectively improved.
Figure 6 demonstrates the influence pattern of each process parameter on the R
a under different working fluids. The results show that the R
a increases with the increase in the Ton, PT, and WS and decreases with the increase in DC. Similarly, the R
a is still affected by the pulse energy: when the DC increases, the pulse energy decreases subsequently, which in turn reduces the discharge crater pulse depth and surface thermal damage, and the surface roughness decreases as a result. In addition, the MRR curve of the graphene working fluid is always located below the curve of the conventional working fluid, and its minimum R
a is calculated to be 29.96% less than that of the conventional working fluid. This optimization is mainly due to the high thermal conductivity of graphene nanoparticles, which significantly improves the heat dissipation efficiency of the working fluid and accelerates the solidification process of the molten material. This effectively inhibits the microcrack extension caused by rapid cooling and also reduces the thermal stress mismatch between the SiC particles and the Al matrix, decreasing the probability of particle shedding, thus effectively reducing the R
a.
3.3. Signal-to-Noise Ratio Analysis
In order to reduce the interference of random factors in repeated trials and accurately extract effective information, a signal-to-noise ratio analysis (SNR) was introduced [
22]. Minitab 2023 software was used for the signal-to-noise ratio analysis and image processing. The signal-to-noise ratio value of each group of test results is used as the basis for data processing, which weakens the random interference when analyzing the controllable factors and improves the accuracy of calculation and analysis. The signal-to-noise ratio method divides the system response into the desired characteristics: the large desired characteristics and the small desired characteristics. For the MRR, the larger the value, the better; the MRR belongs to the large desired characteristics and is calculated according to the Formula (3) of the signal-to-noise ratio calculation for the large desired characteristics. Meanwhile, for the R
a, the smaller the value, the better; the R
a has the small desired characteristics and is calculated according to the Formula (4) of the signal-to-noise ratio calculation for the small desired characteristics [
23]. The larger the value of the signal-to-noise ratio, the better the test results.
where S/N is the signal-to-noise ratio value of the process target, n is the overall number of test samples, and n = 16 in this study. y
i is the ith group of level factor sample data. In the Taguchi analysis response table, the difference between the maximum average response value of the factor minus the minimum average response value is Delta, and the larger the value is, the greater the impact of the factor on the judging index, and the higher the factor ranks [
24].
The results of the MRR and R
a were substituted into the calculation to obtain their respective signal-to-noise ratios, and the results are shown in
Table 5. There are four levels for each factor, and a total of 16 groups of tests, so each level corresponds to four groups of experimental signal-to-noise ratio values.
The mean values of the MRR signal-to-noise ratios of the four groups of tests corresponding to each level of each factor were calculated and plotted in
Figure 7 of the mean values of the MRR signal-to-noise ratios.
Figure 7 shows that the S/N fluctuates with the increase in the Ton; the MRR tends to decrease with the increase in DC; the MRR increases and then tends to be stable with the increase in PT; and the MRR decreases, then increases, and then decreases when the increase in WS is observed. The range of changes in the mean values of the signal-to-noise ratios of the PT was the largest, which shows that the PT have the greatest influence. It is analyzed that the PT determines the energy intensity of a single pulse, and a higher PT means more energy release, which can melt the material faster and thus increase the MRR. Based on the levels corresponding to the maximum of the mean values of the signal-to-noise ratios of the factors, the combination of the processing parameters at the time of the maximum of the MRR is determined as follows: Ton = 22 μs, DC = 1:4, PT = 4 s, and WS = 2.
The mean values of the R
a signal-to-noise ratios of the four groups of tests corresponding to each level of each factor were calculated separately, and the mean values of the R
a signal-to-noise ratios were plotted in
Figure 8. From
Figure 8, it can be seen that the S/N showed a decreasing trend with the growth in the Ton; with the increase in DC, the S/N first decreased, then increased, and then decreased; with the growth in the PT, the S/N increased and then decreased; and with the increase in WS, the S/N increased first and then decreased. And from the figure, it can be seen that the range of variation in the mean value of the Ton signal-to-noise ratio is the largest, indicating that the Ton has the greatest influence on R
a. It is analyzed that a higher Ton produces a larger discharge pit, leading to an increase in R
a. Therefore, the higher the Ton, the more pronounced the R
a. The level corresponding to the maximum value of the mean value of the signal-to-noise ratio of each factor material was selected to form the processing parameter combination at the time of the maximum R
a. The processing parameter combinations were as follows: T
on = 22 μs, DC = 1:4, PT = 3, and WS = 2.
3.4. Multi-Objective Optimization Analysis by Gray Correlation Method
For different judging dimensions, the factors produce different effects; i.e., the combination of factors that is more optimal for the surface roughness is not necessarily optimal for the cutting speed [
25]. In the actual EDM wire-cutting SiCp/Al processing, the MRR and R
a need to be considered comprehensively, so it is necessary to carry out a multi-objective optimization analysis, this study uses a gray correlation analysis, which is a multi-factor statistical analysis method that is based on the sample data of each factor, and the gray correlation is used to describe the strength, magnitude, and order of the relationship between the factors [
26]. The process of calculating the gray correlation value is as follows [
27,
28]:
- 1.
Determine the number series to be compared
The compared columns are a set of data under two optimization metrics in
Table 4, i.e., xe (k) represents the signal-to-noise ratio values for MRR and R
a, respectively, where e = 1,2. xe (k) is the MRR optimization metric for e = 1, xe (k) is the R
a optimization metric for e = 2, and k is the number of trials serial number.
- 2.
Determination of the reference sequence
The reference sequence is the ideal value under the eth optimization metric, and the largest signal-to-noise ratio value among the two optimization metrics is set as the reference sequence, i.e., = (35.485 − 0.906).
- 3.
Dimensionless data processing
Since the data of each factor may have different magnitudes and orders of magnitude, the data need to be normalized without dimension. The equation for normalizing the magnitude of the compared series is as follows:
Equation (5): Normalized formula, where ye (k) is the value under the eth indicator and after normalization of the kth test scale, k = 1,2,3,…,16.
- 4.
Calculating the gray correlation coefficient
The gray correlation coefficient ξ
e (k) is calculated as follows:
Equation (6): Gray correlation coefficient.
: M is the maximum difference between the two levels, m is the minimum difference between the two levels, and ρ is the resolution factor. The value of ρ is calculated according to Equation (7):
Equation (7): Distinguishing coefficient.
Since there were two optimization metrics in this experiment, one resolution factor was calculated for a set of two metrics, resulting in a final resolution factor ρ = 0.178 used in this study.
- 5.
Determine gray correlation coefficient weights
The gray correlation coefficient weights are determined using a hierarchical analysis method (AHP). After an expert analysis, the importance degree of the MRR for the R
a is selected as 3; then, the importance degree of the R
a for the MRR is 1/3, and then the evaluation matrix Q is established, and the response weight matrix β is obtained after normalization by finding the maximum eigenvalue λmax and the corresponding eigenvector x of matrix Q. The evaluation matrix Q is shown in Equation (8), with the maximum eigenvalue λmax = 2, and the eigenvector x as Equation (9) is shown in Equation (10), and the response weight matrix β is shown in Equation (10).
Equation (8): Evaluation matrix.
Equation (9): Eigenvector x.
Equation (10): Weight matrix.
Therefore, the MRR weight β1 = 0.75, and the Ra weight β2 = 0.25, indicating that the most important optimization metric in this case is the MRR.
- 6.
Calculating Gray Correlation
The higher the correlation, the higher the degree of correlation between the comparison series and the reference series. The gray correlation value is calculated using the formula:
Equation (11): Gray relational grade.
βe is the weight value of the eth optimization index; rk is the gray correlation value.
The analysis results are shown in
Table 6. Based on the gray correlation value in
Table 6, the average gray correlation value under each level of the four process parameters is calculated, and at the same time, the extreme difference analysis is carried out, and the calculation results are shown in
Table 7; then, the primary and secondary relationships of the influence of each machining process parameter on the evaluation indexes of the MRR and R
a are in the following order: DC, WS, PT, and Ton.
According to the gray correlation analysis method, the larger the mean value of the gray correlation degree, the better the target response corresponding to this level of this factor; then, this level is the optimal level of this factor. From the above table, it can be seen that the optimal process parameter combination of the multi-objective optimization is as follows: pulse width: 22 μs, duty ratio: 1:4, number of power tubes: 3, and wire speed: 2, and the comprehensive gray correlation value of the MRR and Ra reaches the maximum value of 0.756 under this processing condition, which proves the feasibility of the multi-objective optimization model of the gray correlation analysis method.


