Article

Sensitive and Cost-Effective TLC-Densitometric Method for Determination of Metronidazole and Tinidazole in Tablets

by
Alina Pyka-Pająk
Department of Analytical Chemistry, Faculty of Pharmaceutical Sciences in Sosnowiec, Medical University of Silesia in Katowice, Jagiellońska 4, 41-200 Sosnowiec, Poland
Processes 2024, 12(4), 643; https://doi.org/10.3390/pr12040643
Submission received: 28 February 2024 / Revised: 18 March 2024 / Accepted: 21 March 2024 / Published: 24 March 2024
(This article belongs to the Special Issue Processes in 2023)

Abstract

:
A sensitive, easy-to-use, fast, and cost-effective TLC-densitometric method was developed for the separation of metronidazole, secnidazole, ornidazole, tinidazole, and 2-methyl-5-nitroimidazole and for the determination of metronidazole and tinidazole in Metronidazole Polpharma and Tinidazolum Polpharma tablets. Analyses were performed on chromatographic plates precoated with silica gel 60F254 using chloroform + methanol + diethylamine in a volume ratio of 9:1:1 as the optimal mobile phase. The method has been validated. The intraday and interday precision values for the three different concentrations ranged from 0.99% to 1.48% and 0.89% to 1.76%, and the precision values ranged from 1.13% to 2.48% and 0.95% to 2.49% for metronidazole and tinidazole, respectively. The limit of quantification (LOQ) was 0.036 and 0.066 µg/spot for metronidazole and tinidazole, respectively. The mean recovery was 103.1% and 100.6% for metronidazole and tinidazole, respectively. The content of metronidazole and tinidazole in tablets in relation to the content declared by the manufacturer was 101.3% and 99.8%, respectively. The obtained results were verified using the pharmacopeial method. The presented method is fast, sensitive, precise, selective, accurate, and robust. It allows for the analysis of several samples on one chromatography plate at the same time.

1. Introduction

Medicinal products on the market must be of appropriate quality to guarantee their safe application and effectiveness. Identity, purity, active substance content, and suitability are quality criteria describing a medicinal substance or product. The most commonly used methods for examining the identity of drugs are infrared absorption spectrophotometry, high-performance liquid chromatography (HPLC), thin-layer chromatography (TLC), and gas chromatography (GC) [1,2]. TLC combined with densitometry is also a great tool for investigating the content of biologically active substances in a drug and any impurities present in the drug, as well as for investigating many physicochemical properties, including the lipophilicity of biologically active substances [3,4,5,6,7,8,9,10,11,12,13].
The counterfeiting and illegal trade of medicine is a global problem. The scale of this phenomenon is becoming more and more common. This poses a threat to the safety and lives of patients. Falsified pharmaceuticals do not meet the quality requirements established for given medicinal products. They usually contain ingredients of lower quality, inappropriate proportions, impurities, or other unapproved active substances with unknown safety of use—these substances are dangerous to health and life. Quite often, their composition is completely different from what is declared on the packaging [14,15]. Hence, there is a need to constantly establish new analytical methods for the qualitative and quantitative testing of drugs. One such method could be TLC coupled with densitometry. Metronidazole (M), secnidazole (S), ornidazole (O), and tinidazole (T) are drugs commonly used to treat protozoan infestations and infections caused by anaerobic bacteria. The scientific literature describes using thin-layer chromatography methods for the determination of selected 5-nitoimidazole in the presence of another drug, e.g., metronidazole and di-iodohydroxychinoline [16], diiodohydroxyquine [17], spiramycin [18], furazolidone [19,20], loperamide [19], tetracycline hydrochloride [21], ciprofloxacin [22], diloxamide furoate [23], and clotrimazole [24] as well as tinidazole and clotrimazole [25,26], omeprazole [27], clarithromycin [27], fluconazole [28,29], norfloxacin [30,31,32], and ciprofloxacin [33]. TLC methods presented in the scientific literature are often not fully validated. Most often, the chromatographic systems used are not optimized, i.e., the separation of the determined 5-nitroimidazole from related substances is not verified. Sometimes, the authors do not determine the LOD and LOQ of the studied 5-ntroimidazoles. Previous publications have not presented details concerning checking the robustness of the used TLC method, nor have M and T been determined simultaneously in previous pharmaceutical preparations.
So far, the scientific literature has not described simultaneous chromatographic separation of M, S, O, T, and 2-methyl-5-nitroimidazole (IMP) using the TLC technique. Therefore, the aim of this work was to develop a fast and cheap TLC method allowing the chromatographic separation of M, S, O, T, and IMP as potential sources of contamination. For this reason, the chromatographic system used in this study is optimal. Therefore, the developed chromatographic conditions can be used in the pharmaceutical industry to determine the presence of M, S, O, and T in simple and combined drugs containing the mentioned 5-nitroimidazoles. It is also possible to check whether the tested pharmaceutical preparation is contaminated with IMP. Only pharmaceutical preparations containing M and T are available on the Polish pharmaceutical market. Therefore, the chromatographic conditions established here were only applied to determine the presence of M and T in tablets. The proposed method has been fully validated. The development of this method was also motivated by the need to obtain a quick and effective method of determination with a low detection limit and low cost. The low cost of the proposed TLC-densitometric method results from the use of TLC plates, which are much cheaper than the HPTLC plates used in numerous publications in which M or T were determined. As it has been shown, the TLC plates used provide similar or better sensitivity than those using HPTLC plates.

2. Materials and Methods

2.1. Chemicals and Reference Standards

Silica gel 60F254 (E. Merck, #1.05554, and #1.05570) plates were used in the investigation. The following solvents were applied: benzene (Bz), diethyl ether (DEET) methanol (MeOH), toluene (TLN), acetone (Ace), chloroform (TCM), ammonia 25% (AM), n-hexane (Hx), ethyl acetate (EA), ethanol 99.8% (EtOH), isopropanol (IP), acetic acid 80% (AcOH), glacial acetic acid (GAcOH), diethylamine (DEA), triethylamine (TEA), methylene chloride (MCL), acetonitrile (ACN). These solvents were of analytical purity and produced by POCh (Gliwice, Poland), Chempur (Piekary Śląśkie, Poland), or Merck (Darmstad, Germany) and used as components of the mobile phases. MeOH was also used to extract the M and T present in the tablets and to prepare the standard solutions. M, S, O, and T as well as IMP were supplied by Sigma-Aldrich (St. Louis, MI, USA). M and T were pharmaceutical primary standards with purities >99% according to the United States Pharmacopeia and European Pharmacopoeia, respectively. IMP was of British Pharmacopoeia (BP) reference standard. S and O were analytical standards with quality levels equal to 100. Metronidazole and Tinidazolum tablets (Polpharma, Starogard Szczeciński, Poland) contained 500 mg of M and 500 mg of T, respectively. Anhydrous AcOH (analytical purity, Chempur, Poland) and chloric acid (VII) (analytical purity, POCh, Poland) were used to determine M and T using the pharmacopeia method.

2.2. Standard Solutions of Active Pharmaceutical Ingredients (APIs)

Standard solutions of M and T have were made by dissolving their standard substances in MeOH. The following M and T solutions were obtained: 0.60, 0.55, 0.50, 0.45, 0.40, 0.35, 0.30, 0.25, 0.20, 0.15, 0.10, 0.08, 0.06, 0.04, 0.02, 0.01 mg·mL−1. MeOH solutions with M, S, O, T, and IMP were made at concentrations of 0.20 mg·mL−1.

2.3. Solutions of Metronidazole and Tinidazolum

After weighing, ten tablets of Metronidazole Polpharma and Tinidazolum Polpharma were crushed for 25 min using a three-ball mill at 6000 rpm. Then, the equivalent of 100 mg of M and 100 mg of T was weighed from the obtained powdered tablet masses. Extraction of M and T from tablet masses was carried out using 15 mL of MeOH using a three-ball mill at 6000 rpm for 20 min. The drug extracts obtained in this way were filtered through paper filters into volumetric flasks and supplemented with MeOH to a volume of 50 mL, obtaining solutions with a concentration of 100 mg/50 mL. In the next step, a series of dilutions were made to obtain solutions with the following concentrations of M and T: 0.3 mg/5 mL, 1.0 mg/5 mL, 1.75 mg/5 mL.

2.4. TLC-Densitometry

The chromatographic plates (#1.05554) were activated at 120 °C for 30 min. All solutions described in Section 2.2 and Section 2.3 were placed on chromatographic plates in 5 µL samples. The analyses were performed using TCM + MeOH + DEA as the mobile phase in a volume composition of 9:1:1. This composition was determined experimentally from among the 19 mobile phases analyzed (Table S1). The chromatographic chamber was saturated for 30 min. The development distance was 7.5 cm. Then, the plates were dried under a fume hood for 2 h.
Spectrodensitometric and densitometric analyses were performed using the Camag TLC 3 densitometer with a deuterium lamp. The parameters of the spectrodensitometric analyses were as follows: wavelength, 200 ÷ 400 nm; slit size, 12.00 × 0.40 mm; macro; scanning speed, 20 nm/s; resolution, 1 nm/step. Densitometric scanning parameters were as follows: λmax = 313 nm; slit size, 12.00 × 0.40 mm; macro; resolution, 100 µm/step; and scanning speed, 20 mm/s.

2.5. TLC Method Validation

Range and linearity, precision, accuracy, specificity, robustness, and limits of detection and quantification were determined according to validation guides [34,35], which allowed the validation of the TLC method for use in the determination of M and T. The accuracy of the method was additionally checked by comparison with the pharmacopeial method, already recognized as accurate [1]. Validation details are provided in Tables S2 and S3.

2.6. Quantitative Analysis of Metronidazole and Tinidazole in Tablets and Comparison with Pharmacopeial Method

The proposed TLC-densitometric method (method A) was compared with the pharmacopeia method (method B) to determine M and T in tablets. The comparison was studied by using ten independently repeated different analyses. The samples with concentrations of about 1 mg/mL described in the experimental section were investigated by method A. Method B involves the potentiometric titration of samples [1]. Powdered tablet samples containing 150 mg of M and T, respectively, were dissolved in 50 mL of anhydrous AcOH. The samples were titrated with chloric acid (VII) at a concentration of 0.1 mol/L, and the end point of the titration was determined using combined pH electrodes of type EPS (Elmetron, Zabrze, Poland). The differences between the two analytical methods were evaluated using Student’s t-test and the F-Snedecor value.

2.7. Statistical Analysis

The Statistica v. 13 PL program (StatSoft, Kraków, Poland) was used for statistical evaluation of the analytical results. Microsoft Office Excel 2016 was used to construct charts.
The arithmetic means, standard deviation (SD), and then a confidence interval with a confidence level equal to 95% were calculated for the series of measurements (n = 10) of the retardation factor (RF). Arithmetic means were calculated for a series (n = 5) of determined resolution factors Rs.
Intraday and interday precision (n = 3) were assessed by calculating the coefficient of variance (CV, %). The coefficient of variation was determined by calculating the arithmetic mean and standard deviation of the area of chromatographic bands for a given drug concentration.
The arithmetic means of series of measurements (n = 3) of the area of chromatographic bands for each concentration of metronidazole and tinidazole standard solutions were calculated and used to construct calibration curves. The areas of the chromatographic bands for each concentration were also characterized by calculating the standard deviation and the coefficient of variation. The determined calibration curves were characterized by calculating the correlation coefficient (r), the Fischer–Snedecor value (F), the value of statistical significance (p), and the standard error of the estimate (s). The correctness of the determined correlation equations was checked by calculating the differences in the area of the chromatographic bands calculated from the correlation equations and measured values. The standard deviation was also calculated for these differences.
Variance coefficients were used to assess the accuracy of the method. The average contents (previously calculated from calibration curves) of metronidazole and tinidazole in samples in terms of the internal standard, standard deviations, and then coefficients of variance were calculated.
Arithmetic means (n = 3) and standard deviations were also calculated for the determined effects when testing the robustness of the method and for the determined values of the detection limit and quantification limit of metronidazole and tinidazole.
The contents of metronidazole and tinidazole in tablets were calculated as the arithmetic mean of 10 independent measurements. The results of these determinations were characterized by calculating the amount of metronidazole and tinidazole (%) in relation to the label claim, standard deviation (SD), coefficient of variation (CV, %), and the confidence interval of the arithmetic mean with a confidence level equal to 95%. The results of the content of metronidazole and tinidazole in tablets obtained by the proposed TLC-densitometric method and the pharmacopeial method were compared using the Student’s t-test and Fischer–Snedecor test with a significance level of α = 0.05.

3. Results and Discussion

3.1. Validation

A TLC-densitometric method was developed for the separation of M, S, O, T, and IMP; i.e., the TLC-chromatogram present five chromatographic bands coming from the mentioned 5-nitroimidazoles. The elaborated chromatographic conditions were applied to determine the content of M and T in Metronidazole Polpharma and Tinidazolum Polpharma tablets. The method has been fully validated (Table 1, Table 2, Table 3, Table 4, Table 5 and Table S4, Figure 1, Figure 2, Figure 3, Figure 4, Figure 5, Figure 6, Figure 7, Figure 8 and Figures S1–S10).

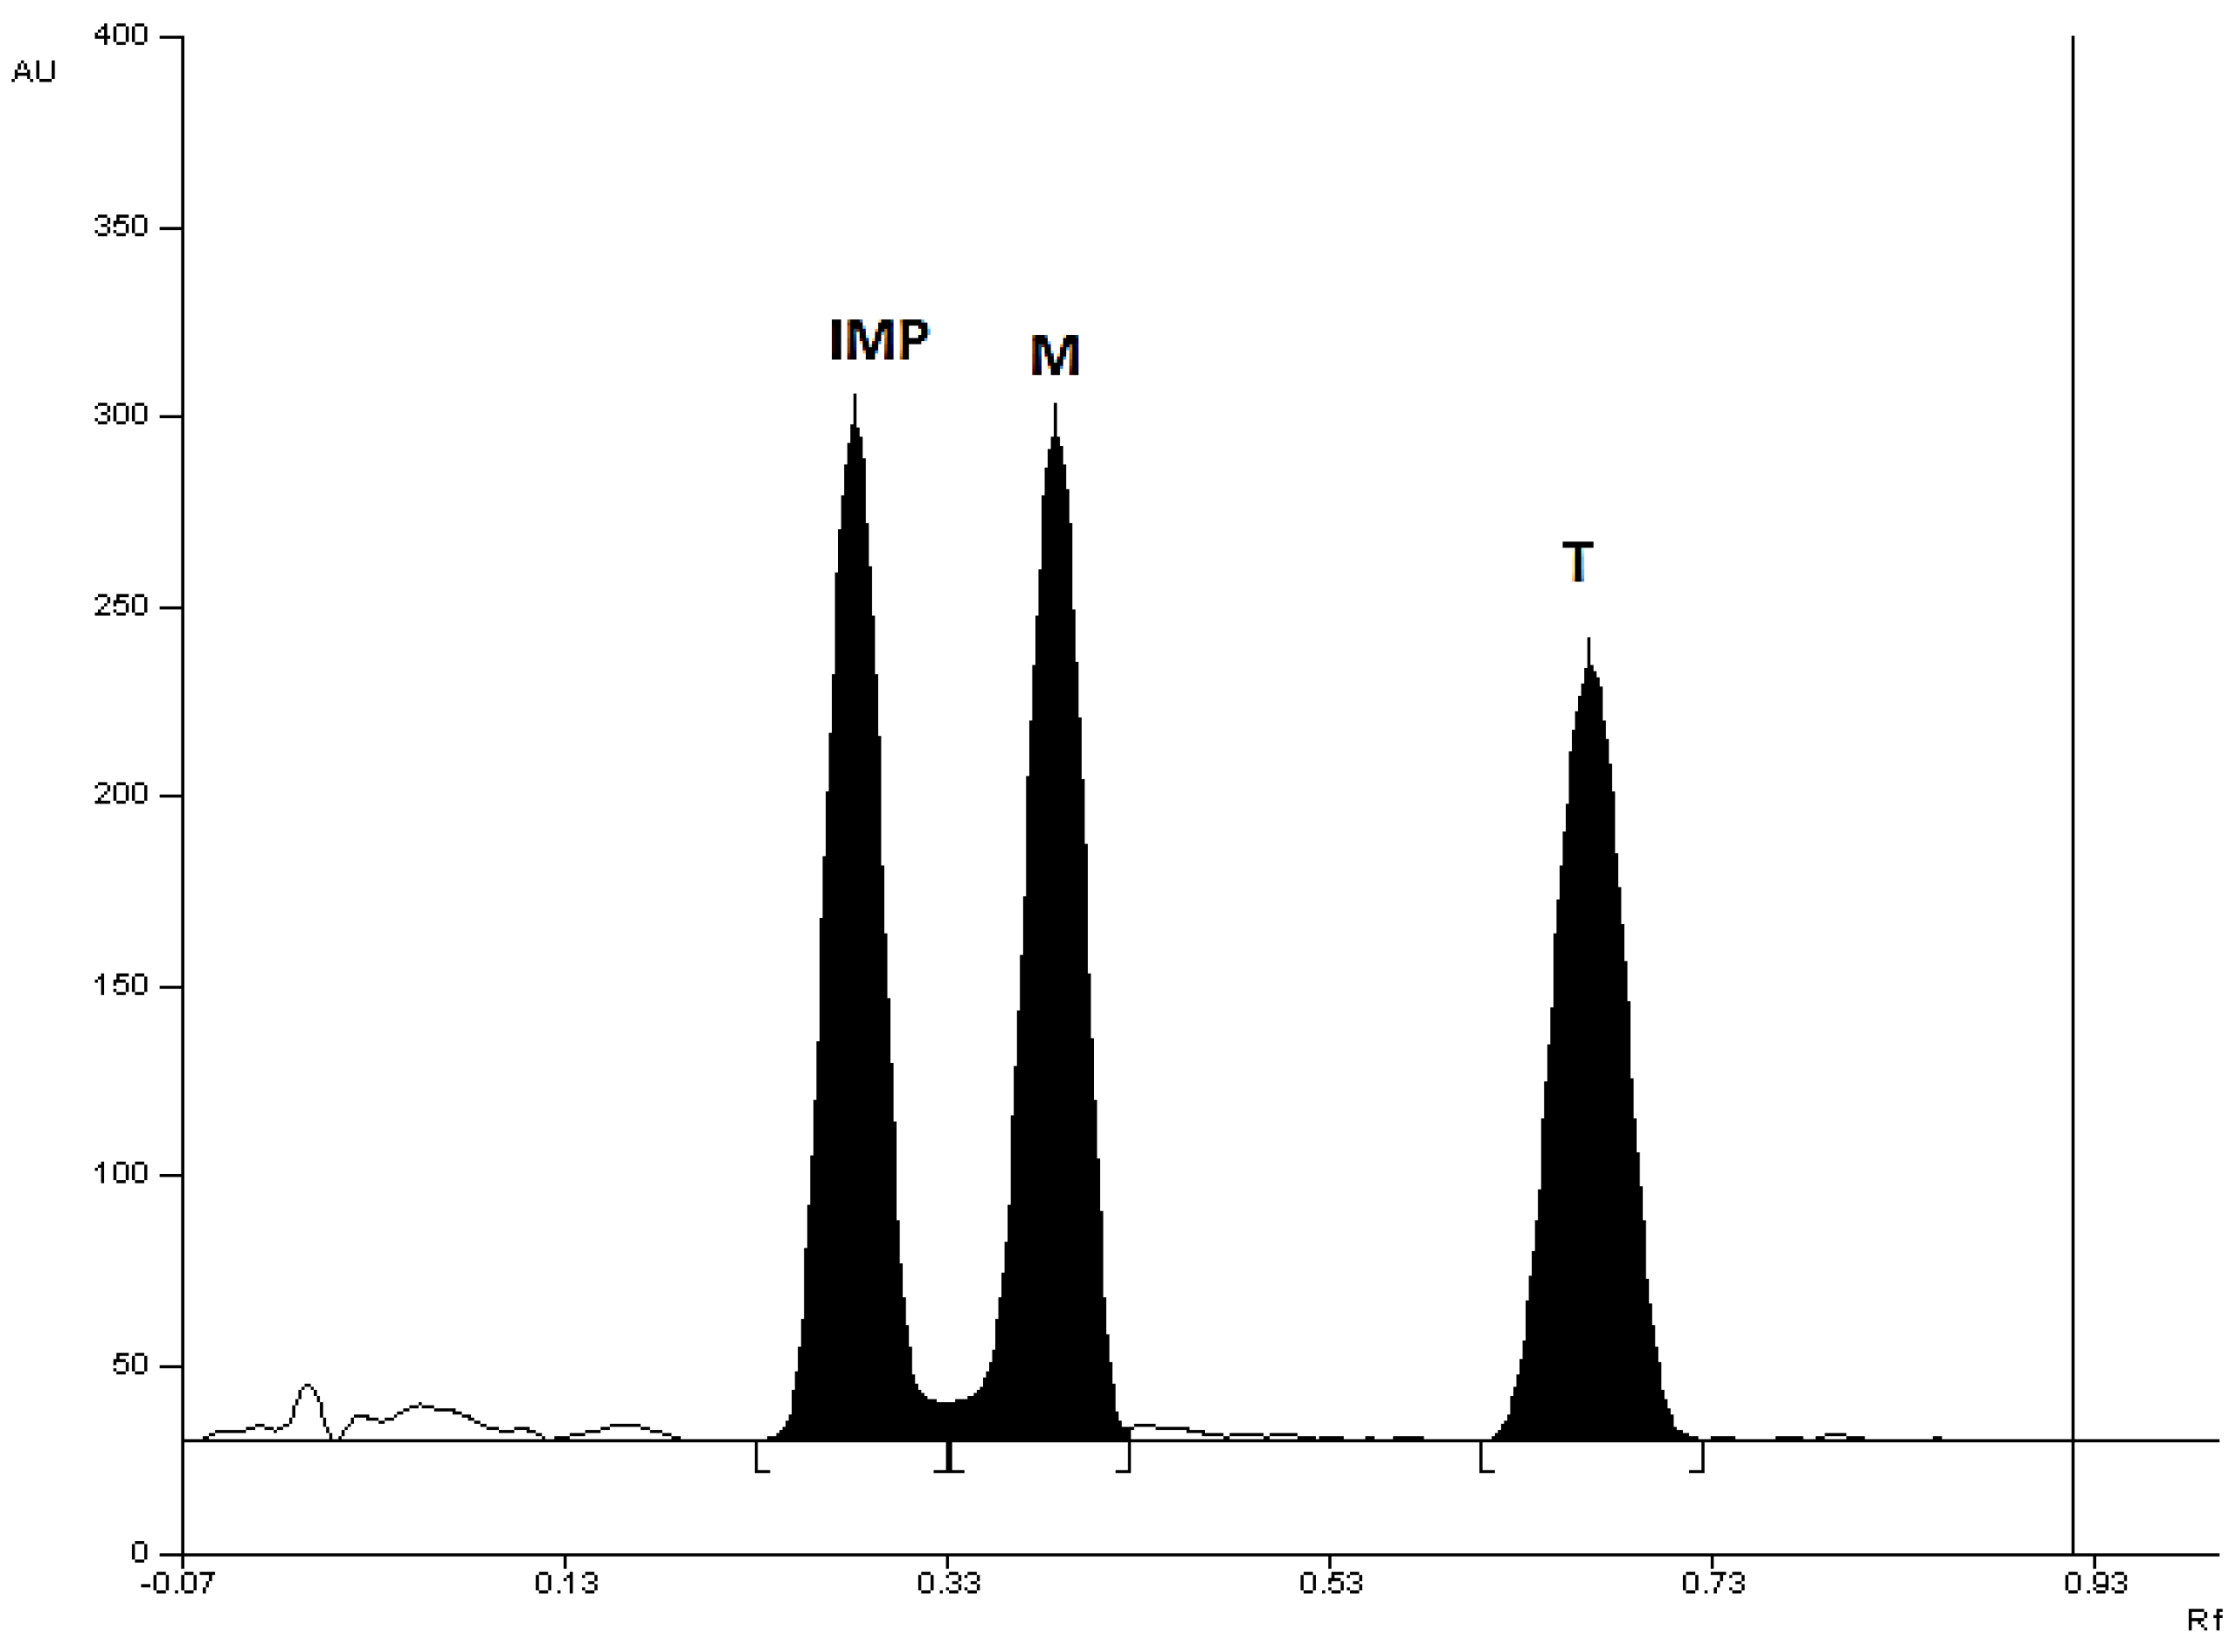
3.1.1. Optimization of Chromatographic Conditions

Chromatographic analyses were performed on plates precoated with silica gel 60F254. Nineteen mobile phases (Table S1) were tested for their ability to separate five substances, namely M, S, O, T, and the potential contamination of IMP. For this purpose, there must be a separation of each component, M, O, S, T and IMP, from the standard mixture; that is, there must be five chromatographic bands on the TLC-chromatogram. The chromatographic system can be considered optimal when this is achieved. In this study, mobile phases that were previously used for studies on metronidazole and tinidazole were tested [3,16,20,21,36,37,38]. Attempts were also made to optimize the developing distance. It turned out that increasing the chromatogram’s development distance had an adverse effect on the blurring of the chromatographic bands (the chromatographic bands of the substances were more blurred when a development distance greater than 8.0 cm was used). This is why in thin-layer chromatography without the forced flow of the mobile phase (i.e., analysis in a regular chromatographic chamber), when ordinary or high-performance plates are used, the values of the theoretical plate height (H) increase over a longer development distance. It is known that the lower the degree of blurring of the chromatographic bands, the better the separation of the bands and the lower the value of the theoretical shelf height (H) is, i.e., the more efficient the chromatographic system is. Moreover, increasing the chromatogram’s development distance also contributes to extending the analysis time. The tested mobile phase was TCM + MeOH 9:1 (phase no. 11), which proved to be effective for testing the degradation products of M, S, O, and T carried out in separate samples [36]. Using this mobile phase, four chromatographic bands were obtained on the TLC-chromatogram; no separation of metronidazole from secnidazole was achieved. On the TLC-chromatograms using mobile phase 18, only two chromatographic bands were obtained; using mobile phases 10 and 17, three chromatographic bands were obtained; and using mobile phases 1 and 3–7, four chromatographic bands were obtained. Five bands from individual tested biologically active substances were obtained using mobile phases number 2 (Figure S1), 8 (Figure S2), 9 (Figure S3), 12 (Figure S4), 13 (Figure S5), 14 (Figure S6), 16 (Figure S7), and 19 (Figure 1).
The order of elution of the substances depends on the mobile phase used. Also, the quality of separation of chromatographic bands varies depending on the mobile phase used. The RS separation coefficient was used to assess the quality of chromatographic separation. Table 1 lists the RF and RS values for the best M, S, O, T, and IMP separations. The presented comparison shows that the TCM + MeOH + DEA (9:1:1, v/v) mobile phase proposed in this work is the best. When using this mobile phase, all RS values are greater than 1. Using this mobile phase, the following RF values were obtained: RF(IMP) = 0.30 ± 0.02, RF(M) = 0.38 ± 0.03, RF(S) = 0.44 ± 0.03, RF(O) = 0.51 ± 0.03, RF(T) = 0.70 ± 0.04. The resolution factor (RS) had the following values: RS(IMP/M) = 1.33, RS(M/S) = 1.22, RS(S/O) = 1.29, RS(O/T) = 2.10. Therefore, it is possible to check whether the drug is contaminated with other 5-nitroimidazoles. For example, if a drug sample containing M is tested, whether it is contaminated with S, T, O, or IMP should be investigated. Spectrodensitometric analysis indicates that the maximum absorption of all five investigated compounds occurs at 313 nm (Figure S8). The TLC-chromatogram of a mixture of standard substances, namely M, T, and IMP, captured at 313 nm using TCM + MeOH + DEA (9:1:1, v/v) as the mobile phase is presented in Figure 2.
The TLC-chromatograms obtained from the Metronidazole Polpharma tablet and Tinidazolum Polpharma tablet extracts using the optimal chromatographic conditions are shown in Figure 3 and Figure 4, respectively, and indicate that there are no additional chromatographic bands detected in the analyzed tablets. This means that no impurities, including 2-methyl-5-nitroimidazole, were found in the drug samples. The RF values of the reference substances metronidazole and tinidazole are consistent with the RF values of metronidazole and tinidazole from the tablet samples. The spectrodensitograms of metronidazole and tinidazole standards were also found to be consistent with the spectrodensitograms of metronidazole and tinidazole from tablet samples (Figure 5 and Figure 6).

3.1.2. Linearity and Range

It was found that the linear range of M and T determined was from 0.20 to 2.00 µg/spot. The determined linear equations describing the relationship of the area of the chromatographic band (Table S4) to the amount of micrograms/spot of M and T are presented in Table 2 and in Figures S9A and S10A. The correlation coefficients (r) of the fitted models are equal to 0.9989 and 0.9992 for M and T, respectively, and indicate a relatively strong relationship between variables. The significance level (p) of less than 0.0001 shows that there is a statistically significant correlation between the peak area registered from the chromatogram and the amount of M and T at each level. The differences between the real chromatographic band area values and those calculated from the correlation equations are presented in Figures S9B and S10B. It can be observed that the residuals (±SD) were distributed above and below the zero residuals line, thus confirming the linearity of the proposed TLC method. This indicates that the construction of the correlation equations is correct.

3.1.3. Precision

The intra- and interday precision were described using the coefficient of variation (CV, %) by measuring the area of the chromatographic spots of M and T samples with concentrations of 0.30, 1.00, and 1.75 µg/spot. The CV values ranged from 0.99% to 1.12% and from 1.33% to 1.48% for M and from 0.76% to 1.28% and from 0.99% to 1.76% for T, respectively, for intraday and interday precision (Table 2). These results indicate that the proposed method is precise.

3.1.4. Accuracy

The recovery was used to test the accuracy of the method. The average recovery for metronidazole was 103.8%, 104.3%, and 101.2% and 101.8%, 99.1%, and 100.9% for tinidazole for 50%, 100%, and 150% of standard substances added to the Metronidazole Polpharma and Tinidazolum Polpharma samples, respectively (Table 2). The low CV values, which are less than 3% for both M and T, indicate that the elaborated method is accurate.

3.1.5. Limit of Detection (LOD) and Limit of Quantification (LOQ)
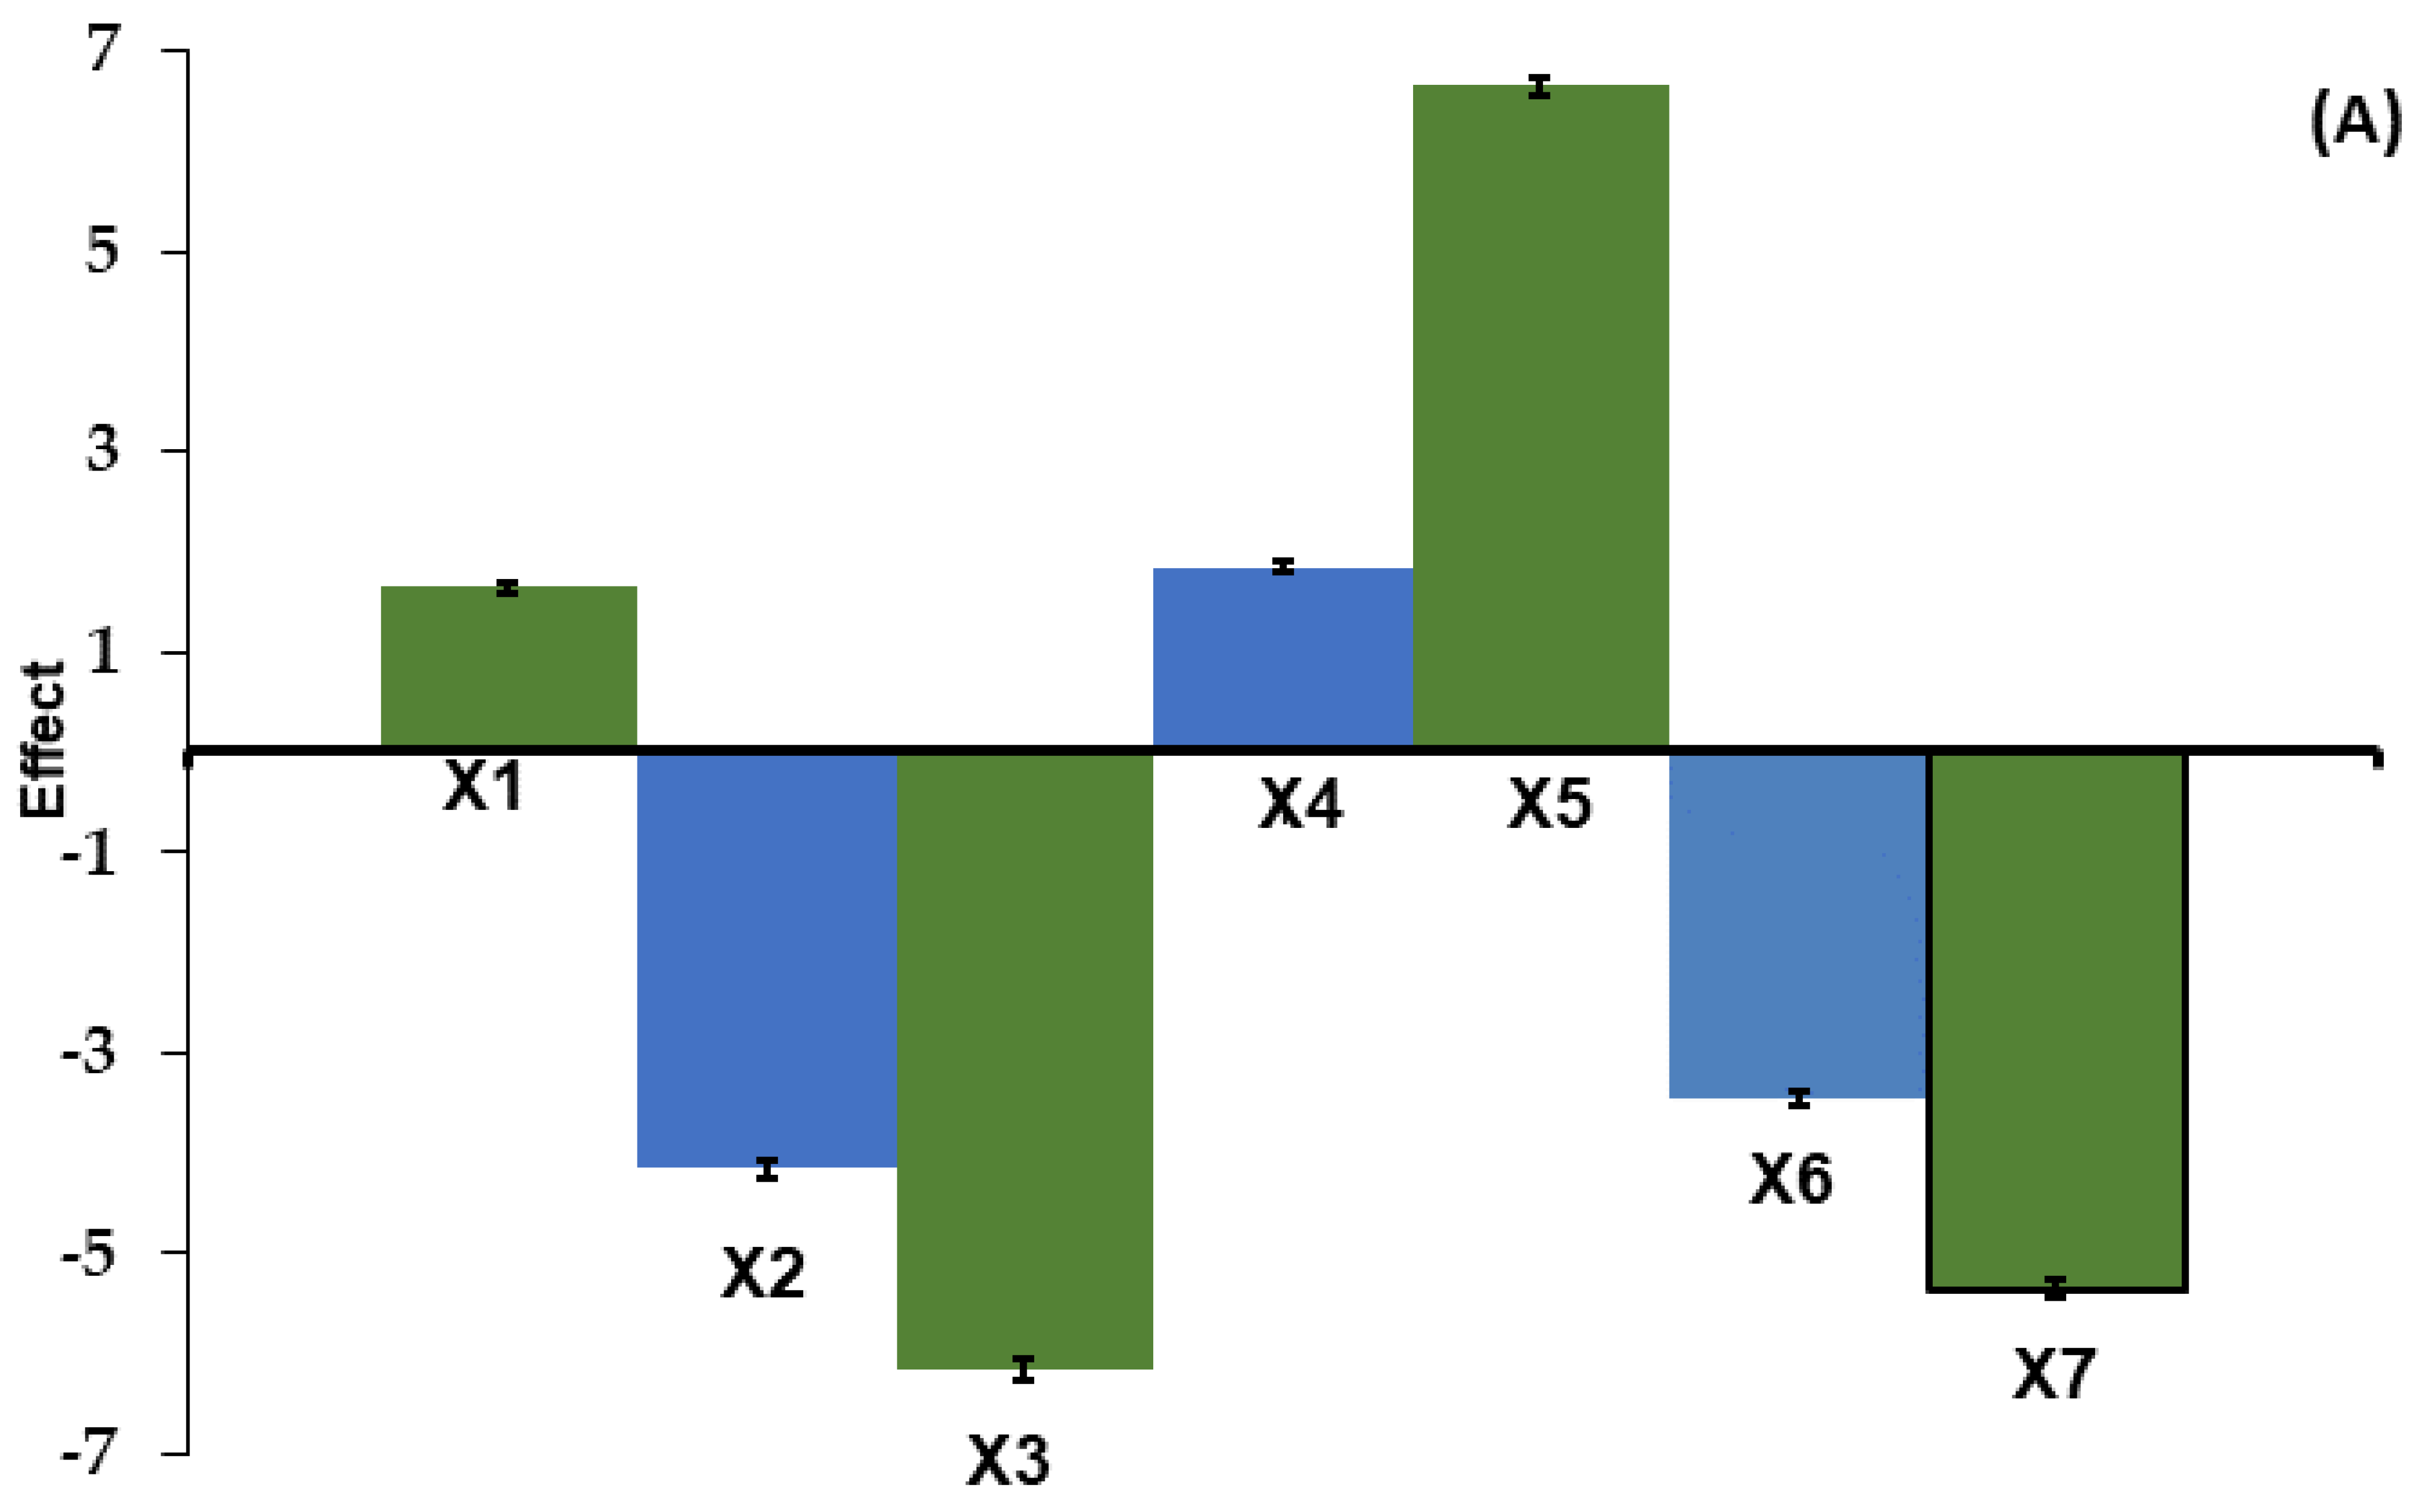
The LOD values calculated are equal 0.012 and 0.022 µg/spot for M and T, respectively. The average values of the LOQ are equal 0.036 and 0.066 µg/spot for M and T, respectively. The low LOD and LOQ values indicate that the proposed TLC-densitometric method is sensitive.
After reviewing the publicly available literature on the determination of M and T using TLC methods, the obtained LOD and LOQ results were compared with those obtained by the exemplary authors of other studies (Table 3). The presented comparison shows that the elaborated TLC combined with densitometry method provides lower LOD and LOQ values for M and comparable or lower LOD and LOQ values for T in relation to those previously described in the scientific literature. The obtained LOD and LOQ values of M and T are influenced by the chromatographic conditions used (e.g., chromatographic plates used and the qualitative and quantitative composition of the applied mobile phase).
A very important element in determining the LOD is checking whether solutions of appropriately selected concentrations were used for testing. The LOD results obtained must meet the following criteria [39]: 10 × LOD > C and LOD < C, where C represents the concentrations of metronidazole or tinidazole used.

3.1.6. Robustness

The robustness of the method was checked in accordance with previously described guidelines [35,40,41]. Analyses were performed in accordance with the information presented in Table 4 and Table S3, with the following conditions being changed: the sorbent type, the development distance, the plate activation temperature, the extraction time, the saturation time of the chamber, the wavelength in densitometric analysis at λ, and the volume of TCM in the mobile phase. The effects (E) characterizing the particular individual factors and rank probabilities were calculated. Table 4 shows the results regarding the determination of the content of metronidazole and tinidazole in Metronidazole Polpharma and Tinidazolum Polpharma tablets under the changed analysis conditions. The results of the analyses were interpreted using the coefficient of variance. The effects of factors (A) and half-normal probability plot of effects (B) for the determination of metronidazole (M) in Metronidazole Polpharma tablets and for the determination of tinidazole (T) in Tinidazolum Polpharma tablets are presented in Figure 7 and Figure 8. The strong correlations between Pi and the calculated effects (R2 > 0.93) and low p values < 0.001 (Figure 7B and Figure 8B) confirm that the method is robust. The standard deviation of M and T contents (yi) in commercial tablets with the seven parameters which have been changed in the conducted experiments in order to check the robustness of the applied method was 1.5% and 1.3% for M and T, respectively. A CV value < 2% indicates the reliability of the proposed TLC-densitometric method.

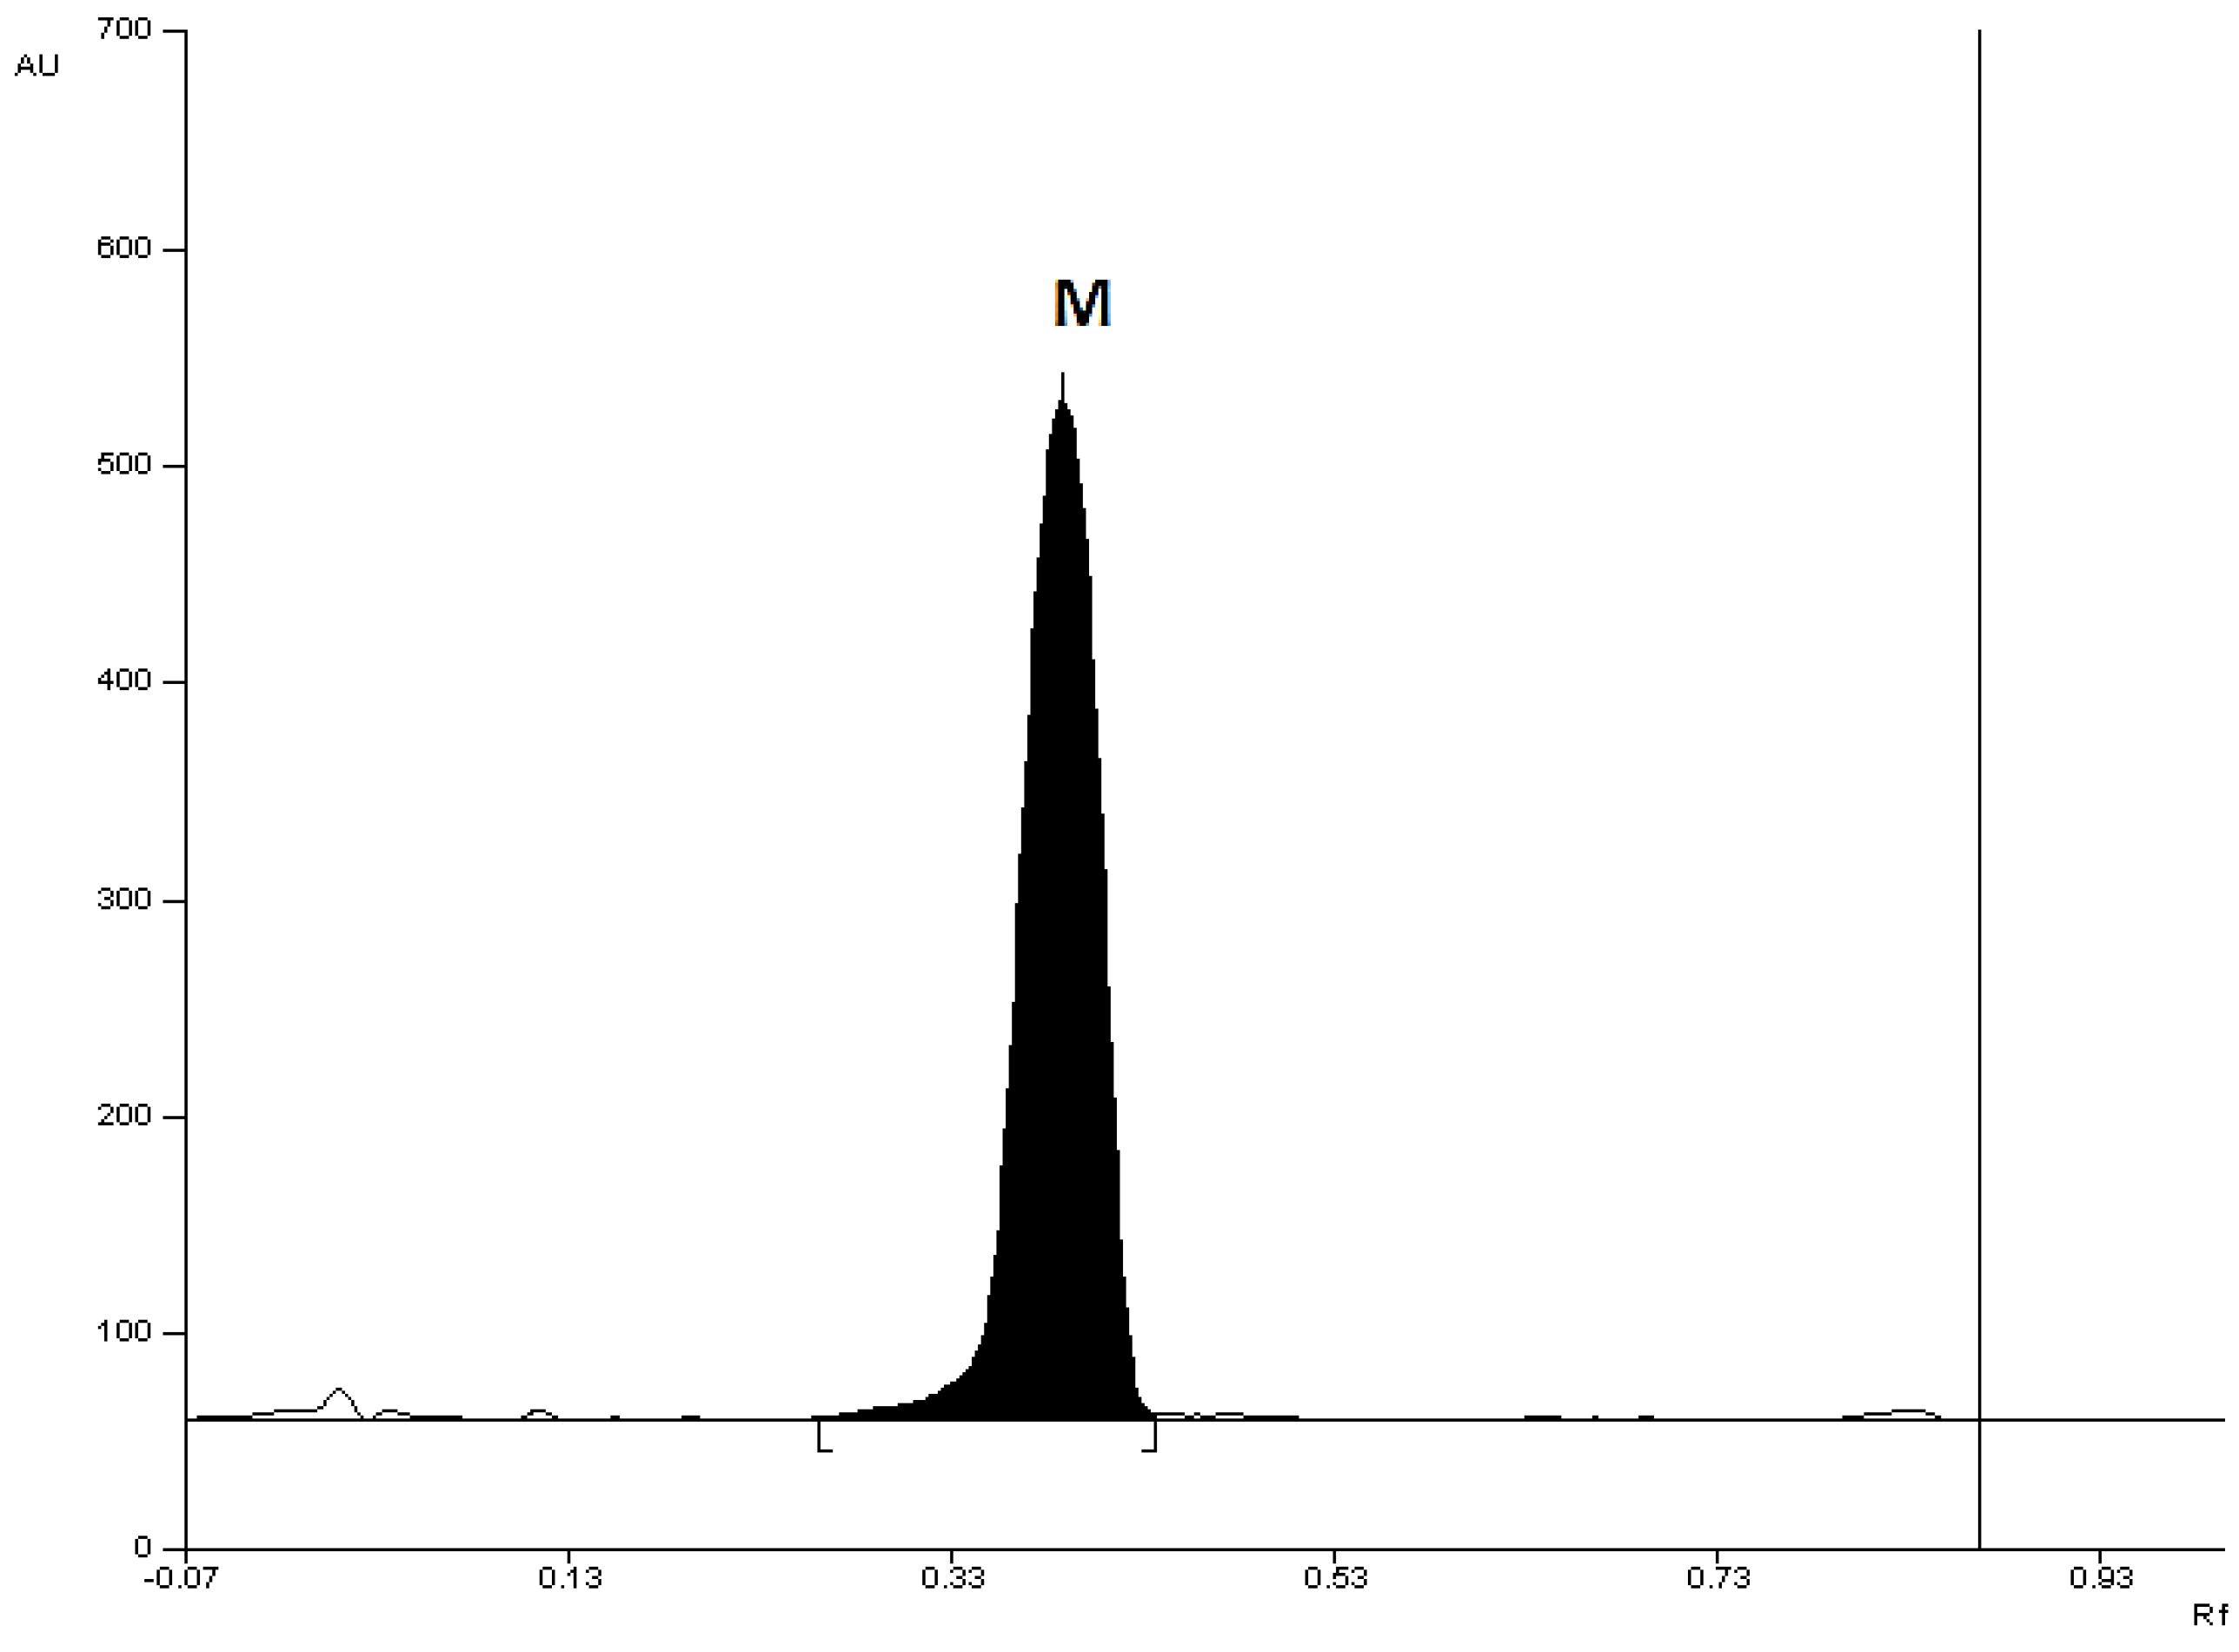
3.2. Quantitative Analysis of M and T in Tablets and Comparison with Pharmacopeial Method

Table 5 shows the results regarding the determination of M and T in Metronidazole Polpharma and Tinidazolum Polpharma tablets. The content of M and T in tablets determined by the TLC-densitometric method was 506.5 and 499.4 mg, respectively. The content of M and T in tablets in relation to the content declared by the manufacturer was 101.3% and 99.8%, respectively. These results are consistent with pharmacopeial requirements, as they range from 95% to 105% [1,2]. The obtained results were verified using the pharmacopeial method. The comparison of both methods is summarized in Table 5. The results obtained with both methods are similar. This is confirmed by the calculated statistical parameters t and F. The calculated t and F values also confirm that the proposed TLC-densitometric method is accurate.

4. Conclusions

A sensitive and cost-effective TLC-densitometric method was developed for the chromatographic separation of M, T, S, O, and IMP, as well as for the determination of M and T in tablets. The developed chromatographic conditions can be used in the pharmaceutical industry to determine the presence of M, S, O, T in simple and combined drugs containing the mentioned 5-nitroimidazoles. It is also possible to check whether the tested pharmaceutical preparation is contaminated with IMP using this method. The method has been validated. The intraday and interday precision values for the three different concentrations ranged from 0.99% to 1.48% and 0.89% to 1.76%, and the precision values ranged from 1.13% to 2.48% and 0.95% to 2.49% for M and T, respectively. The limit of quantification (LOQ) was 0.036 and 0.066 µg/spot for M and T, respectively. The mean recovery was 103.1% and 100.6% for M and T, respectively. The content of M and T in the tablets in relation to the content declared by the manufacturer was 101.3% and 99.8%, respectively. These results are consistent with pharmacopeial requirements, as they range from 95% to 105%. The presented method turned out to be fast, sensitive, selective, accurate, and robust. The obtained results were verified using the pharmacopeial method. Comparison of both the proposed and pharmacopeial methods shows that the proposed method is accurate. The low cost of the proposed TLC-densitometric method results from the use of TLC plates, which are much cheaper than the HPTLC plates used in numerous publications in which the presence of M or T was determined. The TLC plates used provide similar or better sensitivity than HPTLC plates. The developed TLC-densitometric method can be also used to test the purity of M, S, T, and O as well as drugs containing the mentioned 5-nitroimidazoles. Our method allows for the analysis of several samples on one chromatography plate at the same time. This method is suitable for quick and routine testing of the contents of pharmaceutical preparations and for routine quality control checks of products in the pharmaceutical industry.

Supplementary Materials

The following supporting information can be downloaded at: https://www.mdpi.com/article/10.3390/pr12040643/s1, Table S1: Mobile phases tested, Table S2: Details of the validation of the proposed TLC-densitometric method, Table S3: The factors and their levels investigated in robustness test, Figure S1: TLC-chromatogram of a mixture of standard substances: M, S, O, T, and IMP made at 313 nm, using mobile phase: Ace + TCM + EA (4:4:1, v/v), Figure S2: TLC-chromatogram of a mixture of standard substances: M, S, O, T, and IMP made at 313 nm, using mobile phase: TCM + MeOH + AM (9:1:0.06, v/v), Figure S3: TLC-chromatogram of a mixture of standard substances: M, S, O, T, and IMP made at 313 nm, using mobile phase: TCM + MeOH + AM (9:1:0.1, v/v), Figure S4: TLC-chromatogram of a mixture of standard substances: M, S, O, T, and IMP made at 313 nm, using mobile phase: TCM + MeOH + GAcOH (9:1:0.1, v/v), Figure S5: TLC-chromatogram of a mixture of standard substances: M, S, O, T, IMP made at 313 nm, using mobile phase: TCM + MeOH + GAcOH (9:1:0.05, v/v), Figure S6: TLC-chromatogram of a mixture of standard substances: M, S, O, T, and IMP made at 313 nm, using mobile phase: Ace + TCM + EA + GAcOH (4:4:1:0.05, v/v), Figure S7: TLC-chromatogram of a mixture of standard substances: M, S, O, T, and IMP made at 313 nm, using mobile phase: Ace + TCM + EA + ACN (3:4:1:1, v/v), Figure S8: Comparison of UV spectra of M, S, O, T, and IMP, Table S4. Average area of the chromatographic bands, standard deviations, coefficient of variations for solution series of chromatographed M and T. Figure S9: Calibration plot (A) and plot of residuals (±SD) (B) for metronidazole (M) in the linear working range mobile phase: TCM + MeOH + DEA in a volume ratio of 9:1:1, Figure S10: Calibration plot (A) and plot of residuals (±SD) (B) for tinidazole (T) in the linear working range mobile phase: TCM + MeOH + DEA in a volume ratio of 9:1:1.

Funding

This research was funded by the Medical University of Silesia under grant number PCN-1-040/K/2/F and BNW-1-005/K/3/F.

Data Availability Statement

Data are contained within the article and the Supplementary Materials.

Conflicts of Interest

The author declares no conflicts of interest.

References

  1. Polish Pharmaceutical Society. Polish Pharmacopoeia X; Polish Pharmaceutical Society: Warsaw, Poland, 2014. (In Polish) [Google Scholar]
  2. United States Pharmacopeial Convention. The United States Pharmacopoeia, 34th ed.; United States Pharmacopeial Convention: Rockville, MD, USA, 2011. [Google Scholar]
  3. Komsta, Ł.; Waksmundzka-Hajnos, M.; Sherma, J. Thin Layer Chromatography in Drug Analysis, 1st ed.; CRC Press: Boca Raton, FL, USA, 2014. [Google Scholar]
  4. Sherma, J.; Fried, B. Handbook of Thin Layer Chromatography, 3rd ed.; Revise and Expanded; Marcel Dekker, Inc.: New York, NY, USA, 2003. [Google Scholar]
  5. Bober, K.; Bębenek, E.; Boryczka, S. Application of TLC for evaluation of the lipophilicity of newly synthetized esters: Betulin derivatives. J. Anal. Methods Chem. 2019, 2019, 1297659. [Google Scholar] [CrossRef] [PubMed]
  6. Bębenek, E.; Bober-Majnusz, K.; Siudak, S.; Chrobak, E.; Kadela-Tomanek, M.; Wietrzyk, J.; Boryczka, S. Application of TLC to evaluate the lipophilicity of newly synthesized betulin derivatives. J. Chromatogr. Sci. 2020, 58, 323–333. [Google Scholar] [CrossRef]
  7. Wicha-Komsta, K.; Komsta, Ł. Unconventional TLC systems in lipophilicity determination: A review. J. Liq. Chromatogr. Rel. Technol. 2017, 40, 219–225. [Google Scholar] [CrossRef]
  8. Pastewska, M.; Bednarczyk-Cwynar, B.; Kovačević, S.; Buławska, N.; Ulenberg, S.; Georgiev, P.; Kapica, H.; Kawczak, P.; Bączek, T.; Sawicki, W.; et al. Multivariate assessment of anticancer oleanane triterpenoids lipophilicity. J. Chromatogr. A 2021, 1656, 462552. [Google Scholar] [CrossRef]
  9. Nagi, D.M.; Abdelgaleel, M.; Derayea, S.M.; Khashaba, P.Y. Studying the kinetic of midodrine degradations using TLC stability approach: Application to dosage form and human plasma. J. Pharm. Biomed. Anal. 2023, 229, 115322. [Google Scholar] [CrossRef]
  10. Shah, D.A.; Gondalia, I.I.; Patel, V.B.; Mahajan, A.; Chhalotiya, U.; Nagda, D.C. Stability indicating thin-layer chromatographic method for estimation of antidiabetic drug Remogliflozin etabonate. Futur J. Pharm. Sci. 2021, 7, 83. [Google Scholar] [CrossRef]
  11. Soudi, A.T.; Hussein, O.G.; Elzanfaly, E.S.; Zaazaa, H.E.; Abdelkawy, M. Stability indicating TLC–densitometric method for determination of alcaftadine in presence of its degradation products and dosage form preservatives. Res. J. Pharm. Technol. 2020, 13, 5171–5176. [Google Scholar] [CrossRef]
  12. Yeniceli Uğur, D.; Uğur, A. Analysis of anticancer drugs using thin layer chromatography—A review. Marmara Pharm. J. 2018, 22, 334–346. [Google Scholar] [CrossRef]
  13. Sherma, J.; Rabel, F. Advances in the thin layer chromatographic analysis of counterfeit pharmaceutical products: 2008–2019. J. Liq. Chromatogr. Rel. Technol. 2019, 42, 367–379. [Google Scholar] [CrossRef]
  14. Cvetanovski, F.; Brezovska, K.; Poceva Panovska, A.; Tonic Ribarska, J.; Sterjev, Z.; Grozdanova, A.; Netkovska, K. Counterfeiting of medicines as an infringement of the intellectual property rights. Maced. Pharm. Bull. 2016, 62, 85–89. [Google Scholar] [CrossRef]
  15. Pathak, R.; Gaur, V.; Sankrityayan, H.; Gogtay, J. Tackling counterfeit drugs: The challenges and possibilities. Pharm. Med. 2023, 37, 281–290. [Google Scholar] [CrossRef]
  16. Ali, N.W.; Gamal, M.; Abdelkawy, M. Chromatographic methods for simultaneous determination of di-iodohydroxyquinoline and metronidazole in their binary mixture. Pak. J. Pharm. Sci. 2013, 26, 865–871. [Google Scholar]
  17. Salem, H.; Riad, S.; Rezk, M. Simultaneous determination of metronidazole and diiodohydroxyquine in bulk powder and aaramibe compound tablets by TLC-densitometry and HPLC. Pharm. Anal. Acta 2012, 10, 2153–2423. [Google Scholar]
  18. Maher, H.M.; Youssef, R.M. Development of validated chromatographic methods for the simultaneous determination of metronidazole and spiramycin in tablets. Chromatographia 2009, 69, 345–350. [Google Scholar] [CrossRef]
  19. Kavitha, J.; Kishore, C.H.; Lakshmi, K.S. Simultaneous estimation of metronidazole, furazolidone and loperamide by HPTLC in veterinary formulation. Int. J. Pharm. Sci. 2013, 5, 620–625. [Google Scholar]
  20. Tendolkar, N.M.; Desai, B.S.; Gaudh, J.S.; Shinde, V.M. Simultaneous determination of tinidazole and furazolidone in suspension by HPTLC and HPLC. Anal. Lett. 1995, 28, 1641–1653. [Google Scholar] [CrossRef]
  21. Sharma, S.; Sharma, M.C. Development and validation of densitometric method for metronidazole and tetracycline hydrochloride in capsule dosage form. Int. J. Pharma Tech. Res. 2011, 3, 1169–1173. [Google Scholar]
  22. Elkady, E.F.; Mahrouse, M.A. Reversed-phase ion-pair HPLC and TLC-densitometric methods for the simultaneous determination of ciprofloxacin hydrochloride and metronidazole in tablets. Chromatographia 2011, 73, 297–305. [Google Scholar] [CrossRef]
  23. Morcoss, M.M.; Abdelwahab, N.A. Different chromatographic methods for simultaneous determination of diloxanide furoate, metronidazole and its toxic impurity. J. Iran. Chem. Soc. 2016, 13, 1643–1651. [Google Scholar] [CrossRef]
  24. Meshram, D.B.; Bagade, S.B.; Tajne, M.R. TLC-densitometric analysis of clotrimazole and metronidazole in combined dosage forms. J. Planar. Chromatogr.—Mod. TLC 2008, 21, 277–282. [Google Scholar] [CrossRef]
  25. Meshram, D.; Patel, D.; Rohit, M.; Desai, S.; Tajne, M.R. Simultaneous determination of clotrimazole and tinidazole in tablet and cream by HPTLC. Int. J. Adv. Res. 2014, 2, 855–863. [Google Scholar]
  26. Patel, S.K.; Kapupara, P.P.; Shah, K.V. Simultaneous estimation of clotrimazole and tinidazole in pharmaceutical formulation by HPTLC. Int. J. Res. Dev. Pharm. Life Sci. 2015, 4, 1635–1640. [Google Scholar]
  27. Salem, H.; Riad, S.; Reda, M.; Ahmed, K. Simultaneous determination of omeprazole, tinidazole and clarithromycin in bulk powder and Helicure tablets by TLC- densitometric technique. J. Pharm. Educ. Res. 2013, 4, 34–40. [Google Scholar]
  28. Meshram, D.B.; Mishra, P.; Desai, S.D.; Tajne, M.R. Simultaneous determination of fluconazole and tinidazole in combined dose tablet using high performance thin layer chromatography. Der Chem. Sin. 2017, 8, 133–137. [Google Scholar]
  29. Nethra, K.; Shaik Mohammed, Z.; Kavitha, J.; Seetharaman, R.; Kokilambigai, K.S.; Lakshmi, K.S. Deve;opment and validation of stability indicating HPTLC method for the simultaneous estimation of tinidazole and fluconazole and its applicability in marketed dosage form. Int. J. Appl. Pharm. 2022, 14, 153–160. [Google Scholar]
  30. Mohammad, M.A.; Zawilla, N.H.; El-Anwar, F.M.; El-Moghazy Aly, S.M. Stability indicating methods for the determination of norfloxacin in mixture with tinidazole. Chem. Pharm. Bull. 2007, 55, 1–6. [Google Scholar] [CrossRef] [PubMed]
  31. Naguib, I.A.; Abdelaleem, E.A.; Hassa, E.S.; Ali, N.W. HPTLC method for simultaneous determination of norfloxacin and tinidazole in presence of tinidazole impurity. J. Chromatogr. Sci. 2019, 57, 81–86. [Google Scholar] [CrossRef]
  32. Abou-Taleb, N.H.; El-Enany, N.M.; El-Sherbiny, D.T.; El-Subbagh, H.I. Digitally enhanced thin layer chromatography for simultaneous determination of norfloxacin and tinidazole with the aid of Taguchi orthogonal array and desirability function approach: Greenness assessment by analytical Eco-Scale. J. Sep. Sci. 2020, 43, 1195–1202. [Google Scholar] [CrossRef]
  33. Saraya, R.E.; Hassan, Y.F.; Eltoukhi, W.E.; Salman, B.I. Application of the green analytical procedure index to the simultaneous analysis of co-formulated tinidazole and ciprofloxacin in pure form, tablet dosage form, and human plasma using an environmentally friendly micellar high-performance thin-layer chromatographic technology. J. Planar Chromatogr.—Mod. TLC 2023, 36, 21–30. [Google Scholar] [CrossRef]
  34. ICH Harmonised Tripartite Guideline: Validation of Analytical Procedures: Text and Methodology, Q2(R1); ICH: Geneva, Switzerland, 2005; Available online: https://database.ich.org/sites/default/files/Q2%28R1%29%20Guideline.pdf (accessed on 14 December 2023).
  35. Ferenczi-Fodor, K.; Renger, B.; Végh, Z. The frustrated reviewer—Recurrent failures in manuscripts describing validation of quantitative TLC/HPTLC procedures for analysis of pharmaceuticals. J. Planar Chromatogr.—Mod. TLC 2010, 23, 173–179. [Google Scholar] [CrossRef]
  36. Pyka-Pająk, A. TLC–densitometric analysis of selected 5-nitroimidazoles. Processes 2023, 11, 170. [Google Scholar] [CrossRef]
  37. Agbaba, D.; Djurkovic, M.; Brboric, J.; Zivanov-Stakic, D. Simultaneous HPTLC determination of metronidazole and its impurity 2-methyl-5-nitroimidazole in pharmaceuticals. J. Planar Chromatogr.—Mod. TLC 1998, 11, 447–449. [Google Scholar]
  38. Sanyal, S.N.; Datta, A.K.; Chakrabarti, A. Stability indicating TLC method for the quantification of tinidazole in pharmaceutical dosage form—I.V. Fluid. Drug Dev. Ind. Pharm. 1992, 18, 2095–2100. [Google Scholar] [CrossRef]
  39. Konieczka, P.; Namiesnik, J. Validation of analytical procedures. In Evaluation and Quality Control of Analytical Measurement Results; Konieczka, P., Namiesnik, J., Eds.; WNT: Warsaw, Poland, 2007. (In Polish) [Google Scholar]
  40. Hendix, C.D. What every technologist should know about experiment design. Chem. Technol. 1979, 9, 167–174. [Google Scholar]
  41. Nagy-Turák, A.; Végh, Z.; Ferenczi-Fodor, K. Validaton of the quantitative planar chromatographic analysis of drug substances. III. Robustness testing in OPLC. J. Planar Chromatogr.—Mod. TLC 1995, 8, 188–193. [Google Scholar]
Figure 1. TLC-chromatogram of a mixture of standard substances: M, S, O, T, and IMP at 313 nm, using mobile phase of TCM + MeOH + DEA (9:1:1, v/v).
Processes 12 00643 g001
Figure 2. TLC-chromatogram of a mixture of standard substances (M, T, and IMP) captured at 313 nm, using the mobile phase TCM + MeOH + DEA (9:1:1, v/v).
Processes 12 00643 g002
Figure 3. TLC-chromatogram of a Metronidazole Polpharma drug sample captured at 313 nm, using the mobile phase TCM + MeOH + DEA (9:1:1, v/v); M—metronidazole.
Processes 12 00643 g003
Figure 4. TLC-chromatogram of a Tinidazolum Polpharma drug sample captured at 313 nm, using the mobile phase TCM + MeOH + DEA (9:1:1, v/v); T—tinidazole.
Processes 12 00643 g004
Figure 5. Comparison of the UV spectrum obtained for the standard substance M with the UV spectrum obtained for M, the source of which was a sample of Metronidazole Polpharma tablets.
Processes 12 00643 g005
Figure 6. Comparison of the UV spectrum obtained for the standard substance T with the UV spectrum obtained for T, the source of which was a sample of Tinidazolum Polpharma tablets.
Processes 12 00643 g006
Figure 7. The effects (±SD) of factors (A) and relationship between the half-normal probability and the effects (B) for determination of metronidazole (M) in Metronidazol Polpharma tablets.
Processes 12 00643 g007aProcesses 12 00643 g007b
Figure 8. The effects (±SD) of factors (A), and relationship between the half-normal probability and the effects (B) for determination of tinidazole (T) in Tinidazolum Polpharma tablets.
Processes 12 00643 g008aProcesses 12 00643 g008b
Table 1. RF and Rs values for the best separations of M, S, O, T, and IMP.
No of Mobile Phase a Average RF and Rs Values
2RFRF(M) = 0.35 ± 0.02, RF(O) = 0.43 ± 0.02, RF(T) = 0.50 ± 0.02, RF(S) = 0.57 ± 0.02, RF(IMP) = 0.64 ± 0.03;
RSRS(M/O) = 0.78, RS(O/T) = 0.77, RS(T/S) = 0.83, RS(S/IMP) = 0.80
8RFRF(IMP) = 0.36 ± 0.02, RF(M) = 0.41 ± 0.02, RF(O) = 0.46 ± 0.03, RF(S) = 0.51 ± 0.03, RF(T) = 0.59 ± 0.03;
RSRS(IMP/M) = 0.75, RS(M/O) = 1.07, RS(O/S) = 1.05, RS(S/T) = 1.29
9RFRF(IMP) = 0.31 ± 0.02, RF(M) = 0.34 ± 0.02, RF(S) = 0.39 ± 0.02, RF(O) = 0.47 ± 0.03, RF(T) = 0.59 ± 0.03;
RSRS(IMP/M) = 0.83, RS(M/S) = 1.27, RS(S/O) = 1.43, RS(O/T) = 1.78
12RFRF(M) = 0.45 ± 0.02, RF(IMP) = 0.49 ± 0.02, RF(O) = 0.55 ± 0.03, RF(S) = 0.65 ± 0.02, RF(T) = 0.74 ± 0.03;
RSRS(M/IMP) = 0.83, RS(IMP/O) = 1.33, RS(O/S) = 1.33, RS(S/T) = 1.33
13RFRF(M) = 0.39 ± 0.02, RF(IMP) = 0.42 ± 0.02, RF(O) = 0.50 ± 0.03, RF(S) = 0.61 ± 0.02, RF(T) = 0.67 ± 0.02;
RSRS(M/IMP) = 0.53, RS(IMP/O) = 1.18, RS(O/S) = 1.58, RS(S/T) = 1.13
14RFRF(M) = 0.28 ± 0.02, RF(S) = 0.35 ± 0.02, RF(T) = 0.41 ± 0.03, RF(O) = 0.47 ± 0.03, RF(IMP) = 0.56 ± 0.03;
RSRS(M/S) = 0.88, RS(S/T) = 1.07, RS(T/O) = 1.07, RS(O/IMP) = 1.33
16RFRF(M) = 0.35 ± 0.02, RF(S) = 0.41 ± 0.02, RF(T) = 0.51 ± 0.02, RF(O) = 0.54 ± 0.02, RF(IMP) = 0.63 ± 0.03
RSRS(M/S) = 1.05, RS(S/T) = 1.44, RS(T/O) = 0.30, RS(O/IMP) = 1.20
19RFRF(IMP) = 0.30 ± 0.02, RF(M) = 0.38 ± 0.03, RF(S) = 0.44 ± 0.03, RF(O) = 0.51 ± 0.03, RF(T) = 0.70 ± 0.04
RSRS(IMP/M) = 1.33, RS(M/S) = 1.22, RS(S/O) = 1.29, RS(O/T) = 2.10
a 2—Ace + TCM + EA (4:4:1, v/v); 8—TCM + MeOH + AM (9:1:0.06, v/v); 9—TCM + MeOH + AM (9:1:0.1, v/v); 12—TCM + MeOH + GAcOH (9:1:0.1, v/v); 13—TCM + MeOH + GAcOH (9:1:0.05, v/v); 14—Ace + TCM + EA + GAcOH (4:4:1:0.05, v/v); 16—Ace + TCM + EA + ACN (3:4:1:1, v/v); 19—TCM + MeOH + DEA (9:1:1, v/v).
Table 2. Method validation data for the quantitative determination of M and T using the TLC-densitometric method.
Method Characteristic5-Nitroimidazole
MetronidazoleTinidazole
Retardation factor (Rf)0.38 ± 0.030.70 ± 0.04
Range ([μg/spot)]0.2–2.00.2–2.0
Linearity ([μg/spot)]
A = a·X + b
a7340.4 (±133.1)7828.0 (±114.2)
b3071.5 (±140.2)5567.9 (±130.1)
n1010
r0.99890.9992
s235.6218.6
F35574701
p<0.0001<0.0001
LOD ([µg/spot)]
SD
0.012
0.001
0.022
0.001
LOQ ([µg/spot)]
SD
0.036
0.003
0.066
0.003
For tablets
Accuracy (n = 6)
for 50% standard addedR = 103.8%; CV = 1.96%R = 101.8%; CV = 0.95%
for 100% standard added R = 104.3%; CV = 1.13%R = 99.1%; CV = 2.31%
for 150% standard addedR = 101.2%; CV = 2.48%R = 100.9%; CV = 2.49%
Average recovery103.1%100.6%
Precision (CV, ([%]))
Intraday (n = 3)
for 1.75 µg/spot 1.080.76
for 1.00 µg/spot 1.120.89
for 0.30 µg/spot 0.991.28
Interday (n = 3)
for 1.75 µg/spot 1.330.99
for 1.00 µg/spot 1.391.44
for 0.30 µg/spot 1.481.76
Robustness (CV, ([%]))robustrobust
A—area of the chromatographic band (spot) M, T ([AU]); n—number of measurement points; X—micrograms M/spot or T/spot; r—correlation coefficient; SD—standard deviation.
Table 3. Comparison of LOD and LOQ of M and T obtained by other authors.
MethodMobile PhaseLOD and LOQ
([µg/spot)]
Ref.
Metronidazole
HPTLCMeOH + TCM (9:1, v/v)LOD = 0.61
LOQ = 0.95
[18]
HPTLCTLN + EA + MeOH + AM (3:1.5:0.5:0.1, v/v)LOD = 0.046
LOQ = 0.116
[19]
HPTLCBz + EA + TLN + MeOH + GAcOH (9.5:2:5:1.5:0.5, v/v)LOD = 0.88
LOQ = 1.93
[21]
TLCACN + AM + MeOH + MCL+ Hx (1.3:1.1:2:3:1, v/v)LOD = 0.32
LOQ = 0.96
[22]
TLCEA + Ace + Hx + AM (9.5:0.5:0.3:0.3, v/v)LOD = 0.13
LOQ = 0.38
[23]
TLCTCM + Ace + GAcOH (7.5:2.5:0.1, v/v)LOD = 0.51
LOQ = 1.55
[16]
TLCTCM + MeOH (9:1, v/v)LOD = 0.052
LOQ = 0.159
[36]
Tinidazole
HPTLCTLN + EA + MeOH + -TEA (5.5:1.0:1.0:0.1, v/v)LOD = 0.011
LOQ = 0.037
[25]
HPTLCAce + EtOH + 2% watery sodium dodecyl sulfate (WSDS) (3:4:2, v/v)LOD = 0.0067
LOQ = 0.0203
[33]
HPTLC30% Trifluoroacetic acid (TFAA)LOD a = 0.01
LOQ a = 0.03
LOD b = 0.12
LOQ b = 0.36
[32]
TLCIP + butanol (BT) + AM + water (W) (25:50:5:25, v/v)LOD = 0.1
LOQ = 0.3
[30]
TLCMCL + IP + ACN + AM (11:1.2:5:0.2, v/v)LOD = 0.2
LOQ = 0.6
[27]
TLCTCM + MeOH (9:1, v/v)LOD = 0.058
LOQ = 0.174
[36]
a low concentration calibration; b high concentration calibration.
Table 4. Experimental design matrix (23) for robustness test for M and T ingredients in tablets a.
Experiment NoX1X2X3X4X5X6X7Content of Active Pharmaceutical Ingredient (yi)
([mg·tablet−1])
MT
1+++++++493.8494.2
2+++489.9502.5
3+++496.9495.2
4+++500.2506.1
5+++502.8499.5
6+++493.1490.2
7+++493.2493.5
8+++513.8508.2
Size of effectM−5.525−6.125−2.575−0.5759.3752.875−5.775
T1.650−4.150−6.1501.8506.650−3.450−5.350
The label claim ([mg)] 500500
Average amount ([mg]) 498.0498.7
Variance 58.441.7
Standard deviation (SD) 7.646.46
Coefficient of variation (CV, %) 1.51.3
a M—metronidazole; T—tinidazole; “+”—high level of change in analysis parameter; “−“ low level of change in analysis parameter.
Table 5. Comparison of M and T assays ([mg/tablet]) obtained from ten different repeated analyses using the proposed TLC-densitometric (A) and pharmacopeial (B) methods.
MetronidazoleTinidazole
Method
ABAB
Number of analyses10101010
1510.3528.6489.9492.5
2523.0506.4495.2488.9
3520.0521.5492.3512.6
4495.6516.2487.6501.8
5503.6508.3502.6481.7
6488.4498.2509.9479.6
7520.1501.3487.1509.9
8515.3496.3512.3508.1
9491.7517.8507.8505.5
10496.7497.5508.8491.8
Average506.5509.2499.4497.2
Label claimed500500500500
Amount of metronidazole and tinidazole (%) in relation to the label claim101.3101.899.899.4
Standard deviation (SD)12.911.310.011.9
Coefficient of variation (CV, %)2.552.222.002.39
Confidence interval of
arithmetic mean with
confidence level equal to 95%
µ = 506.5 ± 9.2µ = 509.2 ± 8.1µ = 499.4 ± 7.2µ = 497.2 ± 8.5
t calculated0.4970.447
t(95%·18) tabulated2.1012.101
F calculated1.301.42
F(95%·f1 = f2 = 9) tabulated3.183.18
Method A—proposed in this work: TLC-densitometric method; Method B—pharmacopeial method.
Disclaimer/Publisher’s Note: The statements, opinions and data contained in all publications are solely those of the individual author(s) and contributor(s) and not of MDPI and/or the editor(s). MDPI and/or the editor(s) disclaim responsibility for any injury to people or property resulting from any ideas, methods, instructions or products referred to in the content.

