Abstract
The effect of the pore–fracture structure on the porosity and permeability affects the production process of tight sandstone gas. In this paper, 12 groups of tight sandstone samples are selected as the object, and the pore–fracture volume of a tight reservoir is quantitatively characterized by a high-pressure mercury injection test. The multifractal and single fractal characteristics of different types of samples are calculated by fractal theory. On this basis, the pore volume variation under stress is discussed through the overlying pressure pore permeability test, and the pore–fracture compressibility is calculated. Finally, the main factors affecting the stress sensitivity of tight sandstone are summarized from the two aspects of the pore structure and mineral composition. The results are as follows. (1) The samples could be divided into types A and B by using the mercury-in and mercury-out curves. There is a significant hysteresis loop in the mercury inlet and outlet curves of type A, and the efficiency of the mercury inlet and outlet in the pores is relatively higher. The mercury removal curve of type B is almost parallel, and its mercury removal efficiency is relatively lower. (2) The applicability of singlet fractals in characterizing the heterogeneity of micropores is higher than that of multifractals. This is because the single fractal characteristics of the two types of samples have significant differences, while the differences in the multifractals are relatively weak. (3) A pore diameter of 100–1000 nm provides the main compression space for the type A samples. A pore distribution heterogeneity of 100–1000 nm affects the compression effect and stress sensitivity of this type B sample.
1. Introduction
The efficient development of unconventional oil and gas resources is a guarantee for ensuring sustainable economic and social development in the future [1,2,3,4,5]. Sustained successes in the exploration and development of coalbed methane, shale gas, tight sandstone gas, and other unconventional energy accumulation areas are represented by the Ordos Basin, which has become one of the main driving forces for sustained breakthroughs in the development of unconventional energy in China [1,2,3,4,5]. Due to its low porosity and permeability but simple production process, tight sandstone gas has made breakthroughs in exploration and development. Among them, production practice has shown that the pore structure has become a main factor restricting the improvement of the sandstone gas production capacity by affecting the diffusion and migration of gas in pores and fractures. It is constrained by the low porosity and low permeability characteristics of sandstone storage. The transformation of sandstone reservoirs to improve their porosity and permeability has become a difficult point in the exploration and development of tight sandstone gas. It should be noted that clarifying the storage, pore and fracture structure, development characteristics, and dynamic changes in pore permeability under the constraints of tight sandstone under primitive conditions is a foundation for solving this problem.
The pore structure of tight sandstone storage has been characterized in a series of relevant studies. The HPMI experiment is one of the most commonly used methods to characterize the pore and fracture structure of unconventional sandstone due to its advantages of speed, simplicity, and convenience [6,7,8,9,10]. Jiang et al. [11] mainly studied the tight sandstone reservoirs of the Benxi Formation in the Ordos Basin, and the distribution characteristics of sandstone pore throats were studied using high-pressure mercury injection tests [11]. The results showed that the lower limit of the pore throat radius in the tight sandstone reservoirs in this area was 0.24 microns, and the average porosity was 4%~8%, which preliminarily proved that this area has a good tight sandstone reservoir. On this basis, the tight sandstone types of the Benxi Formation in the Ordos Basin were classified by Hu et al. [12] into the small pore development type and large pore development type. The small pore development type is considered to be the focus of the subsequent storage and transformation. A new parameter for characterizing the storage pore fracture structure of tight sandstone was proposed using high-pressure mercury intrusion testing, and it is believed that the productivity changes during the development process of tight sandstone can be better characterized by this parameter [13]. At the same time, based on the detailed characterization of the pore and fracture structure of tight sandstone, Meng et al. [14] used the overlying pressure pore permeability test to explore the characteristics of tight sandstone under the constraint of the pore and fracture structure.
In summary, the pore and fracture structure of tight sandstone has been extensively studied by previous researchers, but there are still the following issues. The first aspect is that although relevant research has been conducted on the pore structure of tight sandstone reservoirs in the Benxi Formation of the Ordos Basin, there is still a need for further quantitative characterization of the non-uniform distribution of the pore structure in tight sandstone. Secondly, the controlling factors for the dynamic changes in pore permeability in tight sandstone are mostly considered from the aspects of the pore structure, pore volume, clay and mineral composition. The impact of the heterogeneity of the pore and fracture structure on the pore permeability dynamics has not been deeply considered.
Therefore, this study focused on the tight sandstone gas reservoirs within the Benxi Formation of the Ordos Basin. Mineral analysis and HPMI testing were comprehensively applied, and the target sandstone storage pore volume was quantitatively characterized. Based on this, different fractal models were introduced, and the sandstone pore and fracture structures were quantitatively characterized. Overlying pressure pore permeability testing was applied, and the pore dynamics of the target sample tight sandstone reservoir were quantitatively characterized. Finally, pore compressibility was introduced to explore the main controlling factors affecting the stress sensitivity of tight sandstone (from both the pore structure and fractal dimension values). This achievement can provide a theoretical reference for the exploration and development of tight sandstone gas in research areas.
2. Geological Setting and Experimental Methods
2.1. Geological Settings
The Ordos Basin is located in the western part of the North China Plate and is a typical cratonic margin superimposed basin. It is the second largest sedimentary basin in inland China, with a total basin area of approximately 37 × 104 km2. The basin is composed of six primary tectonic units, namely the western margin thrust belt, Tianhuan Depression, Yishan Slope, Jinxi Fold Belt, Yimeng Uplift, and Weibei Uplift. The basin has undergone multiple tectonic movements, including Wutai, Lvliang, Caledonian, Haixi, Indochina, Yanshan, and Himalaya, and has developed marine carbonate platform sedimentation from the Middle Upper Proterozoic to the Lower Paleozoic, coal-bearing clastic rock sedimentation from the Upper Paleozoic marine continental interaction, inland river delta lake basin sedimentation from the Mesozoic, and aeolian loess and fluvial sedimentation from the Cenozoic. Twelve tight sandstone samples were selected for analysis in this study, and the detailed information is shown in Table 1.

Table 1.
Samples’ basic parameters, including the pore structure and mineral composition.
2.2. Experimental Methods
The collected samples were wrapped in plastic wrap and quickly transported to the laboratory for pre-testing according to the GB/T19222-2003 standard [15]. The macroscopic coal rock types of the coal samples were analyzed according to the Chinese national standard GB/T18023-2000 standard [16]. According to the GB/T 6948-2008 standard [17], 3 × 3 cm2 polished thin films were prepared for the microstructure analysis. All the samples were subjected to industrial analysis according to the GB/T 212-2008 standard [18].
Overpressure permeability test. Fresh samples were prepared into cylindrical samples (25 × 50 mm). The AP-608 pressure pore permeameter produced by Temco Corporation (located in Hamelburg, Germany) in the United States was used to test the pressure-sensitive characteristics of the sample in order to obtain its permeability changes under different stress conditions. The experiment adopted the non-steady-state pressure drop method and used high-purity helium gas as the testing medium. During the measurement process, a pressure pulse was generated by applying an initial pressure difference of 0.7 MPa at both ends of the core holder, and its attenuation process was recorded to calculate the corresponding permeability value under confining pressure conditions.
During the experiment, the gas pressure was kept constant at 1 MPa, and the effective stress was gradually increased by gradually increasing the confining pressure to 51 MPa (while keeping the gas pressure constant). To ensure the accuracy and stability of the test data and reduce errors caused by the operation time and changes in the pore volume, a testing time of 30 min was maintained for each confining pressure point, and an interval of no less than 30 s was set between different pressure stages.
High-pressure mercury intrusion test (MIP). Here, 3–4 g block samples were selected for testing. The sample was dried before the experimental testing. An AutoPore IV 9500 automatic mercury intrusion porosimeter(Beijing Biot Electronic Technology Co., Ltd., Beijing, China) was tested to inject and measure the mercury in the sample. During the measurement process, the mercury injection pressure range was 0–60,000 psi, and the equilibrium time at each pressure point was not less than 10 s. According to the research objectives of this paper, the experimental data of this test was mainly used to analyze the pore structure parameters of permeable pores (pore size greater than 100 nm). The theoretical equation is shown in Equation (1).
According to capillary pressure theory, the pore throat radius can be expressed as:
where Pc represents THE capillary pressure, MPa; σ is the surface tension J/m2 between two-phase fluids; AND θ is the contact angle, °. In the mercury injection experiment, σ and θ were equal to 0.48 J/m2 and 140°, respectively [19]. After substituting them into Equation (1), Equation (2) can be obtained.
where the corresponding pore radius can be calculated for a specific mercury injection pressure. Due to the significant compressibility of coal samples, the matrix pores are prone to compression or even fragmentation under high mercury pressure conditions, resulting in significant deviations in the pore structure parameters reflected at this stage [20]. Therefore, in order to reduce the interference of pore compression on THE test results, this paper selected data with a maximum mercury injection pressure of 14.7 MPa to characterize the pore structure characteristics of permeable pores (with larger pore sizes) [21,22].
At present, fractal theory models based on MIP data mainly include two categories, geometric fractal models and thermodynamic models. Among them, geometric fractal models are widely adopted due to their wide applicability, with the Menger model being the most representative [23,24,25,26]. This model suggests that the pore structure of coal reservoirs can be described by Menger fractal theory. According to the theoretical basis of this model, the functional relationship between dVr/dr and the pore radius r is as follows:
r is the minimum pore radius that mercury can enter under the mercury injection pressure P (MPa), in nm; and Dm is the volume fractal dimension of the permeable pores, dimensionless. The relationship between the mercury injection pressure and the pore radius can be described by Equation (4) [27].
Vp is the cumulative amount of mercury injected at a specific pressure P, mL·g−1. Dm = A + 4, where A is the slope of Equation (4). Dm is the fractal dimension value of the permeable pores.
The larger the Dm, the stronger the heterogeneity of the permeability pore distribution in the coal sample.
3. Results and Discussion
3.1. Pore Volume Distribution of Tight Sandstone Reservoirs Based on High-Pressure Mercury Injection
The fundamental parameters of the samples are presented as follows: the total pore volume of samples from 0.191 to 1.126 cm3/g (with an average of 0.739 cm3/g), porosity from 2.6% to 11.6% (with an average of 6.8667%), permeability from 0.001 to 1.805 mD (with an average of 1.1635 mD), and mercury recovery efficiency from 11.46% to 82.3529% (with an average of 36.20%). Additionally, the mineral composition of the samples is predominantly quartz (with the quartz content from 73% to 98%, and an average of 83.37%), while the clay mineral content ranges from 1% to 31% (with an average of 12.75%). This indicates that the higher quartz content is beneficial for providing adequate support during the later fracturing process to achieve long-term fracture propagation.
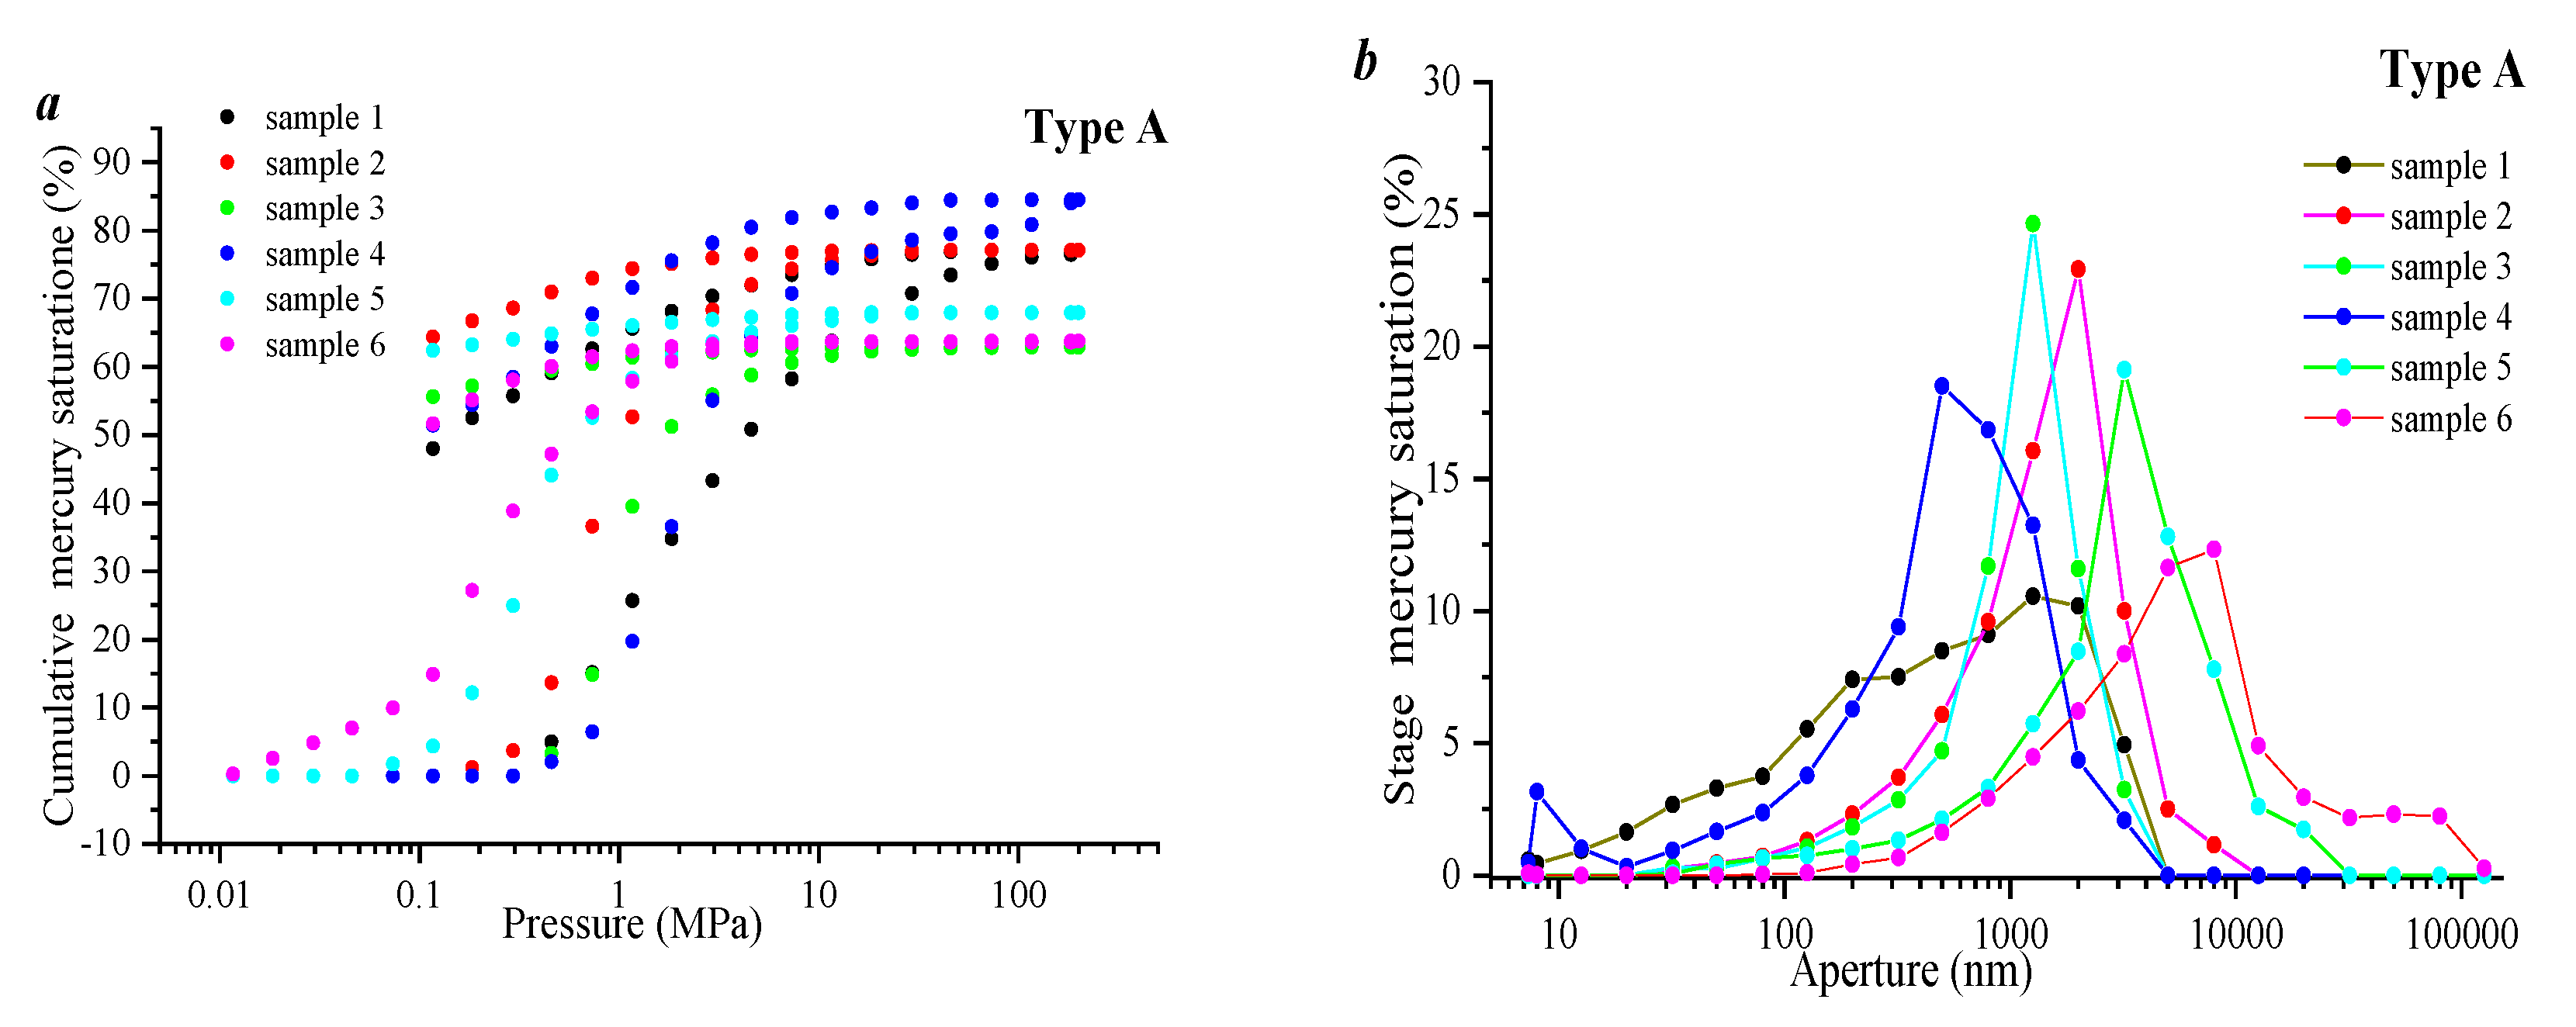
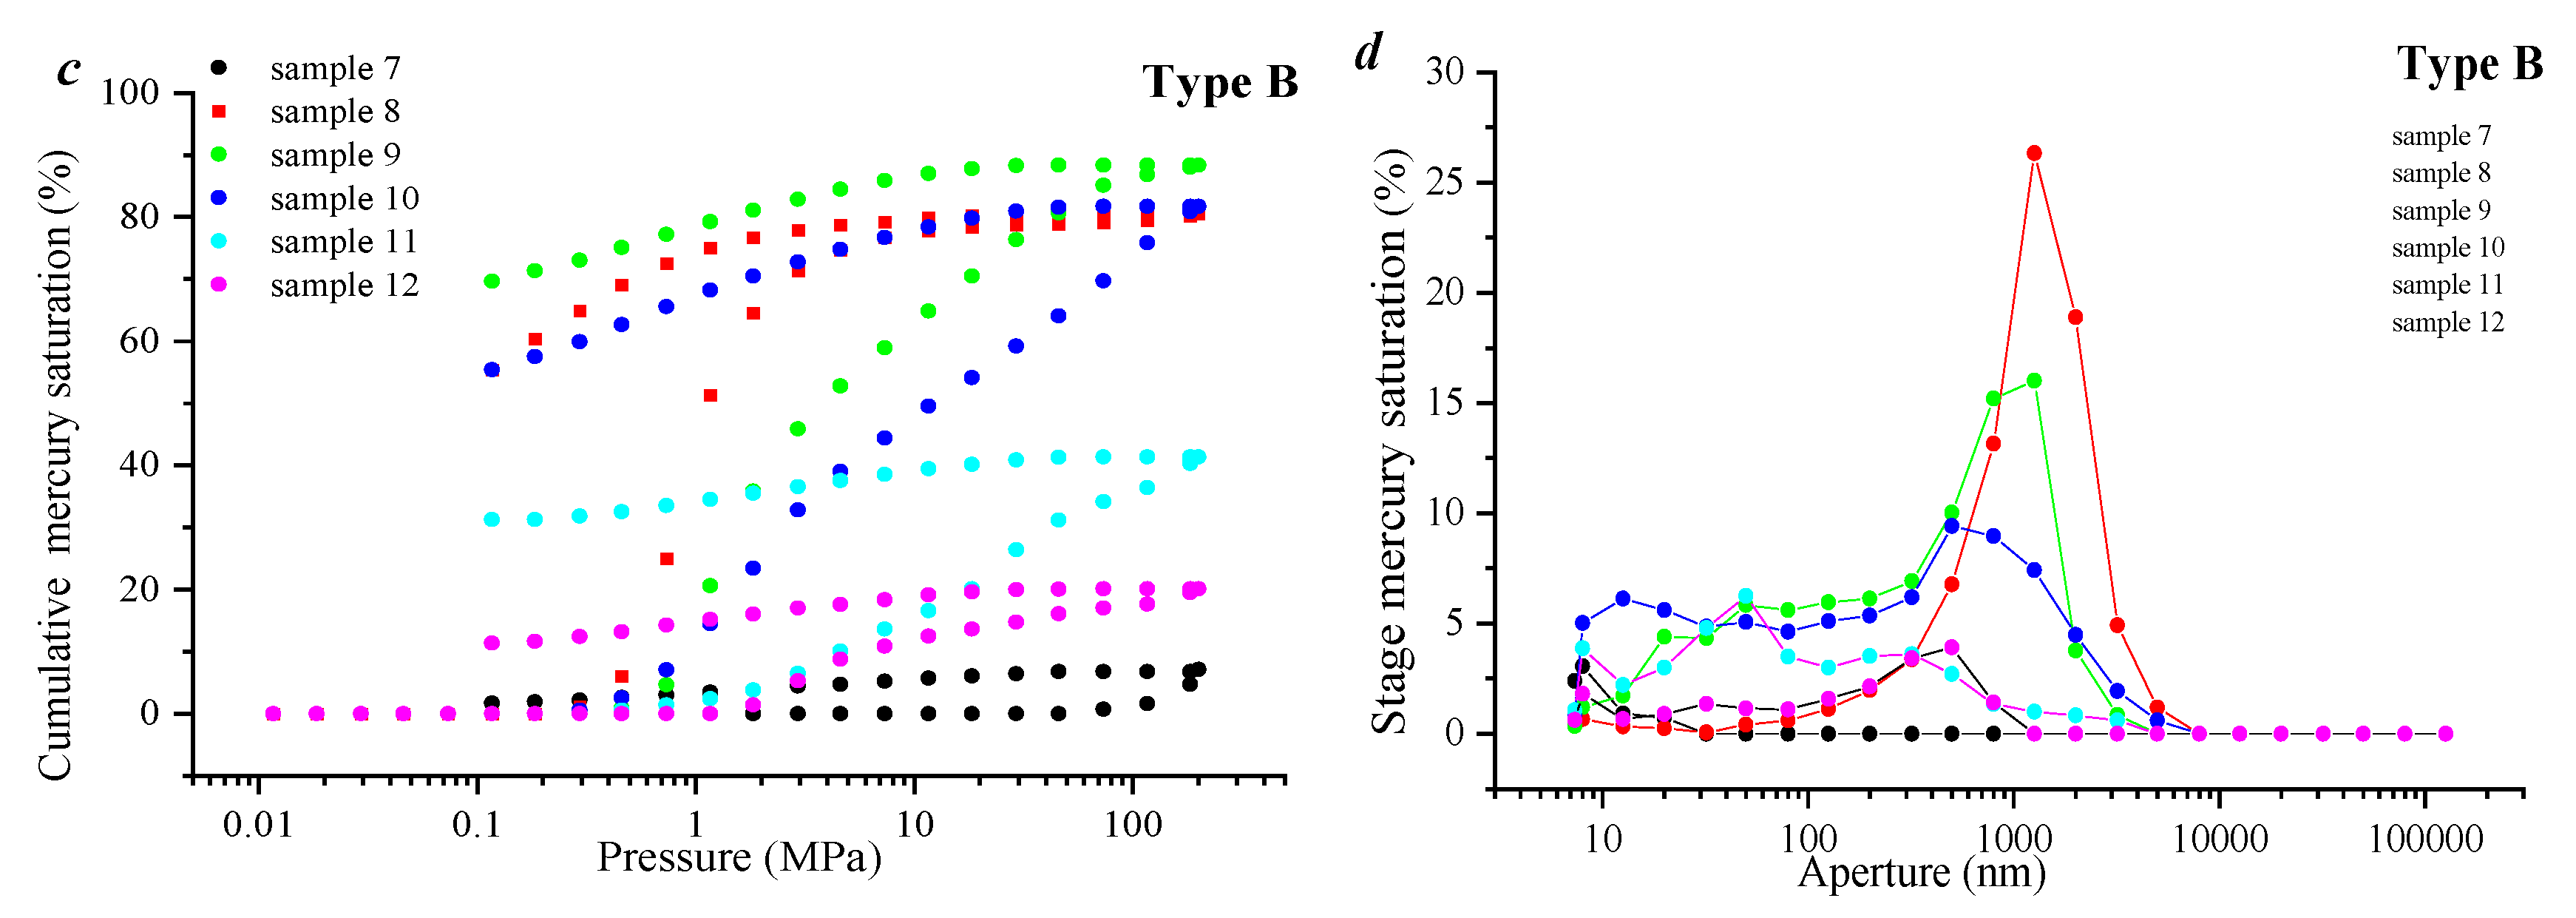
Figure 1 shows the mercury-in and mercury-out curves of a high-pressure high-mercury sample. The results indicate the samples can be divided into two categories, A and B, based on the mercury-in and mercury-out curves. Firstly, when the mercury injection pressure of the Class A samples is less than 1 MPa, the mercury injection volume rapidly increases. When the mercury injection pressure is greater than 1 MPa, the mercury injection curve becomes unbalanced. It can be concluded that the volume of mercury injected during this stage is small, and the sample is characterized by macropore development (100–1000 nm). Different from type A, type B has a significant hysteresis loop in the mercury injection and removal curve, resulting in relatively lower mercury removal efficiency. When the mercury injection pressure is less than 1 MPa, the mercury injection volume is small, and when the mercury injection pressure is greater than 1 MPa, the mercury injection volume increases. This indicates the sample is characterized by microporous development (Figure 1b). The pore sizes of the selected samples are all between 200 and 3000 nm, and the proportion of pore volume in the samples is 51.2% to 73.4% (average). However, the pore connectivity of type A is better, indicating that type A samples should be used as advantageous storage for the development of tight sandstone gas (Figure 1b,d).
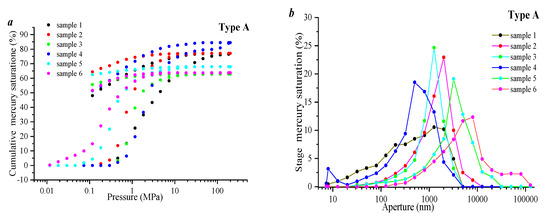
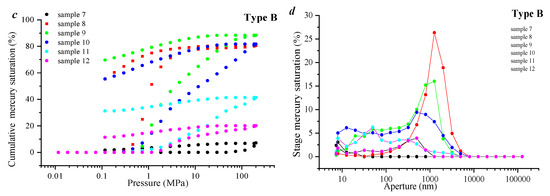
Figure 1.
Distribution curves of the high-pressure mercury intrusion and withdrawal for two types of samples and the distribution of the pore structures. (a) Cumulative mercury inflow and mercury withdrawal curves of a type A sample based on high-pressure mercury detection; (b) Pore result distribution curves for Type A samples; (c) Cumulative mercury inflow and mercury withdrawal curves of a type A sample based on high-pressure mercury detection; (d) Pore result distribution curves for Type A samples.
There are significant differences in the volume distribution of the pore structures between the different types (Figure 2). The pores of type A (<100 nm) are not well-developed, with a pore percentage of 0.91–17.29% and an average of 5.91%, which is much lower than the pore percentage of type B (<100 nm) (3.40–59.78%, with an average of 33.4%). But the pore volume percentage of type A (>100 nm) is much higher than that of type B (>100 nm). Therefore, the type A samples have more developed pores.
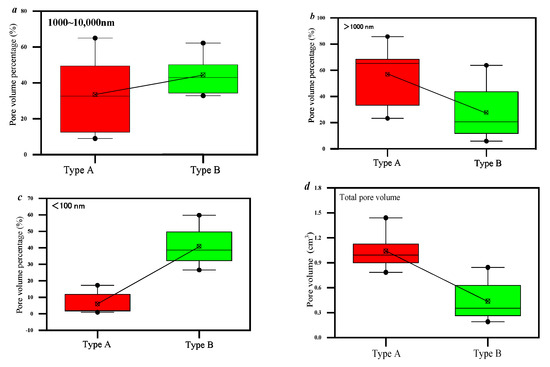
Figure 2.
Pore volume percentage of samples with different pore sizes. (a) Macropore pore volume percentage distribution characteristics of the two samples; (b) Percentage distribution of mesoporous pore volume of the two samples; (c) Percentage distribution of microporous pore volume of the two samples; (d) Percentage distribution of total pore volume between the two samples.
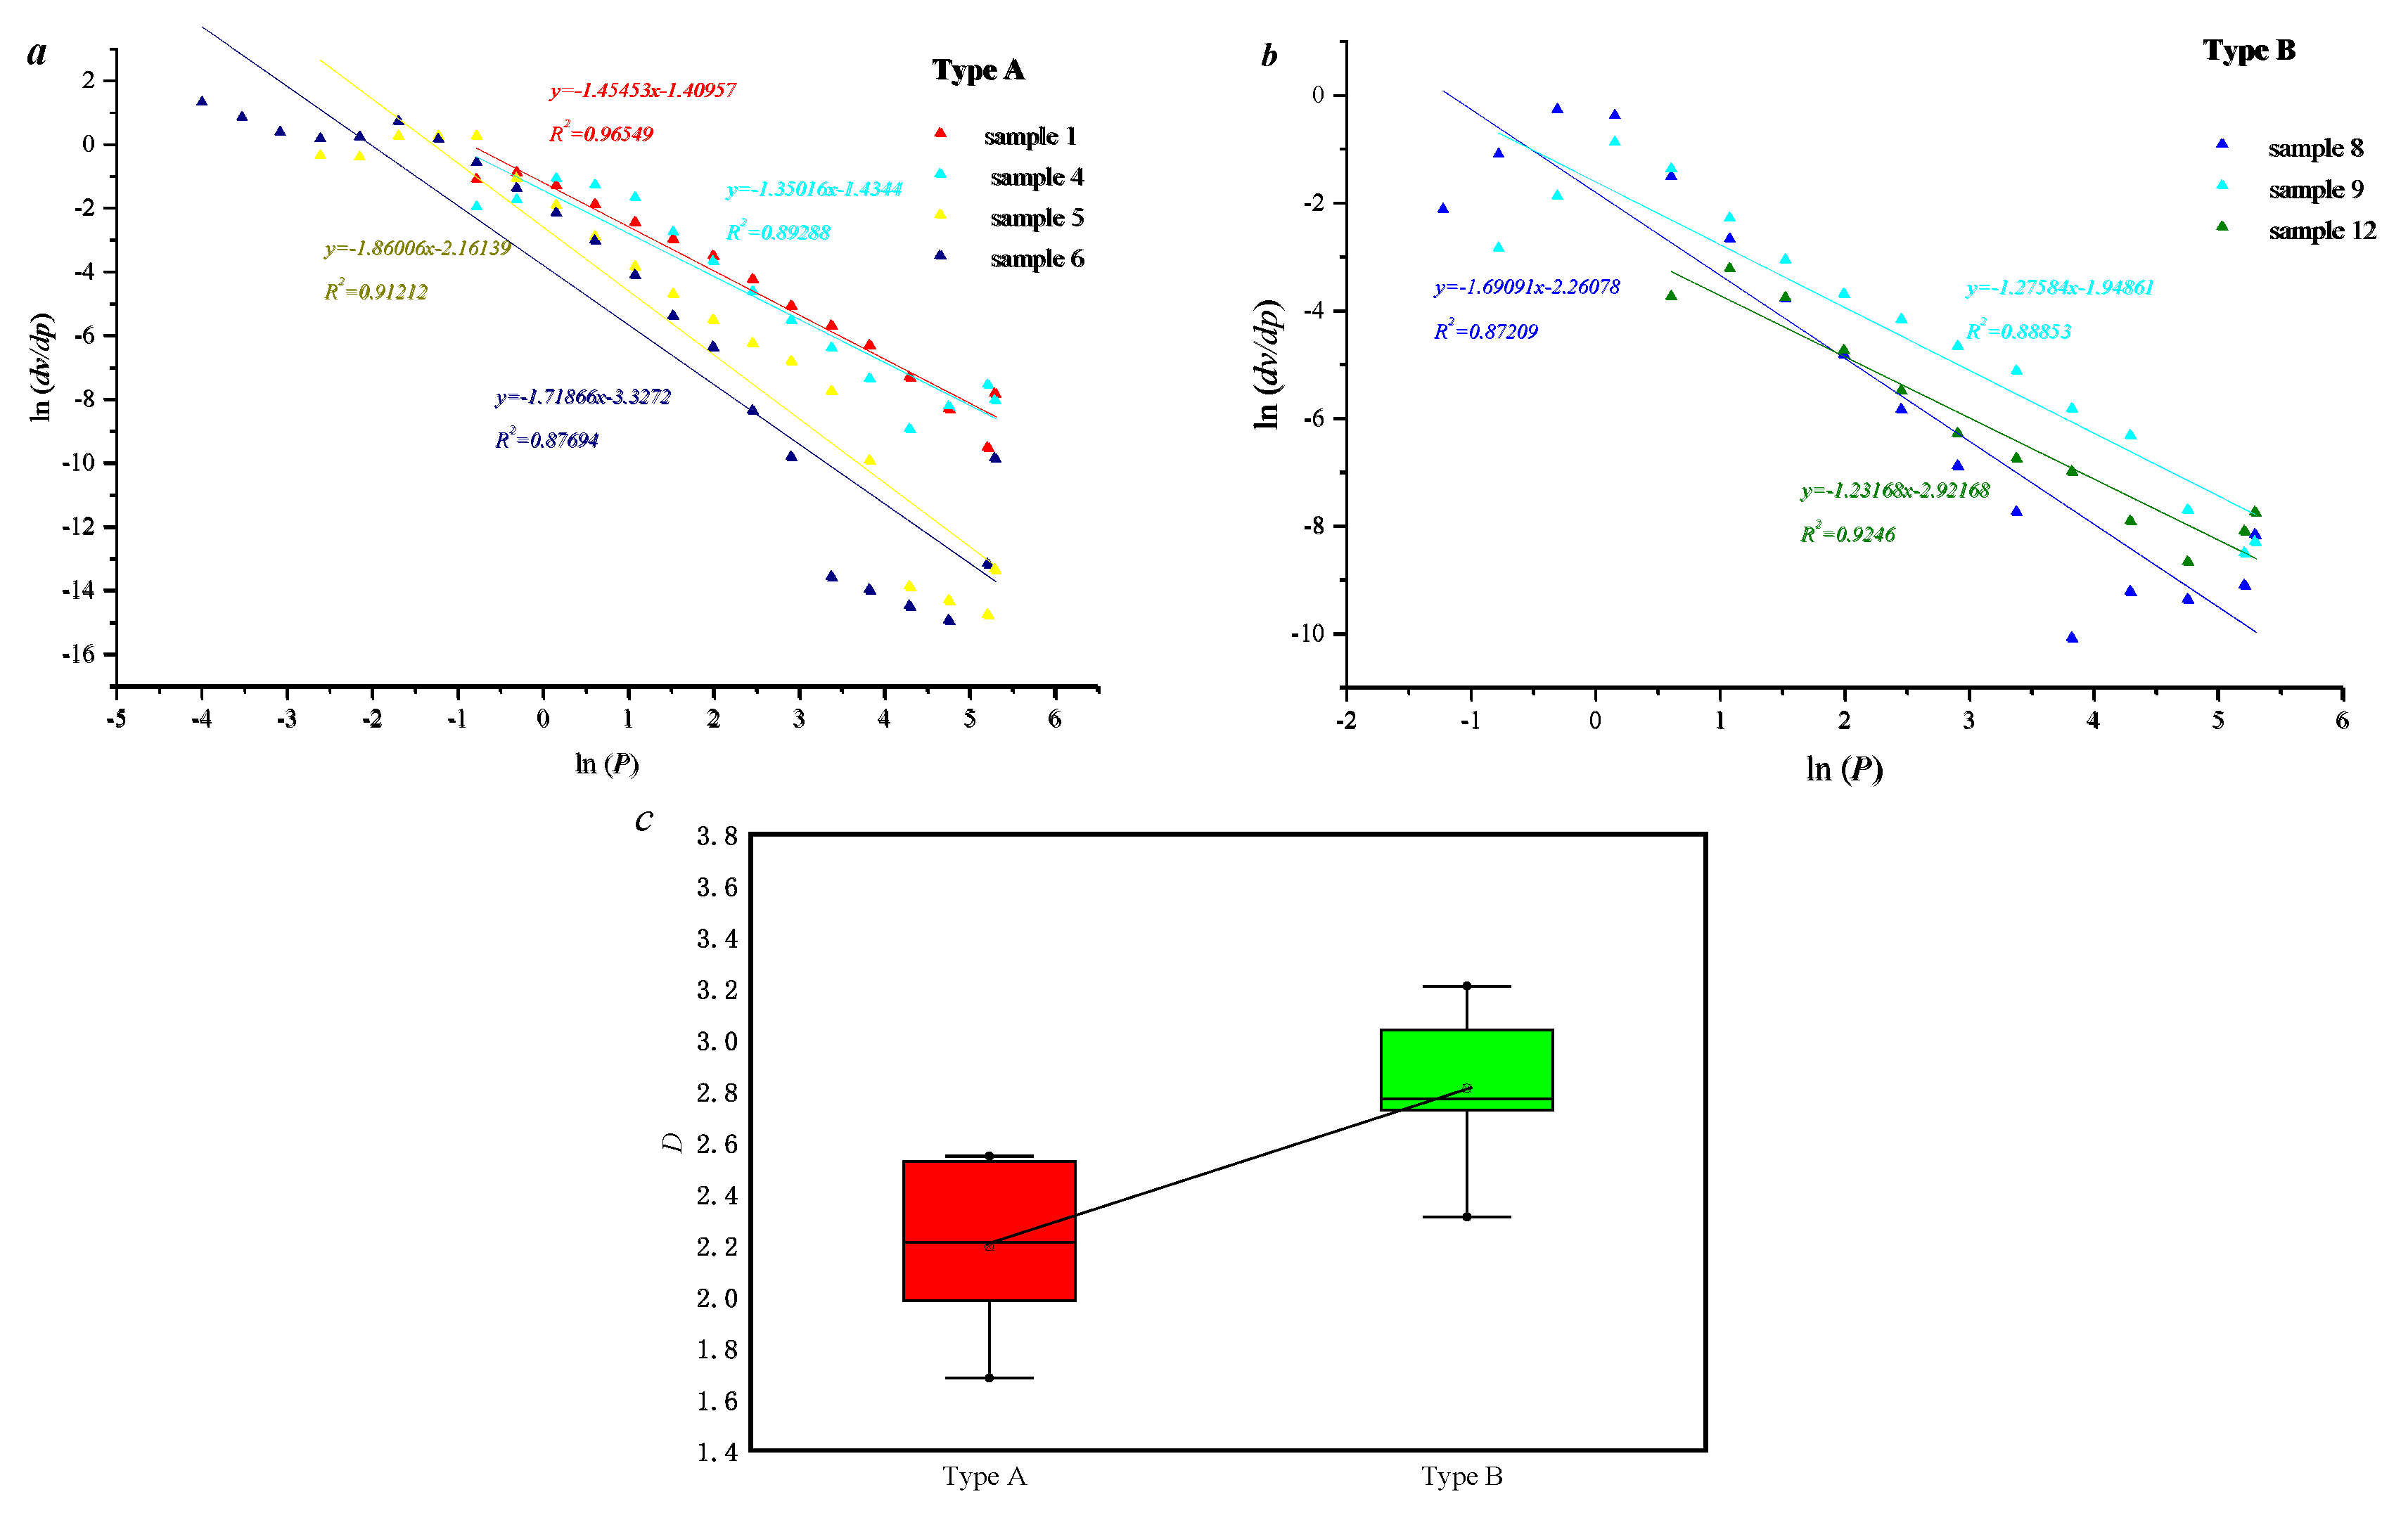
The typing features of the selected samples can be quantitatively described based on the sponge model (Figure 3). The curves of each sample in the figure are close to a straight line. This indicates that the sponge model can be used for the quantitative description of unconventional tight sandstone reservoirs. The fractal dimension of type A ranges from 1.68 to 2.54, with an average of 2.19, and the fractal dimension of type B ranges from 2.30 to 2.76, with an average of 2.60. This indicates the heterogeneity of the pore distribution in the type B samples is higher than that in type A. This is due to the relative development of pores smaller than 100 nm in the type B samples, resulting in significant differences in the pore volume distribution between the 0 and 10,000 nm samples.
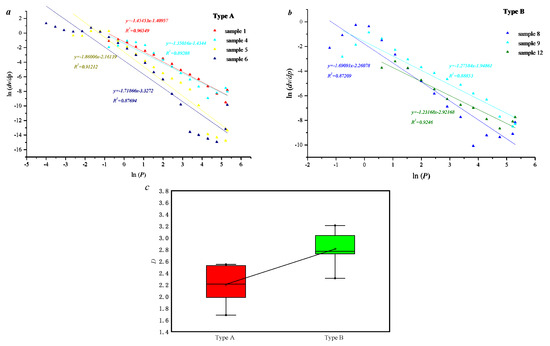
Figure 3.
Fractal dimension curve of the sponge model (a) Fractal dimension curve of the sponge model of type A sample; (b) Fractal dimension curve of the sponge model of the type B sample; (c) Fractal dimension distribution characteristics of the sponge model of the two types of samples.
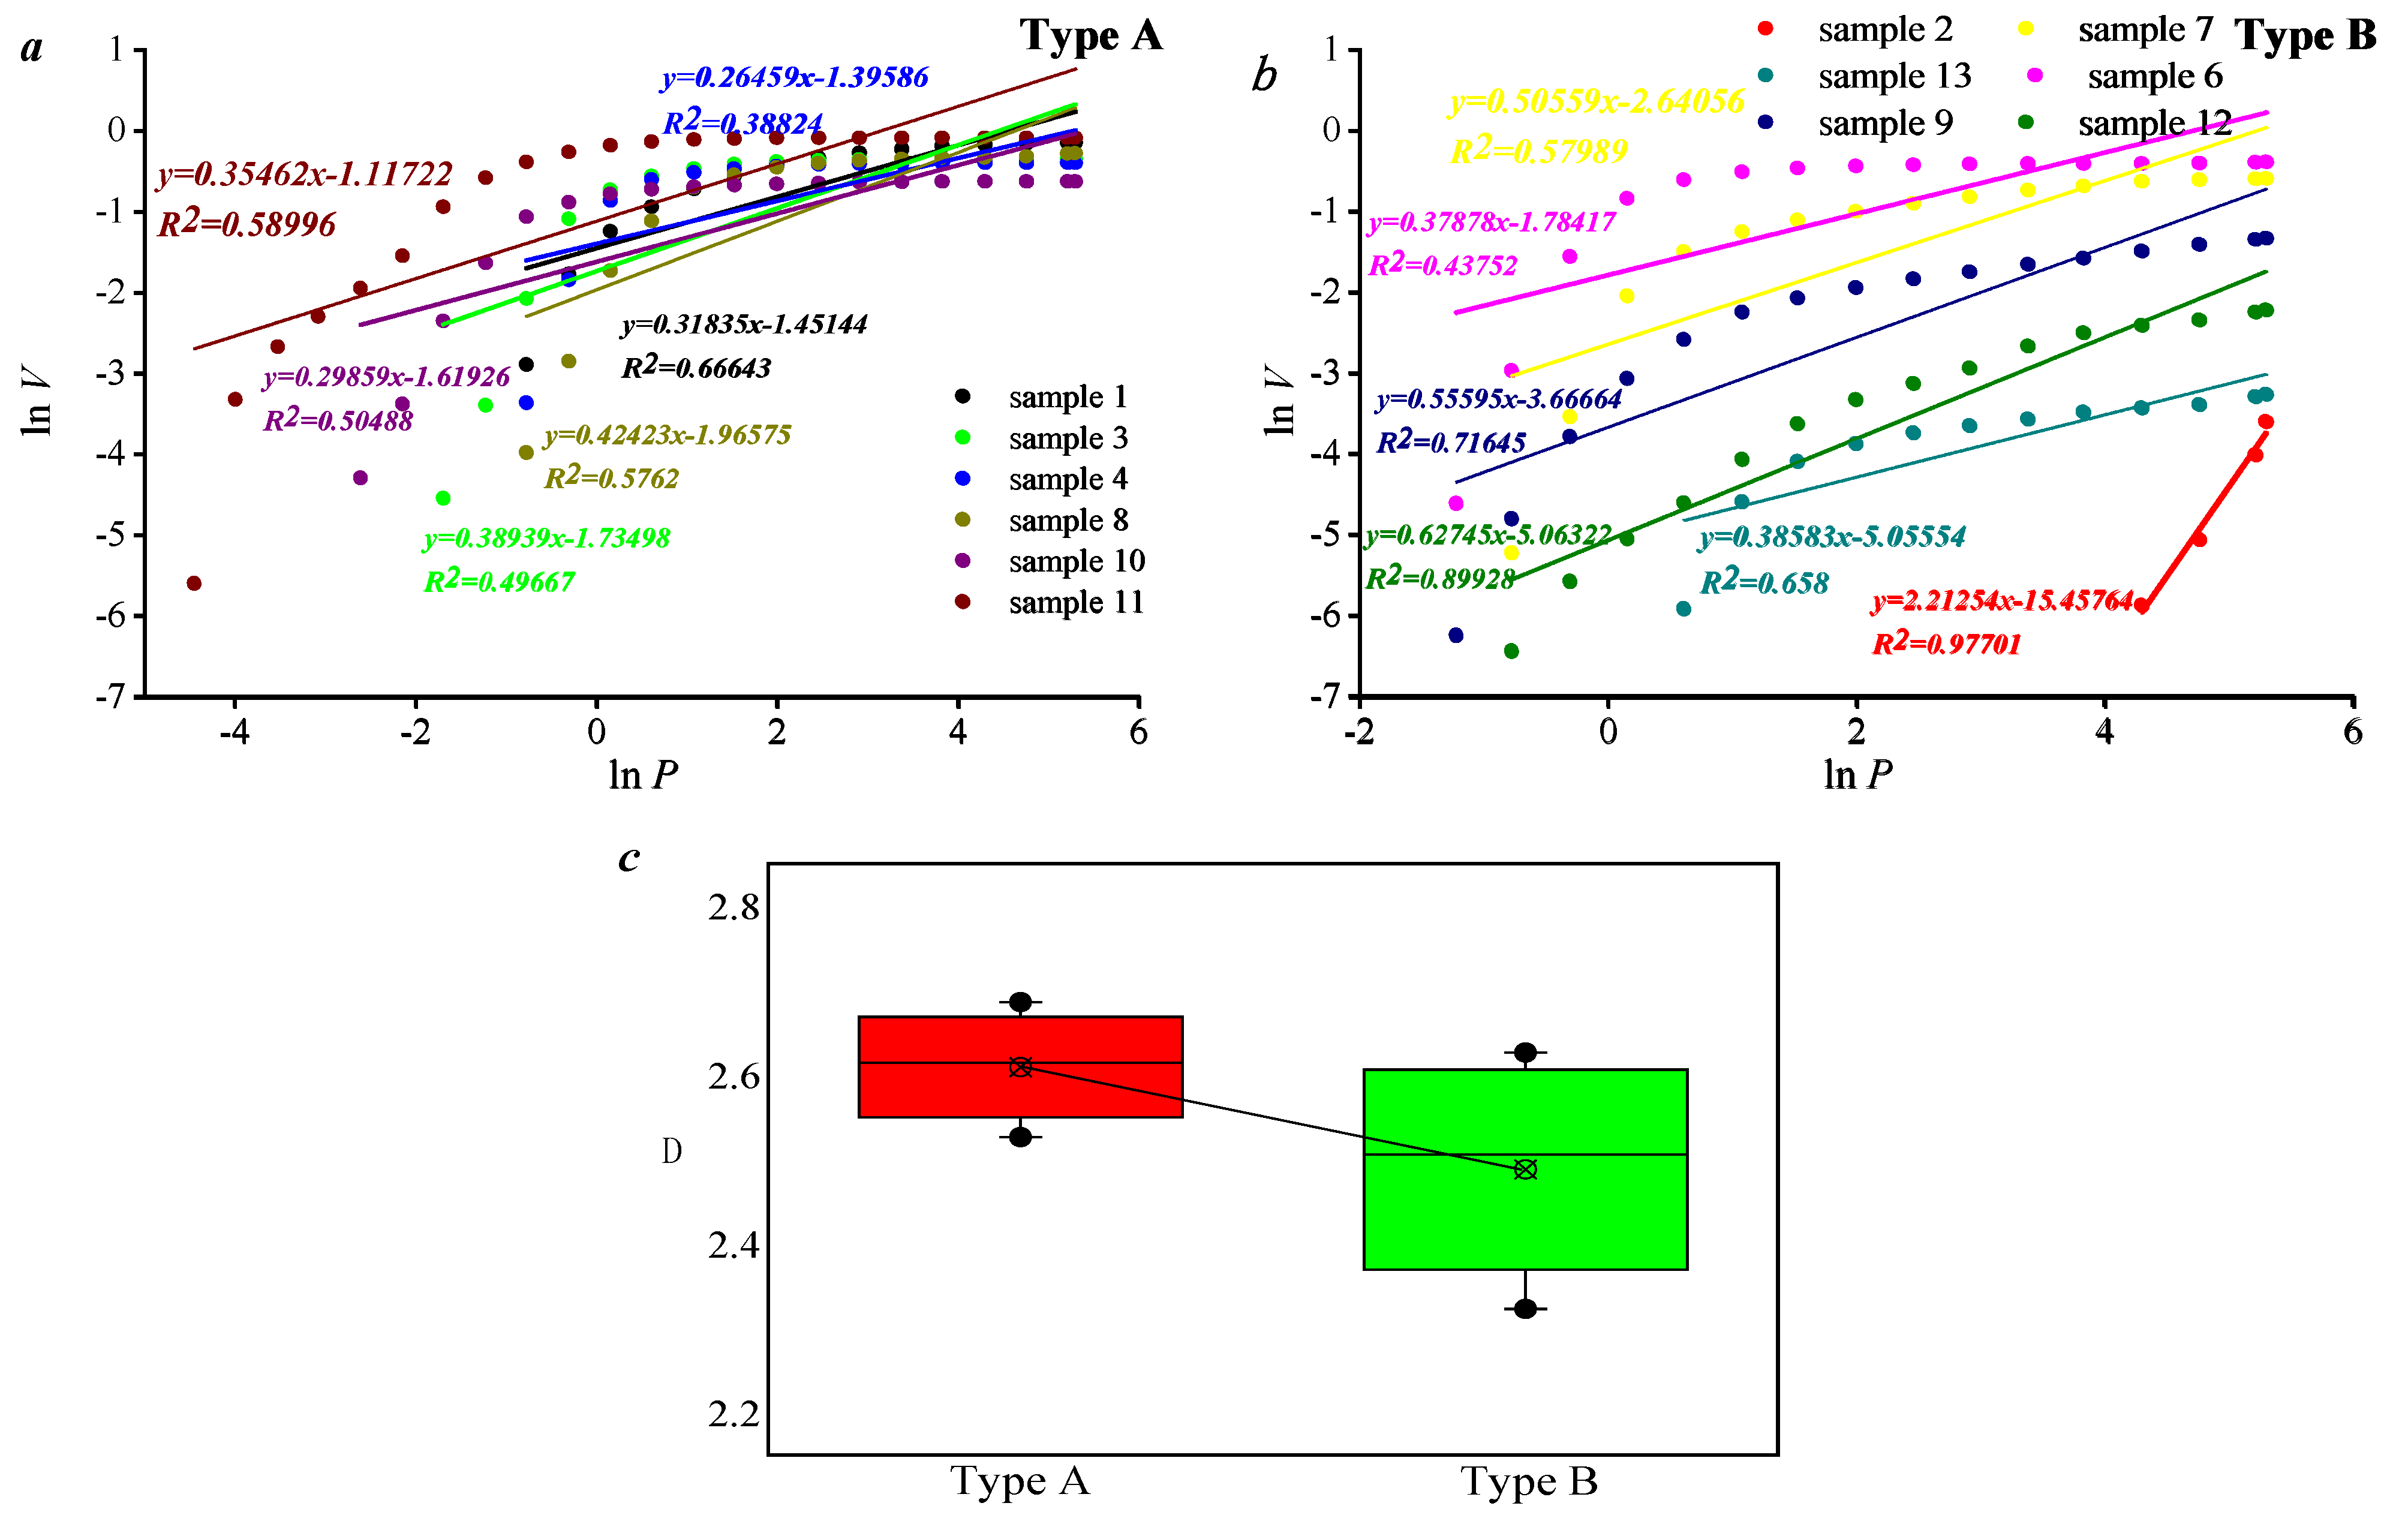
Figure 4 shows various partitioning models based on the S model, and the model results can be divided into two categories with a log(P) of −0.5 as the boundary. This indicates that the S model has certain limitations in representing the microstructure of non-sandstone and non-tight sandstone reservoirs. For the convenience of analysis, linear fitting was performed on each sample curve of the S model. Compared with the other analysis model curves, the fractal dimension of the type A samples is much larger than that of type B, which is opposite to the results in Figure 3 above. This indicates that there are differences in the applicability of these two different models.
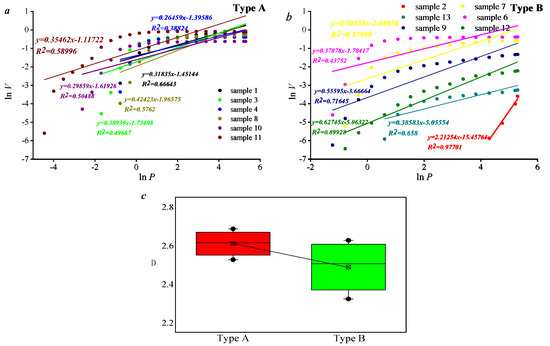
Figure 4.
The single fractal dimension based on the S model (a) Fractal dimension curve of the S model of type A sample; (b) Fractal dimension curve of the S model of the type B sample; (c) Fractal dimension distribution characteristics of the S model of the two types of samples.
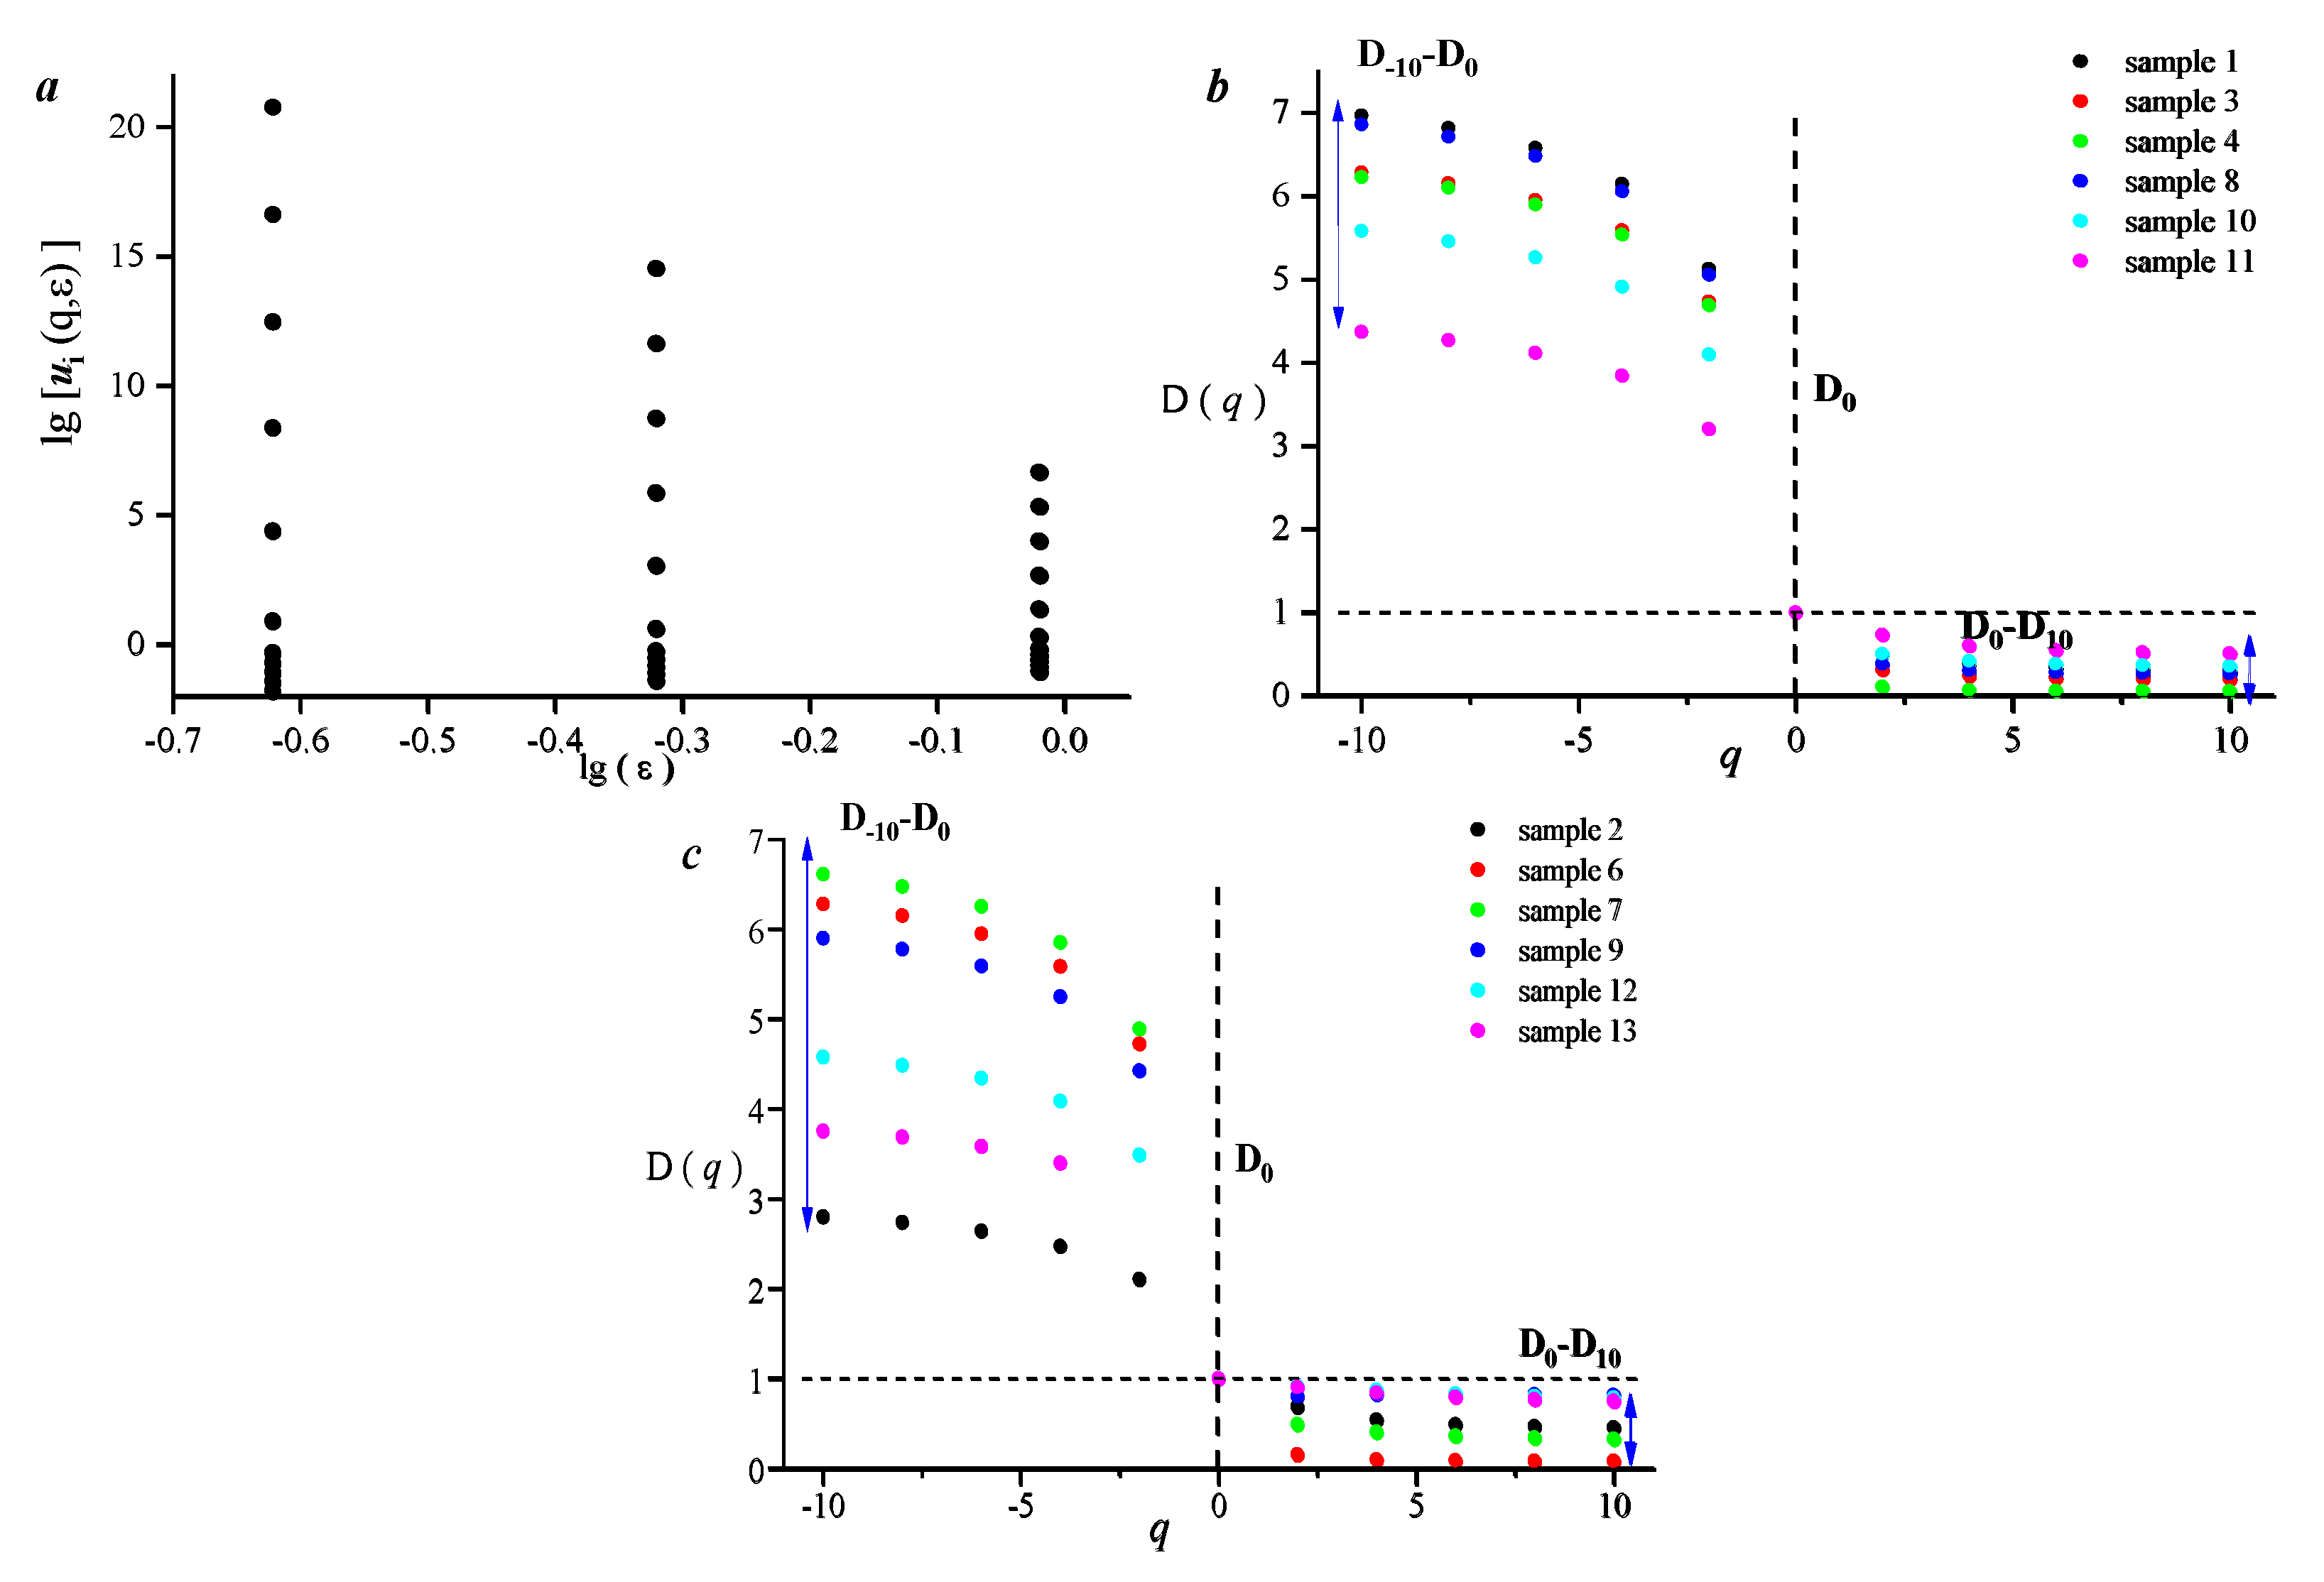
Based on multifractal theory, the multifractal characteristics of all the samples were described. There is a clear linear relationship between lg (e) and lg (ui (q,ε)) in Figure 5a, indicating that the high-pressure mercury injection curve of the sample has good multifractal characteristics. The multifractal curve of type A shows a clear inverse S-shape, with D−10–D0 ranging from 3.36 to 5.97, with an average of 5.05, and D0-D10 ranging from 0.49 to 0.94, with an average of 0.72; D−10–D10 ranges from 3.86 to 6.68, with an average of 5.77 (Figure 5b). The multifractal curve of type B also shows a clear inverse S-shape, but the dispersion of D−10–D0 and D0–D10 is large, that is, the D−10–D10 of this type of sample is 3.00–6.28, with an average value of 4.87; D0–D10 ranges from 0.18 to 0.92, with an average of 0.45 (Figure 5c).
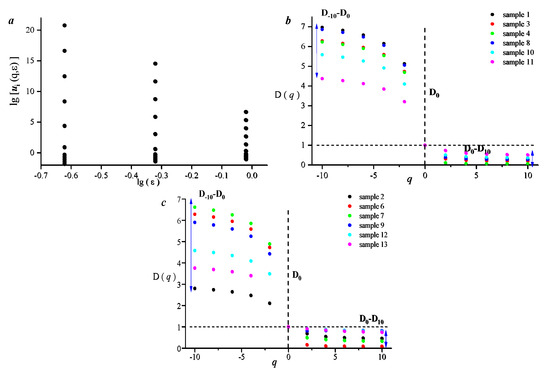
Figure 5.
Characteristics of the sample pore distribution based on the multifractal model (a) Sample pore distribution characteristics of all sample multifractal models; (b) Pore distribution characteristics of the sample from the Type A multifractal model; (c) Sample pore distribution characteristics of the Type B multifractal model.
Overall, the comparison shows that the difference in the multifractal characteristics between the two types of samples is not significant, being lower than the difference in the multifractal values between samples of the same type. This indicates that there are significant differences in the physical significance of the single fractal dimension values and multifractal dimension values in characterizing the non-uniformity of the pore distribution (Figure 6).
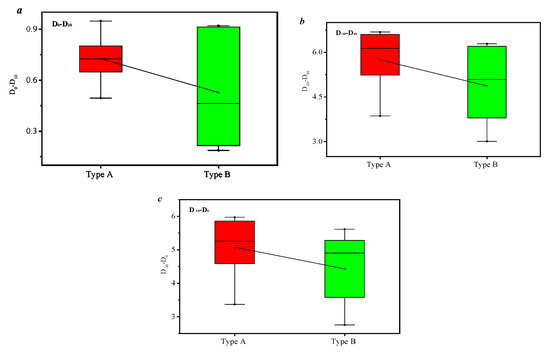
Figure 6.
Multifractal dimension characteristics of the pore distribution of the type A and B samples ((a), D0-D10 for the low-value areas of the multifractal dimension of the sample; (b), D−10-D0 for the high-value region of the multifractal dimension of the sample; and (c), D−10–D10 for multifractal dimension distribution of the samples).
3.2. Applicability of Different Fractal Models in Characterizing Pore–Fracture Structures
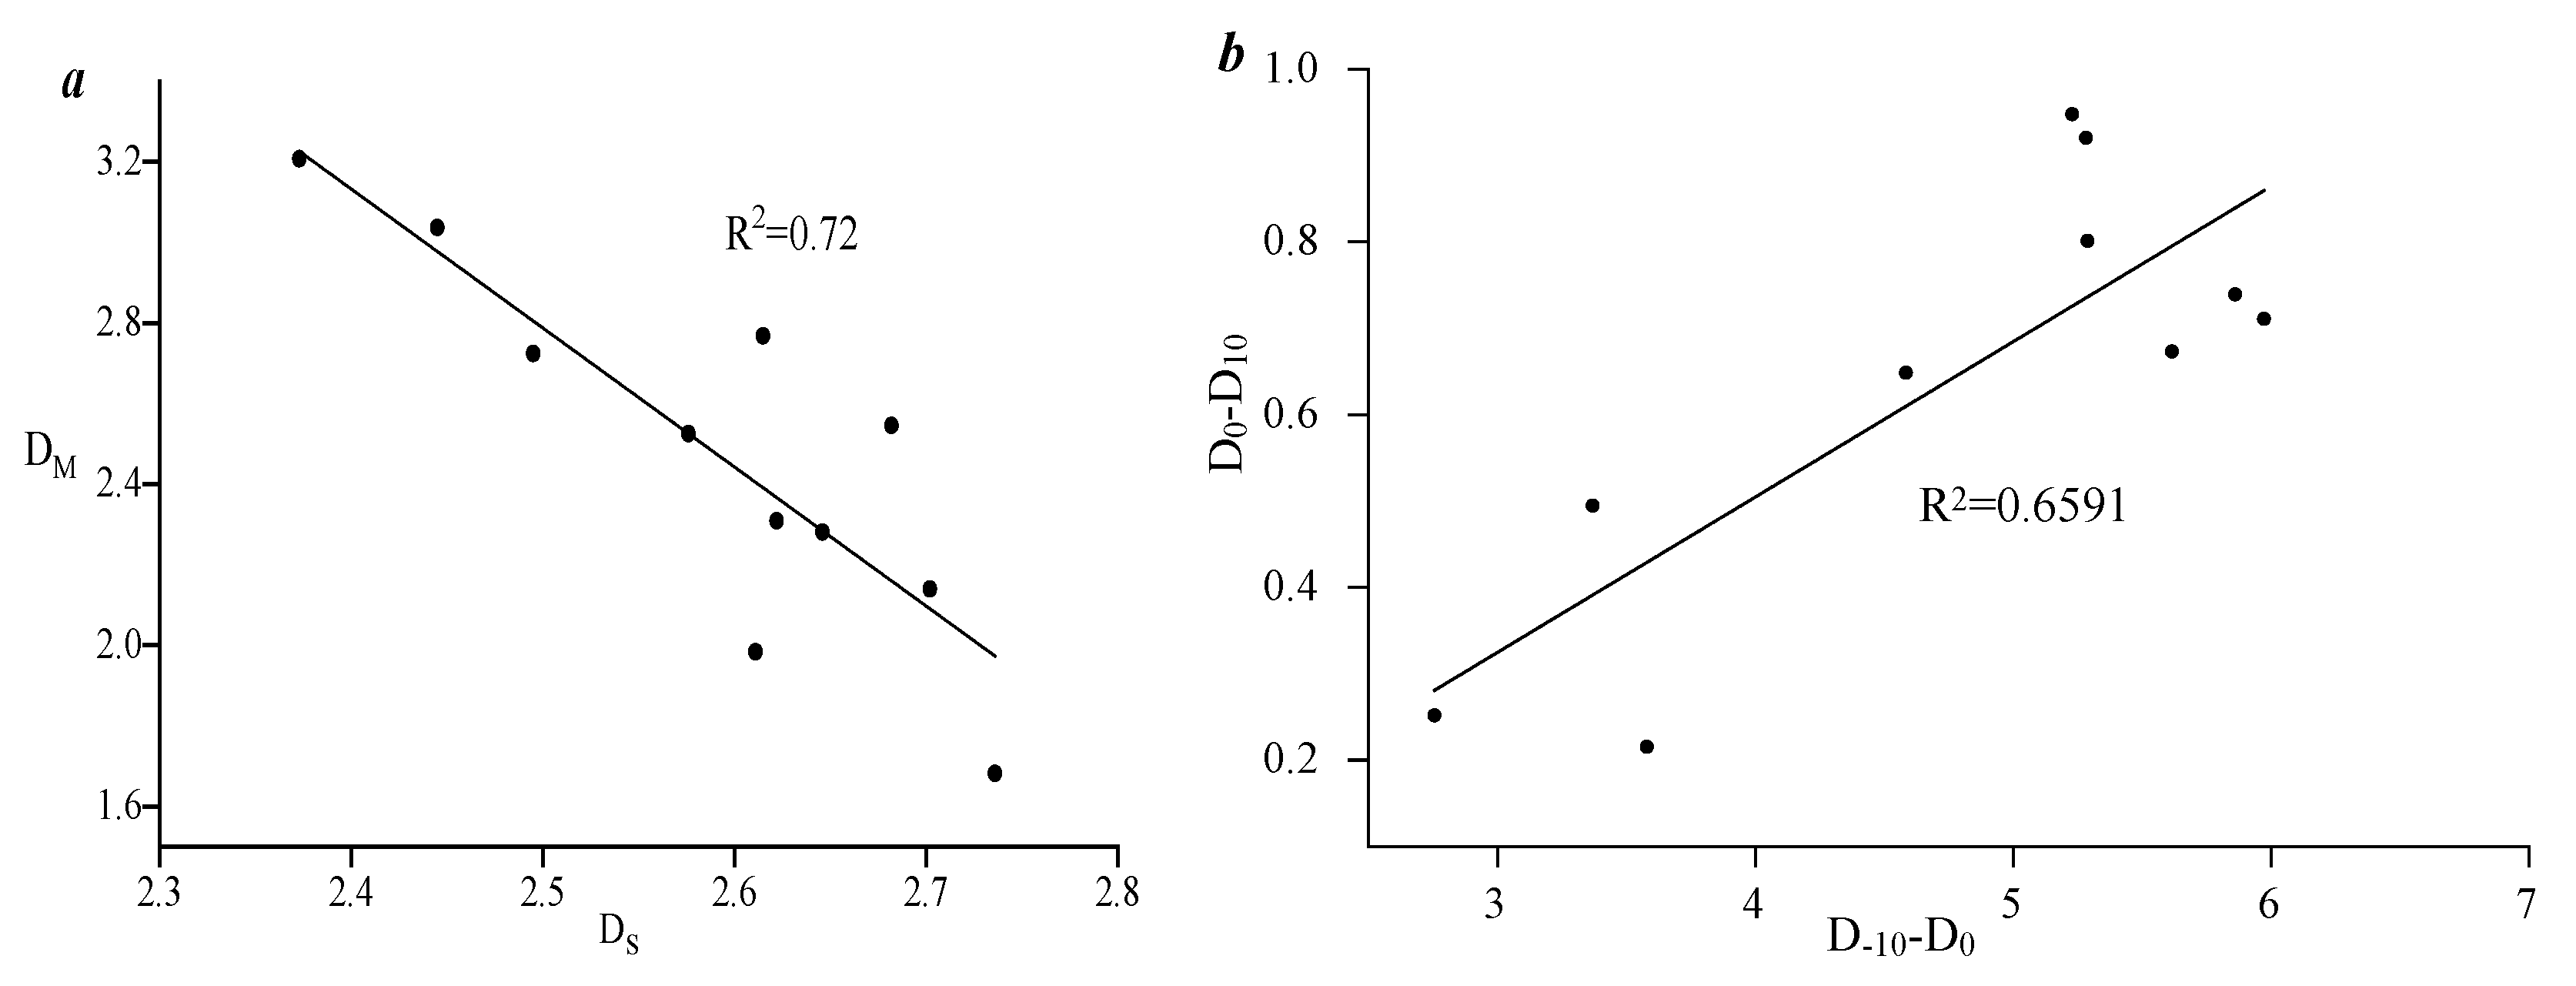
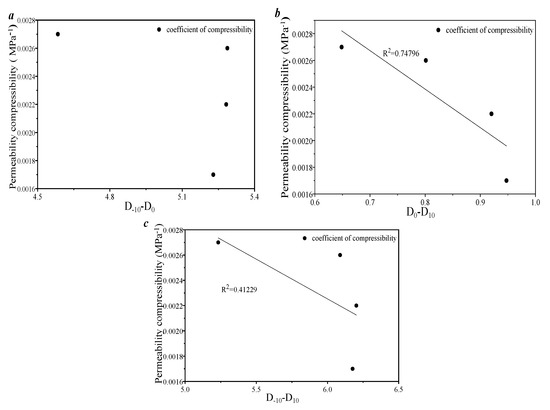
Figure 7 illustrates the correlation of the multifractal features between the different fractal models. There is a significant negative linear correlation between the multifractal parameters calculated by the sponge model and the S model (Figure 7a). This indicates that they have different physical meanings in characterizing the sample and also demonstrates that the sample has good singlet fractal characteristics. The low values of the multifractal dimension of the pore distribution in the sample control the overall distribution of the sample pores (Figure 7a–d). This indicates that when calculating multifractal features, it is necessary to strengthen the calculation of the fractals in areas with a low pore volume.
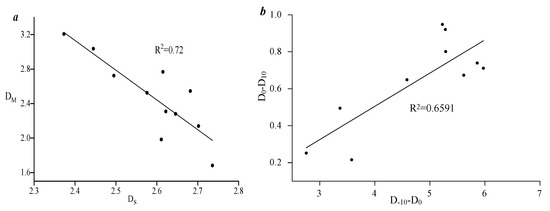
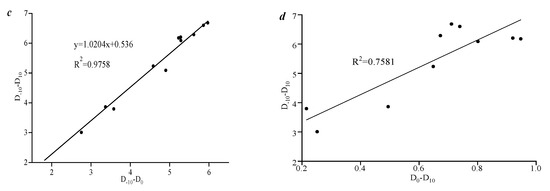
Figure 7.
Correlation characteristics between fractal dimension values based on different fractal models (a) correlation between the S model and the sponge model of singlet dimension fractals; (b) the correlation between the low-value and high-value regions of pore volume in multidimensional fractals; (c) the correlation between the overall pore volume distribution and the low pore volume area in multiple dimensions; (d) Correlation between the overall pore volume distribution and the high-value area of pore volume in multiple dimensions.
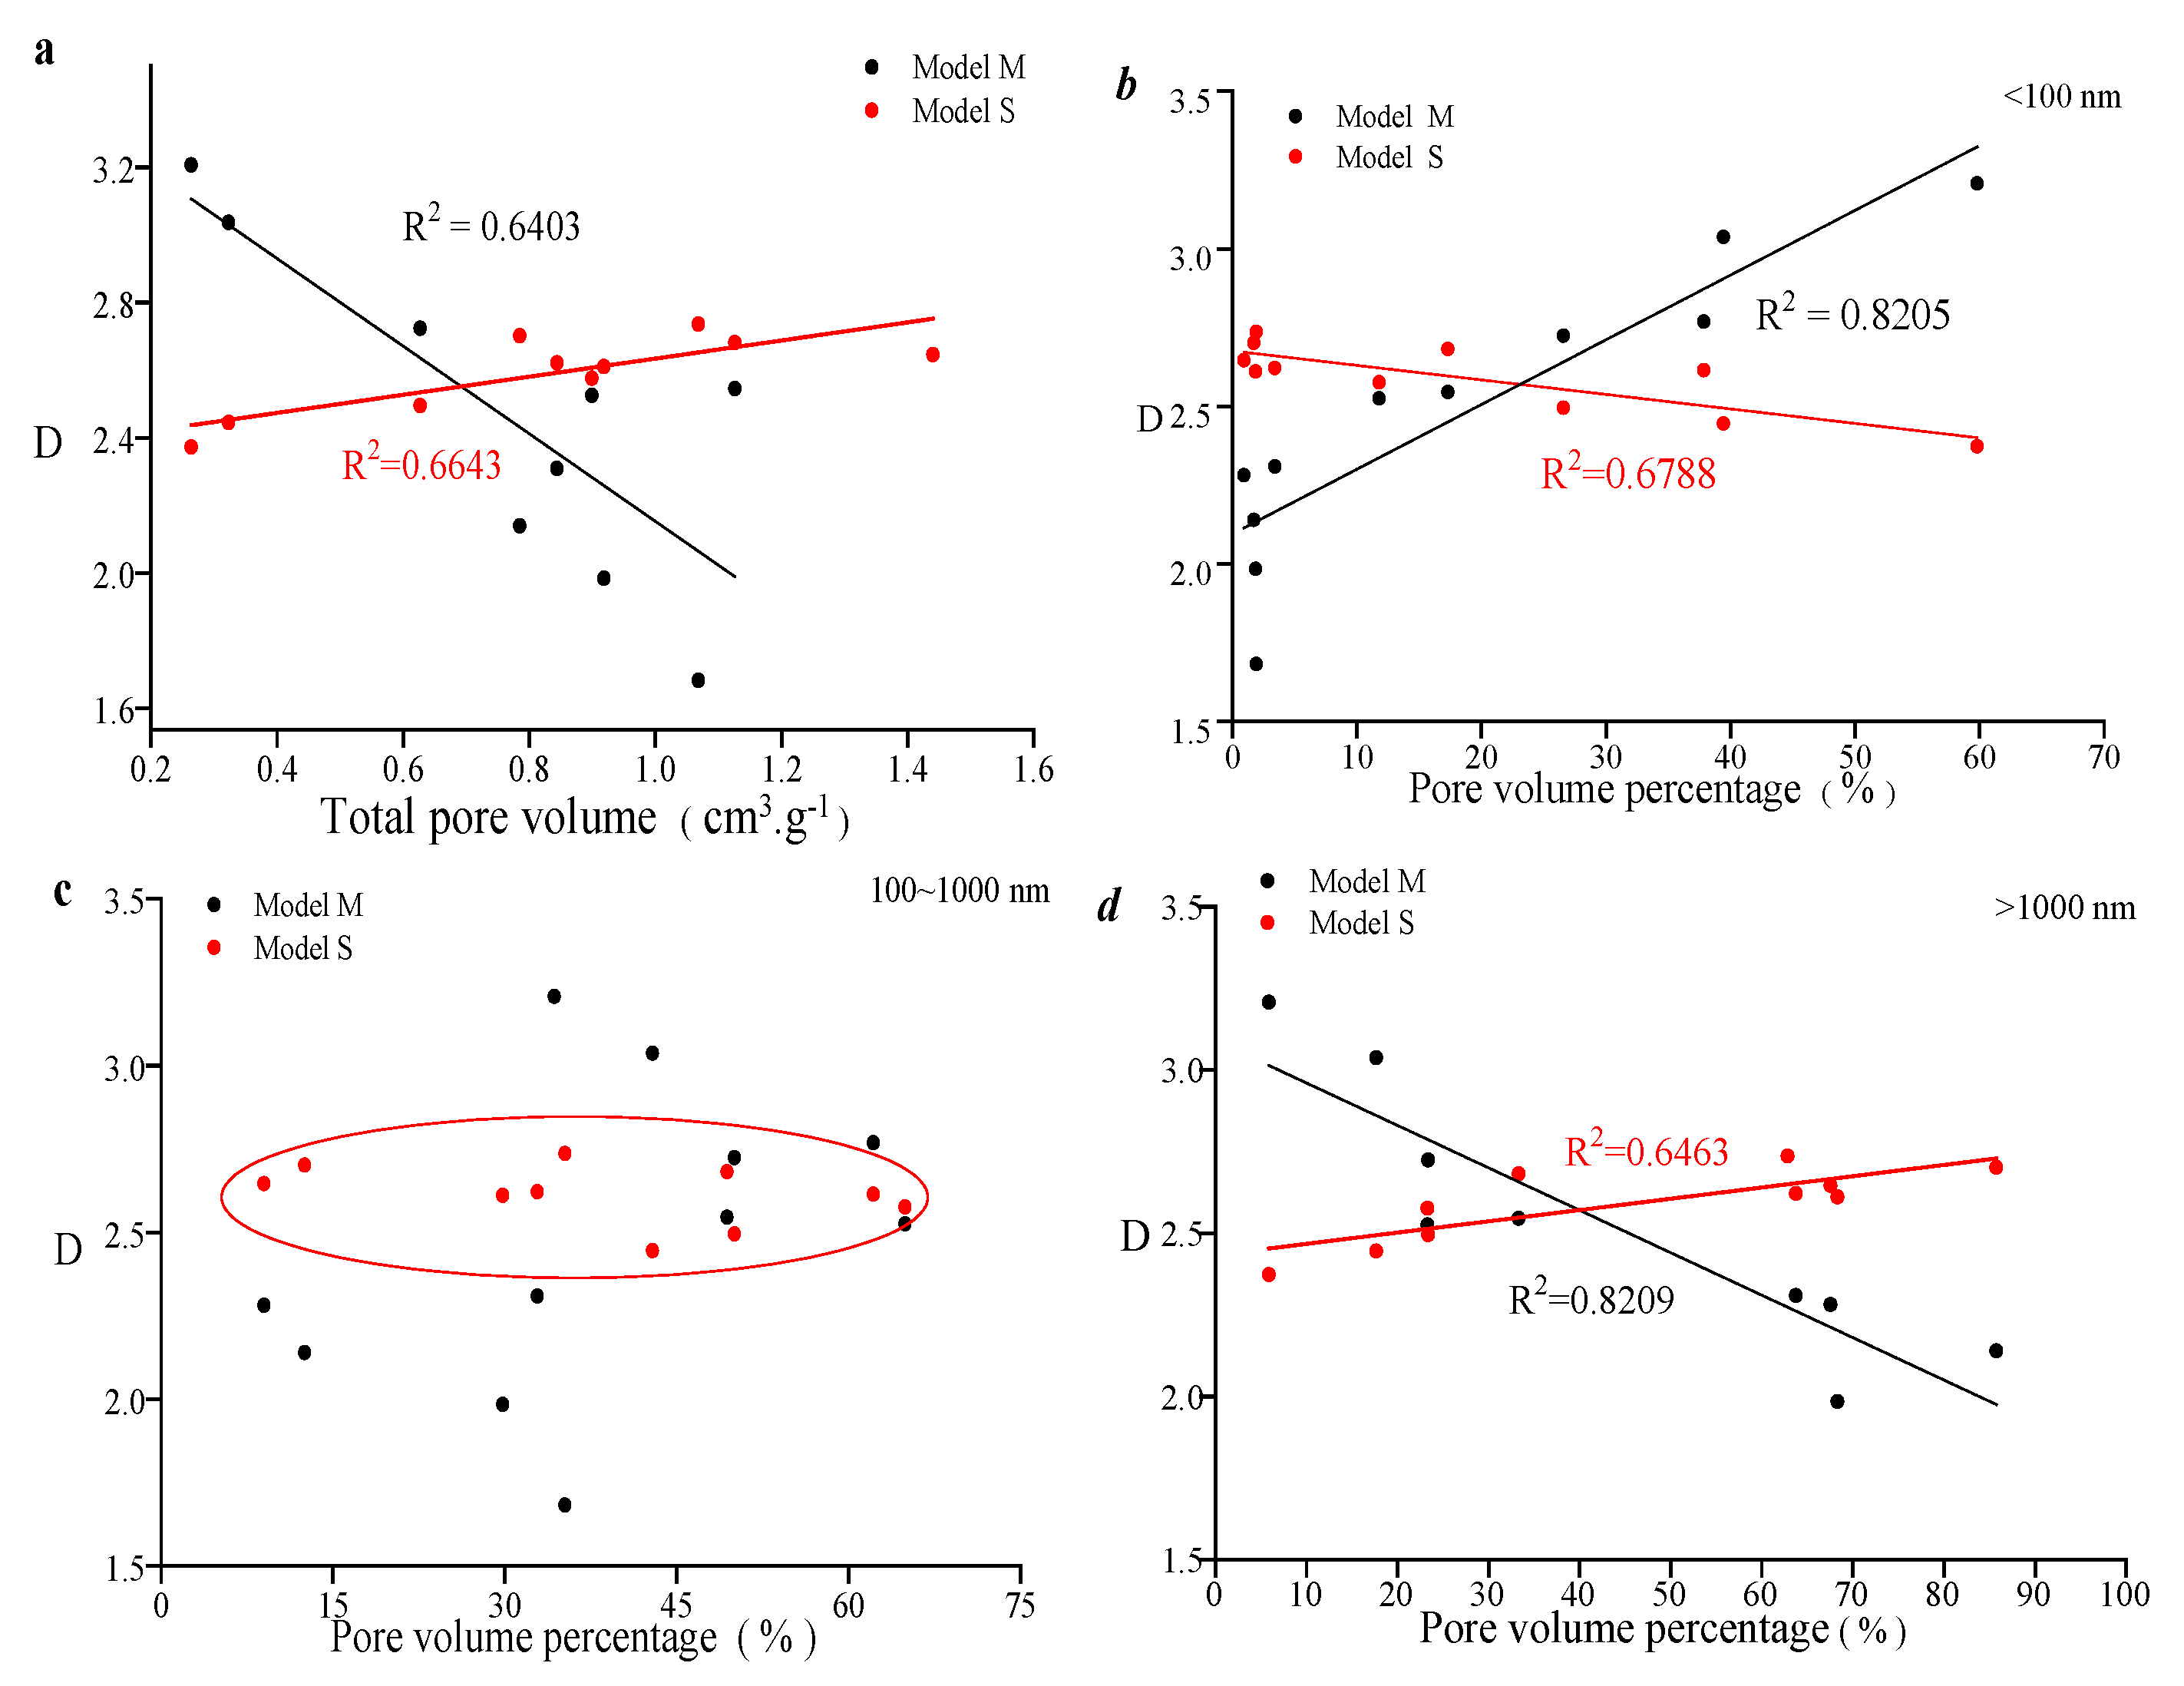
The size of the pores affects the correlation between the pore volume and the multifractal parameters. As shown in Figure 8a, when the total pore volume increases, the pore distribution coefficient represented by the S model is higher, while the pore distribution coefficient of the M model is lower. Combined with the pore volume distribution curve, it can be concluded that the non-uniformity of the pore distribution in type B is much higher than that in type A. Therefore, it is believed that the sponge model can better characterize the heterogeneity of the pore distribution in tight sandstone. As the pore volume (<100 nm) increases, the pore distribution coefficient characterized by the S model is lower, while the pore distribution coefficient of the M model is higher (Figure 8b), which is opposite to the results in Figure 8a. This indicates that the pore volume (<100 nm) has distinct pore volume distribution characteristics compared to the other pore size ranges. Figure 8c,d indicate a weak correlation between the pore volume and the pore size in the range of 100~1000 nm, suggesting that these pores are not the main factor affecting the overall heterogeneity of the pore distribution.
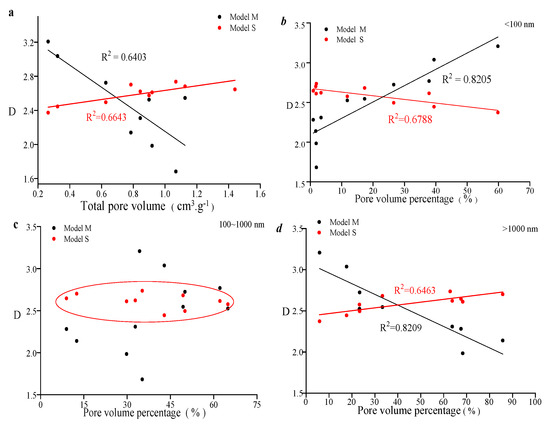
Figure 8.
Correlation analysis between the singleplex fractal dimension based on the pore volume for different pore size ranges and pore volume percentages. (a) Correlation between sample total pore volume and singleplex dimension fractal model; (b) Correlation between samples with pore size < 100 nm and single-dimension fractal models; (c) Correlation between samples with pore sizes of 100~1000 nm and single-dimension fractal models; (d) Correlation between samples with pore sizes > 1000 nm and single-dimension fractal models.
At the same time, the correlation between the pore volume and the multifractal parameters of the pore volume was studied. As the pore volume increased, the multifractal parameters of pore volume with different pore sizes increased to varying degrees. This indicates a strong correlation between the pore volume and the multifractal parameters. Unlike Figure 9a,b,d indicate that there is no significant correlation between the multifractal parameters and the stage pore volume. This is due to the strong heterogeneity of the pore volume distribution in each stage of the sample.
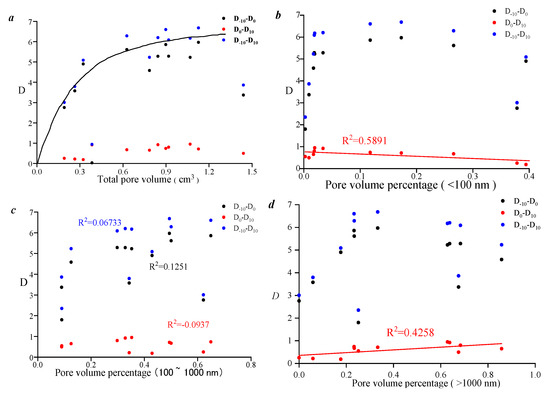
Figure 9.
Correlation analysis between the pore-volume-based multifractal dimension and the pore volume percentage for different pore size ranges (a) Correlation of total sample pore volume with multifractal dimension; (b) Correlation between samples with pore size < 100 nm and multifractal dimension models, (c) Correlation between samples with pore sizes of 100~1000 nm and multifractal dimension models, and (d) Correlation between samples with pore size > 1000 nm and multifractal dimension models.
3.3. Porosity–Permeability and Compressibility Under the Effect of Pore–Fracture Structure Heterogeneity
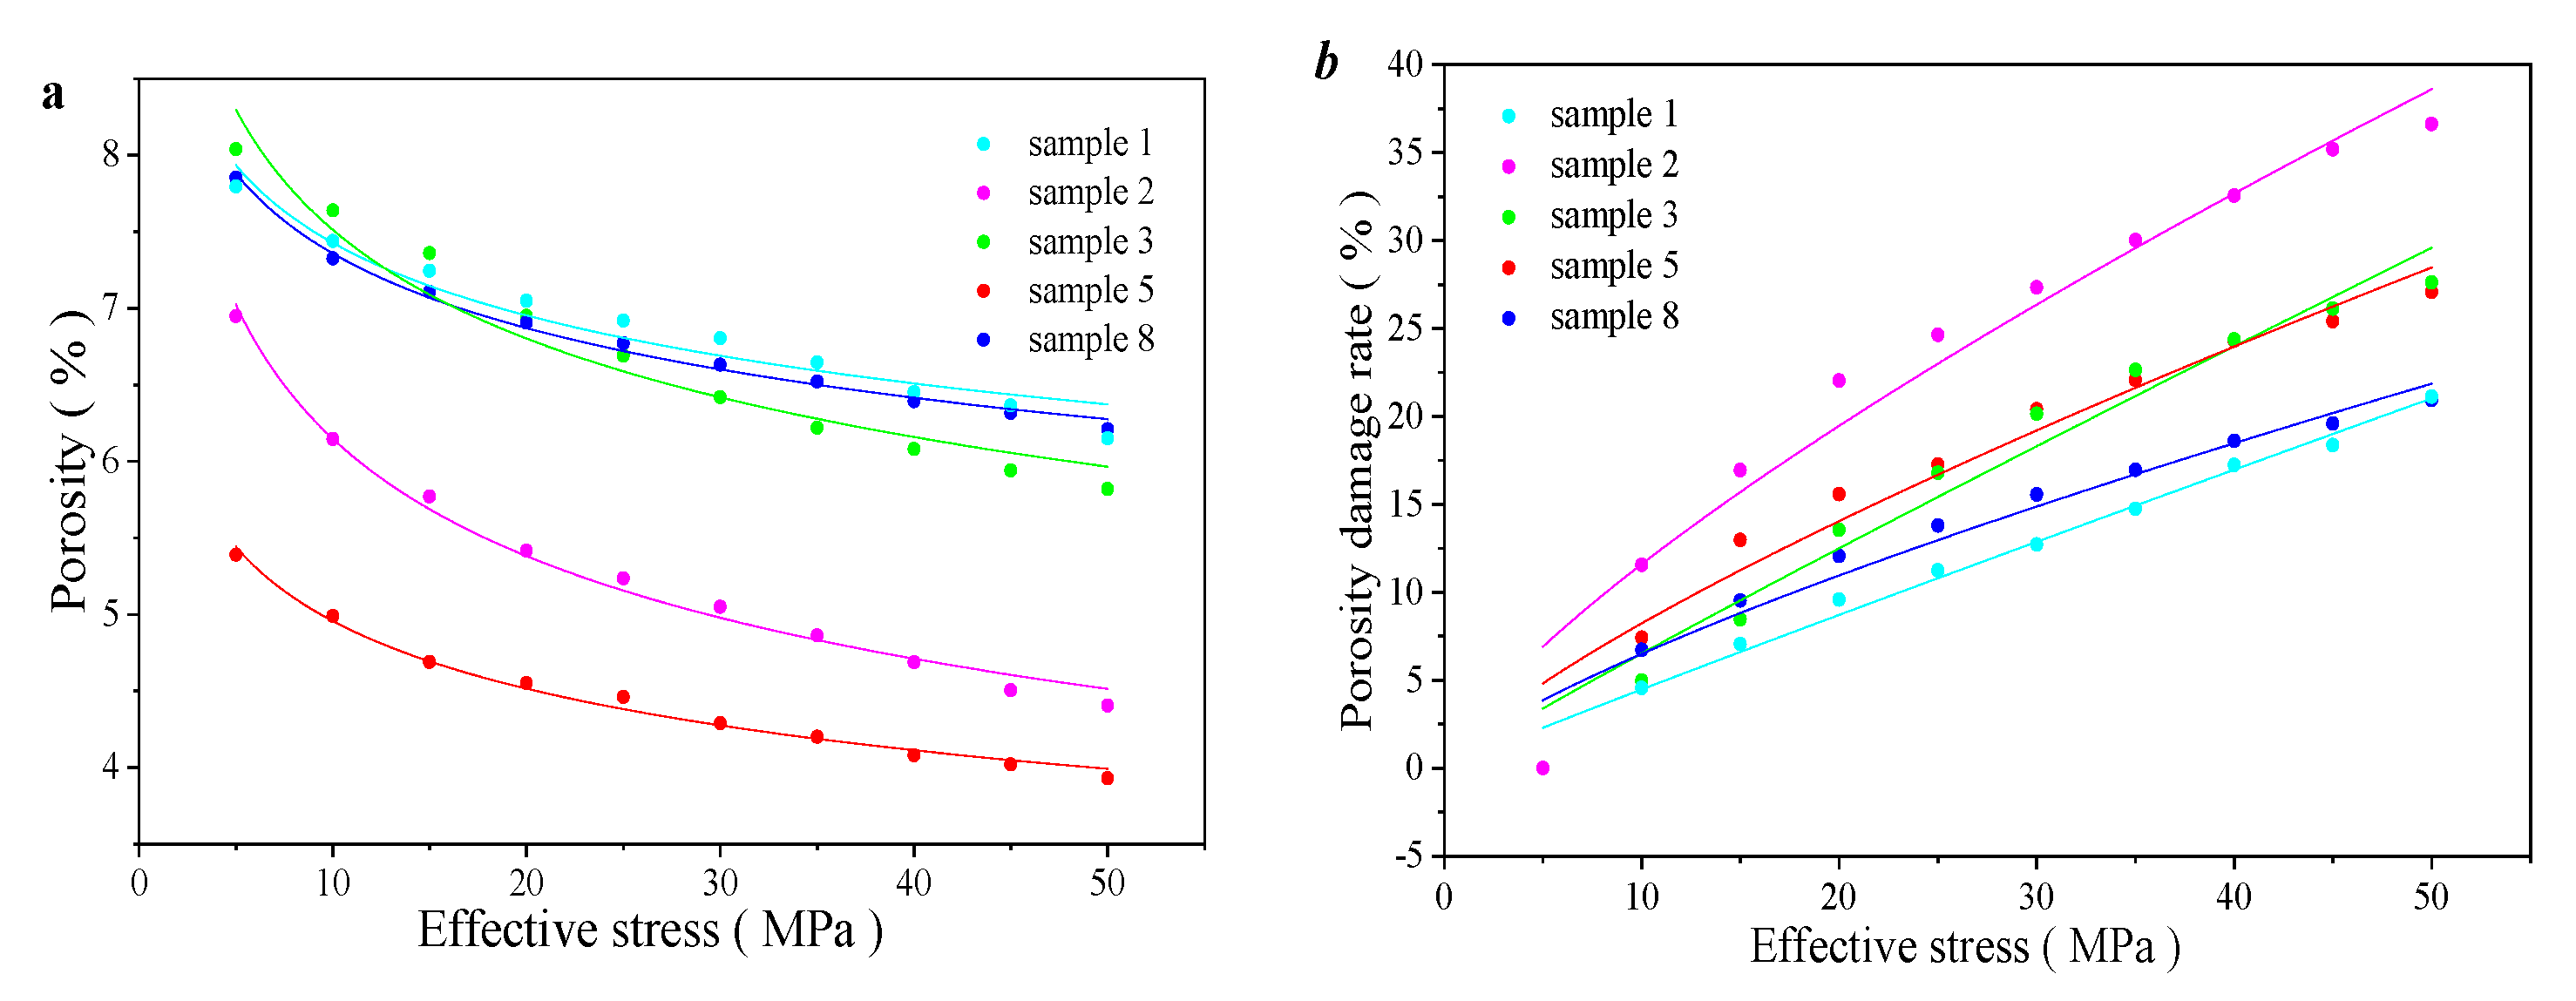
Figure 10 shows the typical sample pressure pore permeability testing. As the effective stress gradually increases, the porosity of each sample decreases exponentially. Figure 10a shows that the initial porosity of each type is 5.39–8.04%, with an average of 7.20%. When the effective stress is 50 MPa, the porosity of each sample is 3.93–6.21%, with an average of 5.30%. To achieve quantitative characterization of the porosity changes, the parameter of the porosity damage rate is introduced to represent the trend of the porosity changes.
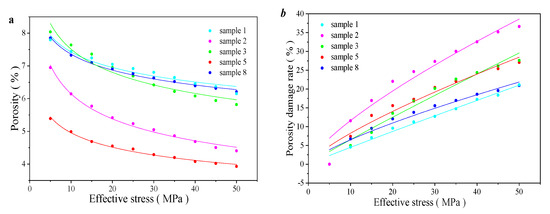
Figure 10.
Relationship between pressure and permeability and compressibility for the samples ((a) porosity vs. pressure; and (b) the relationship between the effective pressure and the damage rate of porosity).
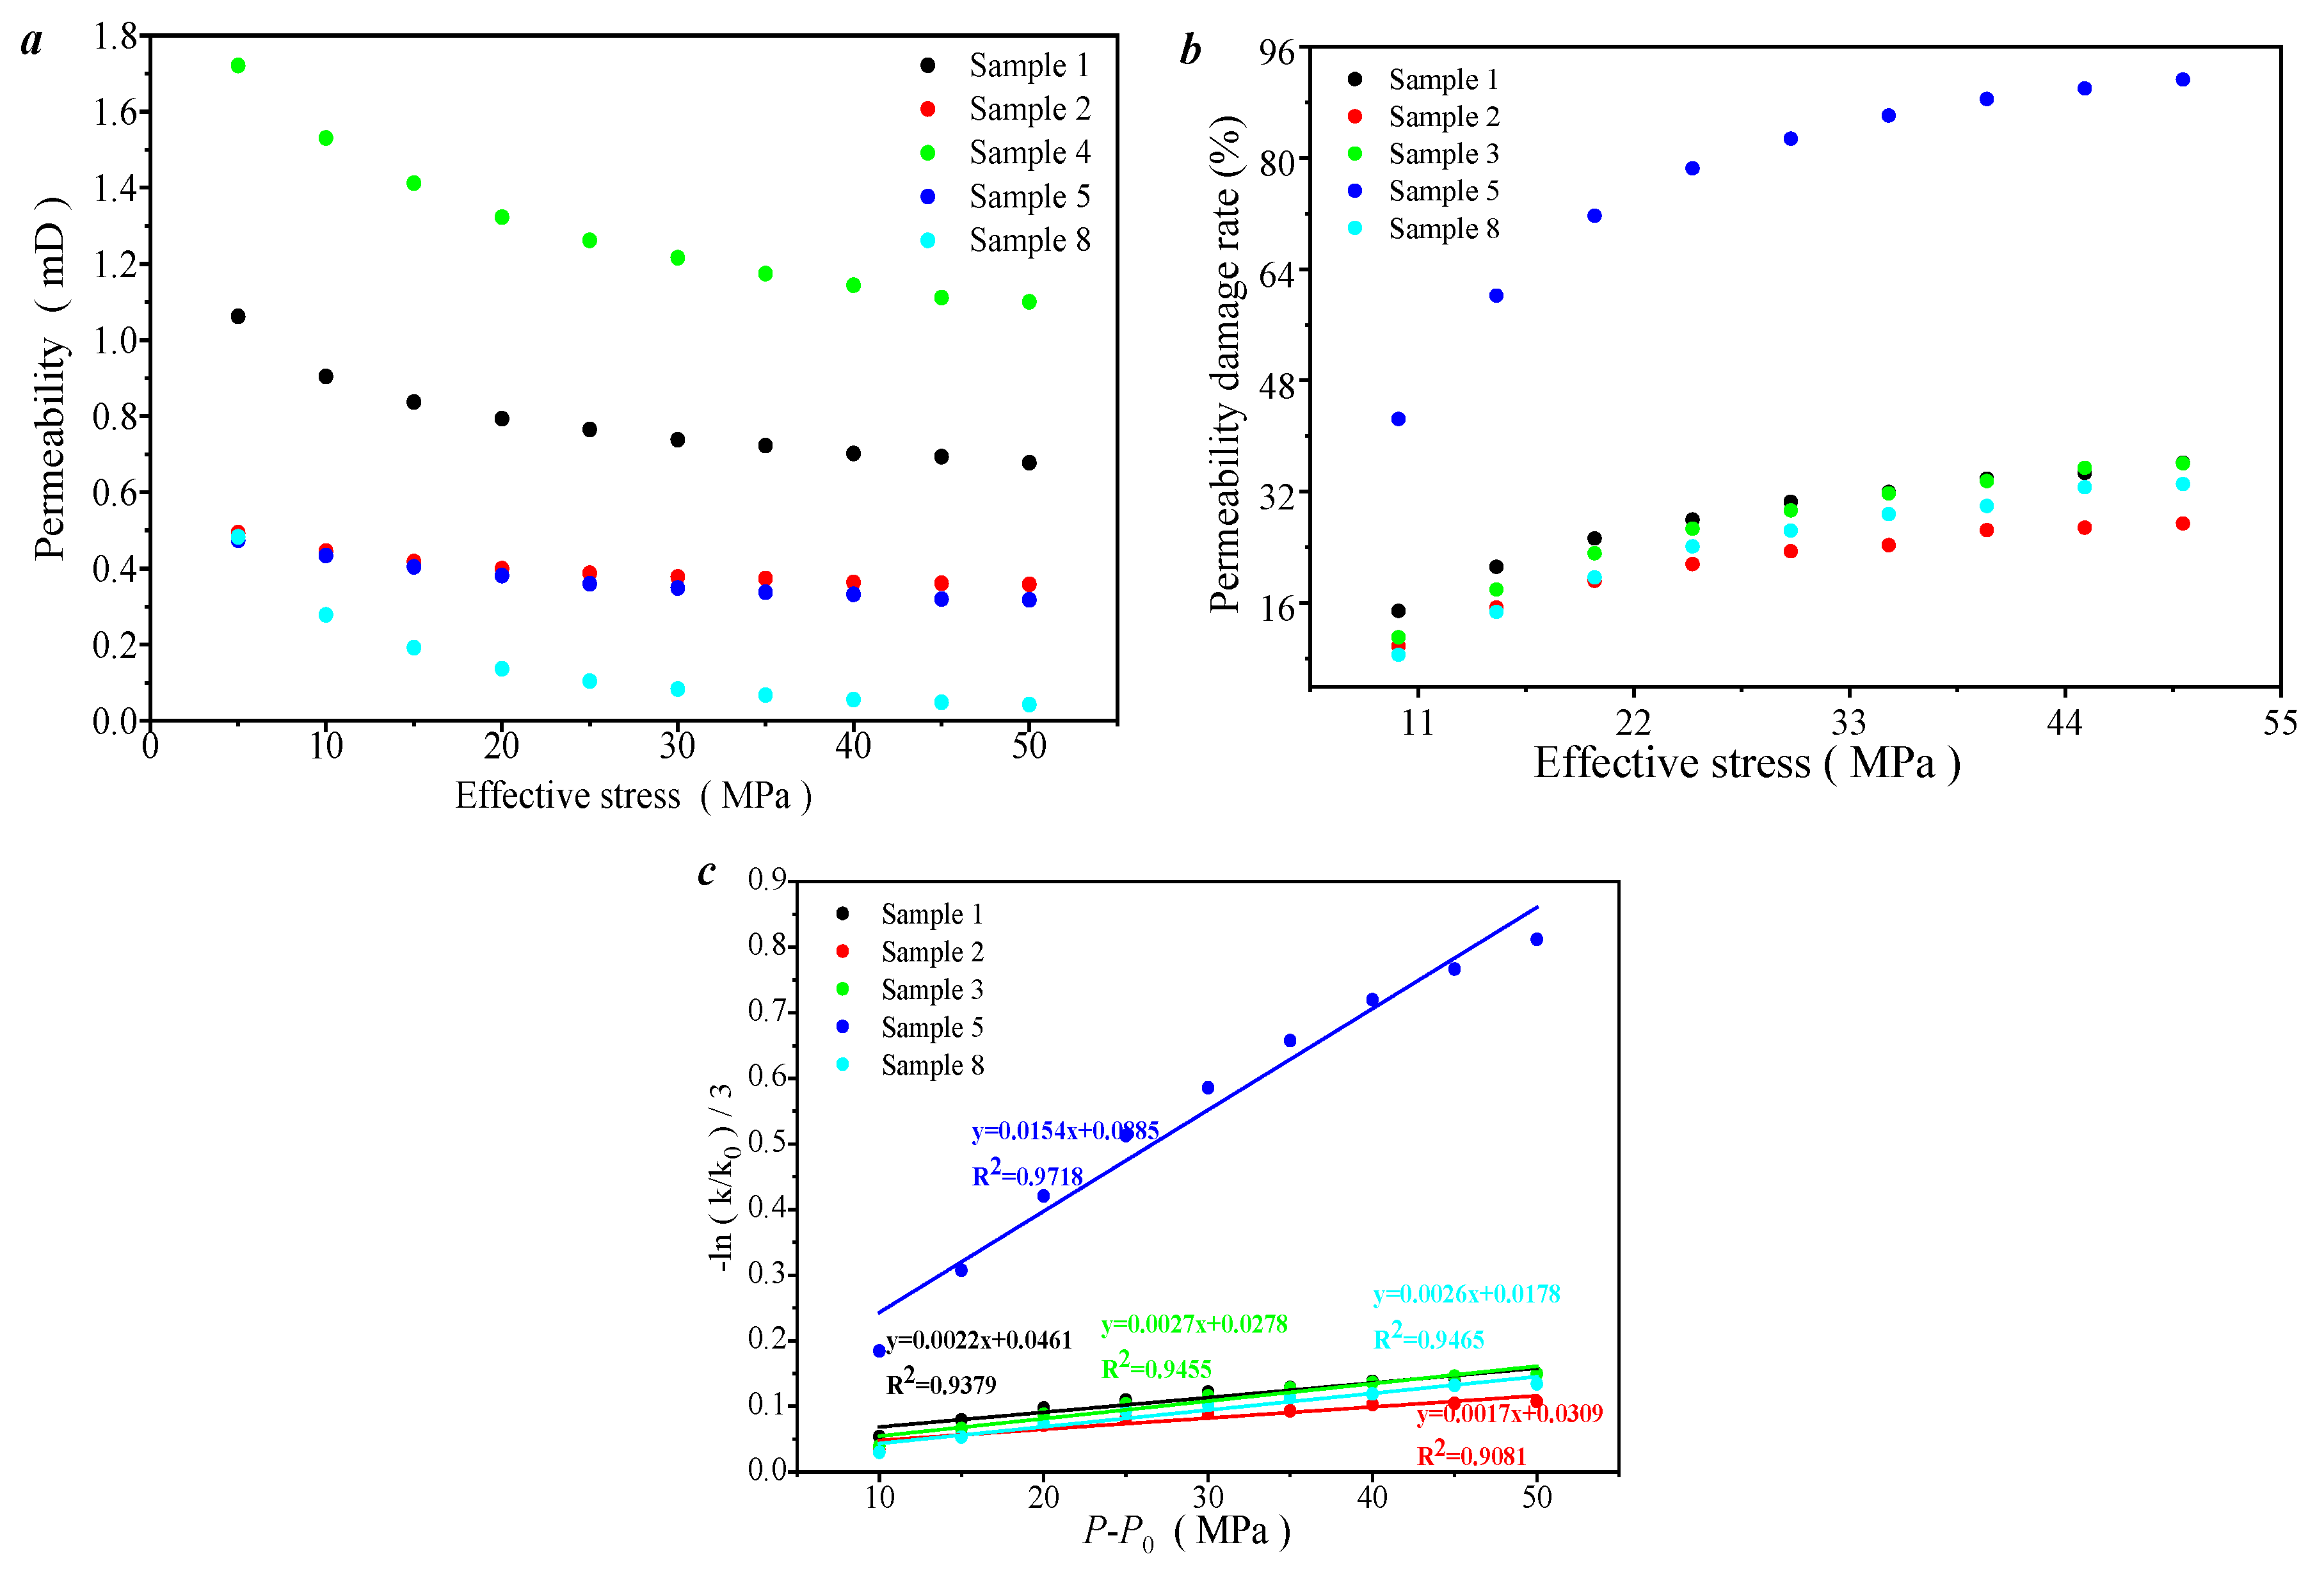
As the effective pressure increases, the porosity damage rate increases exponentially (Figure 10b). Meanwhile, the changes in permeability under different pressures were also analyzed. As the effective pressure increases, the permeability also decreases exponentially. In addition, the permeability damage coefficient was introduced to quantitatively characterize the changes in the permeability damage of the pores.
where B: penetration loss rate, and i: number of pressurization cycles.
Figure 11b shows that the permeability damage rate of this type of sample increases exponentially with stress. This also fully demonstrates that this type of tight sandstone has strong sensitivity.

Figure 11.
Relationship between the effective pressure and permeability and compressibility for the samples ((a) permeability vs. effective pressure; (b) the relationship between the effective pressure and the damage rate of permeability; and (c) the compressibility of the samples).
Based on the formula for compressibility:
where Cp: compressibility (unit: 1/Pa or 1/psi), Vp: pore volume; and P: effective pressure (total pressure minus pore pressure).
The compressibility of this type of sample was calculated. The compressibility of this type of sample is 0.002 to 0.015 MPa−1. Compared with the other literature, it can be seen that the pores of this type of sample have stronger sensitivity (Figure 11c).
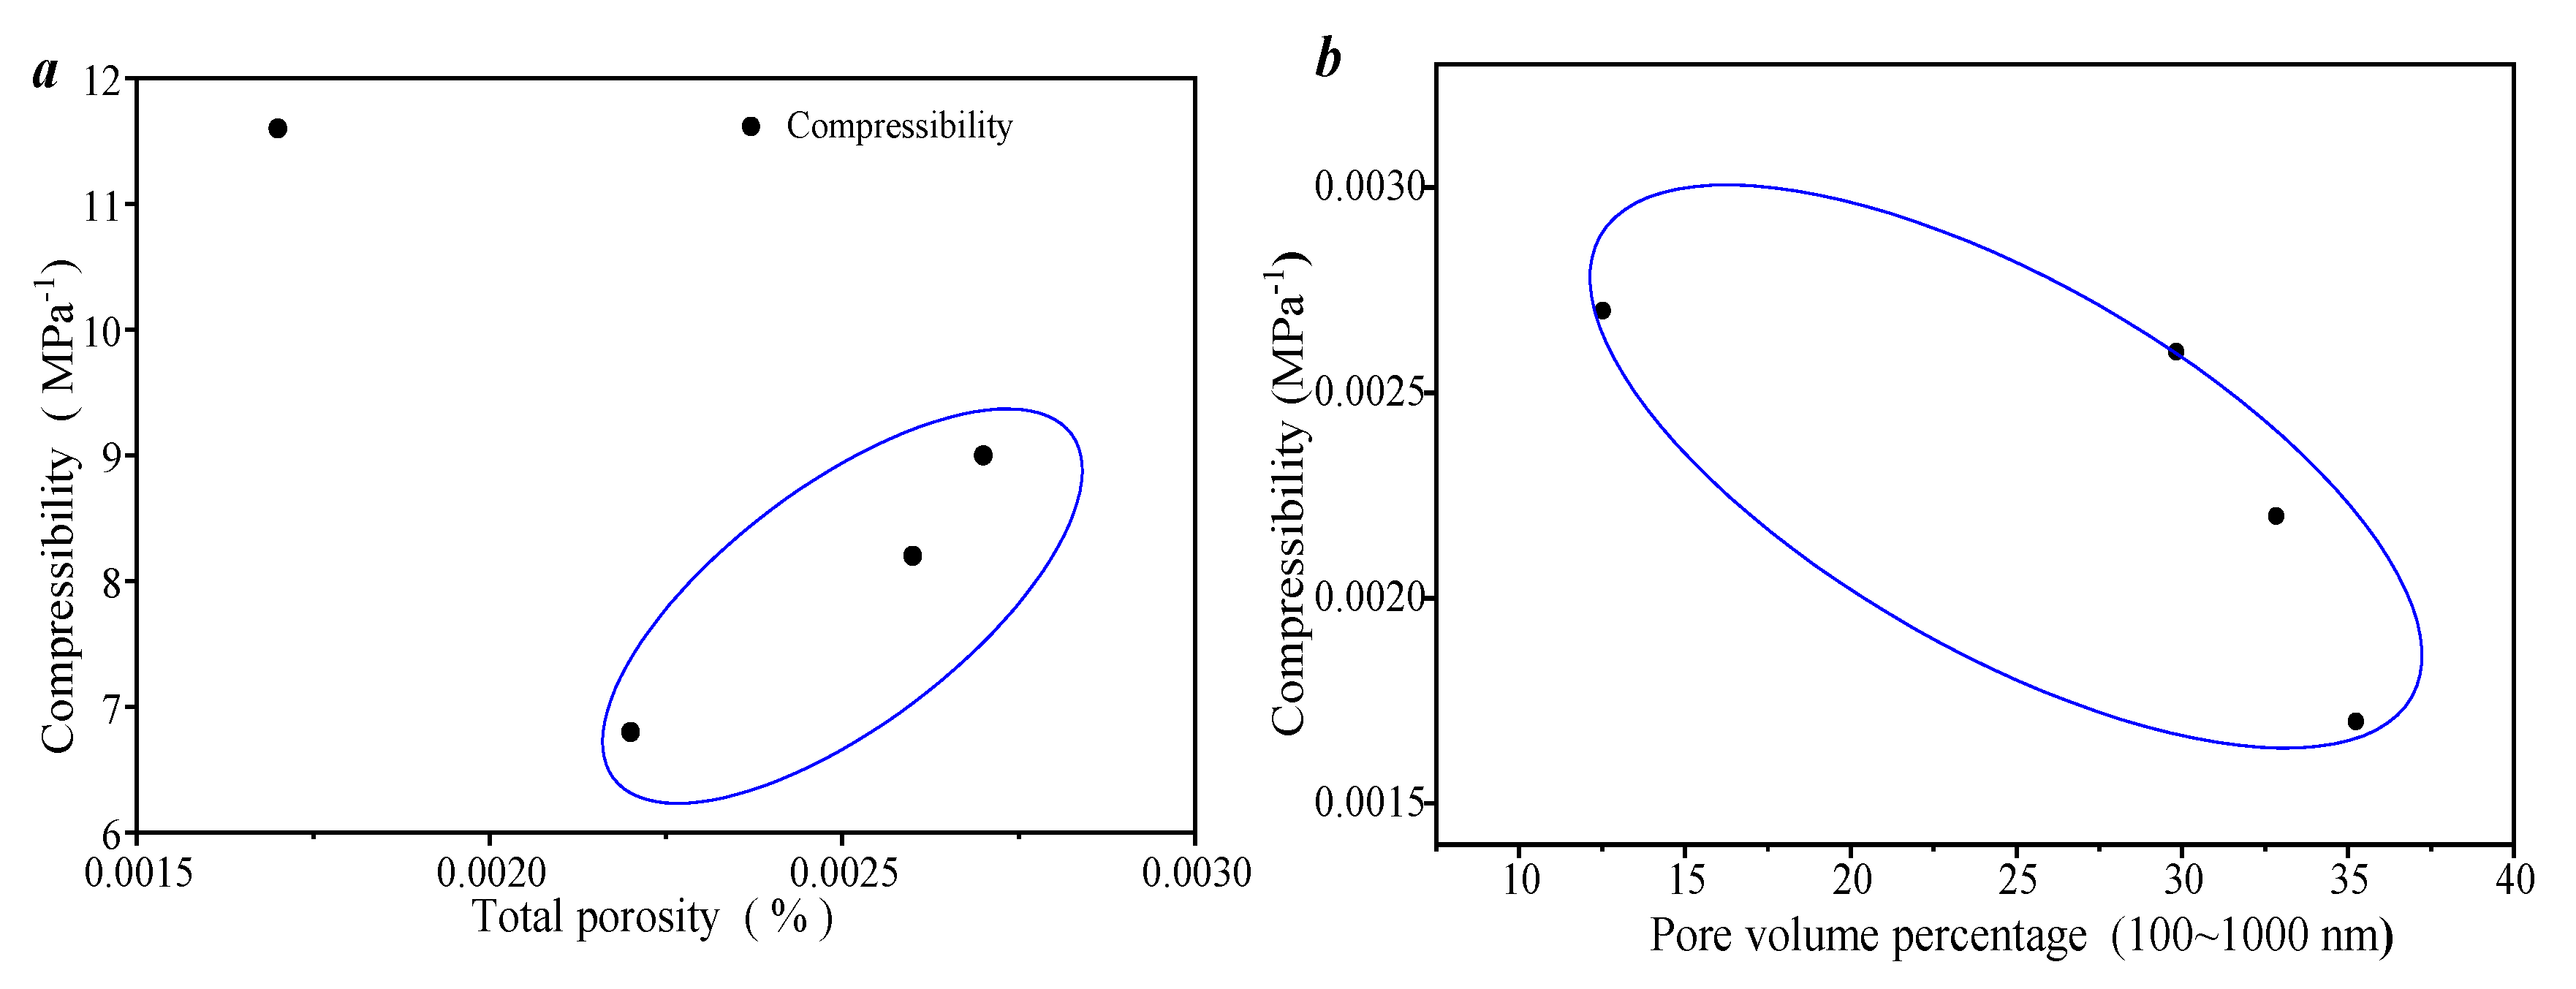
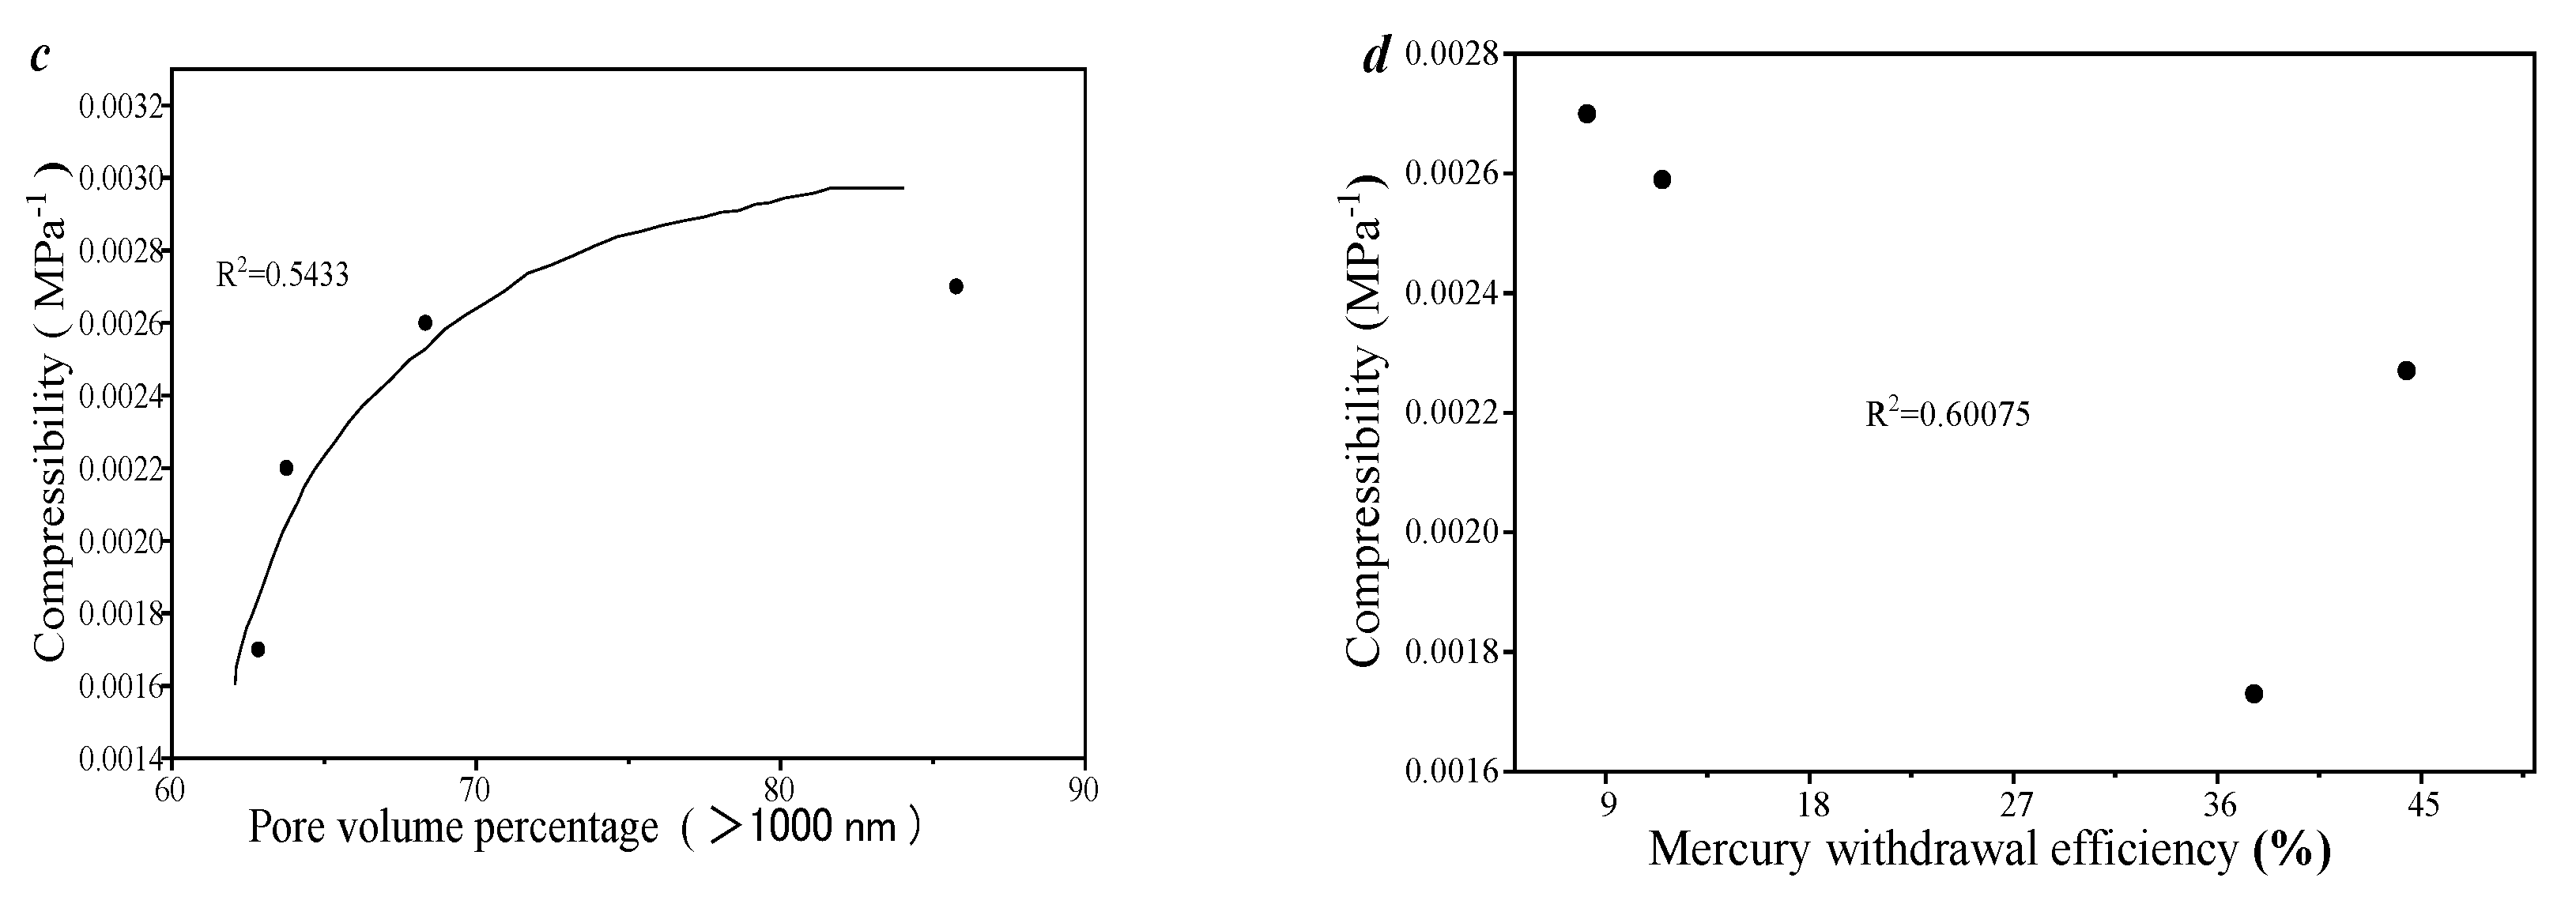
On this basis, the pore volume and multifractal features were introduced to explore the influencing factors of the stress sensitivity in tight reservoirs. As the effective porosity increases, the pore compressibility also increases. This is because larger porosity provides a larger compression space, making it easier for the pores of the reservoir to be compressed. However, as the volume of pores (100–1000 nm) increases, the pore compressibility gradually decreases. This is because these samples have smaller pore throats and stronger capillary forces, making them less prone to deformation under the same stress. At the same time, the increase in such samples also indicates a decrease in the pore volume of large pores larger than 1000 nm, which reduces the compressible space provided by the sample (Figure 12c). In addition, as the mercury removal saturation increases, the compressibility decreases (Figure 12d), because higher mercury removal efficiency means more complex pore connectivity, making it difficult to compress the pore space under the same stress.

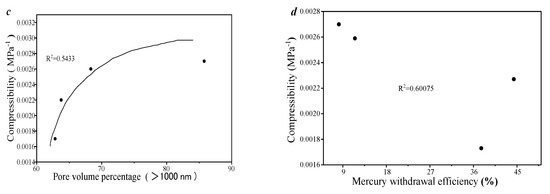
Figure 12.
Correlation analysis of the compressibility with the permeability and pore volume for different pore sizes. (a) Relationship between total porosity and compressibility coefficient; (b) The relationship between the pore size and the compressibility coefficient of the pore size of 100~1000 nm; (c) the relationship between porosity and compressibility coefficient of pore size > 1000 nm; (d) Relationship between compressibility coefficient and mercury withdrawal efficiency.
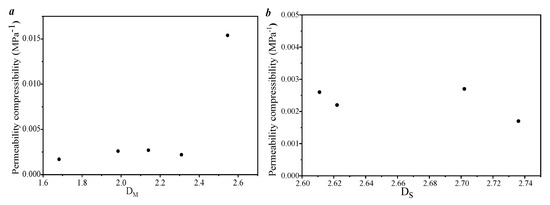
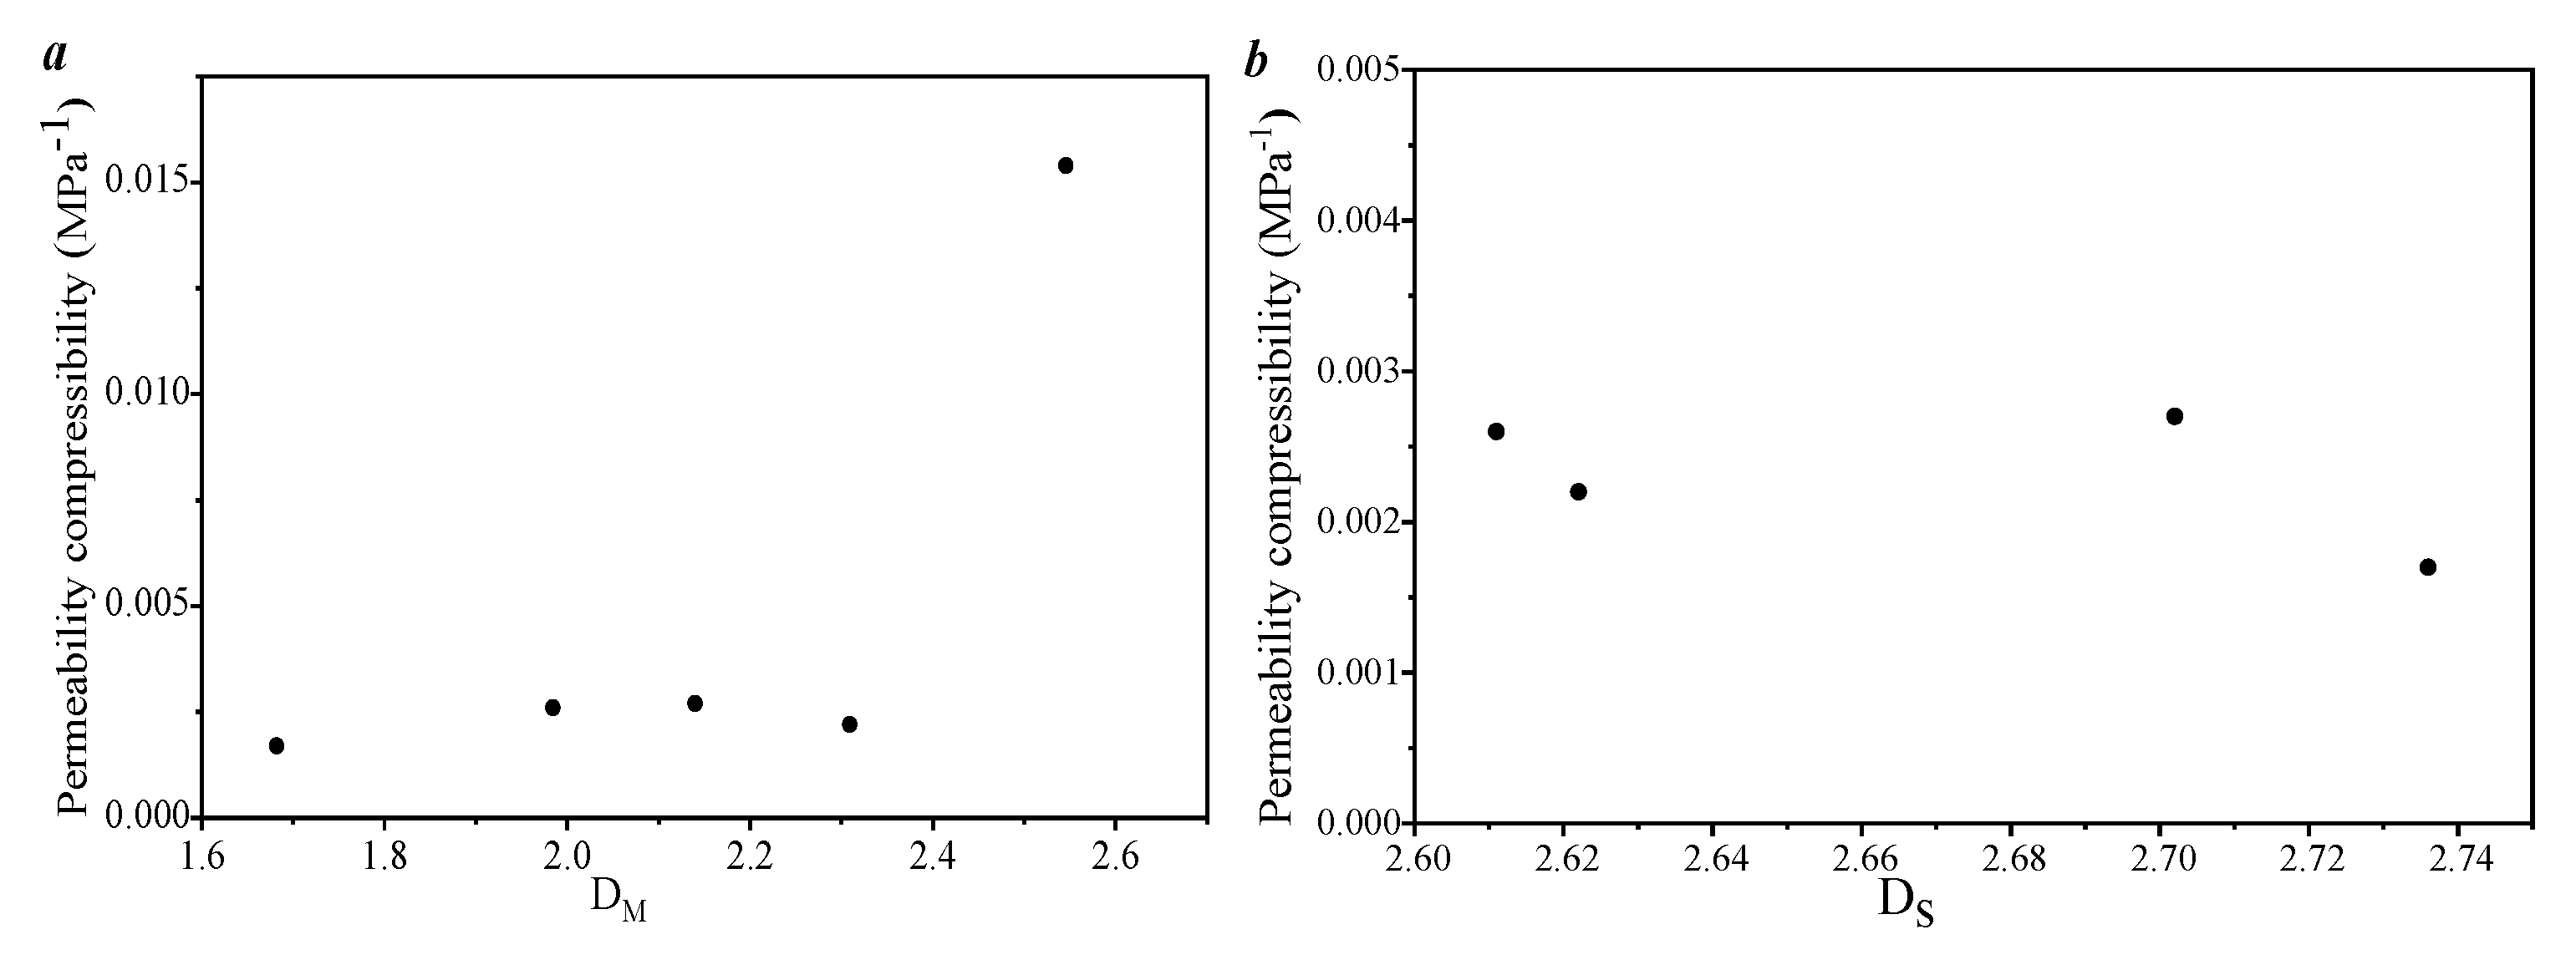
Figure 13 shows the relationship between the single fractal parameters and the porosity compressibility. As the fractal dimension values DM and DS increase, the porosity compression of each sample gradually increases. This is because the fractal parameter characterizes the increased heterogeneity of the pore distribution in small pores, which means that larger pores have less heterogeneity and can provide more compression space and compression capacity for pores.
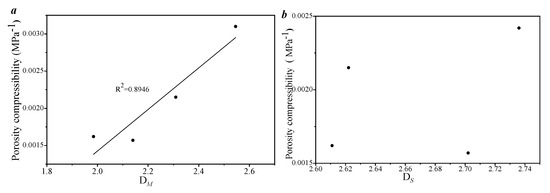
Figure 13.
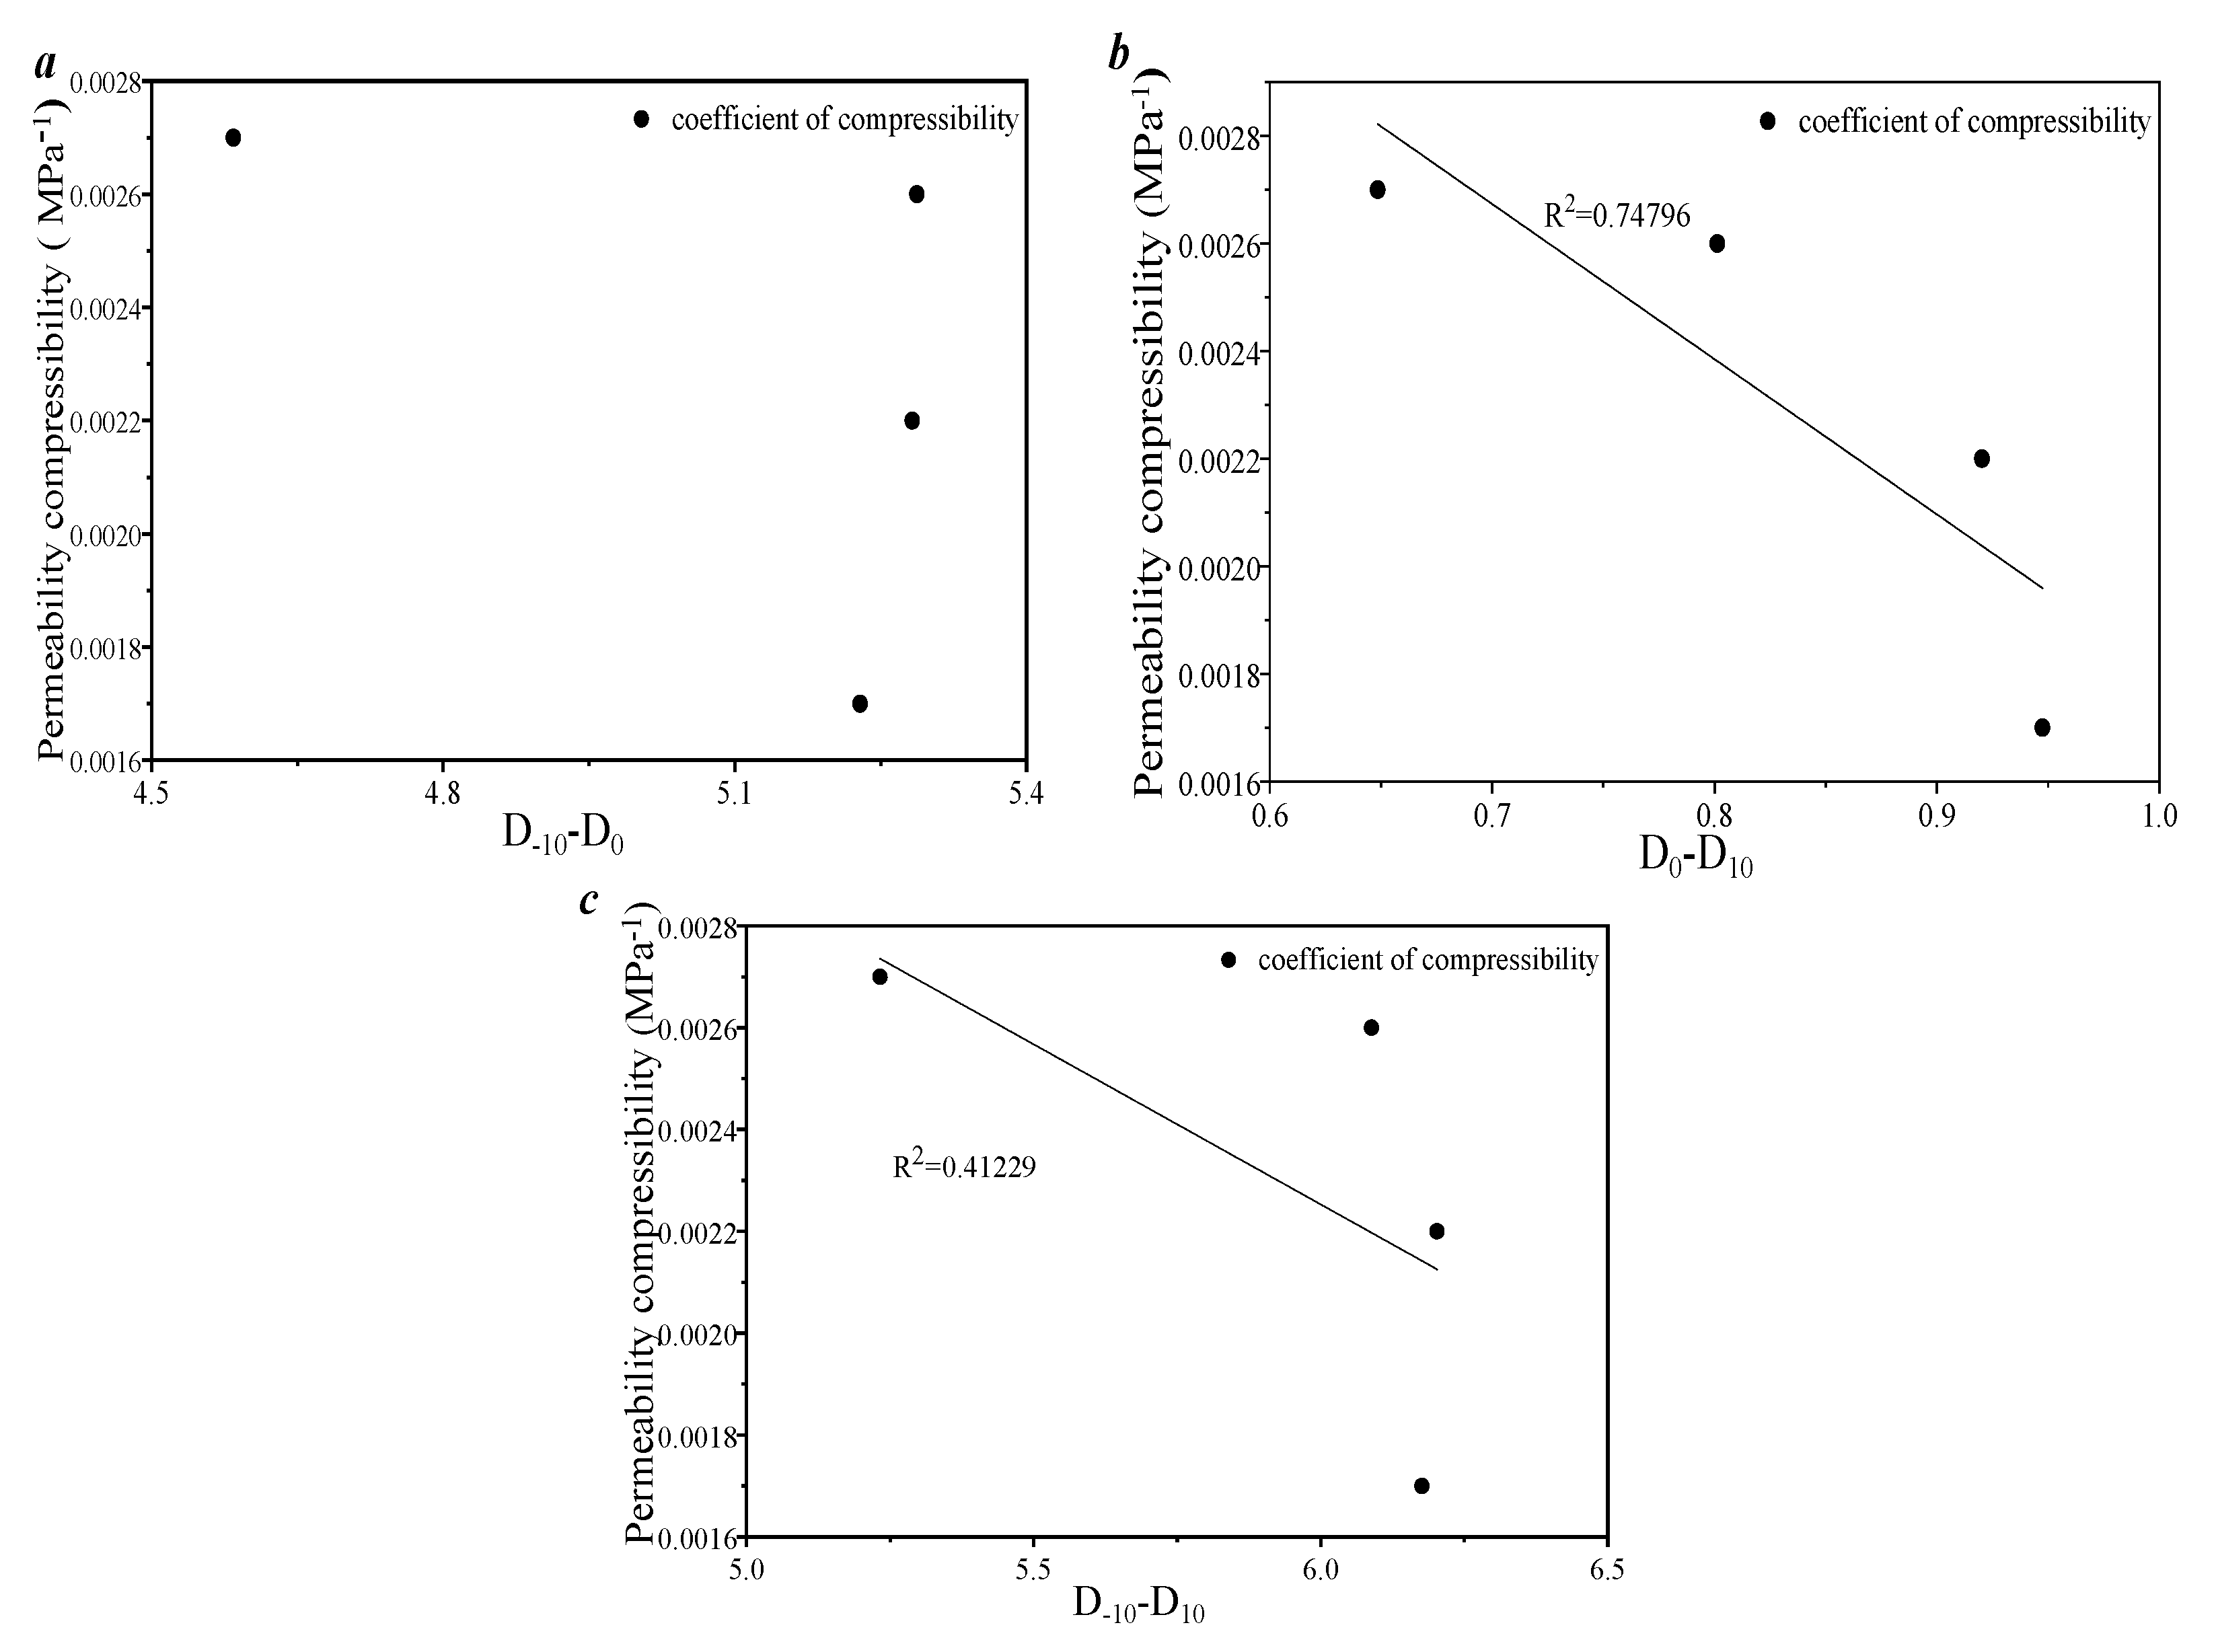
Correlation analysis between the porosity compressibility of the porosity and the single fractal of the pores. (a) the correlation between the singlet fractal dimension and the porosity compressibility coefficient based on the sponge model; (b) The correlation between the single-fold fractal dimension and the porosity compressibility coefficient based on the S-model. Figure 14 shows the relationship between the single fractal parameters and the permeability compression. As the fractal dimension value DM increases, the permeability compression of each sample gradually increases. This is because the fractal parameter mainly characterizes the increased heterogeneity of the pore distribution in small pores, which also means that larger pores have less heterogeneity and can provide more compression space and compression capacity for pores.
4. Conclusions
- (1)
- Based on the mercury-in and mercury-out curves, the samples can be divided into two categories, A and B. There is a significant hysteresis loop in the mercury inlet and outlet curves of type A, and the efficiency of the mercury inlet and outlet in pores is relatively high. Then, the pore volume is 0.785 to1.44 cm3/g, the average value is 1.039 cm3/g and the mercury removal rate is 32%~43%. The mercury removal curve of type B is almost parallel, and its mercury removal efficiency is relatively low. The pore volume of this type of sample is 0.191~0.844 cm3/g, the average value is 0.439 cm3/g, and the mercury removal rate is 31%~39%.
- (2)
- This type of tight sandstone reservoir has strong heterogeneity characteristics. The applicability of singlet fractals in characterizing the heterogeneity of dense pores is higher than that of multifractals. This is because the single fractal characteristics of the two types of samples mentioned above have significant differences, while the differences in the multifractals are relatively weak.
- (3)
- The compressibility of this type of sample was calculated based on the overburden pore permeability test, with porosity compressibility of 0.00157~0.0031 and the average value is 0.002172, with permeability compressibility of 0.0017~0.0154 and the average value is 0.00492. The pores of 100–1000 nm provide the main compression space for this type of sample. The results of the factor correlation analysis indicate that the heterogeneity of the pore distribution between 100 and 1000 nm affects the compression effect and stress sensitivity of this type of sample. Therefore, in the process of studying the production capacity of tight sandstone in the research area, it is necessary to focus on strengthening the research and influence on this part of the space.
Author Contributions
Conceptualization, H.P. and Y.D.; methodology, Y.D. and Q.Z.; software, Q.Z.; validation, Z.X. and Q.Z.; resources, Y.Z.; data curation, A.X.; writing—original draft preparation, Y.G.; writing—review and editing, Y.D.; funding acquisition, J.Z. All authors have read and agreed to the published version of the manuscript.
Funding
The Youth Science and Technology Innovation Fund of Exploration and Research Institute of China Coal Geology Administration (ZYQJ-2024-4); the Henan Provincial Key Science and Technology Tackling Program (No. 242102320349).
Data Availability Statement
Data are contained within the article.
Conflicts of Interest
Author Anan Xu was employed by the Dongying Changwei Energy Service Co., Ltd. The remaining authors declare that the research was conducted in the absence of any commercial or financial relationships that could be construed as a potential conflict of interest. The the Dongying Changwei Energy Service Co., Ltd. had no role in the design of the study; in the collection, analyses, or interpretation of data; in the writing of the manuscript, or in the decision to publish the results.
References
- Li, Q.; Zhao, D.; Yin, J.; Zhou, X.; Li, Y.; Chi, P.; Han, Y.; Ansari, U.; Cheng, Y. Sediment Instability Caused by Gas Production from Hydrate-bearing Sediment in Northern South China Sea by Horizontal Wellbore: Evolution and Mechanism. Nat. Resour. Res. 2023, 32, 1595–1620. [Google Scholar] [CrossRef]
- Yao, P.; Zhang, J.; Lv, D.; Vandeginste, V.; Chang, X.; Zhang, X.; Wang, D.; Han, S.; Liu, Y. Effect of water occurrence in coal reservoirs on the production capacity of coalbed methane by using NMR simulation technology and production capacity simulation. Geoenergy Sci. Eng. 2024, 243, 213353. [Google Scholar] [CrossRef]
- Li, Q.; Zhang, C.; Yang, Y.; Ansari, U.; Han, Y.; Li, X.; Cheng, Y. Preliminary experimental investigation on long-term fracture conductivity for evaluating the feasibility and efficiency of fracturing operation in offshore hydrate-bearing sediments. Ocean Eng. 2023, 281, 114949. [Google Scholar] [CrossRef]
- Zou, C.N.; Tao, S.Z.; Han, W.X.; Zhao, Z.Y.; Ma, W.J.; Li, C.W.; Bai, B.; Gao, X.H. Geological and Geochemical Characteristics and Exploration Prospect of Coal-Derived Tight Sandstone Gas in China: Case Study of the Ordos, Sichuan, and Tarim Basins. Acta Geol. Sin. Engl. Ed. 2018, 92, 1609–1626. [Google Scholar] [CrossRef]
- Yang, Z.; Li, Q.Y.; Wu, S.T.; Lin, S.H.; Liu, X.S. Evidence of the Near-Source Accumulation of the Tight Sandstone Gas in Northern Ordos Basin, North-Central China. Acta Geol. Sin. Engl. Ed. 2017, 91, 1820–1835. [Google Scholar] [CrossRef]
- Yuan, K.; Li, Y.; Shi, T.; Huang, H.; Li, Y.; He, M.; Liu, D. Conventional Mercury Penetration and Constant Velocity Mercury Penetration Experiments Are Used to Quantitatively Characterize the Difference in Micropore Structure in Low Permeability Reservoirs and Its Influence on Movable Fluid Saturation. Geofluids 2023, 2023, 1–15. [Google Scholar] [CrossRef]
- Zhao, D.; Hou, J.; Sarma, H.; Guo, W.; Liu, Y.; Xie, P.; Dou, L.; Chen, R.; Zhang, Z. Pore throat heterogeneity of different lithofacies and diagenetic effects in gravelly braided river deposits: Implications for understanding the formation process of high-quality reservoirs. Geoenergy Sci. Eng. 2023, 221, 111309. [Google Scholar] [CrossRef]
- Tang, Y.; Lei, J.C.; Dong, H.R.; Tan, S.A.; Ma, D.Y.; Zhang, N.; Wang, M.X. Study on Pore Structure and the Microscopic Mechanism of the Difference in Petrophysical Properties of Tight Sandstone: A Case Study of the Chang 3 Member of Weibei Oilfield, Ordos Basin. Front. Earth Sci. 2022, 10, 870332. [Google Scholar] [CrossRef]
- Deng, J.; Zeng, H.; Wu, P.; Du, J.; Gao, J.; Zhao, F.; Jiang, Z.; Davarpanah, A. Pore Structure Differentiation between Deltaic and Epicontinental Tight Sandstones of the Upper Paleozoic in the Eastern Linxing Area, Ordos Basin, China. Geofluids 2021, 2021, 1–17. [Google Scholar] [CrossRef]
- Lu, S.; Li, J.; Zhang, P.; Xue, H.; Wang, G.; Zhang, J.; Liu, H.; Li, Z. Classification of microscopic pore-throats and the grading evaluation on shale oil reservoirs. Pet. Explor. Dev. 2018, 45, 452–460. [Google Scholar] [CrossRef]
- Jiang, F.; Zhang, C.; Wang, K.; Zhao, Z.; Zhong, K. Characteristics of micropores, pore throats, and movable fluids in the tight sandstone oil reservoirs of the Yanchang Formation in the southwestern Ordos Basin, China. Aapg. Bull. 2019, 103, 2835–2859. [Google Scholar] [CrossRef]
- Hu, Y. Differential Evolution Mechanism of Pores in Tight Sandstone Reservoirs of Jinci Formation in the Central and Eastern Ordos Basin. Master’s Thesis, China University of Mining and Technology, Xuzhou, China, 2022. [Google Scholar]
- Zhang, J.; Hu, Q.; Chang, X.; Qin, Z.; Zhang, X.; Marsh, S.; Grebby, S.; Agarwal, V. Water Saturation and Distribution Variation in Coal Reservoirs: Intrusion and Drainage Experiments Using One- and Two-Dimensional NMR Techniques. Energy Fuels 2022, 36, 6130–6143. [Google Scholar] [CrossRef]
- Meng, Y.; Li, Z. Experimental study on porosity and permeability of coal under overburden pressure and its stress sensitivity. Coal J. 2015, 40, 154–159. [Google Scholar]
- GB/T 19222-2003; Sampling of Coal Petrology. China National Coal Association: Beijing, China, 2003.
- GB/T18023-2000; Classification of Macrolithotype for Bituminouscoal. China National Coal Association: Beijing, China, 2003.
- GB/T 6948-2008; Method of Determining Microscopically the Reflectance of Vitrinite in Coal. China National Coal Association: Beijing, China, 2003.
- GB/T 212-2008; Proximate Analysis of Coal. China National Coal Association: Beijing, China, 2003.
- Yao, Y.; Liu, D.; Tang, D.; Tang, S.; Huang, W.; Liu, Z.; Che, Y. Fractal characterization of seepage-pores of coals from China: An investigation on permeability of coals. Comput. Geosci. 2009, 35, 1159–1166. [Google Scholar] [CrossRef]
- Li, Z. Evolution of Coal Reservoir Pores and Fractures and Their Influence on Micro Flow of Coalbed Methane; China University of Geosciences (Beijing): Beijing, China, 2018. [Google Scholar]
- He, C.; Liu, W. Research on fractal model and fractal characteristics of coal particle pores. Coal Sci. Technol. 2017, 45, 150–155. [Google Scholar]
- Shao, P.; Wang, X.; Song, Y.; Li, Y. Study on the characteristics of matrix compressibility and its influence factors for different rank coals. J. Nat. Gas Sci. Eng. 2018, 56, 93–106. [Google Scholar] [CrossRef]
- Liu, J.; Jiang, X.; Huang, X.; Wu, S. Morphological characterization of super fine pulverized coal particle. Part 2. AFM investigation of single coal particle. Fuel 2010, 89, 3884–3891. [Google Scholar] [CrossRef]
- Liang, L.X.; Xiong, J.; Liu, X. An investigation of the fractal characteristics of the Upper Ordovician Wufeng Formation shale using nitrogen adsorption analysis. J. Nat. Gas Sci. Eng. 2015, 27, 402–409. [Google Scholar] [CrossRef]
- Lai, J.; Wang, G. Fractal analysis of tight gas sandstones using high-pressure mercury intrusion techniques. J. Nat. Gas Sci. Eng. 2015, 24, 185–196. [Google Scholar] [CrossRef]
- Hu, J.; Tang, S.; Zhang, S. Investigation of pore structure and fractal characteristics of the lower silurian longmaxi shales in western Hunan and Hubei Provinces in China. J. Nat. Gas Sci. Eng. 2016, 28, 522–535. [Google Scholar] [CrossRef]
- Friesen, W.I.; Mikula, R.J. Fractal dimensions of coal particles. J. Colloid Interface Sci. 1987, 120, 263–271. [Google Scholar] [CrossRef]


Disclaimer/Publisher’s Note: The statements, opinions and data contained in all publications are solely those of the individual author(s) and contributor(s) and not of MDPI and/or the editor(s). MDPI and/or the editor(s) disclaim responsibility for any injury to people or property resulting from any ideas, methods, instructions or products referred to in the content. |
© 2025 by the authors. Licensee MDPI, Basel, Switzerland. This article is an open access article distributed under the terms and conditions of the Creative Commons Attribution (CC BY) license (https://creativecommons.org/licenses/by/4.0/).