Abstract
For cold venting processes frequently employed in oil and gas fields, precisely predicting the instantaneous diffusion process of the vented explosive and/or toxic gases is of great importance, which cannot be captured by the Reynolds-averaged Navier–Stokes (RANS) method. In this paper, the large eddy simulation (LES) method is introduced for gas diffusion in an open space, and the diffusion characteristics of the sulfur-containing natural gas in the cold venting process is analyzed numerically. Firstly, a LES solution procedure of compressible gas diffusion is proposed based on the ANSYS Fluent 2022, and the numerical solution is verified using benchmark experiments. Subsequently, a computational model of the sulfur-containing natural gas diffusion process under the influence of a wind field is established, and the effects of wind speed, sulfur content, the venting rate and a downstream obstacle on the natural gas diffusion process are analyzed in detail. The results show that the proposed LES with the DSM sub-grid model is able to capture the transient diffusion process of heavy and light gases released in turbulent wind flow; the ratio between the venting rate and wind speed has a decisive influence on the gas diffusion process: a large venting rate increases the vertical diffusion distance and makes the gas cloud fluctuate more, while a large wind speed decreases the vertical width and stabilizes the gas cloud; for an obstacle located closely downstream, the venting pipe makes the vented gas gather on the windward side and move toward the ground, increasing the risk of ignition and poisoning near the ground. The LES solution procedure provides a more powerful tool for simulating the cold venting process of natural gas, and the results obtained could provide a theoretical basis for the safety evaluation and process optimization of sulfur-containing natural gas venting.
1. Introduction
The venting flare is an important safety device in oil and gas gathering, transportation and storage systems, which can be applied to burn combustible gases that cannot be processed or recovered completely by hot venting or to relieve pressure and discharge residual gases from reservoirs, tanks or pipelines during an emergency by cold venting. For cold venting, the discharged gas is flammable and explosive, containing strongly toxic hydrogen sulfide natural gas. For hot venting, there are extra carbon dioxide, sulfur dioxide and other acidic gases. Therefore, it is of great significance to study the diffusion features of venting gas for the purposes of safe production and environment protection.
Studies on heavy gas diffusion date back to the middle of the last century. During early studies, many field measurement experiments were carried out. The Lawrence Livermore National Laboratory (LLNL) of the United States conducted the Burro Coyote experiments [1,2] in China Lake, which released liquid natural gas (LNG) on the lake surface and investigated its evaporation and diffusion process. The National Oceanography Institute of the United Kingdom [3] carried out the Maplin Sands experiments, which studied the diffusion processes of LNG and liquid petroleum gas (LPG) on the sea under continuous and intermittent release conditions. The Health and Safety Executive of the United States organized the Heavy Gas Dispersion Trials (HGDT) project which consisted of an extensive program of field trials on the dispersion of heavy gas clouds at ground level in the atmosphere [4,5,6] to provide reliable data at a large scale, enabling the testing of the validity of mathematical and physical models. Subsequently, indoor wind tunnel experiments were developed rapidly. Krogstad and Pettersen [7] investigated the evolution of a heavy gas cloud from hemispherical continuous release conditions by wind tunnel experiments. Huber and Snyder [8] investigated the influence of the highly turbulent region found in the lee of a model building upon plumes emitted from short stacks through smoke visualization and tracer gas concentration mappings in a wind tunnel. In the work by Neff [9], the dispersion of LNG during the heavier-than-air phase was approximated by means of isothermal-model plumes produced by high-molecular-weight gases in wind tunnel experiments. Havens et al. [10] studied the two-dimensional sources of carbon dioxide dispersing over two types of uniformly spaced obstacles.
More recently, computational fluid dynamics (CFD) methods have been used widely for gas diffusion analysis due to the rapid developments of numerical algorithms and the capacity of computers. Almanza et al. [11] simulated the plume emitted by flaring activities of the Miguel Hidalgo Refinery in Mexico to estimate the emission rates of combustion by-products of interest for air quality analysis: acetylene, ethylene, nitrogen oxides, carbon monoxide, soot and sulfur dioxide. Nourbakhsh et al. [12] employed a CFD method to study the dispersion of gaseous pollutants from stacks and flares of gas refineries in the South Pars Gas Complex located in Iran. Wang et al. [13] combined CFD models with the soot combustion mechanism to simulate the flaring events with soot emission. Juliane et al. [14] developed a computational tool for handling the gas dispersion of heavy gases, such an LNG and CO2, based on the OpenFOAM (Open Field Operation and Manipulation) CFD code. Simon et al. [15] discussed the challenges associated with using CFD modeling of atmospheric dispersion of toxic or flammable gases for land use planning around major hazard sites in Great Britain and informed the decision on whether or not to accept the use of CFD modelling and help prioritize future research activities. Teng et al. [16] established a three-dimensional two-phase CFD model to evaluate cold CO2 dispersion by considering the phase change of water. I and Cheng [17] employed the CFD method to study the dispersion and explosion processes of a leaked LPG tank. Cao et al. [18] conducted a numerical simulation on pipeline CO2 leakage and diffusion on offshore platforms. Li et al. [19] conducted CFD analysis on the leakage, dispersion and explosion of LPG in a kitchen. Luo et al. [20] studied numerically the multiphase jet dispersion and sublimation cooling characteristics during the accidental release of the liquid CO2 pipeline. Zhang et al. [21] carried out experiments and a numerical simulation on the leakage process of buried dense phase CO2 pipeline leakage and studied the near-field temperature in the soil and the CO2 concentrations on the surface.
In previous studies, the Reynolds-averaged Navier–Stokes (RANS) method with turbulence models is mostly used to solve the turbulent flow field [11,12,13,14,15,16,17,18,19,20,21], which has the advantages of a smaller computational cost and a shorter calculating time. However, the RANS method only provide the time-averaged flow parameters which cannot precisely solve the transient flow and gas diffusion process. Comparatively, the large eddy simulation (LES) method is able to solve the large-scale turbulent vortex structure, the unsteady features of flow field and the transient gas transport and dissipation process. By the LES method, the diffusion features of the vented natural gas could be revealed more comprehensively and accurately. To the best of our knowledge, however, little work has been performed on this subject.
In this paper, the LES method of high accuracy is applied to study the diffusion feature of the cold-vented natural gas containing sulfur. The rest of this paper is set as follows: Section 2 presents the governing equations of LES for high-speed gas flow and mixtures, along with the solution procedure based on the ANSYS FLUENT 2022. In Section 3, the proposed LES method is validated with respect to a benchmark heavy gas diffusion model having experimental data. Subsequently, Section 4 studies in detail the effect of wind speed, content, venting rate and obstacles on the diffusion process of natural gas containing sulfur by LES. Finally, Section 5 draws some major conclusions. Compared with the previous numerical studies using the RANS method, the LES solution procedure proposed here is of higher accuracy and is able to capture the transient transportation process of the cold-vented natural gas containing sulfur, providing a powerful tool and a deeper insight on the safety evaluation of the cold venting processes used widely in oil and gas gathering, transportation and storage systems.
2. Governing Equations and the Numerical Method
Under a large pressure drop, the gas flow from the cold-vented pipe is usually subsonic or sonic, which is of significant compressibility and turbulence. To describe this high-speed flow process in the LES framework, the filtered compressible continuity equation and Navier–Stokes equations [22] are taken as the governing equation, which can be expressed as
where the overlines of “” and “” denote the filtered variables of LES; the subscripts of i and j can be set as 1~3 to represent the three cartesian coordinate directions, respectively. In Equations (1) and (2), , , and can be calculated by
where the subscript “SGS” represents the sub-grid model parameters.
The natural gas released from the outlet of the vent pipe will spread to the surrounding atmosphere and mix with the air. To capture this process, the filtered gas transportation and diffusion equation [23,24] following the LES method is introduced as
The CFD software of ANSYS FLUENT 2022 is employed to solve the above equations [25]. The SGS model DSM is selected to adjust the model coefficients in the solution computation by introducing the local information of the turbulent structure into the sub-lattice stresses through multiple filtering. The three-dimensional double-precision pressure solver is used to discretize the governing equations, while the PISO algorithm is employed to couple the pressure and velocity. For spatial discretization, the gradient and pressure terms are discretized by the least-squares cell-based and standard formats, respectively. The momentum equation is discretized by the bounded central differencing format. The gas convection and diffusion terms are discretized by the second-order upwind scheme, and the transient terms are solved by the bounded second-order implicit format.
3. Validation of the LES Method
The 26th experiment of the series of Thorney Island heavy gas diffusion experiments [4,5,6] is employed to examine the accuracy and stability of the LES method in gas transportation and diffusion. In the 26th experiment, a gas mixture consisting of 68.4% nitrogen and 31.6% freon was packed in a cylindrical container with a diameter of 14 m and a height of 13 m. A 9 m × 9 m × 9 m cubic obstacle was placed 50 m downstream the center of the cylindrical container, with monitoring points set up at 6.4 m and 0.4 m on the windward and leeward sides of the obstacle, respectively. At a certain moment, the cylindrical container was removed, and the gas mixture diffused under the natural wind field. Subsequently, the concentration values at the monitoring points were measured at different moments.
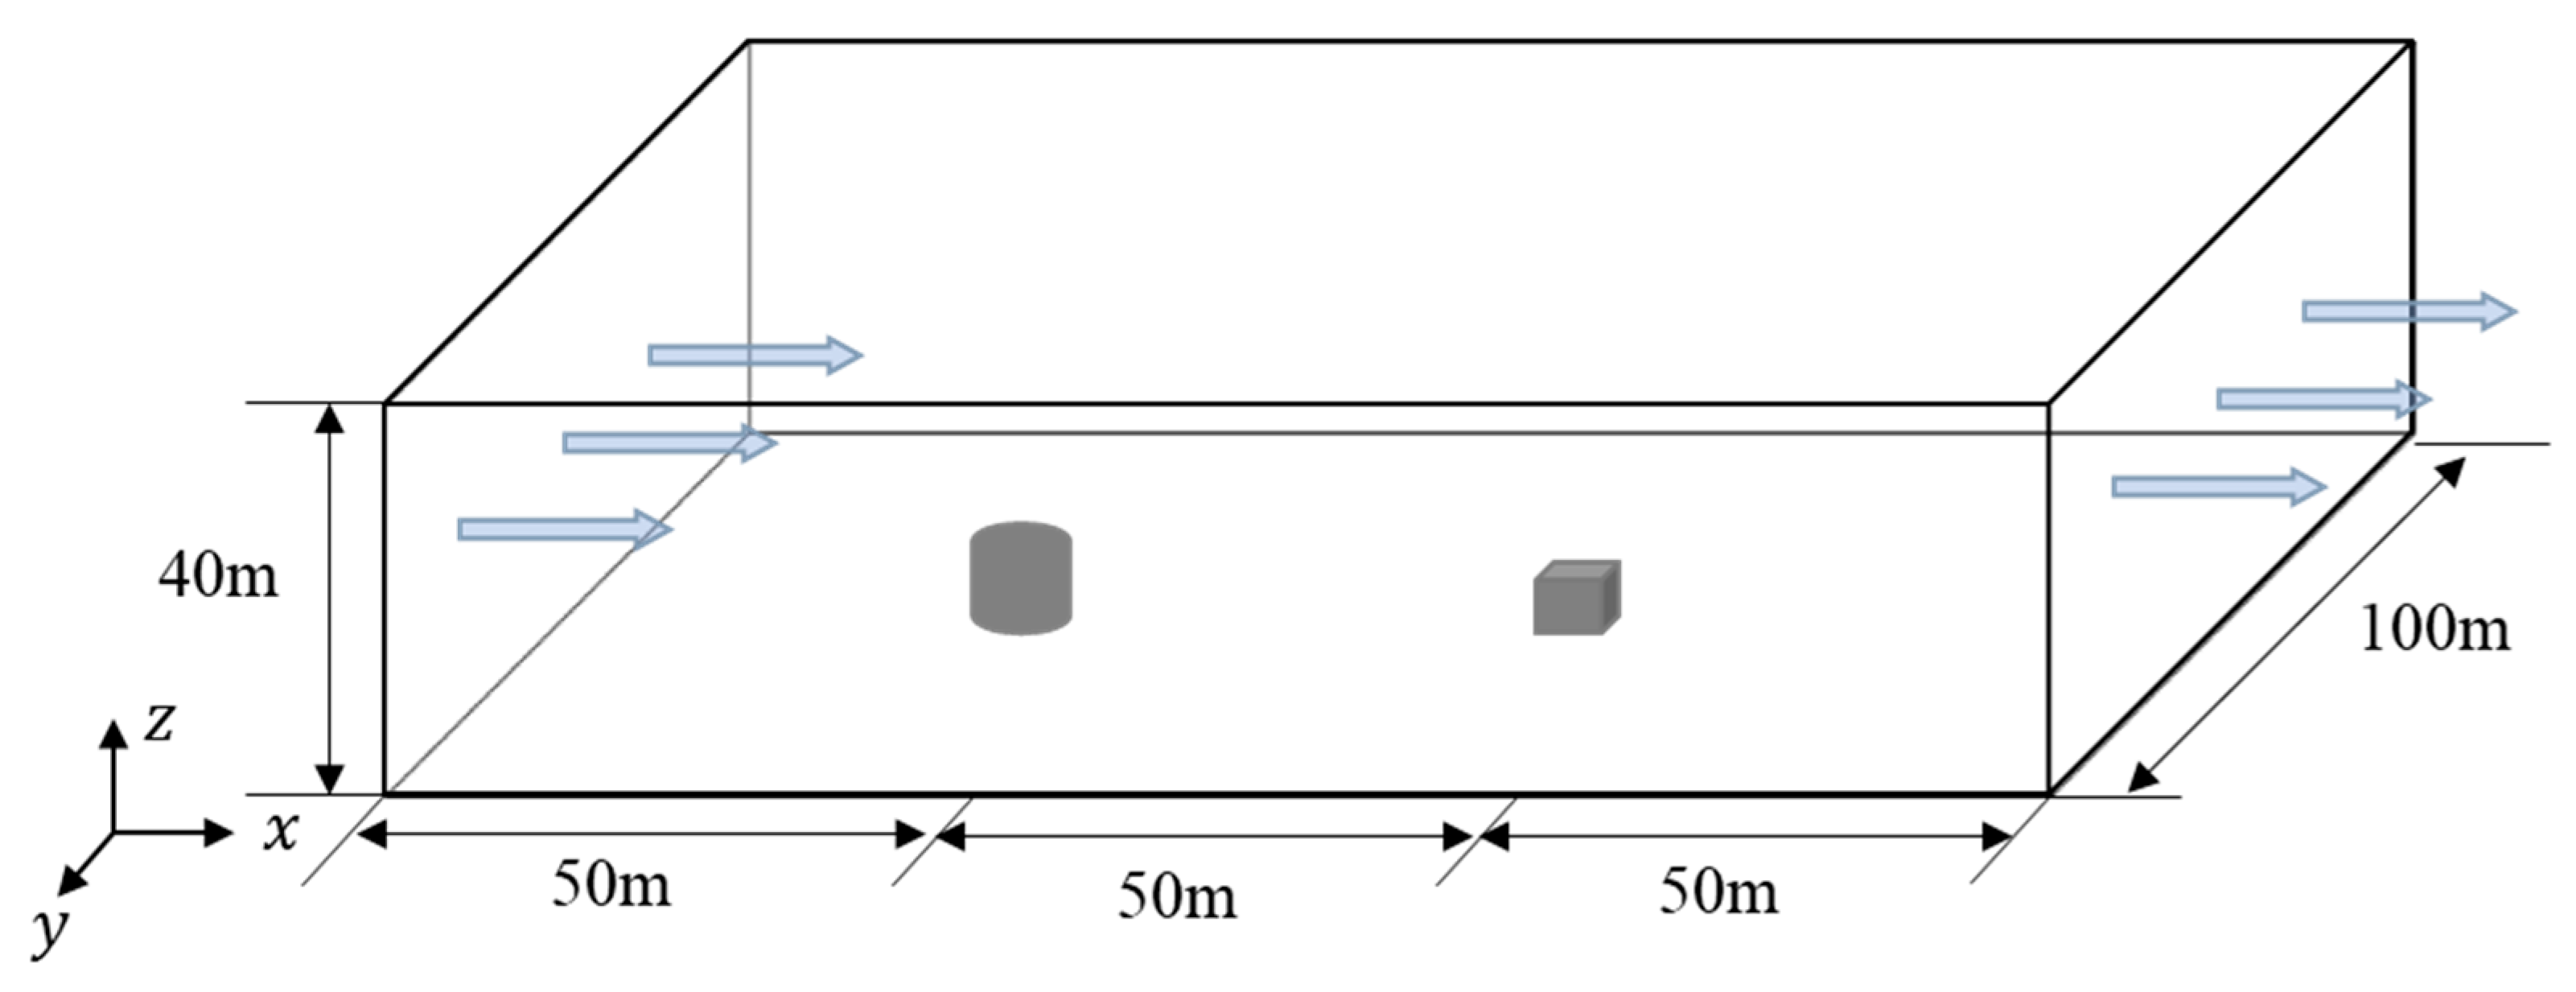
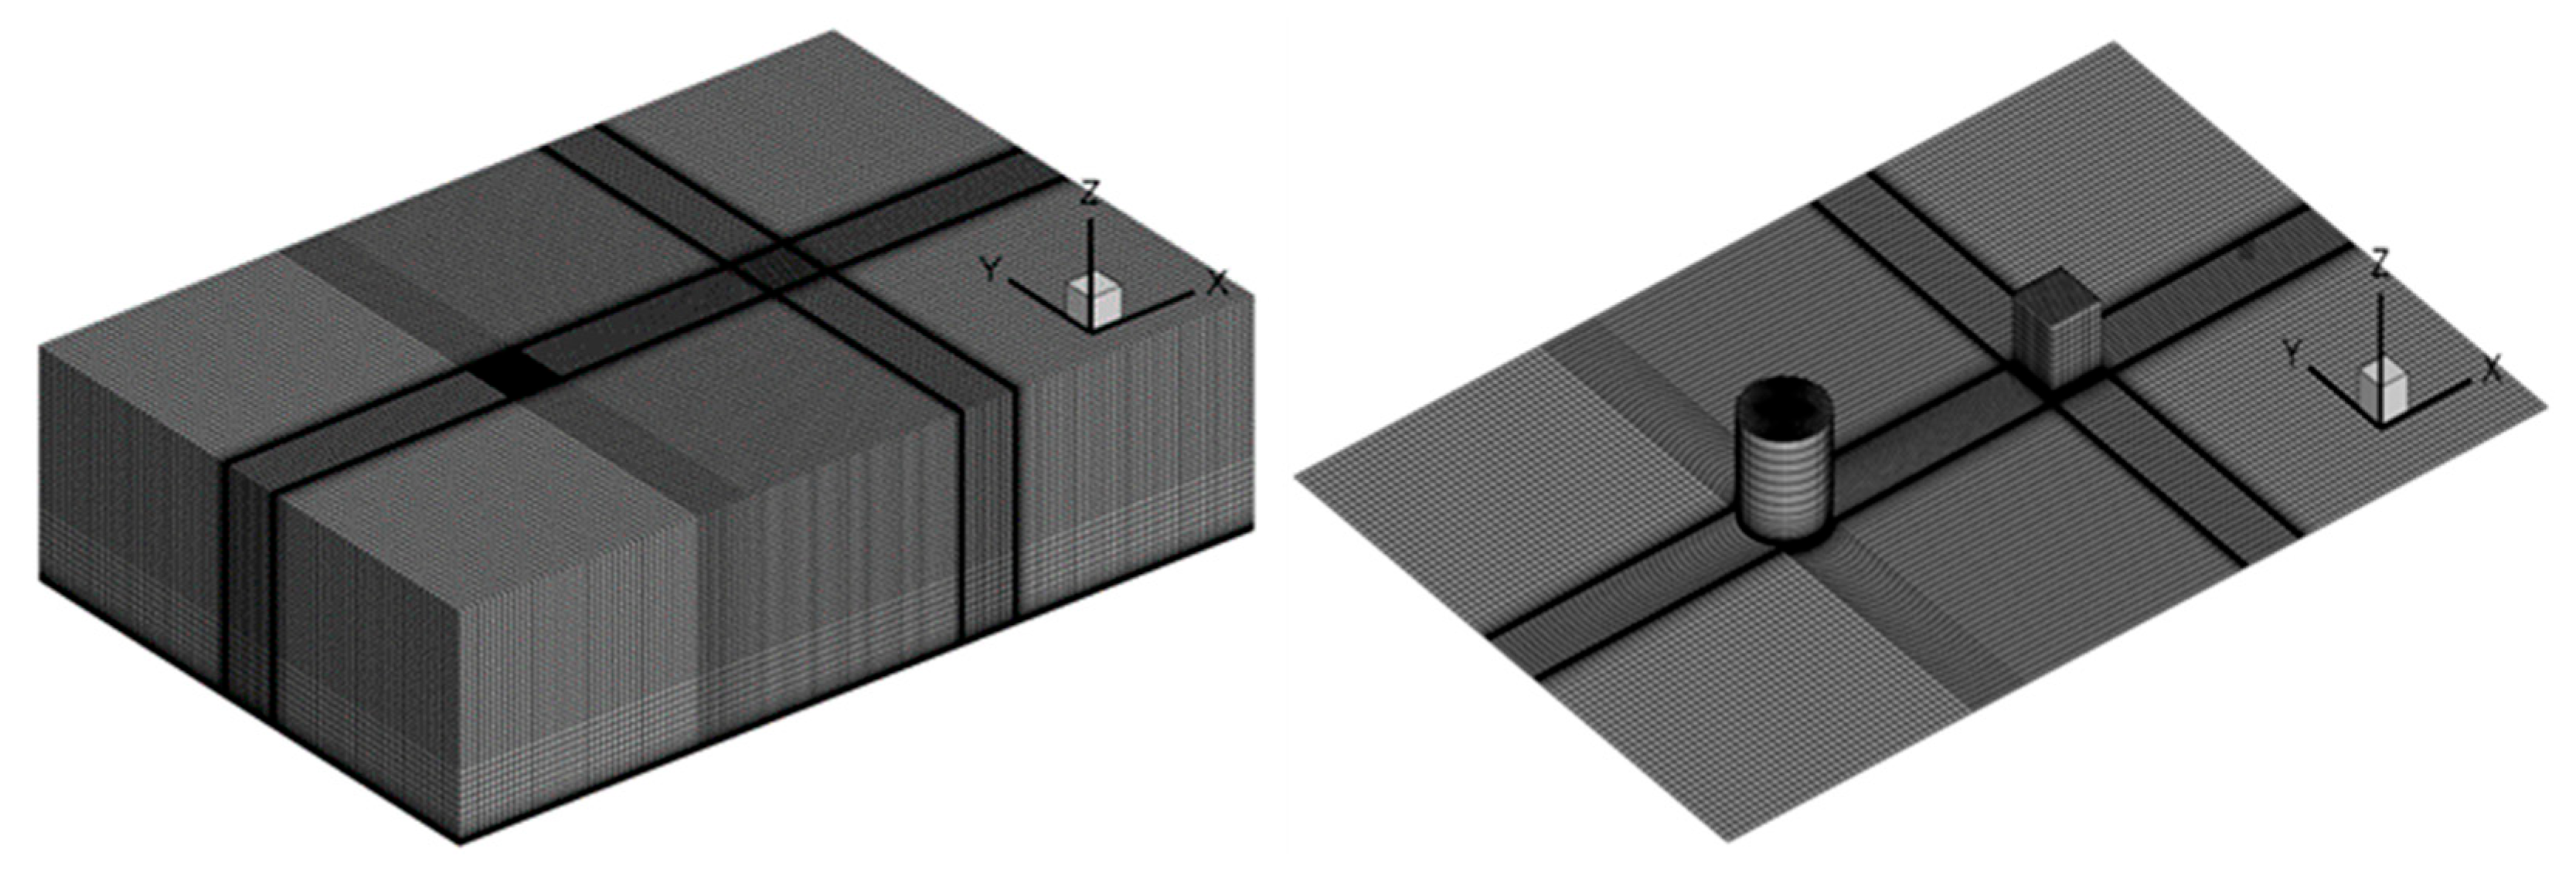
As seen in Figure 1, a 1:1 computational model is established following the 26th experiment, and the size of the computational domain is set as 150 m × 100 m × 40 m, with the cylindrical gas source located at the coordinate origin (0, 0, 0) and the cubic obstacle at (50, 0, 0). As seen in Figure 2, the domain is divided by hexahedral-structured meshes with 2619358 nodes, which were determined by the grid-independence test. The exponential velocity distribution is set at the inlet as

Figure 1.
Computational model for heavy gas diffusion experiments [4,5,6].
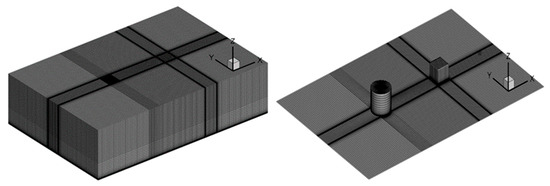
Figure 2.
Computational mesh for heavy gas diffusion experiments.
The pressure boundary condition is applied to the outlet, and the symmetric boundary condition is imposed on both sides of the flow field. The top boundary uses the pressure outlet boundary condition, while the bottom wall and obstacle use the no-slip boundary condition.
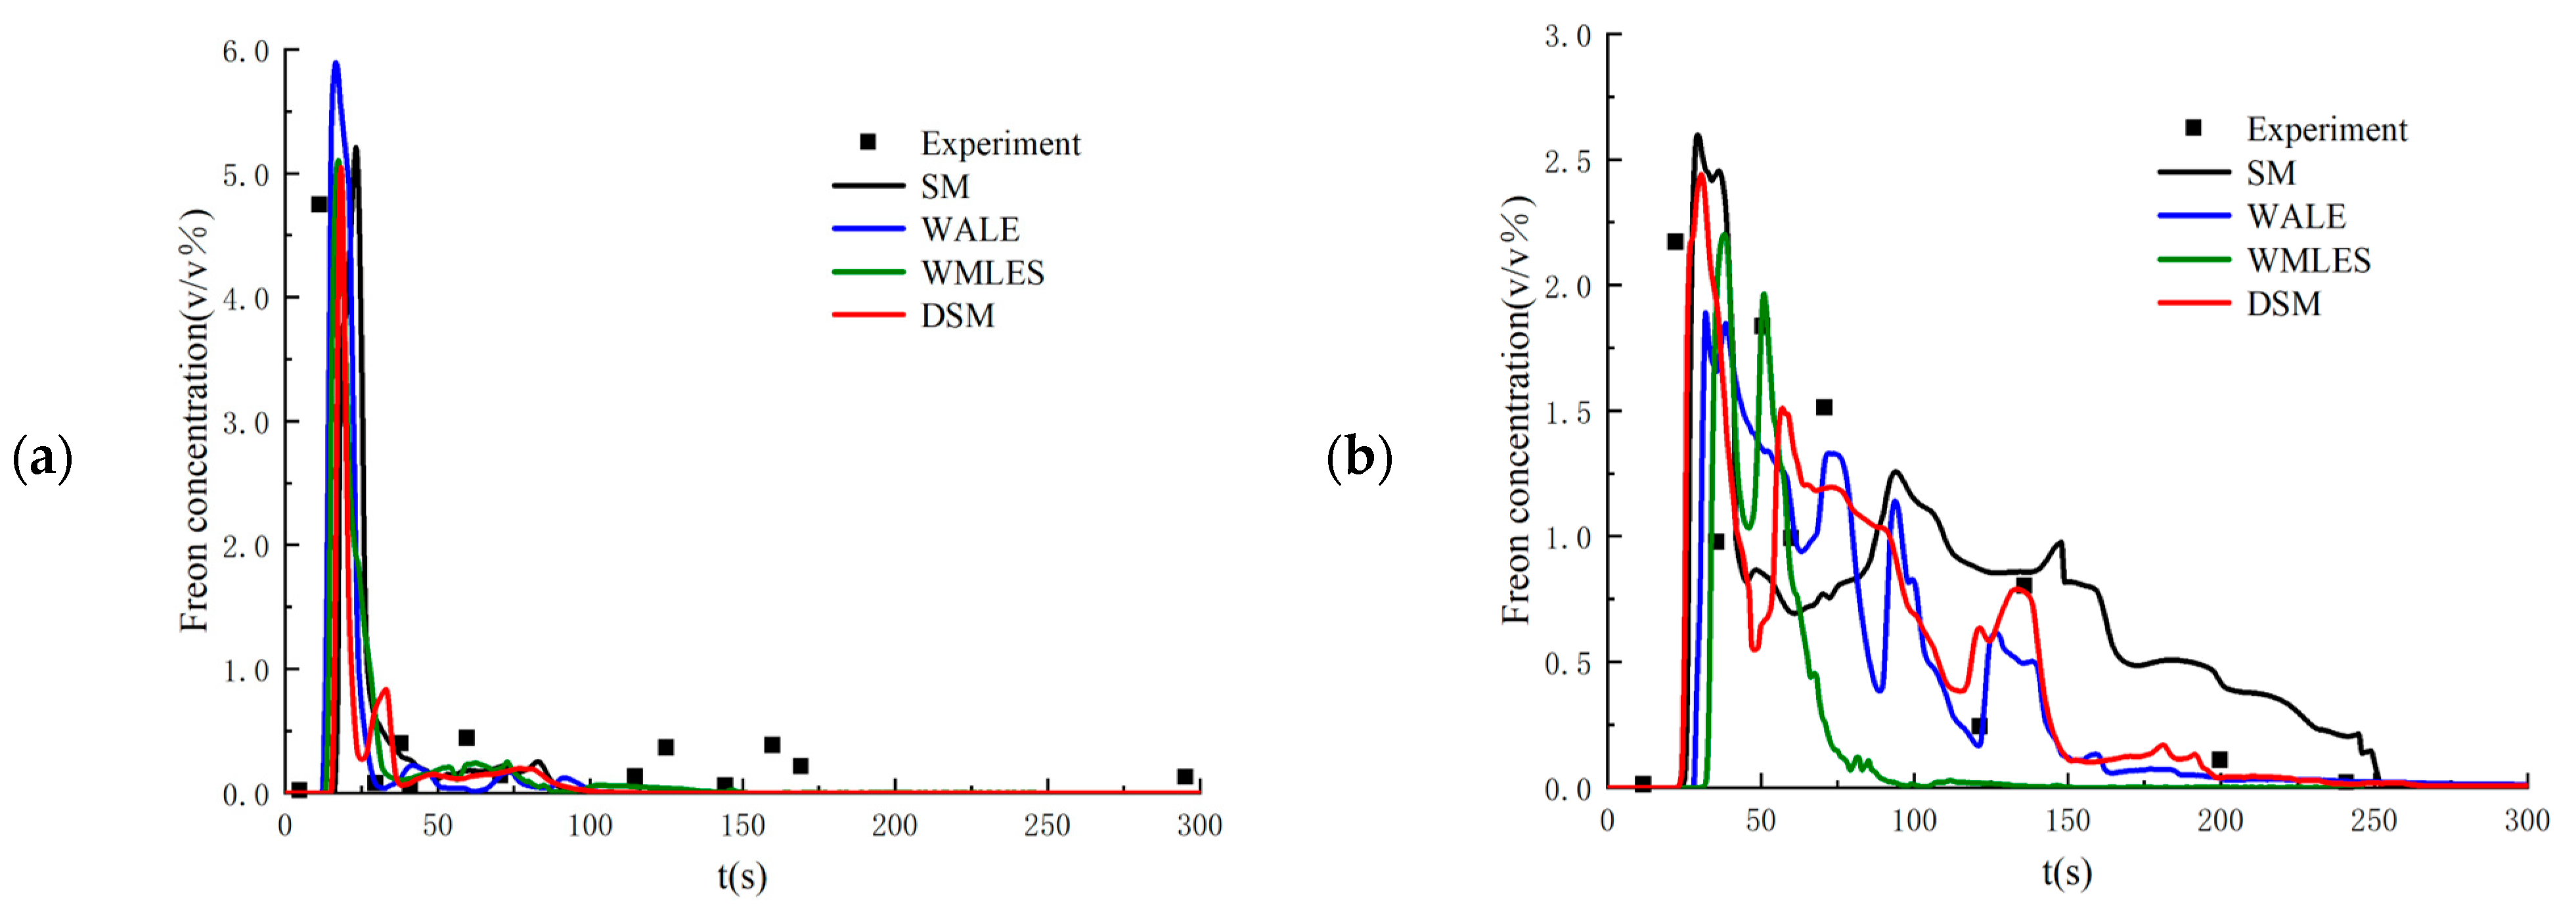
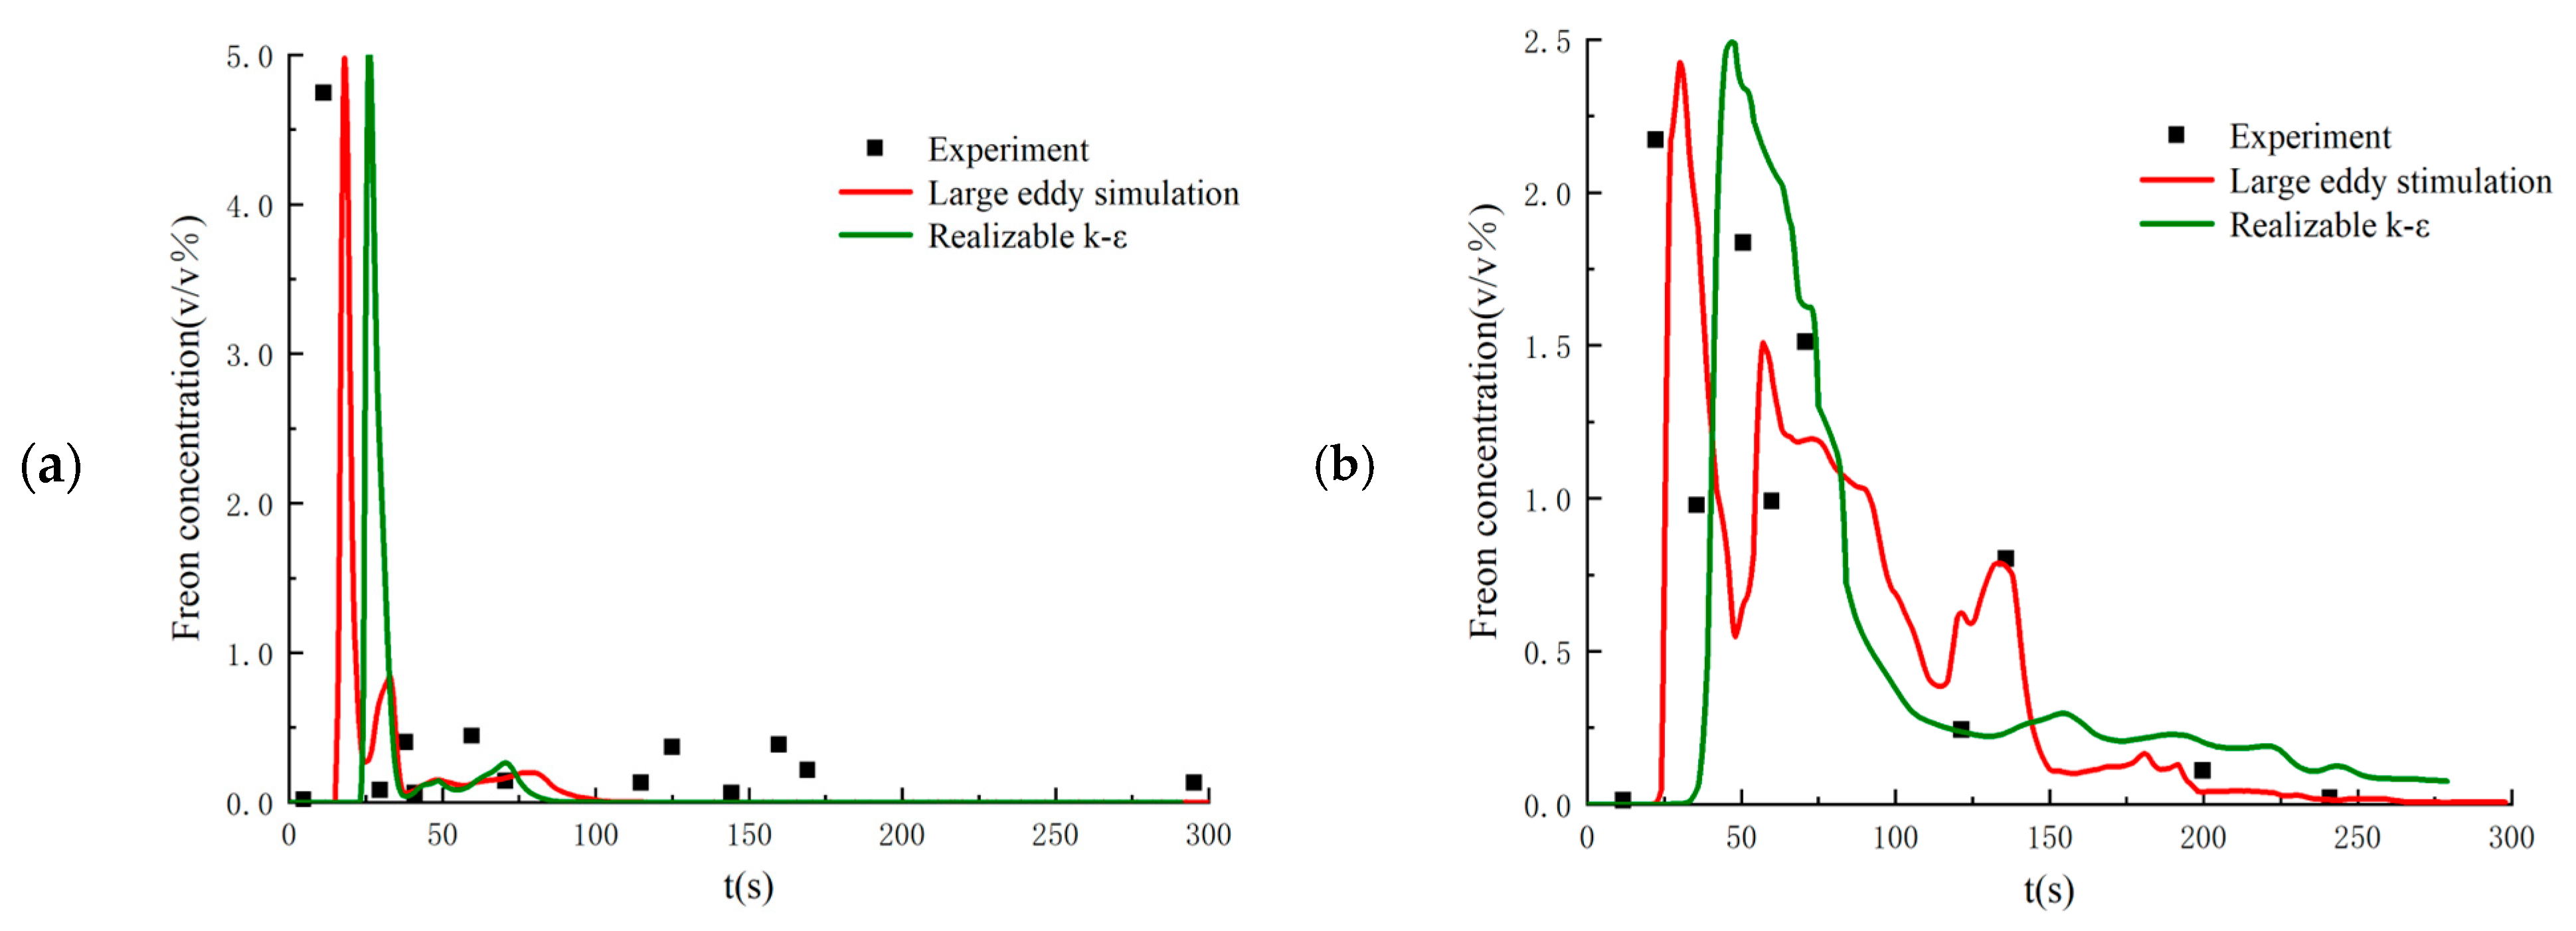
Setting the flow parameters as equal to those in the 26th experiment, the proposed LES method is validated by comparing the calculated results with the experimental data. Figure 3 shows the time history of Freon concentrations on the windward and leeward sides of the obstacle. As seen in the figure, the numerical results from the LES method have very good agreement with the experimental data. In addition, the DSM model shows better performance than other SGS filtering models. Figure 4 compares the numerical results from the LES method with the DSM SGS filtering model with those obtained from the RANS method with the realizable k-ε turbulence model. As seen in the figure, the instantaneous Freon concentriations obtained from the LES method have much better agreement.
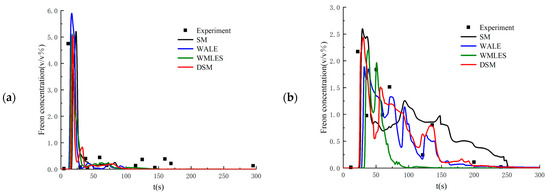
Figure 3.
Time histories of Freon concentrations at the monitored points computed from different SGS models: (a) windward side point of the obstacle; (b) leeside point of the obstacle.
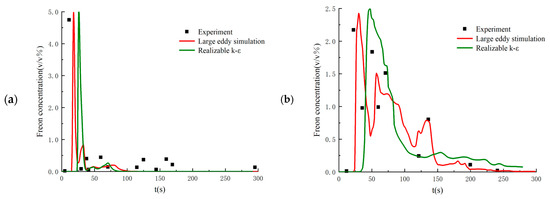
Figure 4.
Comparison between the numerical results from LES and RANS at (a) the windward side point of the obstacle and (b) the leeside point of the obstacle.
4. Diffusion Features of Cold-Vented Natural Gas Containing Sulfur
4.1. Computational Model
Figure 5 shows the computational model and mesh for the cold-vented process of natural gas containing sulfur. As seen in Figure 5a, the height and diameter of the cold-vented pipe are taken as 20 m and 300 mm, respectively, and the straight pipe without a rounded outlet or diffuser is set according to the cold-vented pipelines used in the natural gas gathering and process systems in China. The flow domain is set as 130 m × 100 m × 120 m, with the vent pipe at the origin of the coordinates. The inlet, outlet and two sides of the flow field are 30 m upstream, 100 m downstream, and 50 m away from the vent pipe, respectively. The top boundary is 100 m over the vent pipe. At the outlet of the vent pipe, a velocity condition is applied. In the scenario considering the effect of obstacles, a 10 m × 5 m × 80 m rectangular obstacle is set downstream of the vent pipe. As seen in Figure 5b, a hexahedral mesh of high quality is employed to divide the computational domain. The grid nodes of the computational model with and without the downstream obstacle are 2,265,451 and 2,958,457, respectively. During computation, the gravitational acceleration of −9.81 m/s2 is set along the z-direction, and the reference pressure and temperature are set as 101,325 Pa and 300 K, respectively. For this model, the gas mixture consists of air, methane and hydrogen sulfide, without the chemical reaction.
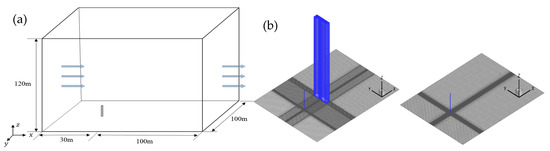
Figure 5.
Computational model for cold-vented natural gas containing H2S: (a) solution domain; (b) computational mesh with/without the obstacle.
4.2. Effect of Wind Speed
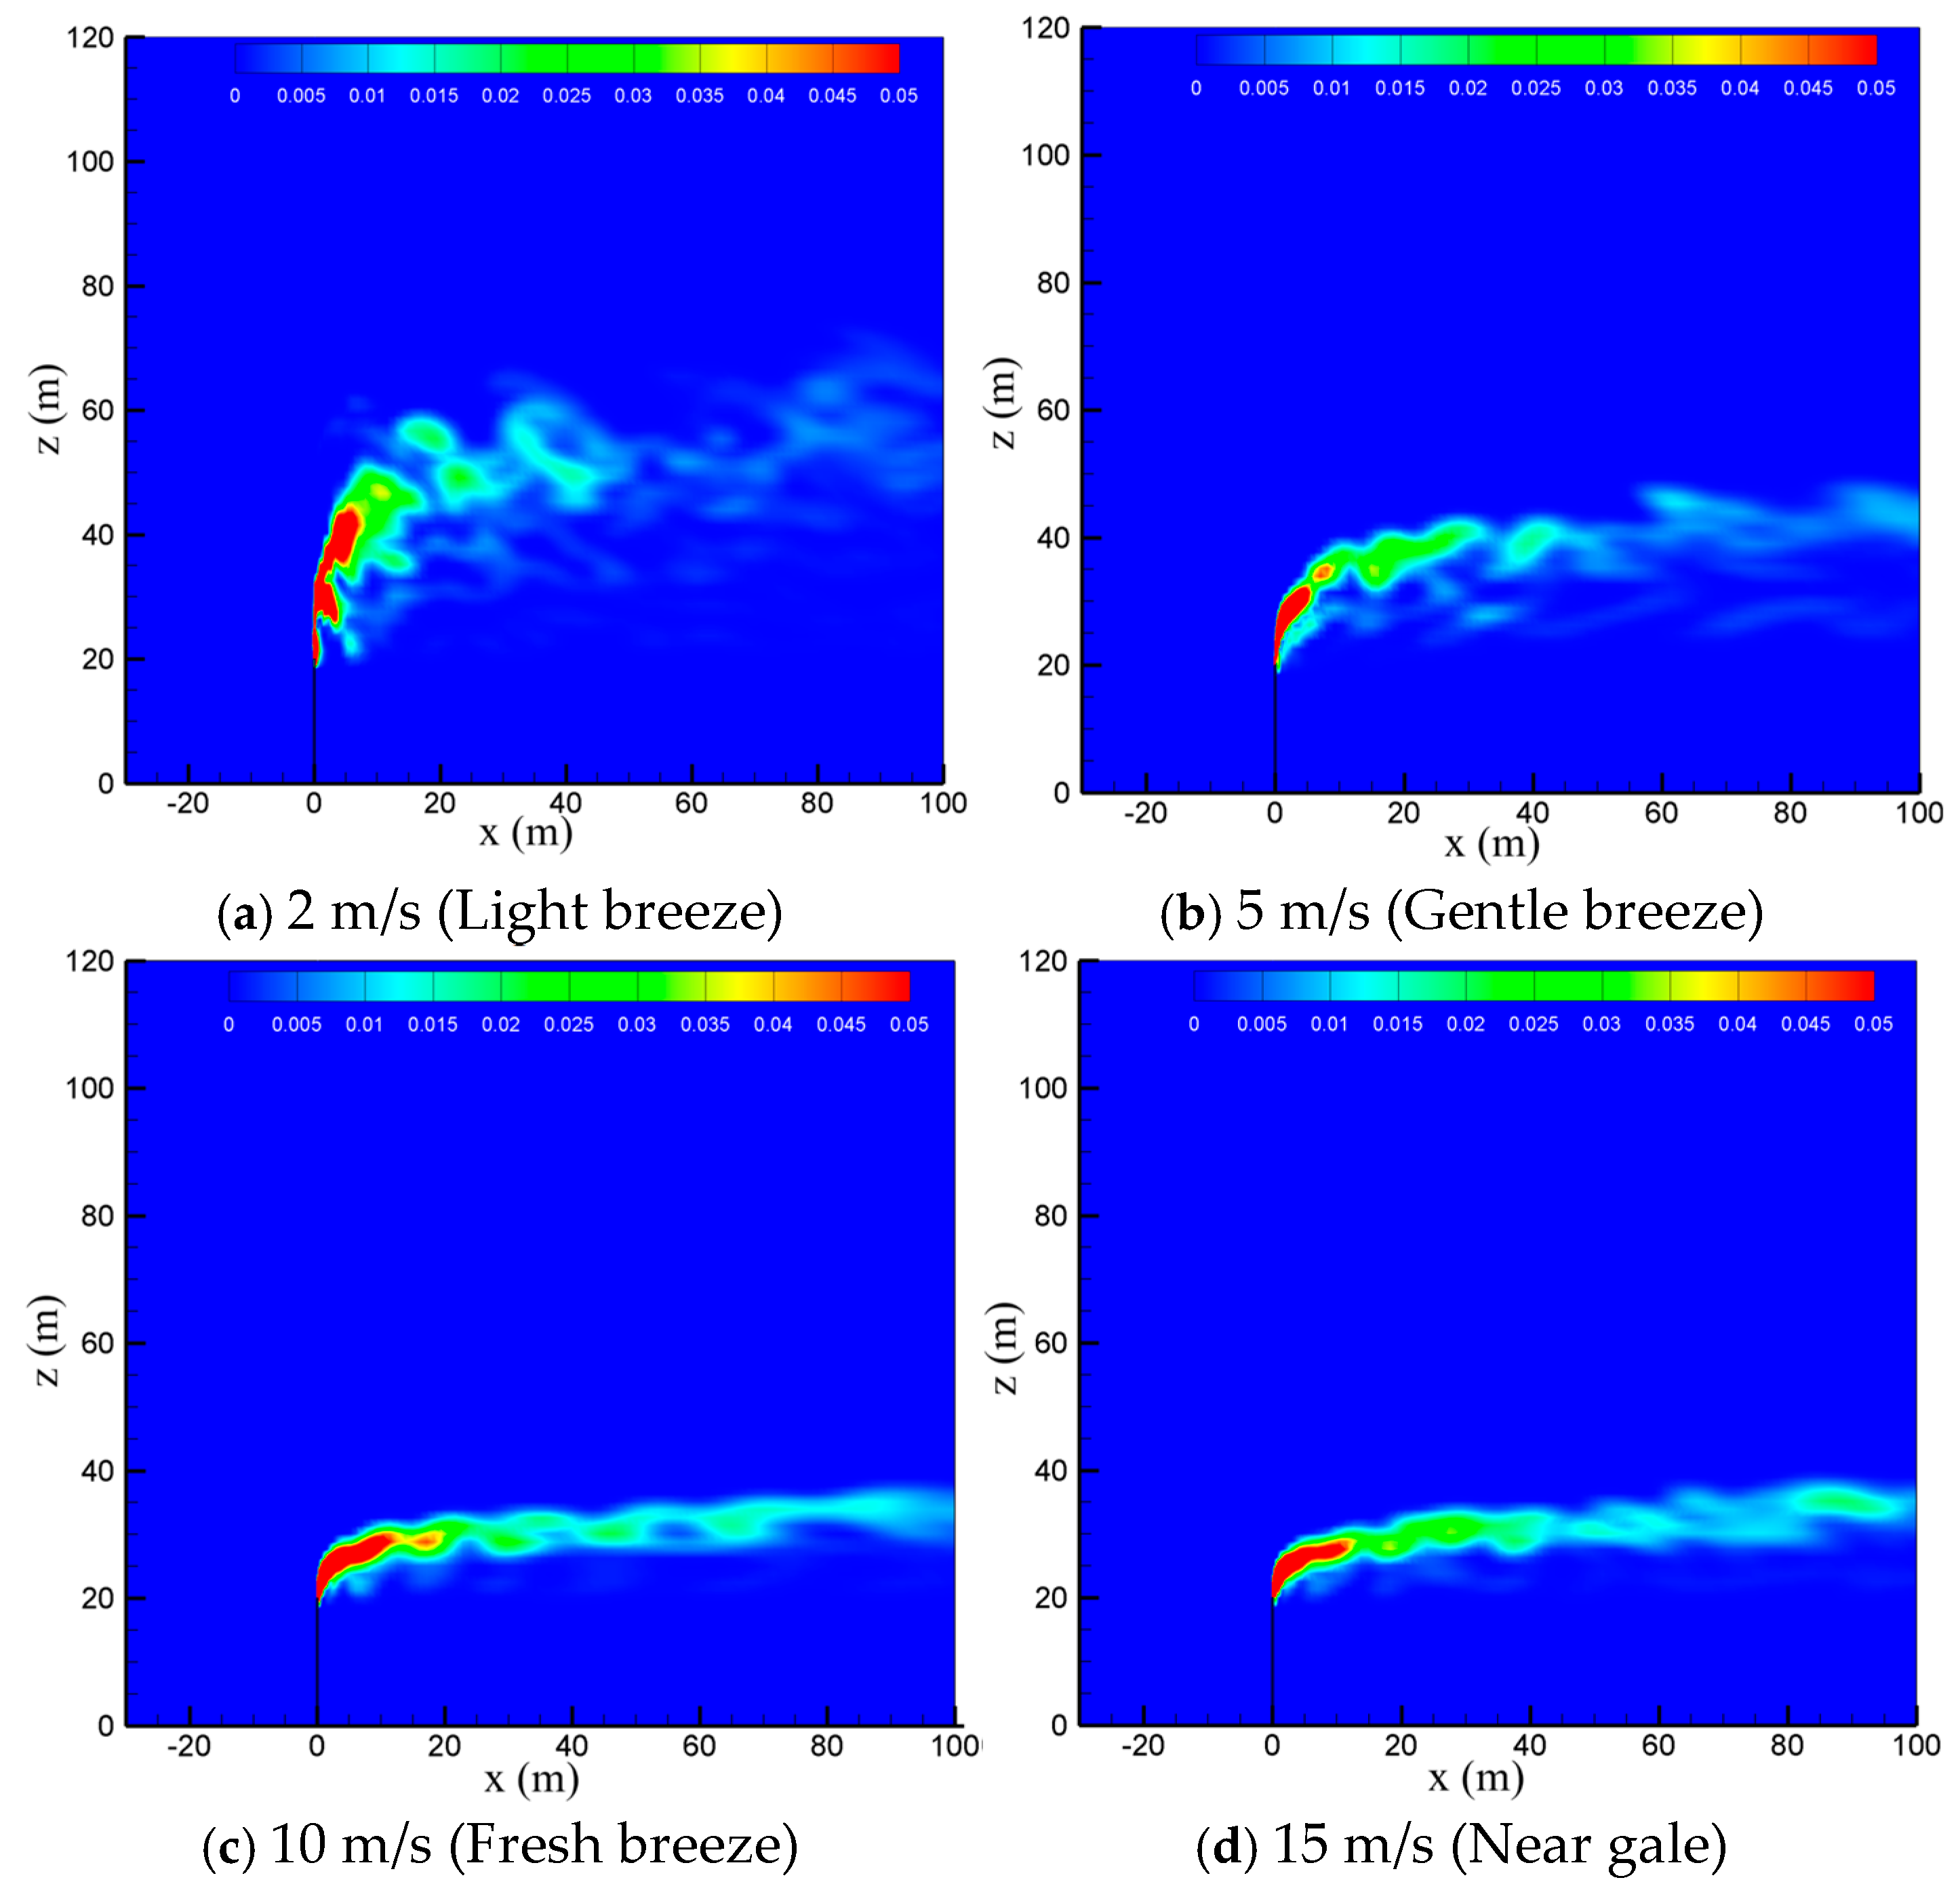
To study the effect of natural wind on the diffusion of vented sulfur-bearing natural gas, four wind speeds of 2 m/s, 5 m/s, 10 m/s and 15 m/s are considered, which correspond to the light breeze, gentle breeze, fresh breeze and near gale wind scales, respectively, with the sulfur content and the venting rate of natural gas fixed at 200 ppm and 200 m/s. Figure 6 presents the methane concentration contour maps in the x-z-plane at four wind speeds. As seen in the figure, the convective effect of the wind is enhanced as the wind speed increases, and thus the high-concentration methane zone is gradually reduced and deflected to the flow direction. In addition, strong wind can suppress the turbulent pulsation of the jet. As a result, the diffusion path of the gas becomes regular and extends to a farther distance at larger wind speeds. Figure 7 shows the concentration contour of hydrogen sulfide. As seen in the figure, the diffusion of hydrogen sulfide exhibits a similar trend with methane as the wind speed is increased. The shrinking of the diffusion area of the vented gas at high wind speeds could be understood by comparing the momentums of the vented gas and the wind. Considering that the discharge velocity at the outlet of the venting pipe is as high as 200 m/s, the convection effect dominates the cold-vented processes. At a small wind speed, the vented gas has a much larger momentum than that of the wind, and thus the vented gas flow is able to “penetrate” the air flow, resulting in a large vertical convection distance of up to 30 m at 2 m/s. As the wind speed increases, the ratio between the momentum of the vented gas flow and wind flow drops, and the vertical transportation distances of CH4 and H2S decrease below 10 m at 15 m/s.
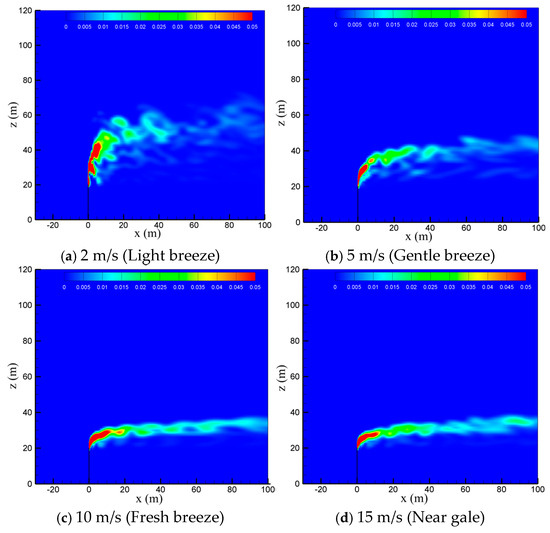
Figure 6.
Concentration contours of CH4 in the x-z-plane at different wind speeds.
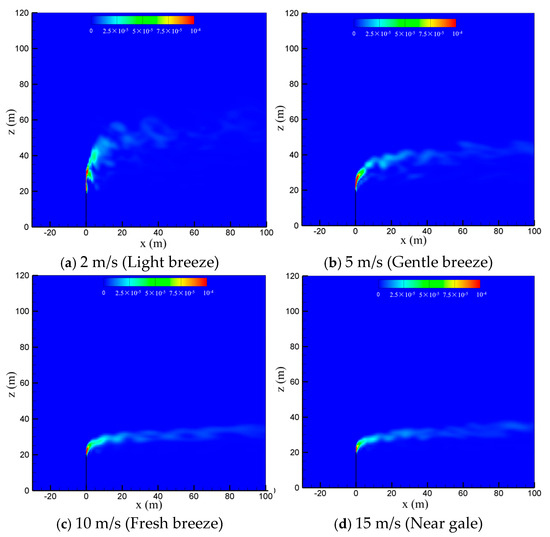
Figure 7.
Concentration contours of H2S in the x-z-plane at different wind speeds.
4.3. Effect of Sulfur Content
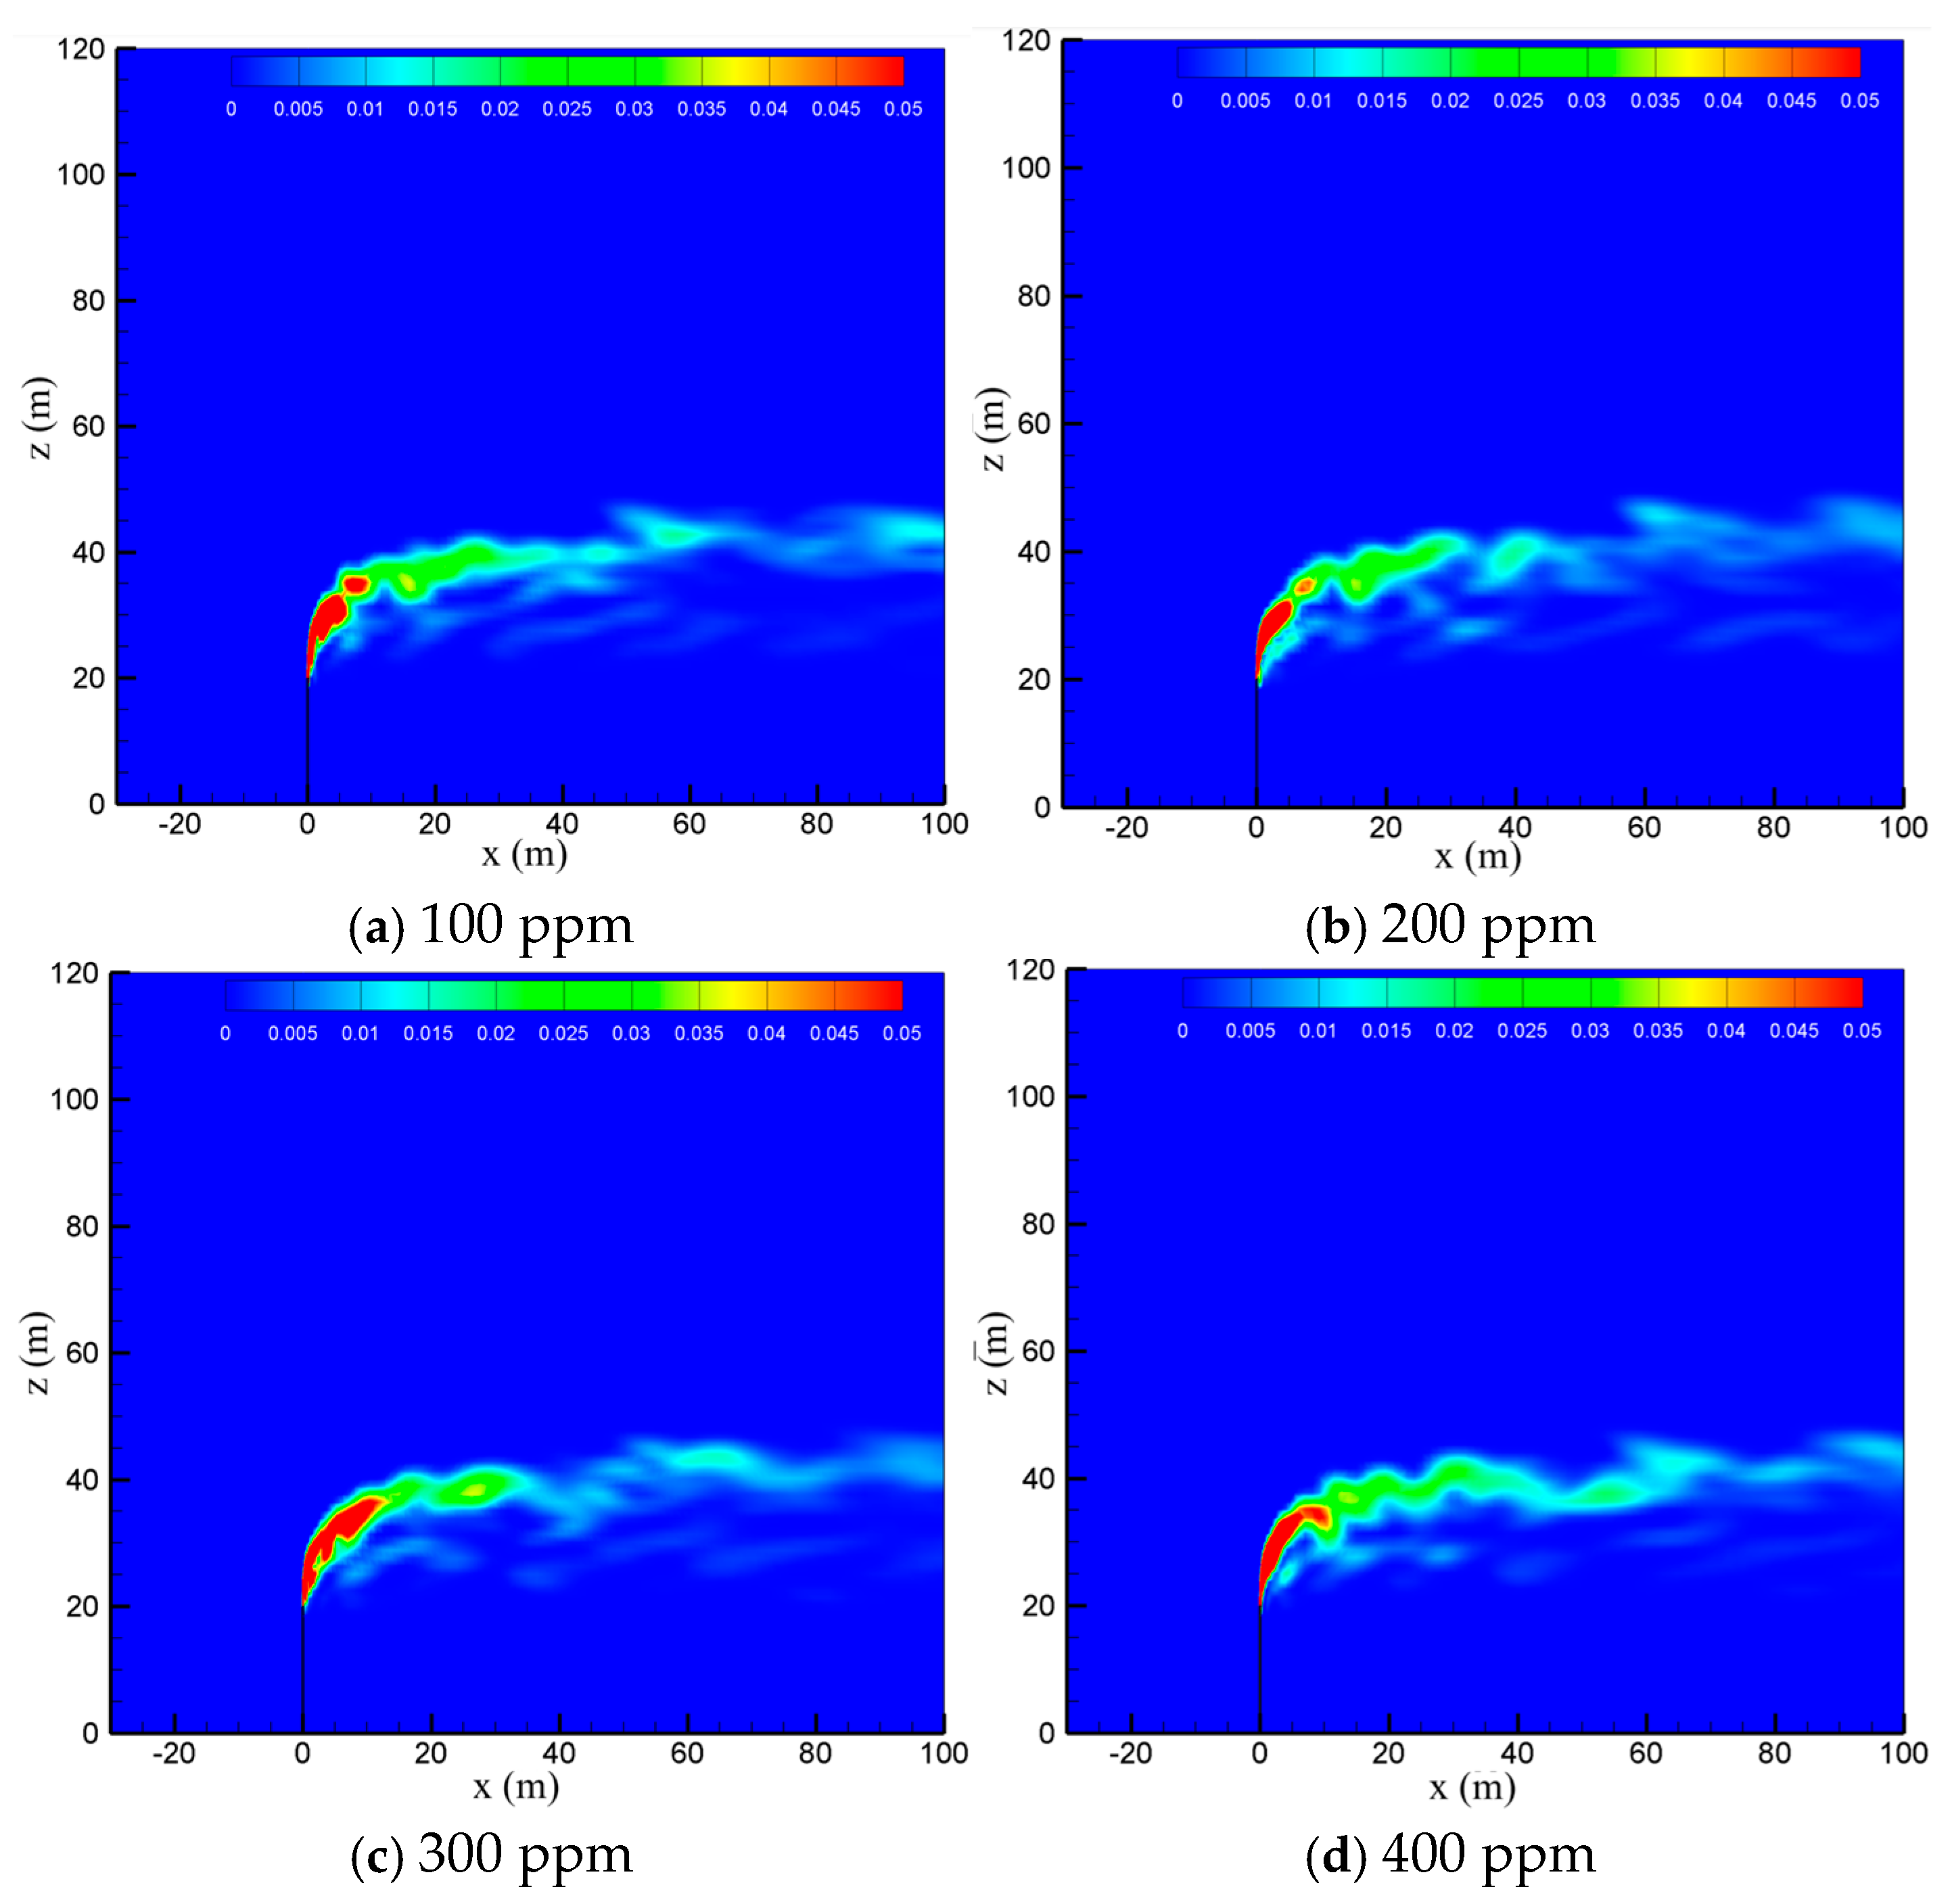
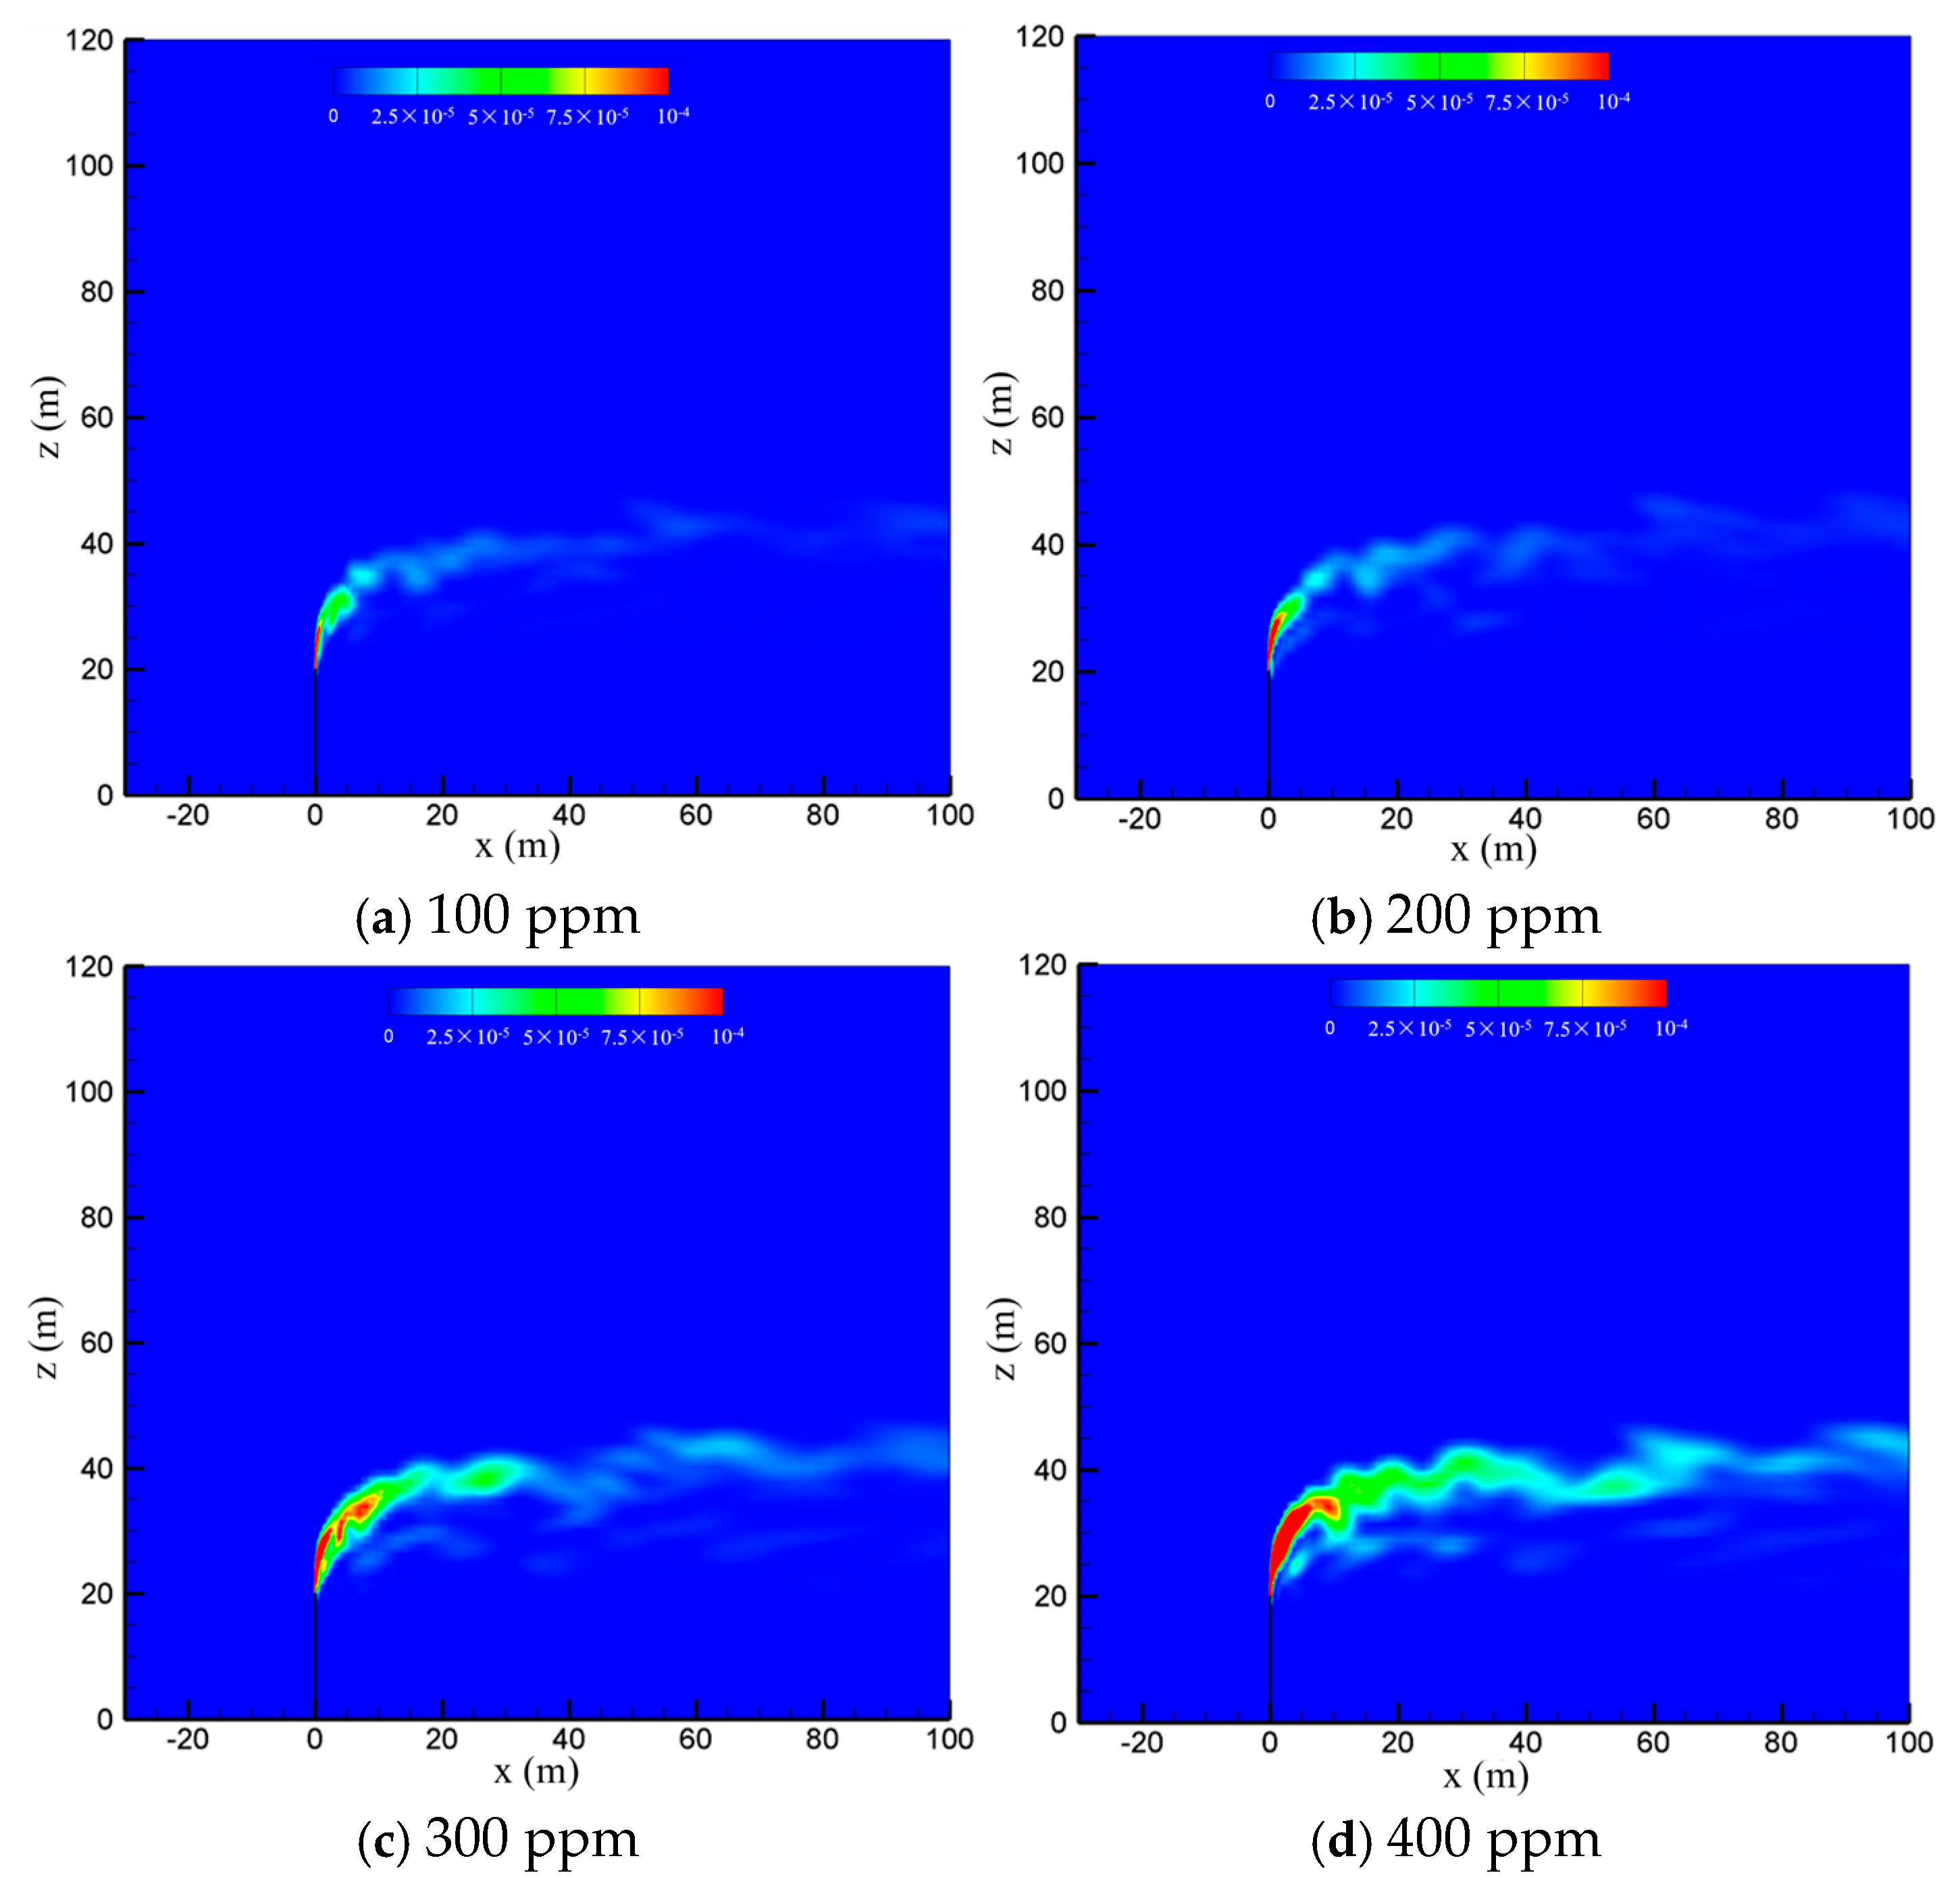
To examine the effect of sulfur content, the diffusion process of the cold-vented natural gas at hydrogen sulfide concentrations of 100 ppm, 200 ppm, 300 ppm and 400 ppm is studied, with the ambient wind speed fixed at 5 m/s and the gas venting rate fixed at 200 m/s. As seen in Figure 8, varying the content of hydrogen sulfide in the 100 ppm~400 ppm range shows little effect on the diffusion and convection process of methane. Figure 9 shows the hydrogen sulfide concentrations at different sulfur concentrations. In order to clearly show the area with poisoning risk, the maximum value of the contour in Figure 9 is set as 100 ppm, which can threaten human life and health. As seen in the figure, as expected, the diffusion area of hydrogen sulfide amplifies significantly as the sulfur content increases. Moreover, at the wind speed of 5 m/s, the region with a concentration of hydrogen sulfide higher than 100 ppm is always above the vent pipe outlet, and an accumulation of hydrogen sulfide near the ground wall is not observed.
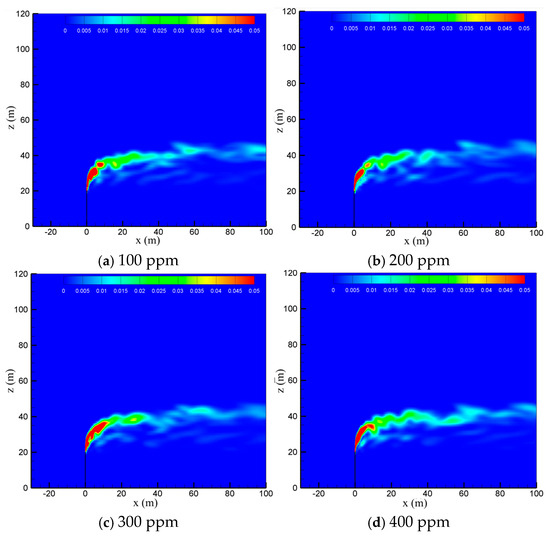
Figure 8.
Concentration contours of CH4 in the x-z-plane at different sulfur concentrations.

Figure 9.
Concentration contours of H2S in the x-z-plane at different sulfur concentrations.
4.4. Effect of the Venting Rate
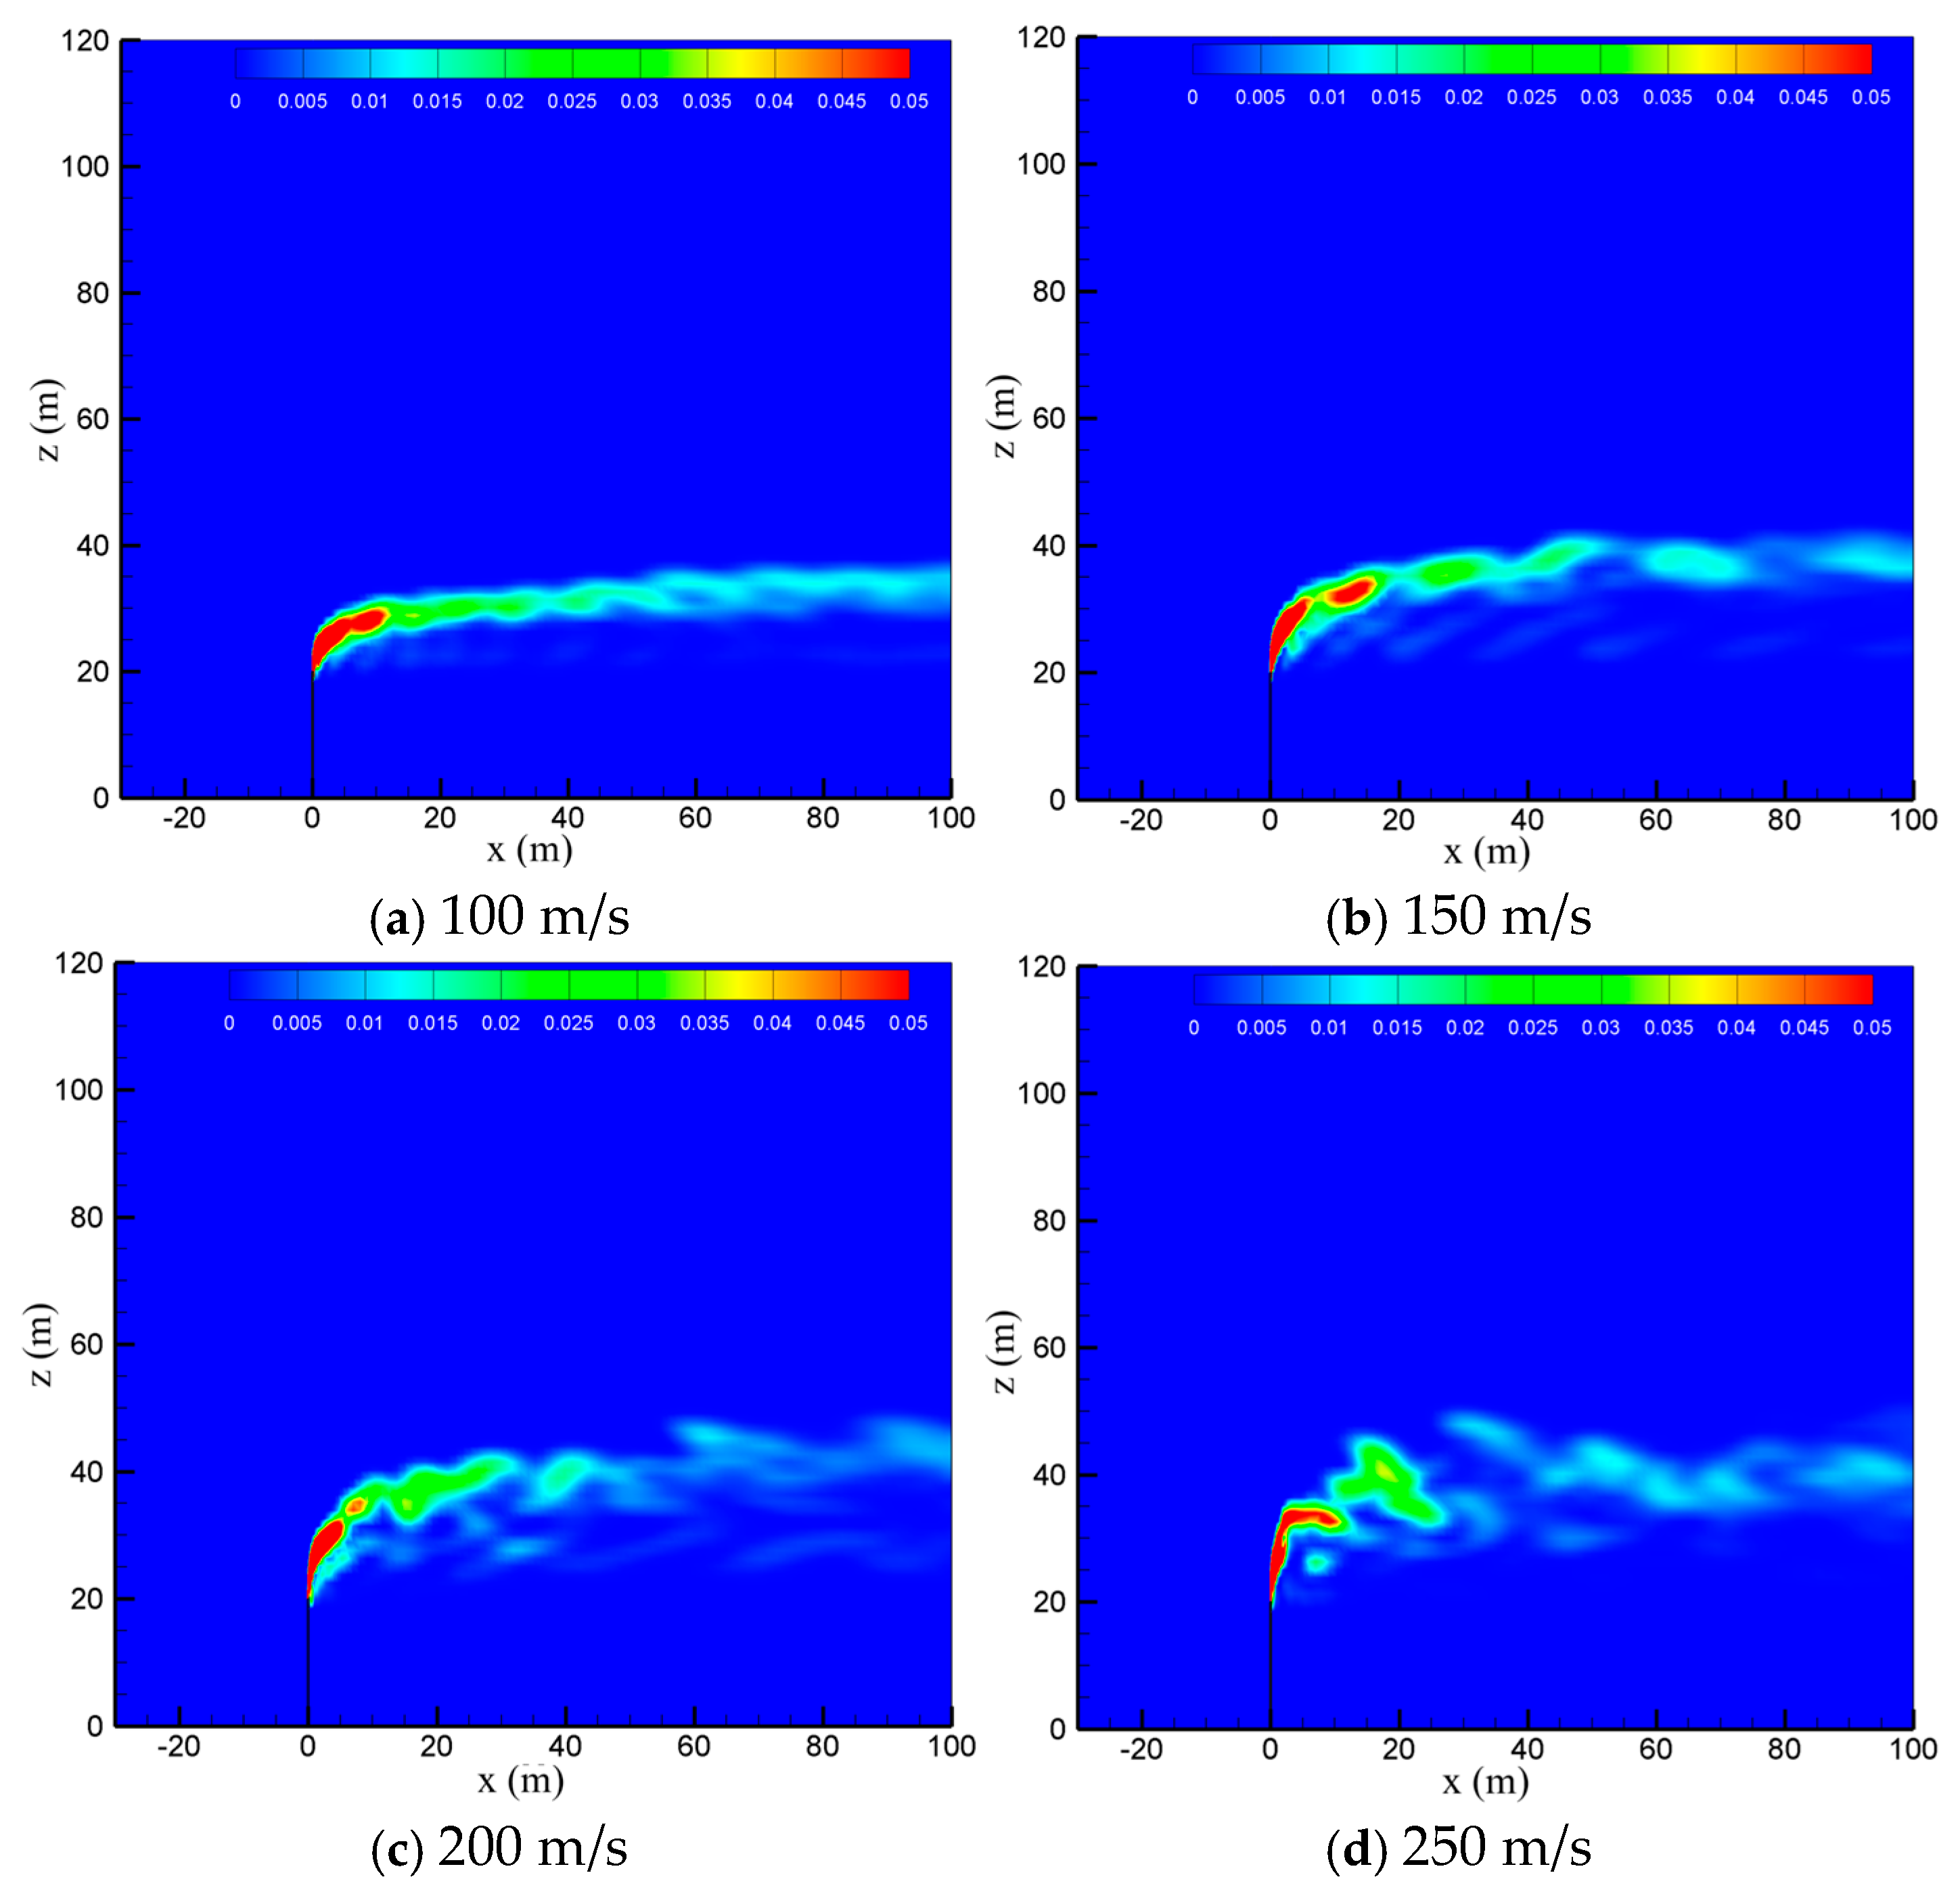
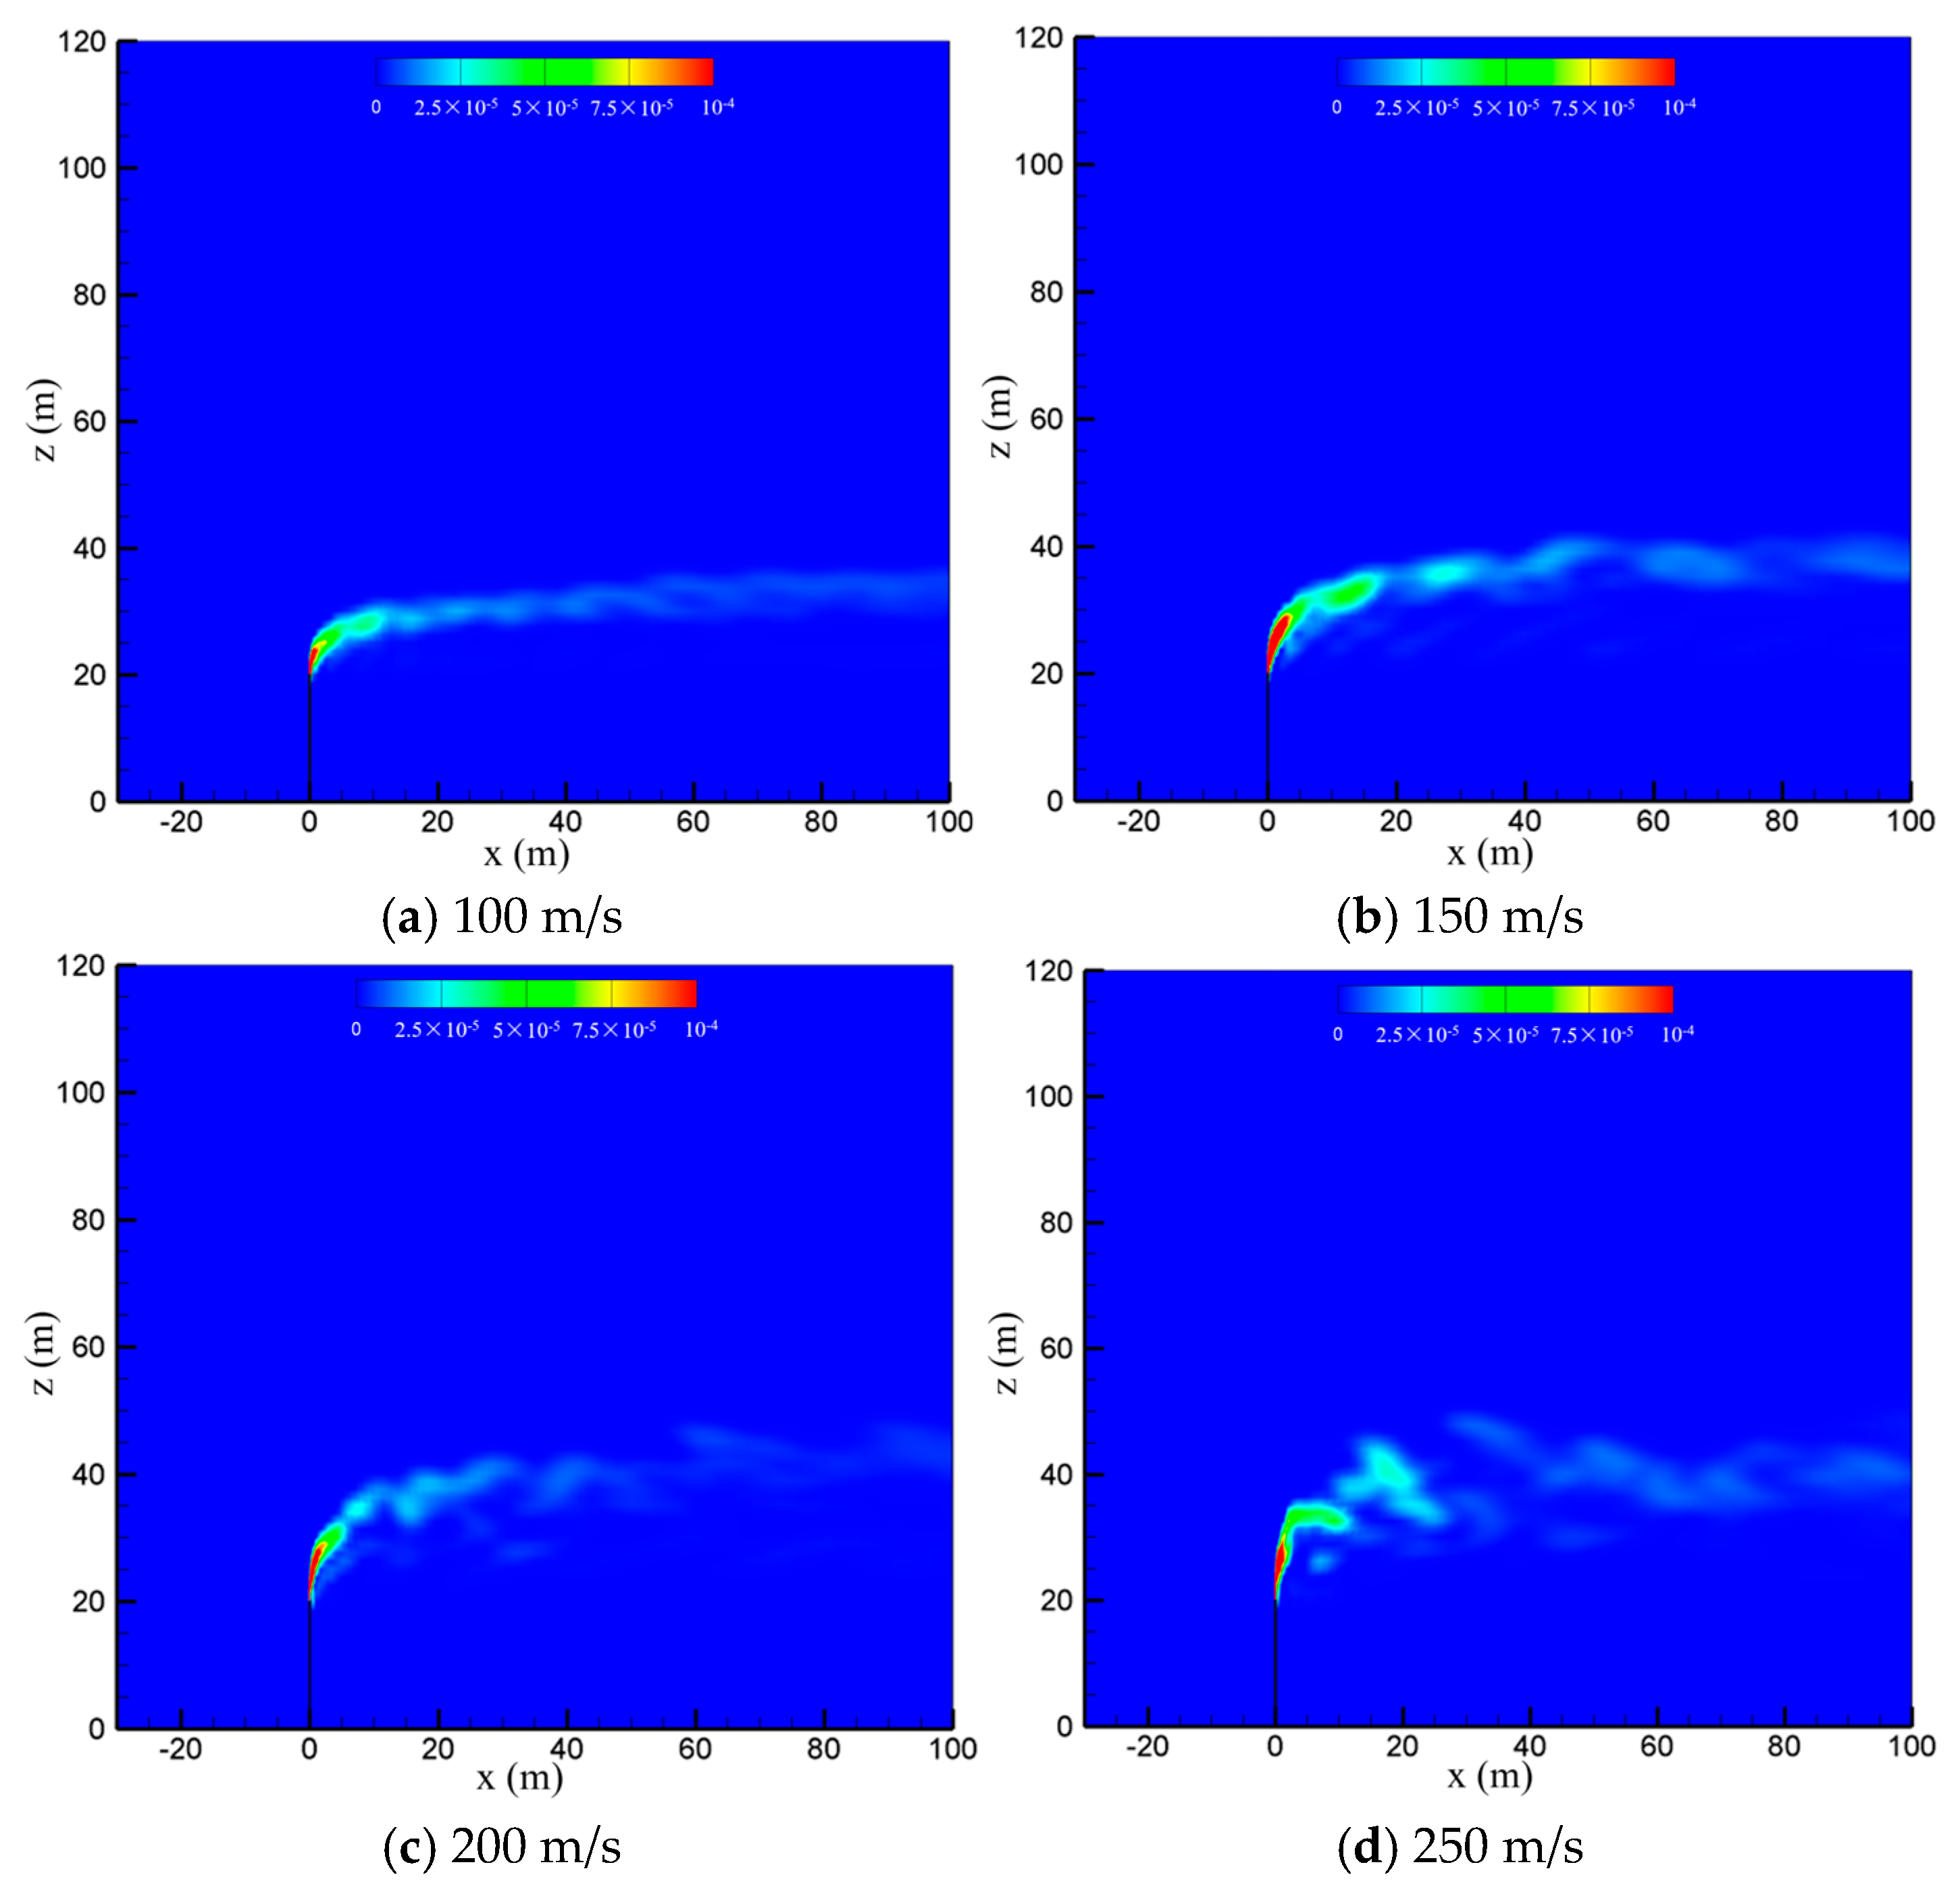
The venting rate of the vent pipe is decided by the pressure equipment and working conditions. The cold-vented processes at four venting rates of 100 m/s, 150 m/s, 200 m/s and 250 m/s are concerned with the sulfur content fixed at 200 ppm and wind speed fixed at 5 m/s. As seen in Figure 10, the venting rate increases, the diffusion height of CH4 along the vertical direction increases, while the downwind skew angle decreases due to the increase in the momentum ratio between the vented gas flow and wind flow. At smaller venting rates of 100 m/s and 150 m/s, the effect of wind speed is significant, and the released CH4 mainly spreads along a regular path in the horizontal direction. At larger venting rates of 200 m/s and 250 m/s, however, the gas jet from the pipe outlet becomes very turbulent, and the effect of wind speed is weakened. As a result, the diffusion area of methane is broadened and becomes more irregular, which is helpful for the diffusion of CH4. As seen in Figure 11, the influence of the venting rate on the diffusion of H2S is similar to that of CH4. As the venting rate increases, both the height and area of the high-concentration region of H2S increase, while the deflection angle and stability of the gas cloud decrease. Therefore, a larger venting rate is able to promote the diffusion of the vented gas by increasing the vertical transportation distance and making the vented gas cloud more turbulent.

Figure 10.
Concentration of CH4 in the x-z-plane at different venting rates.
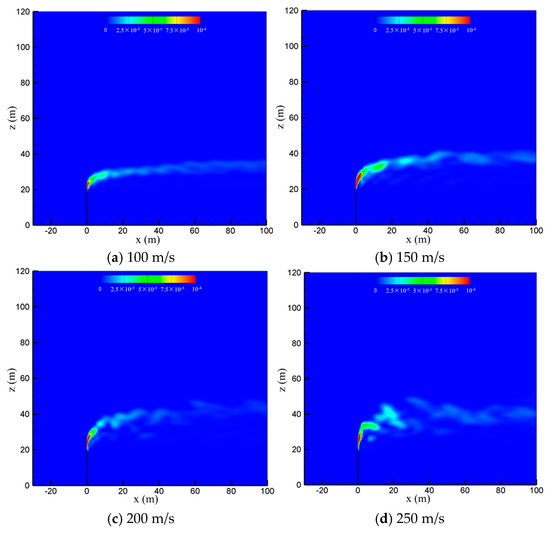
Figure 11.
Concentration of H2S in the x-z-plane at different venting rates.
4.5. Effect of the Obstacle Behind the Venting Pipe
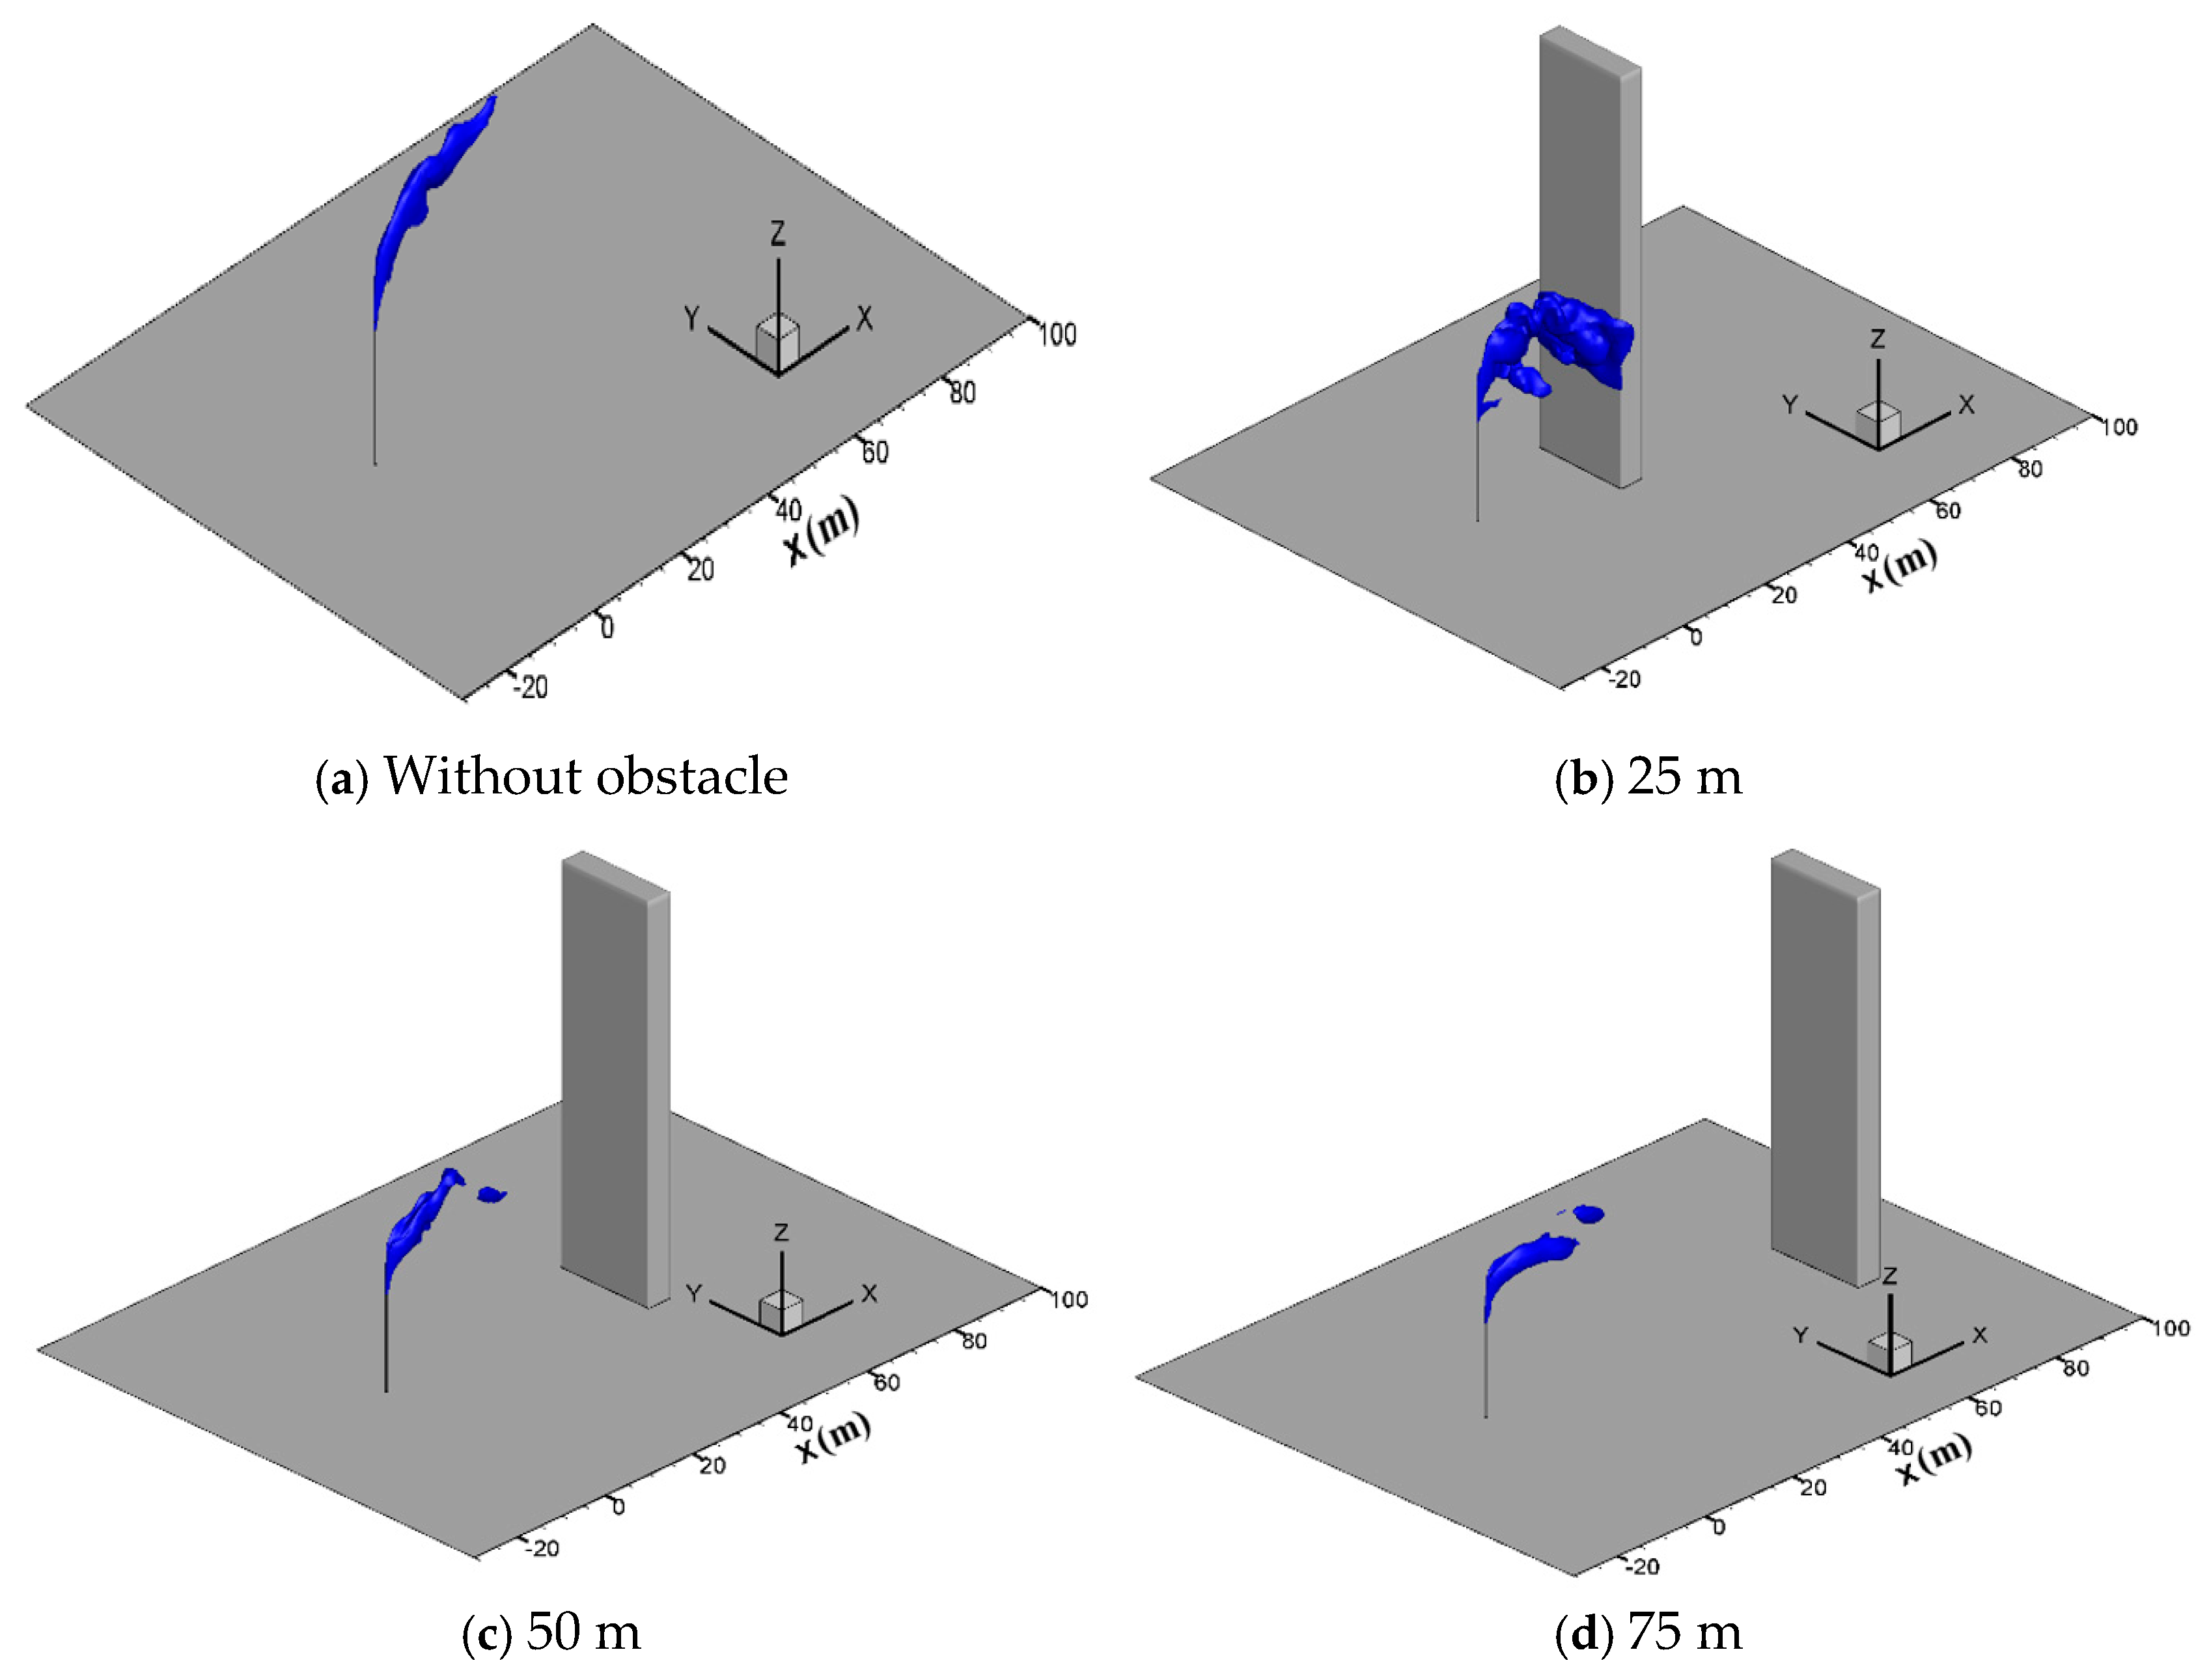
In engineering applications, there are usually obstacles such as station buildings, mountains and trees in the surrounding of the vent pipe, which may affect the diffusion process. To study the effect of tall buildings, gas diffusion processes with a hexahedron obstacle (10 m × 5 m × 80 m) located at 25 m, 50 m and 75 m downstream of the venting pipe are simulated at the wind speed of 5 m/s, a sulfur concentration of 200 ppm and a venting rate of 150 m/s. Figure 12 presents the three-dimensional iso-surfaces of the methane concentration of 2.5% in different cases. As seen in the figure, when the obstacle is located 25 m downstream of the vent pipe, methane gathers on the windward side of the obstacle and spreads down to the ground along the obstacle, increasing the concentration of methane gas near the ground and the risk of combustion and explosion. When the distance increases to 50 m and 75 m, the concentration of methane greatly reduces when it spreads to the obstacle, and thus the risk of accumulation and ignition on the ground no longer exists.
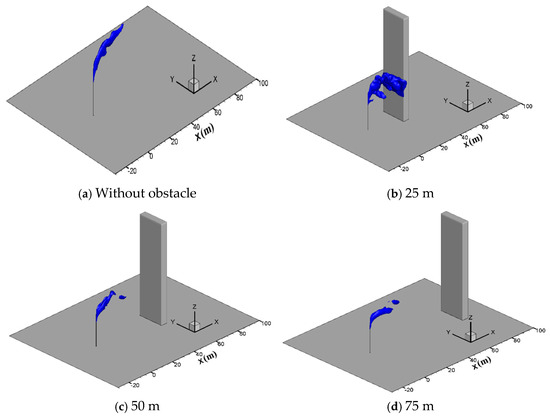
Figure 12.
Iso-surface of the 2.5% CH4 concentration at different obstacle distances.
Figure 13 shows the three-dimensional iso-surface contour for a hydrogen sulfide concentration of 20 ppm. As seen in the figure, at the smaller distance of 25 m, the horizontal diffusion process of hydrogen sulfide is also affected significantly by the obstacle. Hydrogen sulfide aggregates on the windward side of the obstacle and diffuses down to the ground region along the windward side of the obstacle, increasing the risk of personnel poisoning. At a distance of 50 m, the horizontal diffusion distance of hydrogen sulfide is reduced by about 10 m compared with the case without the obstacle. The gas mainly diffuses in the horizontal direction and hardly spreads to the ground. Moreover, some of the hydrogen sulfide bypasses the obstacle and divides into two strands, resulting in a wider gas cloud. At a distance of 75 m, the diffusion process is basically the same as that without the obstacle, and the hydrogen sulfide can be fully diffused and diluted by the wind. Therefore, it could be suggested that the distance between the vent riser and surrounding obstacles should be kept at least 50 m apart to ensure the safe release of sulfur-bearing natural gas.
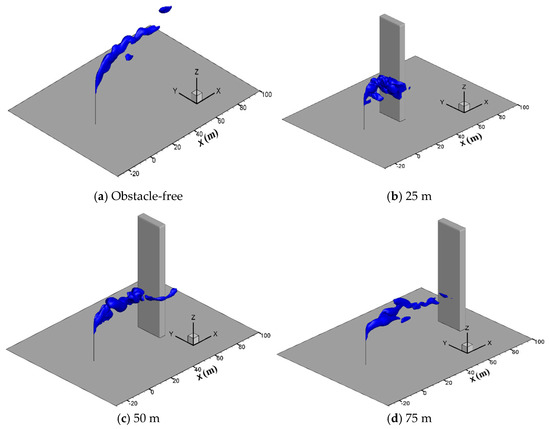
Figure 13.
Iso-surface of the 20 ppm H2S concentration at different obstacle distances.
5. Conclusions
To understand the diffusion features of the cold-vented natural gas containing sulfur, a high-precision large eddy simulation model is established, and the influence of wind speed, sulfur content, the venting rate and an obstacle is investigated. Based on the numerical results obtained, several conclusions can be addressed:
- (1)
- The large eddy simulation method is able to more precisely compute the transient diffusion process of the cold-vented natural gas containing sulfur. Compared with other SGS filtering models, the DSM SGS model shows better performance in simulating gas diffusion in the open atmosphere.
- (2)
- The relative value between the venting rate and wind speed has significant effects on the cold-vented process of natural gas containing sulfur. At a very small wind speed of 2 m/s and a relatively large venting rate of 200 m/s, the vented gas flow can “penetrate” the wind and move upward for about 30 m before it flows downward. As the wind speed increases from 2 m/s to 15 m/s, the sulfur-bearing natural gas released from the venting pipe moves upward for a shorter distance (10 m) first and then spreads downstream along the horizontal direction in a narrow regular area. At a very large venting rate of 250 m/s, the jet effect at the vent pipe outlet becomes very significant, and the gas cloud discharged from the venting pipe becomes more turbulent and fluctuated, which is helpful for the diffusion of the vented gas.
- (3)
- Within the range of sulfur content concerned, the sulfur content has little effect on the diffusion of methane gas. As the sulfur content increases, the diffusion area of hydrogen sulfide increases significantly.
- (4)
- The diffusion processes of both methane and hydrogen sulfide gases are influenced greatly by an obstacle closely downstream of the venting pipe. At a smaller distance of 25 m, the vented gases aggregate on and move along the windward side of the obstacle towards the ground, increasing the risk of explosion and poisoning on the ground. As the distance between the obstacle and venting pipe increases to 50 m, the obstacle no longer allows the vented gas to move to the ground; the horizontal diffusion becomes dominant, and the diffusion range after the obstacle increases. When the obstacle is placed far away from the vent pipe, its influence can be ignored.
The proposed LES solution procedure shows good stability and accuracy in simulating the transient diffusion process of the cold-vented gas containing sulfur. By changing the boundary and initial conditions, it can be employed in other gas diffusion problems, such as leakages of CH4, CO2 and H2 from pipelines and tanks. Moreover, based on the numerical results obtained, a safety risk assessment can be further conducted for the cold venting process. These are among our future work.
Author Contributions
Conceptualization, X.S.; software, X.S.; validation, X.S. and M.S.; investigation, X.S., M.S., S.D. and D.W.; resources, D.W., Y.G. and J.W.; data curation, M.S. and S.D.; writing—original draft, X.S.; writing—review and editing, X.S.; supervision, X.S., D.W. and J.Y. All authors have read and agreed to the published version of the manuscript.
Funding
This research received no external funding.
Data Availability Statement
The original contributions presented in this study are included in the article. Further inquiries can be directed to the corresponding author.
Conflicts of Interest
Authors Meijiao Song, Sen Dong were employed by the PetroChina Changqing Oilfield Company. Authors Dongying Wang, Yibao Guo, Jinpei Wang and Jingjing Yu were employed by the PipeChina Beijing Pipeline Company. The remaining authors declare that the research was conducted in the absence of any commercial or financial relationships that could be construed as a potential conflict of interest. The companies had no role in the design of the study; in the collection, analyses, or interpretation of data; in the writing of the manuscript, or in the decision to publish the results.
Abbreviations
| ci | concentration coefficient of the ith gas component, kg/m3 | Sc | the Schmidt number of fluid diffusion |
| Di | mass diffusion coefficient of the ith gas component, kg/(m2·s) | normal stress, Pa | |
| Kronecker symbol | t | time, s | |
| E | the energy of fluid per unit mass, J/kg | tangential stress, Pa | |
| h | the specific enthalpy, J/kg | sub-grid stress, m2/s2 | |
| thermal conductivity, W/(m·K) | velocity components, m/s | ||
| the dynamic viscosity of the fluid, Pa·s | wind speed at the height of | ||
| p | pressure, Pa | wind speed at the height of | |
| heat flow density, W/m2 | coordinate components, m | ||
| density of the fluid, kg/m3 | z | height with respect to the ground, m |
References
- Koopman, R.P.; Baker, J.; Cederwall, R.T.; Goldwire, H.C.; Hogan, W.J.; Kamppinen, L.M.; Kiefer, R.D.; McClure, J.W.; McRae, T.G.; Morgan, D.L.; et al. LLNL/NWC 1980 LNG Spill Tests. Burro Series Data Report; Lawrence Livermore National Lab.: Livermore, CA, USA, 1982. [Google Scholar]
- Goldwire, H.C.; Rodean, H.C.; Cederwall, R.T.; Kansa, E.J.; Koopman, R.P.; McClure, J.W.; McRae, T.G.; Morris, L.K.; Kamppinen, L.; Kiefer, R.D.; et al. Coyote Series Data Report. LLNL/NWC 1981 LNG Spill Tests Dispersion, Vapor Burn, and Rapid-Phase-Transition; Lawrence Livermore National Lab.: Livermore, CA, USA, 1983; Volume 2. [Google Scholar]
- Puttock, J.S.; Colenbrander, G.W.; Blackmore, D.R. Maplin sands experiments 1980: Dispersion results from continuous releases of refrigerated liquid propane. In Heavy Gas and Risk Assessment II; Springer: Dordrecht, The Netherlands, 1983; pp. 147–161. [Google Scholar]
- Spicer, T.; Havens, J. Modeling the Phase I Thorney Island experiments. J. Hazard. Mater. 1985, 11, 237–260. [Google Scholar] [CrossRef]
- McQuaid, J. Objectives and design of the phase I heavy gas dispersion trials. J. Hazard. Mater. 1985, 11, 1–33. [Google Scholar] [CrossRef]
- Davies, M.; Singh, S. The phase II trials: A data set on the effect of obstructions. J. Hazard. Mater. 1985, 11, 301–323. [Google Scholar] [CrossRef]
- Krogstad, P.A.; Pettersen, R.M. Wind tunnel modelling of a release of a heavy gas near a building. Atmos. Environ. 1986, 20, 867–878. [Google Scholar] [CrossRef]
- Huber, A.H.; Snyder, W.H. Wind tunnel investigation of the effects of a rectangular-shaped building on dispersion of effluents from short adjacent stacks. Atmos. Environ. 1982, 16, 2837–2848. [Google Scholar] [CrossRef]
- Neff, E.D. Physical Modeling of Heavy Plume Dispersion; Colorado State University: Fort Collins, NC, USA, 1989. [Google Scholar]
- Havens, J.; Walker, H.; Spicer, T.O. Wind tunnel study of air entrainment into two-dimensional dense gas plumes at the Chemical Hazards Research Center. Atmos. Environ. 2001, 35, 2305–2317. [Google Scholar] [CrossRef]
- Almanza, V.H.; Molina, L.T.; Sosa, G. Soot and SO2 contribution to the supersites in the MILAGRO campaign from elevated flares in the Tula Refinery. Atmos. Meas. Tech. 2012, 12, 10583–10599. [Google Scholar] [CrossRef]
- Nourbakhsh, H.; Mowla, D.; Esmaeilzadeh, F. Predicting the Three Dimensional Distribution of Gas Pollutants for Industrial-type Geometries in the South Pars Gas Complex Using Computational Fluid Dynamics. Ind. Eng. Chem. Res. 2013, 52, 6559–6570. [Google Scholar] [CrossRef]
- Wang, A.; Lou, H.H.; Chen, D.; Yu, A.; Dang, W.; Li, X.; Martin, C.; Damodara, V.; Patki, A. Combustion mechanism development and CFD simulation for the prediction of soot emission during flaring. Front. Chem. Sci. Eng. 2016, 10, 459–471. [Google Scholar] [CrossRef]
- Fiates, J.; Santos, R.R.; Neto, F.F.; Francesconi, A.Z.; Simoes, V.; Vianna, S.S. An alternative CFD tool for gas dispersion modelling of heavy gas. J. Loss Prev. Process Ind. 2016, 44, 583–593. [Google Scholar] [CrossRef]
- Simon, E.G.; Harvey, T. Computational Fluid Dynamics (CFD) modelling of atmospheric dispersion for land-use planning around major hazards sites in Great Britain. J. Loss Prev. Process Ind. 2018, 54, 340–345. [Google Scholar]
- Teng, L.; Li, X.; Lu, S.; Liu, B.; Li, Y.; Li, W. Computational fluid dynamics study of CO2 dispersion with phase change of water following the release of supercritical CO2 pipeline. Process Saf. Environ. Prot. 2021, 154, 315–328. [Google Scholar] [CrossRef]
- Yet-Pole, I.; Cheng, T.L. Application of CFD model in an LPG tank explosion accident. J. Loss Prev. Process Ind. 2021, 69, 104367. [Google Scholar]
- Cao, Y.; Liu, T.; Song, G.; Zhou, W.; Han, H.; Li, Y.; Hu, Q.; Jing, R. Investigation of Pipeline CO2 Leakage and Diffusion on Offshore Platforms Based on Numerical Simulation. ACS Omega 2024, 9, 27537–27548. [Google Scholar] [CrossRef] [PubMed]
- Li, X.; Yu, Y.; Li, P.; Wang, K.; Li, J.; Zhao, Z.; Zhang, Y.; Zhou, N.; Yin, Q.; Sun, T.; et al. Numerical simulation of leakage, dispersion and explosion behavior of LPG in kitchen. Energy Sources Part A Recover. Util. Environ. Eff. 2024, 46, 3996–4011. [Google Scholar] [CrossRef]
- Luo, Z.; Wu, P.; Wen, H.; Liu, C.; Xie, L.; Peng, S.; Du, X. Numerical investigation on the multiphase jet dispersion and sublimation cooling characteristics during accidental release of liquid CO2. Saf. Sci. 2025, 186, 106832. [Google Scholar] [CrossRef]
- Zhang, J.; Jing, S.; Fan, Z.; Liang, H.; Zhang, J.; Zhang, Y.; Sun, C.; Zhang, J. Experimental and numerical investigation on near-field temperature and surface CO2 concentrations of buried dense phase CO2 pipeline leakage. Int. J. Greenh. Gas Control 2025, 143, 104360. [Google Scholar] [CrossRef]
- Garnier, E.; Adams, N.; Sagaut, P. Large Eddy Simulation for Compressible Flows; Springer Science: New York, NY, USA, 2009. [Google Scholar]
- Pandey, B.; Prajapati, Y.K.; Sheth, P.N. CFD analysis of the downdraft gasifier using species-transport and discrete phase model. Fuel 2022, 328, 125302. [Google Scholar] [CrossRef]
- Sun, X.; Li, W.; Huang, Q.; Zhang, J.; Sun, C. Large eddy simulations of wind loads on an external floating-roof tank. Eng. Appl. Comput. Fluid Mech. 2020, 14, 422–435. [Google Scholar] [CrossRef]
- ANSYS-FLUENT. ANSYS FLUENT Theory Guide 19.2; ANSYS Inc.: Canonsburg, PA, USA, 2022. [Google Scholar]


Disclaimer/Publisher’s Note: The statements, opinions and data contained in all publications are solely those of the individual author(s) and contributor(s) and not of MDPI and/or the editor(s). MDPI and/or the editor(s) disclaim responsibility for any injury to people or property resulting from any ideas, methods, instructions or products referred to in the content. |
© 2025 by the authors. Licensee MDPI, Basel, Switzerland. This article is an open access article distributed under the terms and conditions of the Creative Commons Attribution (CC BY) license (https://creativecommons.org/licenses/by/4.0/).