1. Introduction
Under the dual-carbon targets, global coal power faces common challenges like high retrofit costs and uncertain carbon pricing, while China additionally confronts peak-shaving constraints, limited storage assessments, and regulatory delays. Carbon capture, utilization, and storage (CCUS) technology has emerged as a critical breakthrough due to its dual role in emission reduction and energy security. However, existing evaluation methods fail to comprehensively reflect the synergies among technical performance, economic feasibility, and environmental benefits [
1,
2,
3]. Traditional assessment systems often analyze single indicators in isolation, neither quantifying the impact of technological degradation on long-term emission reduction efficacy nor dynamically capturing the marginal effects of carbon price fluctuations and policy adjustments. This makes it difficult for decision-makers to balance short-term costs with long-term carbon-neutrality goals [
4,
5]. Therefore, constructing a dynamic evaluation system integrating technical parameters, economic costs, and policy variables has become an urgent need to address the bottlenecks of coal power CCUS transition and optimize resource allocation [
6]. Beyond conventional chemical absorption, emerging CO
2-capture technologies, such as membrane separation, cryogenic distillation, solid adsorption, and biological fixation, offer advantages like lower energy use and system integration potential. A novel demand-side management strategy involves a radiofrequency (RF) heated fixed-bed reactor using a CaCO₃ sorbent for CO
2 capture. This system is designed to respond rapidly to grid fluctuations by operating during off-peak hours, aiming to reduce CO
2 emissions from peaking power plants and improve electricity grid stability [
7]. A comparative investigation of CO
2 desorption performance from microporous activated carbon (AC) used two techniques: Microwave Swing Desorption (MSD) and Temperature Swing Desorption (TSD). A modified microwave oven and a conventional oven were used to heat the AC bed at two target temperatures: 70 °C and 130 °C [
8].
In traditional assessment systems, technical evaluation indicators primarily include the capture efficiency, technological maturity, and energy efficiency ratio. Methods such as the analytic hierarchy process (AHP), experimental measurements, process simulation, and mathematical modeling are widely used. To address the synergistic effects of technical parameter fluctuations and policy uncertainties in CCUS system optimization and achieve globally optimal decision-making [
9,
10], Fetanat and Tayebi proposed a multi-criteria decision support system based on interval type-2 trapezoidal fuzzy sets. Combining socio-technical systems theory, this system quantifies uncertainties in technical, economic, environmental, and social factors, enabling a comprehensive performance evaluation of carbon capture technologies in the oil and gas industry and enhancing the scientific rigor and reliability of decision-making processes [
11]. Compared to international efforts focusing on generalized uncertainty modeling, the Chinese researchers Nan et al. developed an AHP-based evaluation framework that integrates expert judgment and a quantitative analysis. By constructing an indicator system encompassing technical, economic, and policy dimensions, the framework systematically evaluates and prioritizes carbon capture technologies in China, providing a scientific basis for policy formulation [
12]. García et al. established a techno-economic analysis model for microalgae bioreactors coupled with CO
2 capture, using flue gas from thermal power plants and piggery wastewater as resource inputs. Through experimental measurements and process simulation, the model achieves the synergistic optimization of carbon capture and wastewater treatment, improving resource utilization efficiency and economic benefits [
13]. Lebedevas and Malūkas designed a cryogenic carbon capture system utilizing LNG cold energy. Through experimental testing and ship application simulations, the feasibility of this technology for dual-fuel ships was verified, achieving efficient CO
2 separation and cold energy recovery while enhancing energy utilization efficiency and emission reduction performance [
14]. In the context of carbon capture and utilization, Tapia J. et al. systematically elaborated on the critical role of CCUS technology in addressing climate change. The study highlights that carbon capture and utilization (CCU) achieves resource savings by substituting natural CO
2 sources, while carbon capture and storage (CCS) achieves emission reduction through long-term sequestration. Although theoretically synergistic, their commercialization is hindered by role differences in energy engineering. The authors propose using process systems engineering (PSE) methods to build quantitative decision-support tools for addressing key issues in CCUS system planning [
15]. Chen S. et al. reviewed model-based CCUS carbon neutrality pathways, focusing on multidimensional risks such as financial, technical, and environmental health and safety (EHS). The study reveals that the “golden period” for global CCUS deployment is 2040–2060 (2030–2050 for China), but current progress lags far behind carbon neutrality requirements due to four major bottlenecks: insufficient geological storage capacity assessments, high project failure rates, a lack of funding and market incentives, and inadequate regulations and risk-sharing mechanisms. The study further emphasizes the need for cross-disciplinary collaborative innovation to overcome these bottlenecks and provides policy recommendations for risk management and market-oriented optimization [
16]. However, these studies are limited by their singular focus on technical parameters, failing to comprehensively evaluate key performance indicators, such as the technological maturity, unit emission reduction cost (USD/t CO
2), and lifecycle carbon intensity. Rui Z. et al. [
17] proposed a method based on machine learning that aids 3D modeling for CO
2 storage, but data gaps and weak cross-scale integration hinder model fidelity, stressing cross-disciplinary collaboration. Western approaches prioritize techno-economic optimization and integrated lifecycle modeling, whereas regional studies in China often focus on policy alignment, pilot demonstration feasibility, and rapid deployment scenarios under government-driven frameworks.
In traditional assessment systems, economic evaluation indicators primarily include the net present value (NPV) and levelized cost (LC). Methods such as Pareto optimality strategies and eco-techno-economic analysis are employed. Li M. et al. proposed an ecosystem-based CCUS innovation strategy (eco-CCUS), which utilizes unexploited crop straw as feedstock to achieve low-cost, large-scale carbon sequestration. The study analyzes the economic feasibility of this technology in rural China, demonstrating that its cost-effectiveness is closely related to the crop density, GDP levels, and transportation distance. A Pareto optimality strategy was used to optimize nationwide deployment plans [
18]. Yan L. et al. systematically reviewed the status and prospects of CCUS-EOR (enhanced oil recovery) technology from an eco-development perspective. By comparing China and the U.S., the study reveals a significant gap in the technological maturity, application scale, and production enhancement effects, with the U.S. leading. It quantifies the economic feasibility of this technology in oil-rich, low-permeability fields and proposes differentiated technical recommendations [
19]. Barati K. et al. conducted Aspen Plus modeling and an eco-techno-economic analysis to compare the economic and environmental benefits of CCU-assisted electrocatalytic reforming (E-CRM) with traditional natural gas-to-methanol (TRM) and CCS pathways. The study highlights a threshold effect of the electricity cost and carbon intensity: when grid carbon intensity falls below 37 g CO
2/kWh, the lifecycle emission reduction cost of the electrocatalytic pathway outperforms CCS technology, providing a quantitative decision-making basis for CCU industrialization in low-carbon power regions [
20]. Emission standards are another critical aspect of CCUS technology. Mon, M.T. et al. evaluated the relationship between the CCUS capacity and carbon emissions in the U.S. using six econometric models. The elastic net model best explained the CCUS capacity, while the ordinary least squares (OLS) model performed best in explaining carbon emissions. The study emphasizes that CCUS should serve as a supplementary emission-reduction tool rather than the sole solution, and affordable green alternatives must be developed in parallel to achieve net-zero targets [
21]. Mon, M.T. et al. further revealed patterns in U.S. CCUS development through multi-model comparisons, showing that the project scale and policy frameworks significantly drive the technological capacity (best explained by the elastic net model). However, the emission-reduction effects are limited, underscoring the need for synergistic development with green alternatives [
22]. Wang P. et al. quantified China’s CCUS potential, confirming its pivotal role in industrial deep decarbonization. Maintaining a 30% annual growth rate, CCUS could achieve differentiated emission reductions of 2.3% in power and 17.3% in chemical industries by 2040, contributing 3.8% to overall carbon reductions [
23]. These studies, however, only considered economic or emission indicators in isolation, failing to integrate their interconnections. Moreover, they lacked a clustering analysis of large samples or evaluation metrics, preventing precise policy improvements tailored to categorical differences. Unlike the U.S., where the CCUS-EOR benefits from established pipeline infrastructure and tax incentives, China’s large-scale deployment is hindered by fragmented market signals and high transport costs in inland regions.
This study proposes a technical–economic–emission indicator evaluation framework, integrating three dimensions for separate assessments using a Monte Carlo simulation and K-means clustering. First, a three-dimensional evaluation framework combining technical, economic, and emission indicators was constructed, enabling a transition from static analysis to dynamic probabilistic assessments through Monte Carlo simulation and K-means clustering. Second, dynamic lognormal distributions, geometric Brownian motion, and other stochastic process models were employed to quantify the synergistic effects of technological degradation, carbon price fluctuations, and policy interventions on key indicators. Finally, through differentiated policy scenario analysis, optimization strategies were proposed, providing a systematic solution for policy formulation that balances short-term economic viability with long-term carbon neutrality goals.
The core indicators—including the energy consumption for capture, capture rate, LC, NPV, and levelized abatement cost LAC—were quantified using mathematical formulas. Dynamic probability distributions, such as lognormal distribution and geometric Brownian motion, were introduced to simulate parameter evolution, thereby addressing the limitations of traditional static evaluations in capturing technological degradation and market fluctuations.
By dynamically integrating technical parameters, economic variables, and emission indicators, probabilistic analysis results were generated through tens of thousands of path simulations. The analysis identified compression energy consumption as the key cost-driving factor and quantified the threshold effects of carbon pricing and subsidies.
Based on the K-means algorithm, the technological pathways were classified into three categories: the high-capture-rate–high-energy-consumption type, balanced type, and low-efficiency type. Differentiated policy recommendations were proposed: in high carbon price scenarios, market mechanisms should be relied upon, while in low carbon price scenarios, subsidy support is necessary. Ultimately, a combined strategy of “tiered carbon pricing + phased subsidy reduction” was designed.
2. Methodology
This study establishes a multi-layered evaluation framework for coal-fired power plant CCUS transitions, encompassing technical, economic, and emission-related core indicators. The capture energy consumption and capture rate are decomposed and quantified, identifying compression energy as a major contributor and using K-means clustering to classify technological pathways into high-efficiency, balanced, and low-efficiency types, providing a basis for differentiated policy design. In the economic dimension, LC and NPV are used to assess project viability under varying carbon pricing and subsidy schemes. The LAC, which integrates the capture efficiency and carbon footprint, reflects the actual cost-effectiveness of CO2 reductions. Dynamic probability models—such as lognormal distribution and geometric Brownian motion—are applied, alongside Monte Carlo simulation, Markov chains, and mean reversion processes, to enable time-evolving modeling of the five key indicators. These methods reveal the long-term impacts of carbon price volatility, policy changes, and equipment degradation on project performance, supporting optimized CCUS deployment under carbon neutrality goals.
2.1. Micro-Level Construction
2.1.1. Technical Indicator Calculation
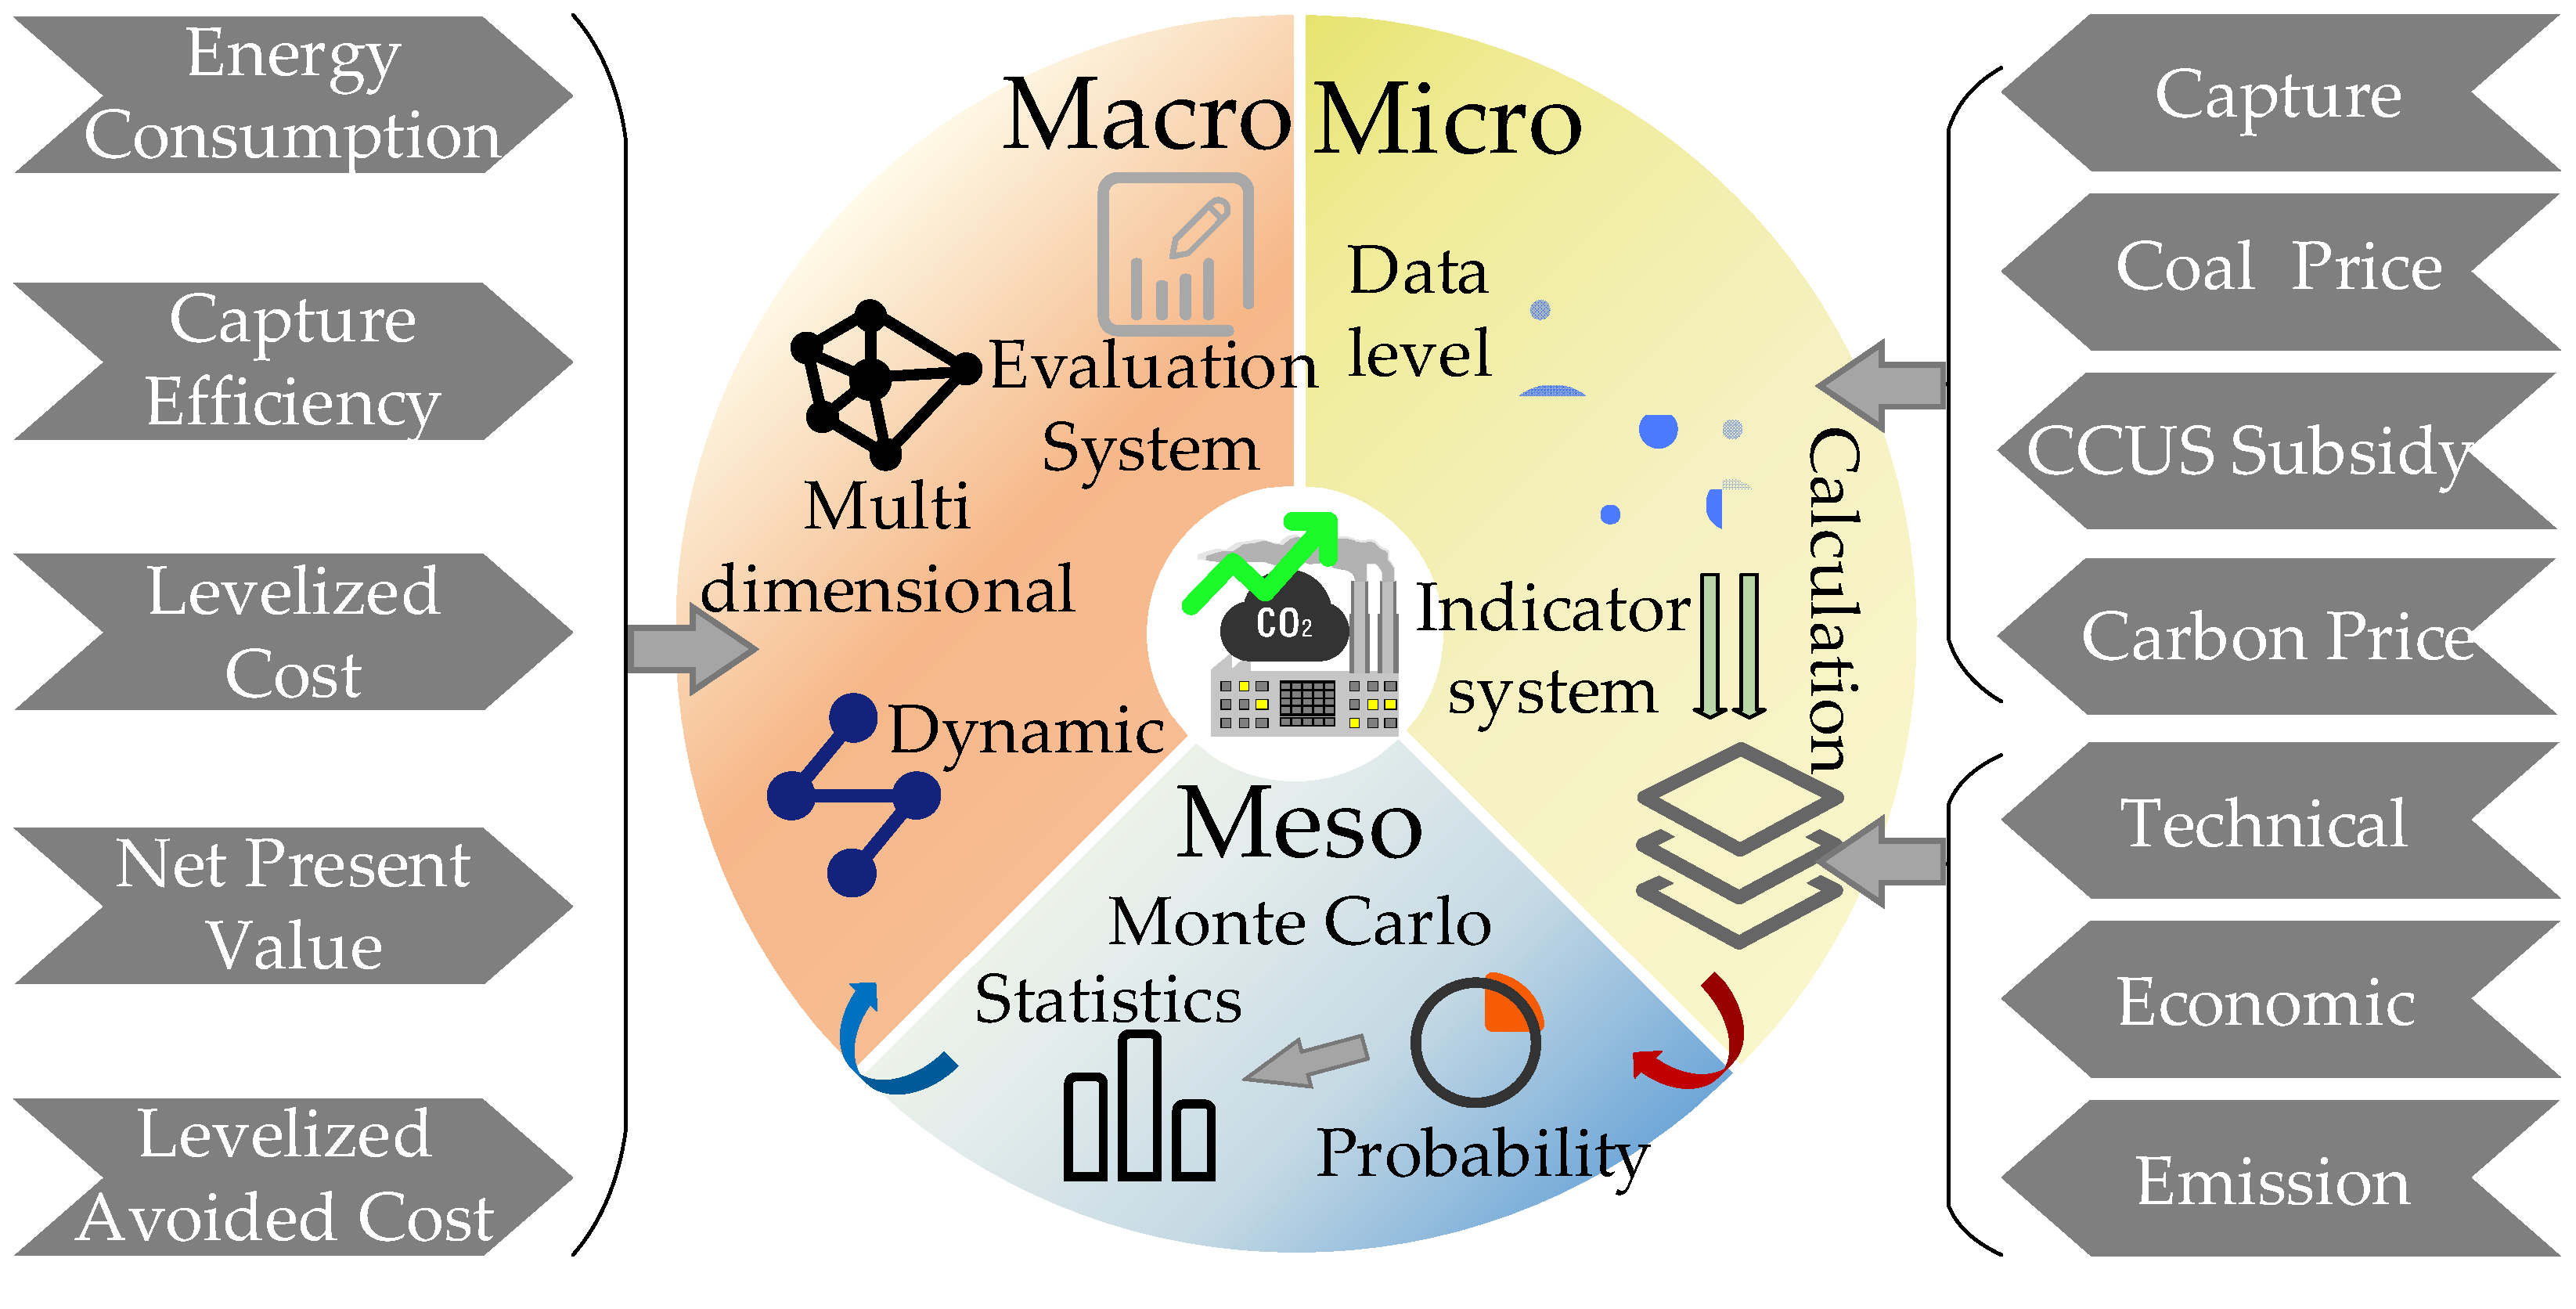
As
Figure 1 showing, the technical evaluation indicators for various typical coal-fired power plant CCUS transition pathways are energy consumption for CO
2 capture and the capture rate. Energy consumption directly determines the economic viability and large-scale application potential of CCUS technologies. High energy consumption not only increases operating costs but also leads to indirect carbon emissions due to the additional power generation demand, thereby weakening the overall mitigation effect. The capture rate, as a direct measure of the emission reduction efficiency, reflects the system’s ability to separate CO
2 from flue gas. The coordinated optimization of these two indicators is a key manifestation of technological maturity, as a high capture rate is often accompanied by high energy consumption. For instance, solvent-based chemical absorption, as the most mature and widely adopted CCUS technology, can serve as a representative case for technical analysis. It typically demonstrates high capture efficiency (>90%) but also suffers from high energy consumption, especially during the regeneration and compression stages. In contrast, membrane separation technologies offer a lower energy demand but often at the cost of lower capture rates and material stability issues. Therefore, the proposed framework uses chemical absorption as a benchmark pathway to validate the methodology, while also being applicable to other routes such as adsorption and cryogenic separation.
The capture energy consumption
breaks down the total energy required to capture a unit of CO
2 into regeneration energy consumption
, compression energy consumption
, and auxiliary system energy consumption
. Among them, compression energy consumption refers to the energy consumed when the captured low-pressure CO
2 gas is mechanically compressed into a high-pressure or supercritical state.
where
represents the compressor power,
represents the compression time, and
represents the compressor efficiency.
The capture energy consumption is calculated using the above variables:
where
represents the amount of CO
2 captured.
The carbon capture rate
is a core indicator of the carbon capture technology efficiency, representing the ratio of the amount of CO
2 captured to the total CO
2 emissions from the source, typically expressed as a percentage:
where
represents the total CO
2 emissions.
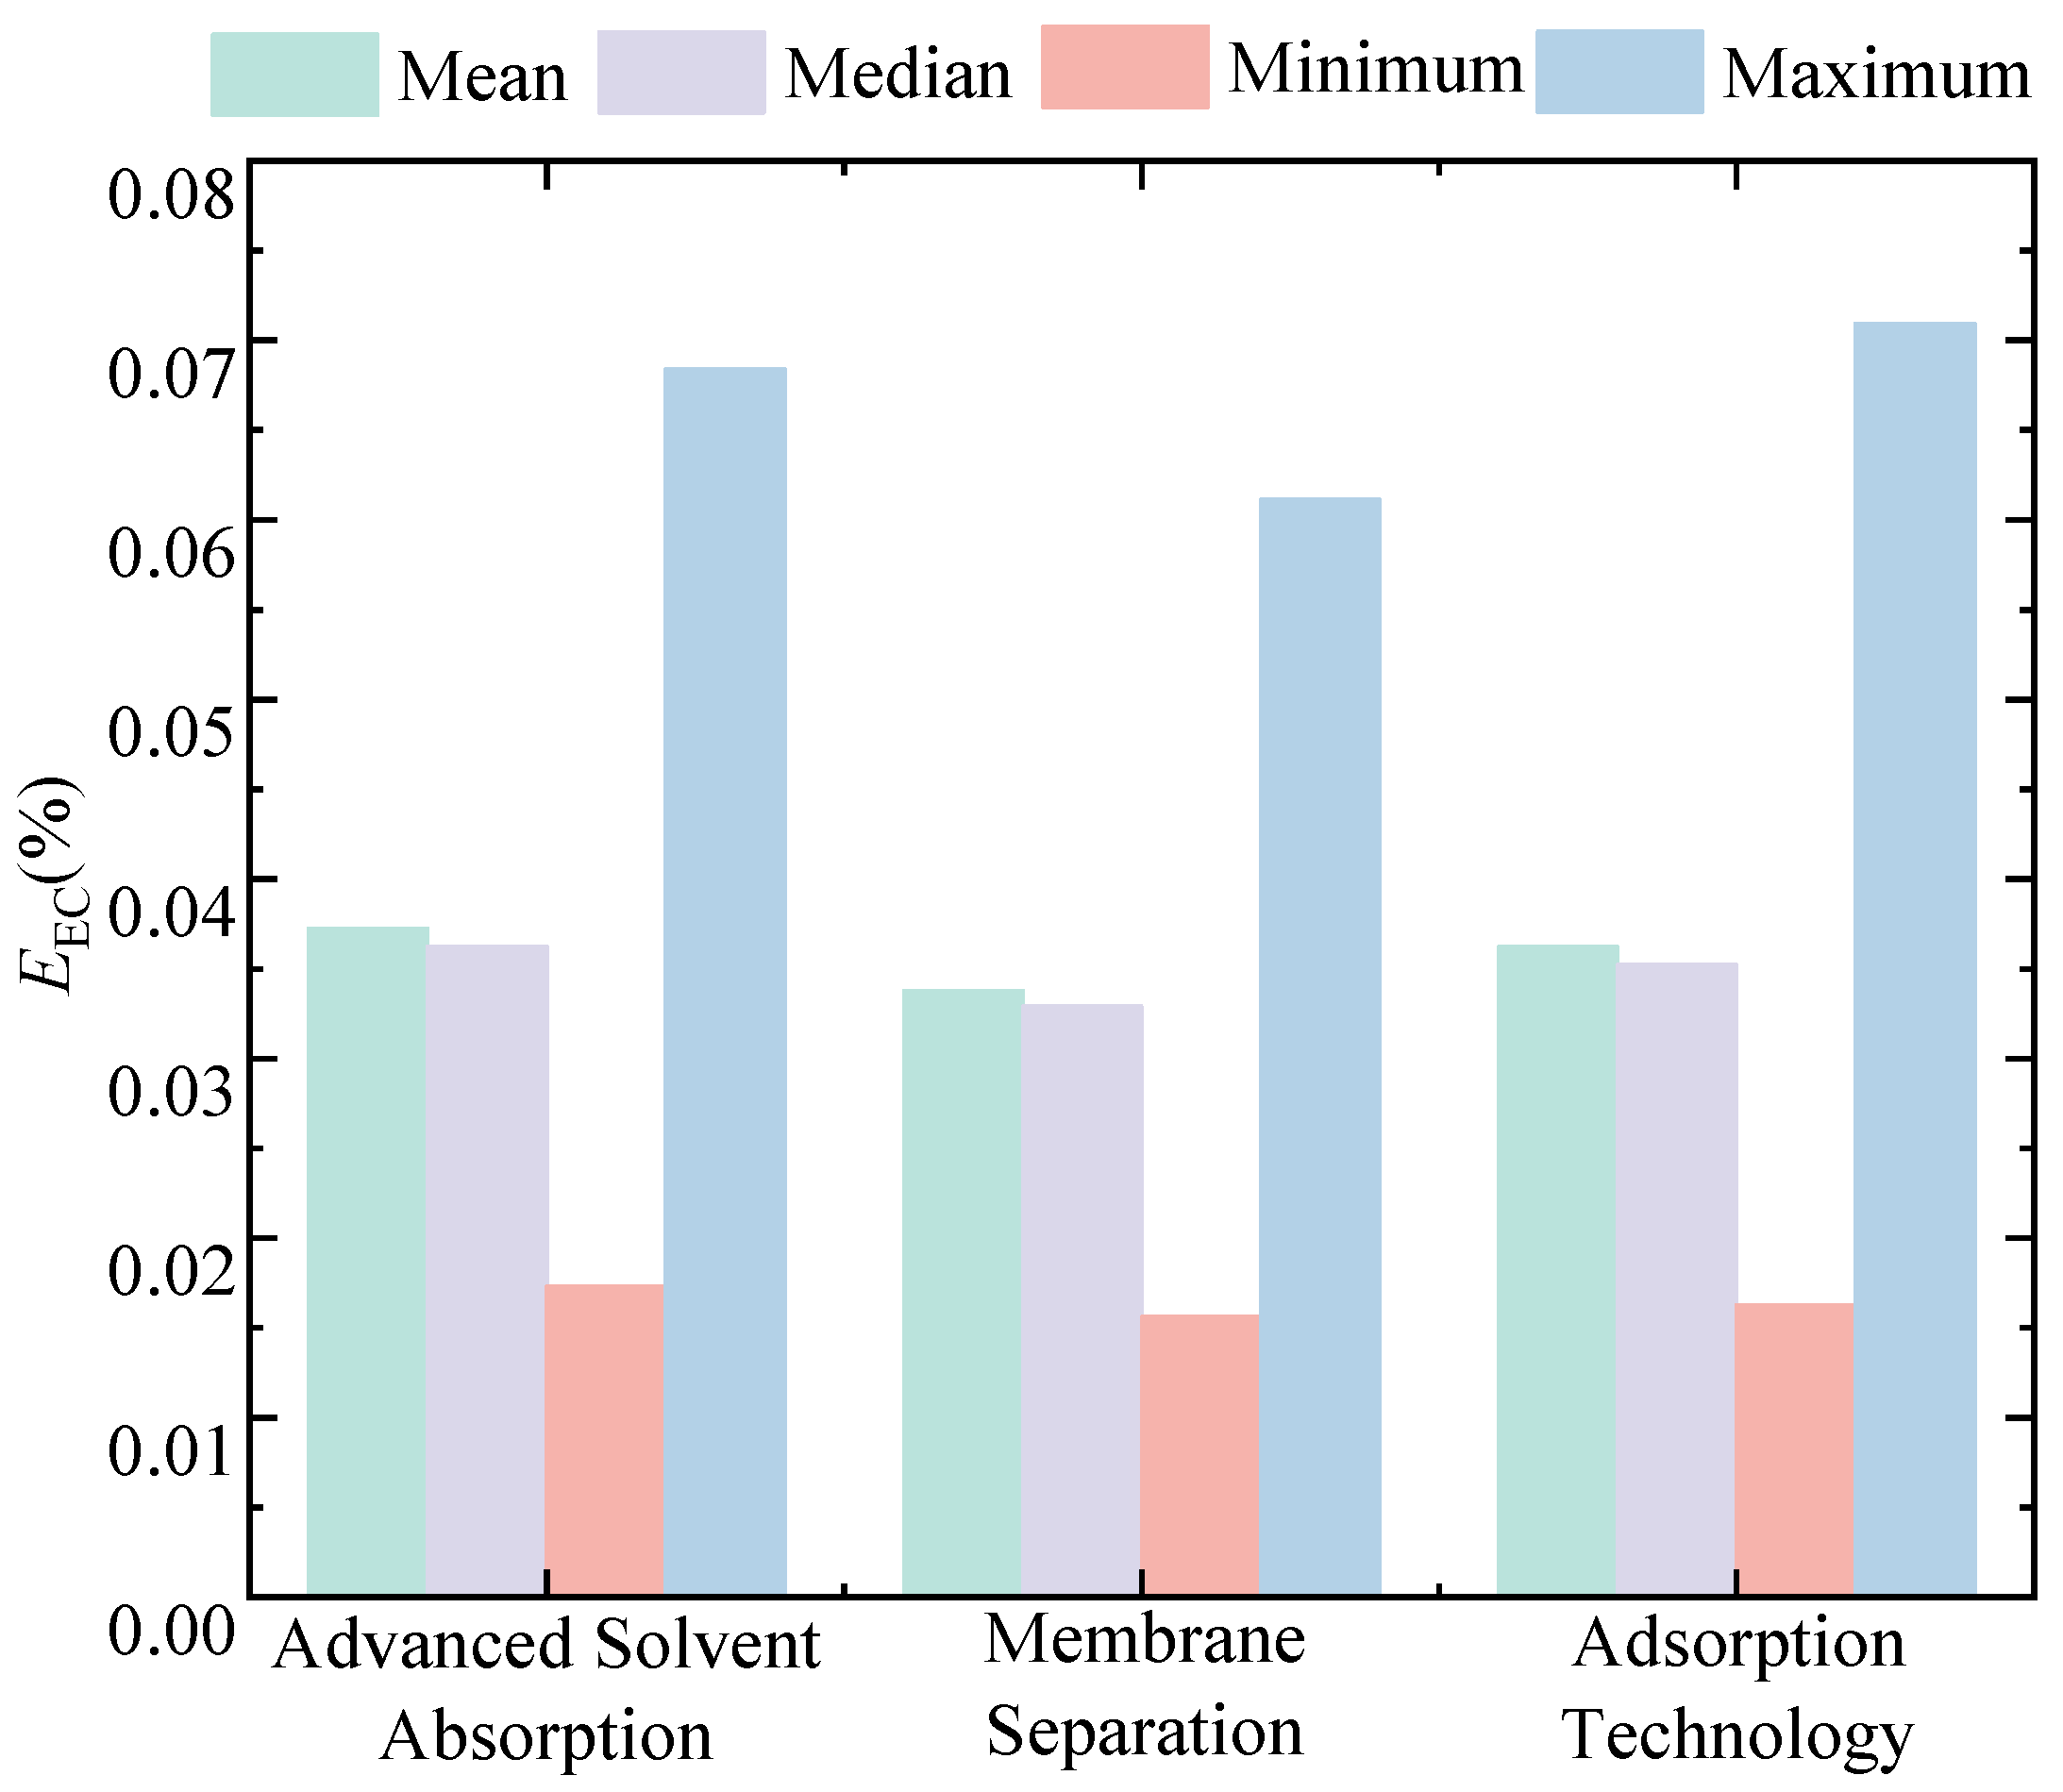
The above indicators—capture energy consumption and carbon capture rate—are fundamental metrics for evaluating carbon capture technology performance. For emerging CCUS technologies, such as advanced solvent absorption, membrane separation, and adsorption methods, these indicators reflect differences in energy use and capture efficiency. Advanced solvent absorption typically has higher energy consumption but better capture rates, while membrane separation and adsorption feature lower energy use with capture rates varying by operating conditions. Incorporating these technological characteristics into the evaluation framework helps to comprehensively assess the technical and economic feasibility of new CCUS technologies.
2.1.2. Economic Indicator Calculation
The economic evaluation indicators for various typical coal-to-power CCUS transformation pathways are
LC and
NPV.
LC distributes the total costs of each project component (generation, capture, transportation, and storage) across the unit net emission reduction, facilitating horizontal comparisons of the economic feasibility of different technological pathways or projects. By breaking down the costs of each component, key cost-reduction points can be identified.
where
represents the generation cost,
represents the carbon capture amount,
represents the carbon transportation cost,
represents the carbon storage cost, and
represents the net emission reduction.
To ensure the completeness of the indicator evaluation, by incorporating carbon price and CCUS subsidies, LC can directly reflect the improvement in the economic viability of the evaluated project due to policy support and carbon market incentives, thus lowering the LC value and making the project more competitive.
where
represents the carbon cost, and
represents the carbon capture subsidy.
The calculation of power generation costs includes the following:
where
represents the capital expenditure,
represents the operation and maintenance costs,
represents the fuel cost, and
represents the power-generation capacity.
NPV discounts the net cash flow over the entire project lifecycle to dynamically assess the long-term profitability and investment value of the project. Combining LC, it reflects both short-term cost optimization and quantifies the long-term potential for returns, providing a dual reference for policy formulation and investment decisions, balancing efficiency and sustainability.
where
represents the carbon trading revenue,
represents carbon capture subsidies,
represents carbon costs,
represents coal power costs,
represents the discount rate,
represents the initial investment,
represents the total number of lifecycle periods, and
represents the specific time period.
2.1.3. Emission Indicator Calculation
LAC quantifies the levelized cost of carbon (
LAC) by assessing the unit cost of CO
2 emission reductions, combining the full lifecycle cost of coal-fired power plant CCUS projects (including capture, transportation, storage, or utilization) with emission reduction benefits. Therefore,
LAC serves as an emission evaluation indicator for the CCUS transformation of coal power plants.
where
represents the levelized full lifecycle cost.
In this context, the formula for
is as follows:
where
represents the capital expenditure within period
,
represents the operating costs within period
, and
represents the amount of CO
2 treated within period
.
2.2. Meso-Level Construction
In dynamic assessment, risk management and real-time decision-making are key elements in optimizing CCUS deployment. Similarly, the real-time risk-averse scheduling of integrated electricity and natural gas systems can effectively address risks arising from market fluctuations and policy uncertainties through a conditional value-at-risk (CVaR)-based look-up table approximate dynamic programming approach [
24]. The meso-level model involves dynamic probability distribution construction and multivariate coupling simulation, ultimately unified through Monte Carlo dynamicization. In the dynamic evaluation of coal-fired CCUS systems, the Monte Carlo method constructs a multidimensional stochastic process model, transforming static formulas for the carbon capture rate, carbon capture energy consumption, economic indicators such as
LC and
NPV, and emissions indicators such as
LAC into probabilistic analysis tools. The dynamics of
EECCR are simulated through Weibull and Bernoulli distributions, representing the equipment efficiency decay, unit load fluctuations, and policy trigger mechanisms to simulate operational changes and minimum capture rate constraints.
EEC, on the other hand, evolves dynamically using log-normal distribution, beta distribution, and geometric Brownian motion to account for absorbent regeneration energy consumption and the renewable energy supply ratio. For economic indicators,
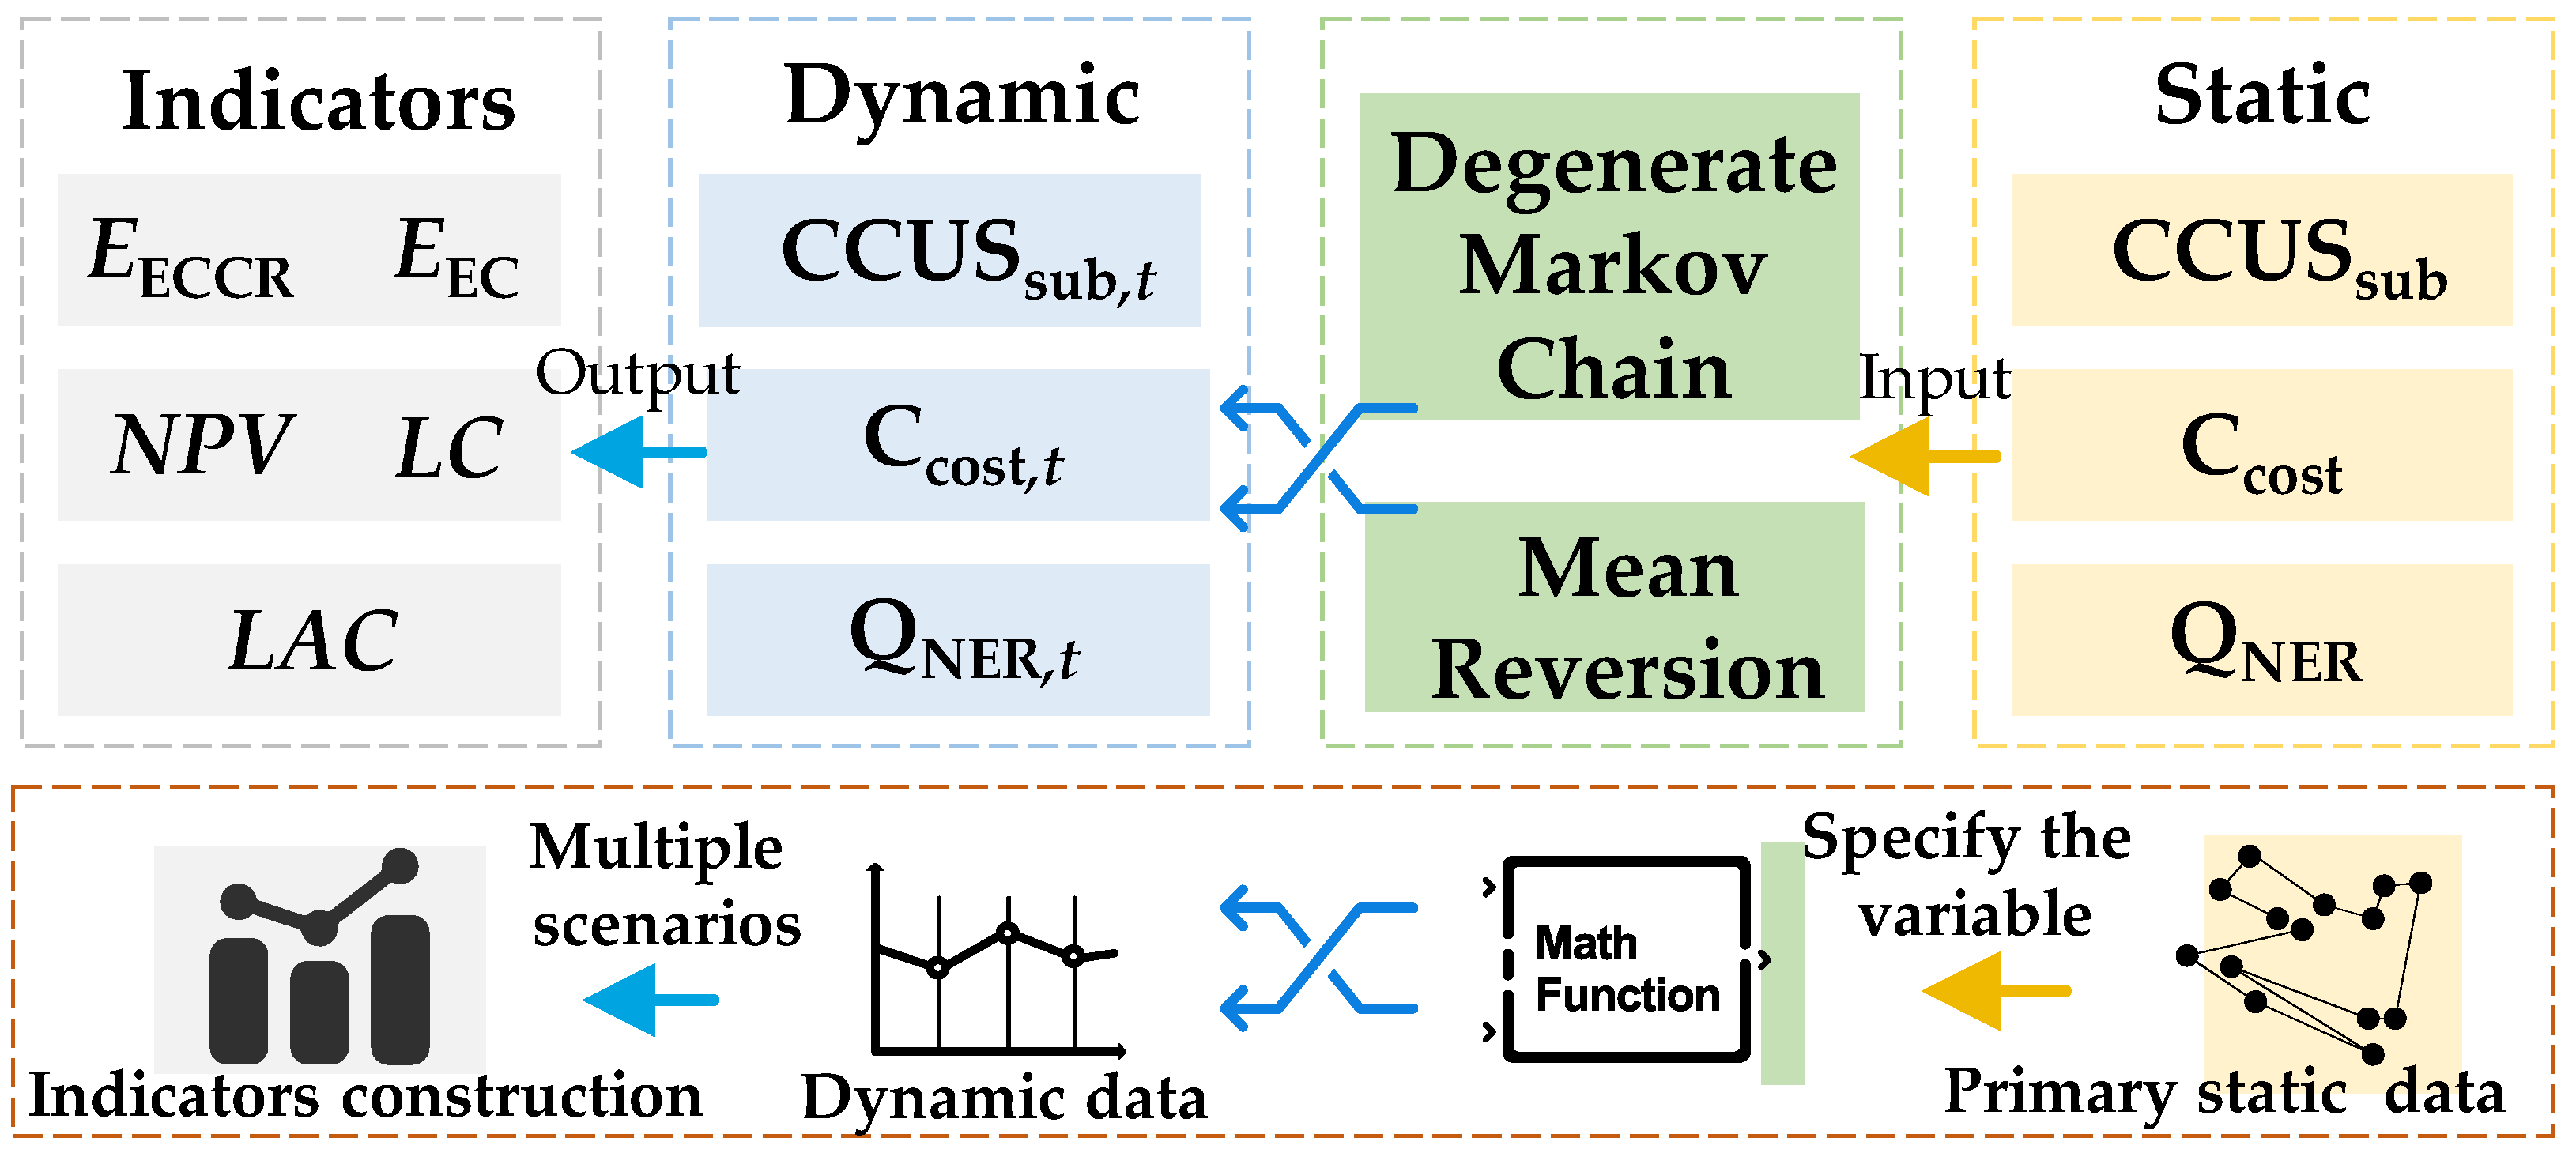
NPV integrates carbon price mean-reversion models based on the ornstein–uhlenbeck process, interest rate path simulations using CIR stochastic differential equations, and operational cost processes modeled using composite Poisson processes. LC depends on carbon quota policies modeled using Bernoulli distributions for the subsidy exit risk and dynamic coupling with market trading data. Lastly, LAC incorporates scale effects, using composite Poisson-geometric Brownian motion to capture marginal cost reductions and applies Monte Carlo methods for parameter calibration through K-S tests and Copula joint distribution generation, multi-scenario simulations involving parallel the computation of 10,000 paths. The technical challenges focus on model dependence, optimizing cross-project parameters using transfer learning, and data gaps, integrating multi-source data through federated learning, with the goal of achieving real-time carbon flow tracking and dynamic decision feedback. The specific process is shown in
Figure 2.
Figure 2 shows the process of indicator dynamization. Monte Carlo simulation is chosen for its ability to model complex, multidimensional uncertainties in CCUS, integrating diverse probabilistic distributions for a comprehensive risk analysis, and real-time decision-making. Compared to deterministic or less scalable methods, it offers superior flexibility and robustness. The distributed Monte Carlo simulation framework enables the real-time processing and analysis of large-scale carbon emission data, significantly improving the accuracy and efficiency of carbon emission assessments [
25]. The carbon capture rate
in variable
, denoted as
, can be dynamically modeled using a Markov chain for degradation, which accounts for the efficiency decay caused by equipment aging. This approach enables the dynamic adjustment of the carbon capture rate, reflecting the impact of equipment deterioration on performance over time.
For example, in the case of
, the variable
can be dynamicized by using a dynamic log-normal distribution. First, the time period is considered the following:
where
represents the initial annual energy consumption benchmark,
is the drift term,
is the initial log mean,
is the drift rate,
is the log standard deviation controlling the energy consumption fluctuation amplitude, and
is the standard normal distribution random variable.
For other dynamic variables related to carbon capture and energy consumption, the same method is applied to dynamically model them, resulting in and .
By leveraging distributed data processing and secure transaction protocols, these technologies enhance the accuracy of dynamic economic assessments [
26]. For LC, NPV, and
LAC,
and
can be dynamically modeled using mean reversion mathematical mechanisms. Taking
as an example,
where
represents the core driving factor,
is the long-term equilibrium carbon price,
is the reversion rate,
,
is the Brownian motion term, which simulates continuous market supply–demand fluctuations,
controls the amplitude of random fluctuations, and
represents policy or unforeseen events, where
follows an exponential distribution. When
exhibits negative pressure, it causes the carbon price to decrease, while positive pressure from
leads to an increase in the price.
The dynamicized carbon capture energy consumption and carbon capture rate are as follows:
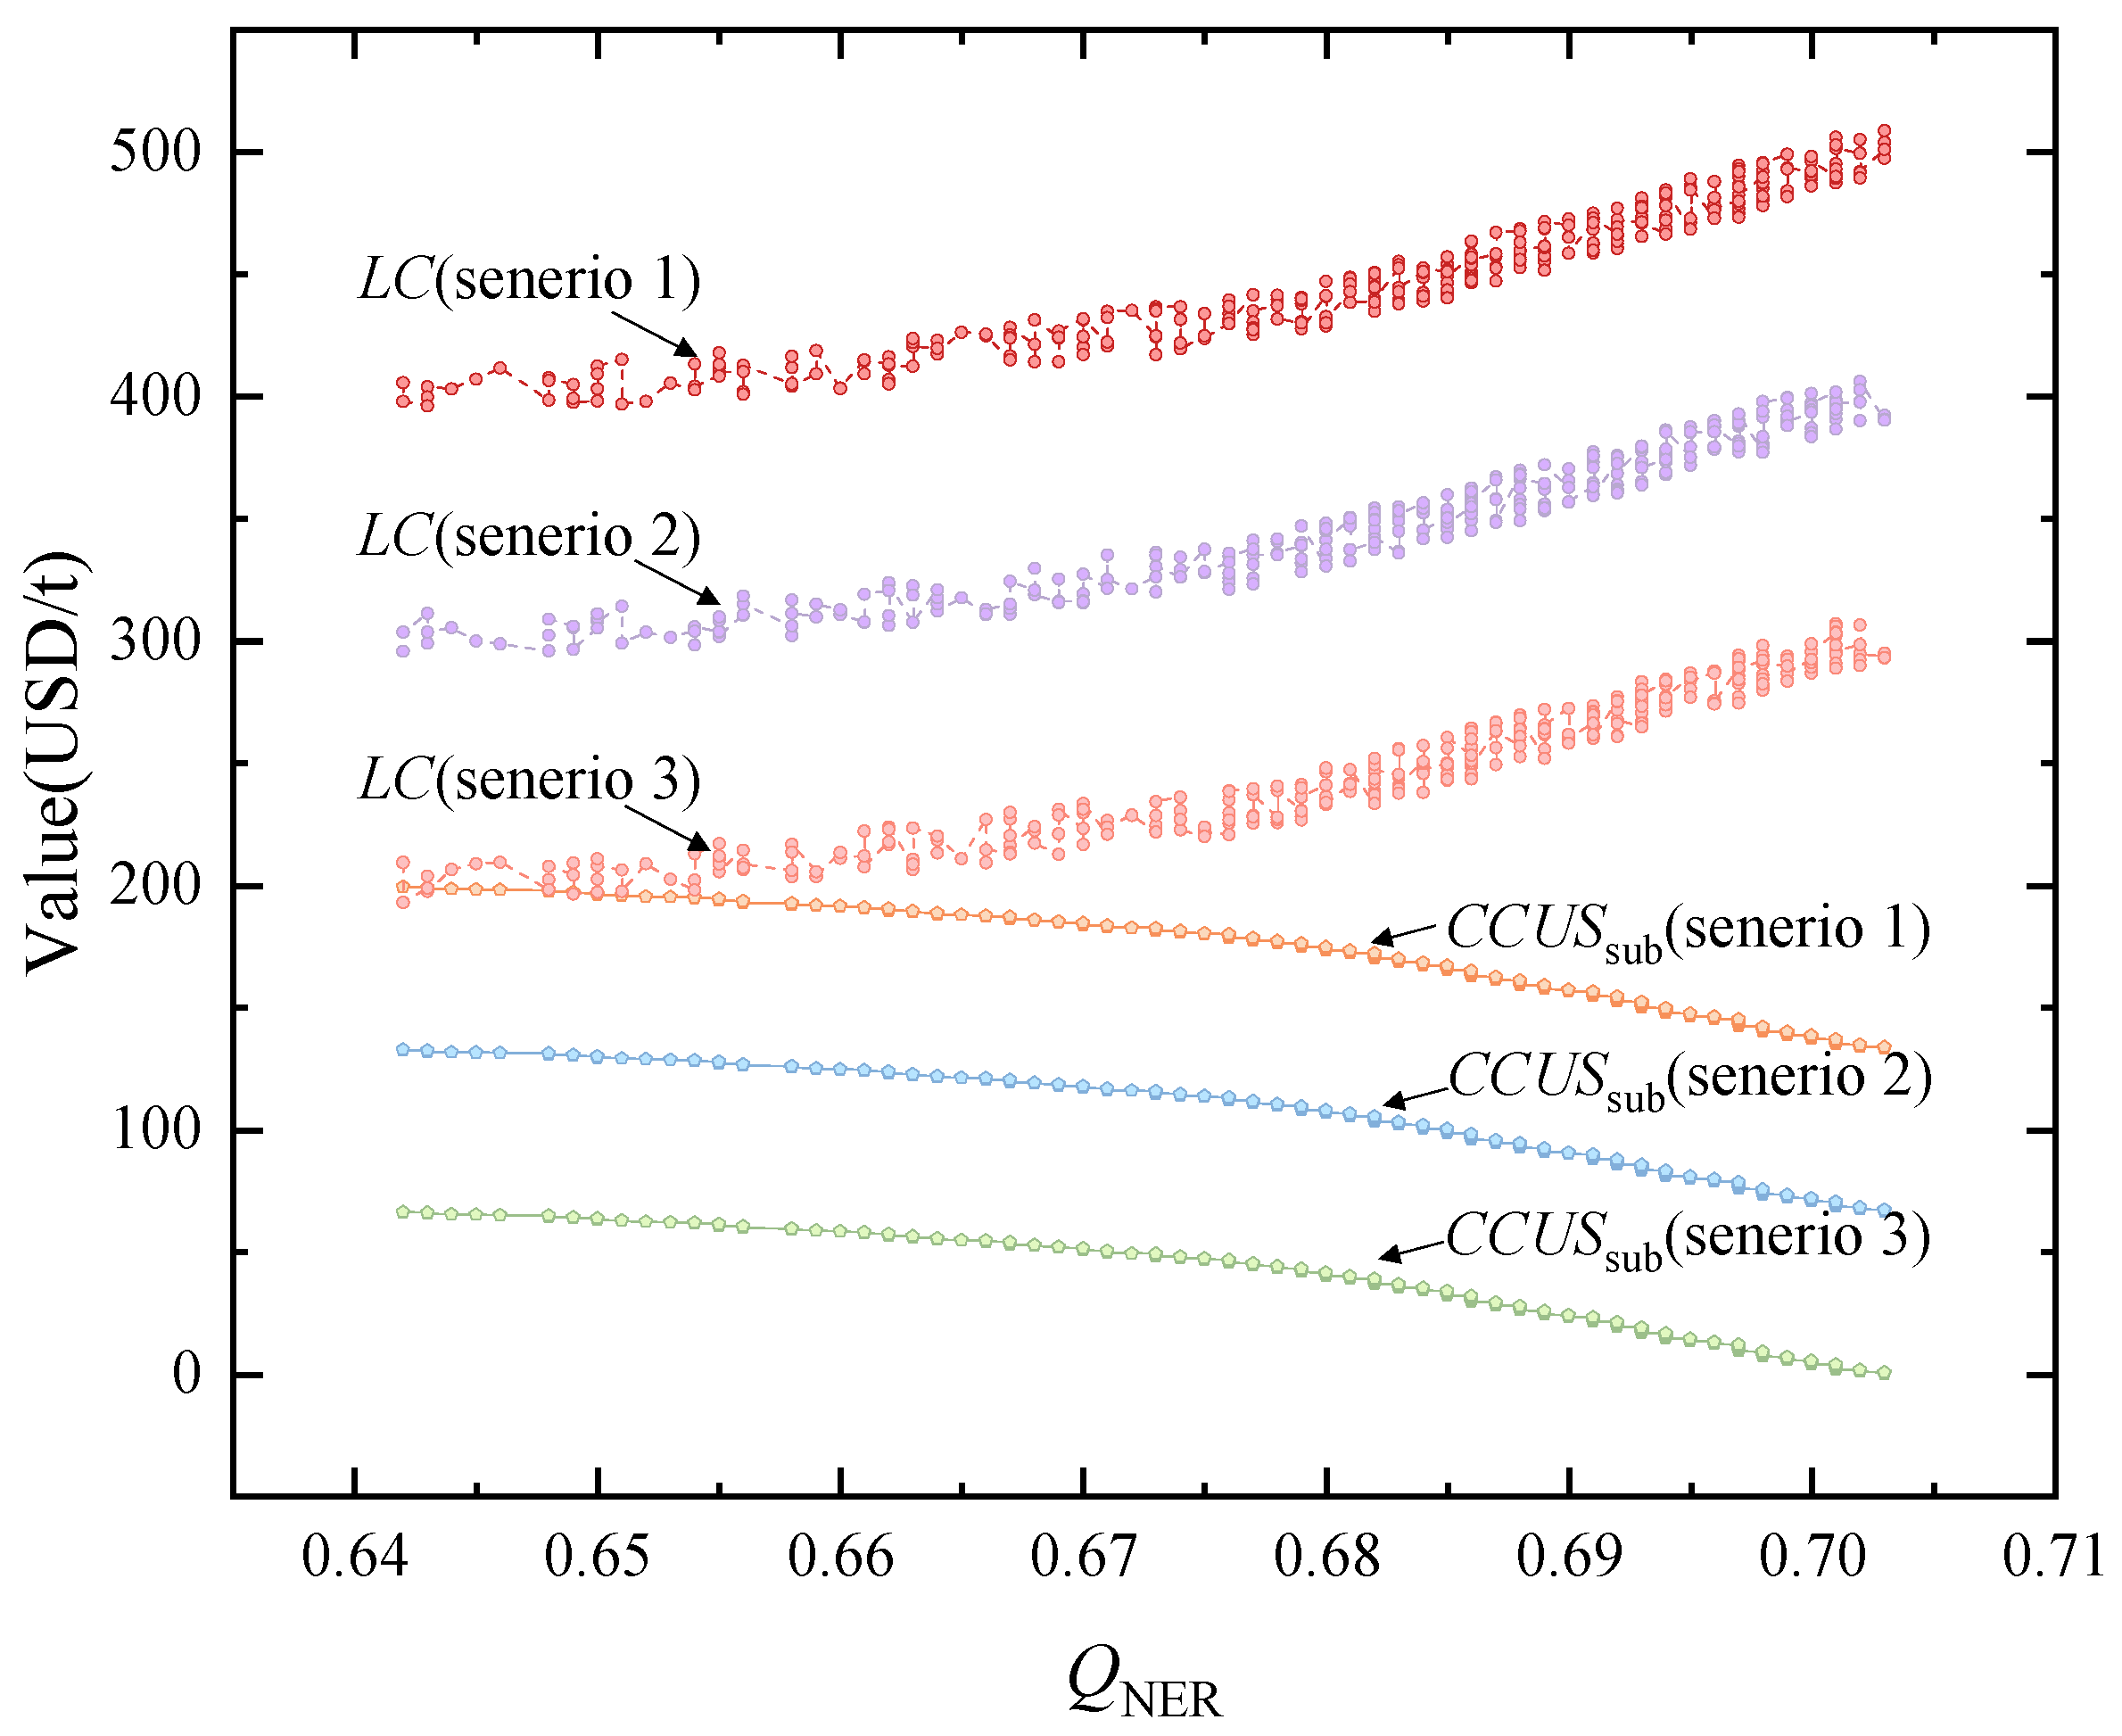
For LC, NPV, and LAC, different scenarios are designed for the analysis of variables such as Ccost,t, CCUSsub,t, and QNER,t, along with the five indicators.
2.3. Macro Level Construction
In the evaluation system for coal-fired power plant CCUS technology transformation, the five core indicators form a multidimensional quantification benchmark, providing scientific support for technology selection, economic analysis, and policy formulation. First, carbon capture energy consumption, as a key parameter of technological efficiency, directly determines the system operating costs. Its typical value range varies depending on the technology route. For solvent absorption, the energy consumption is relatively higher, while adsorption or membrane separation technologies can achieve lower consumption. If the energy consumption exceeds a certain threshold, it poses a high-cost risk. Next, the carbon capture rate reflects the technology’s emission reduction capability. Conventional projects are required to achieve a capture rate of over 90% to meet basic environmental requirements, but under the net-zero emission target, this rate needs to increase significantly. From the economic perspective, NPV is the core threshold for project feasibility. It requires the present value of lifetime revenues to cover costs and should be dynamically evaluated with industry discount rates. Meanwhile, LC needs to anchor the carbon price level. If the LC of a coal-fired power plant exceeds a certain range, it would struggle to operate independently without policy subsidies. Finally, LAC, as a comprehensive benefit indicator, must be lower than carbon market trading prices or industry marginal abatement costs to form a competitive advantage in the carbon-constrained market. These five indicators, progressing from technological performance and economic costs to emission reduction benefits, collectively construct the quantifiable decision-making framework for coal power plant CCUS transformation. The evaluation process is illustrated in
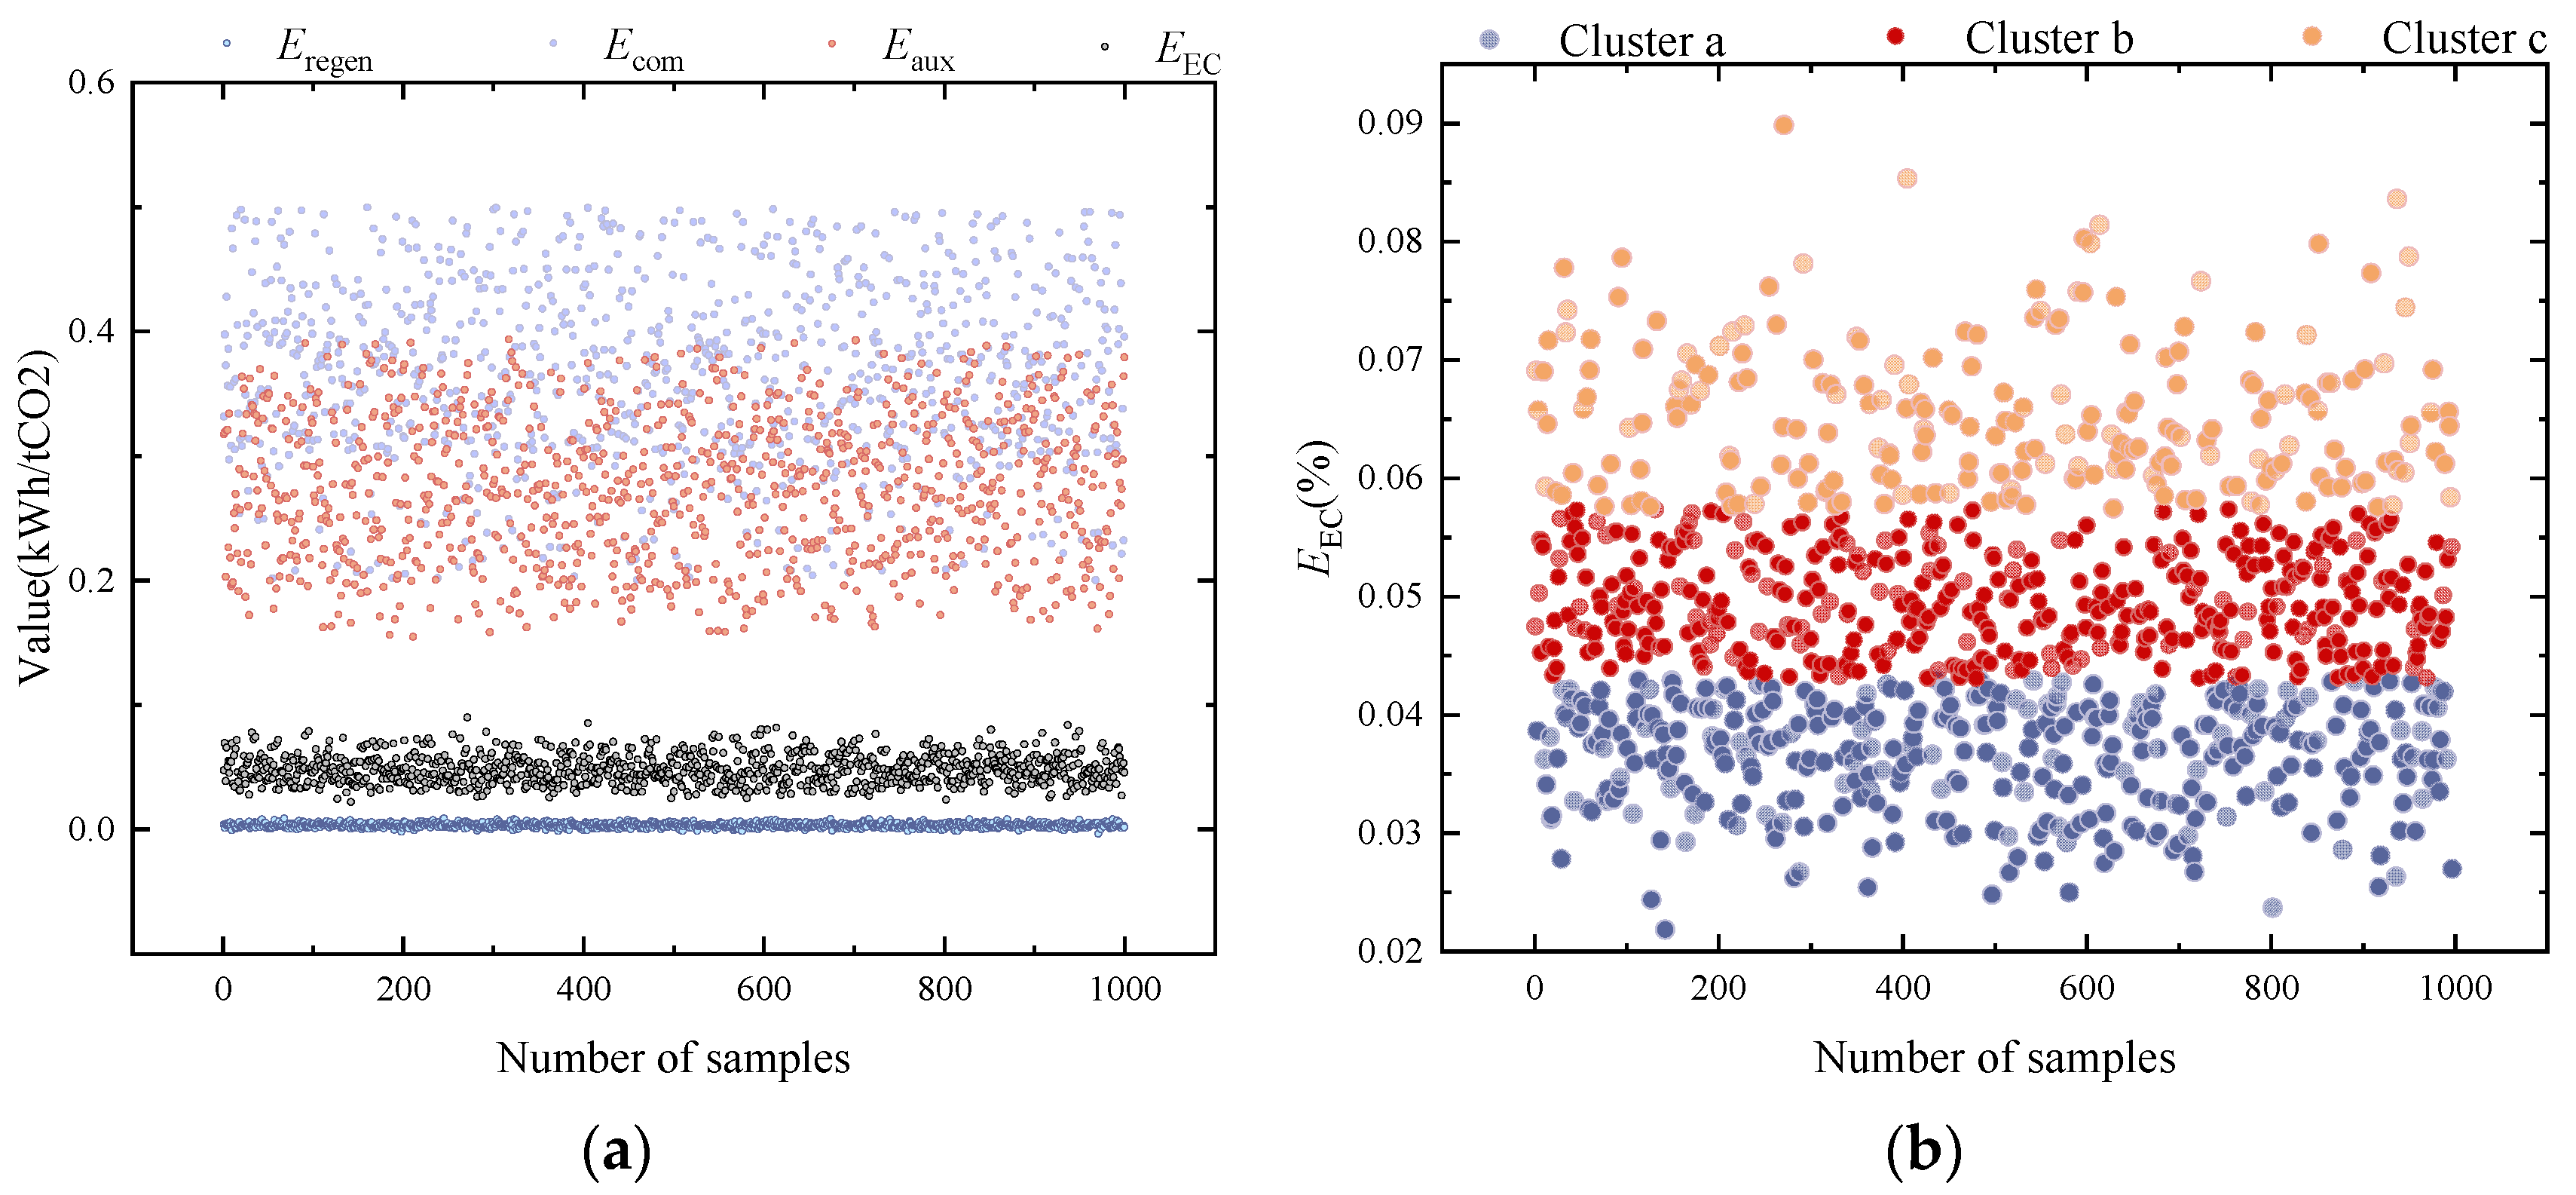
Figure 3.
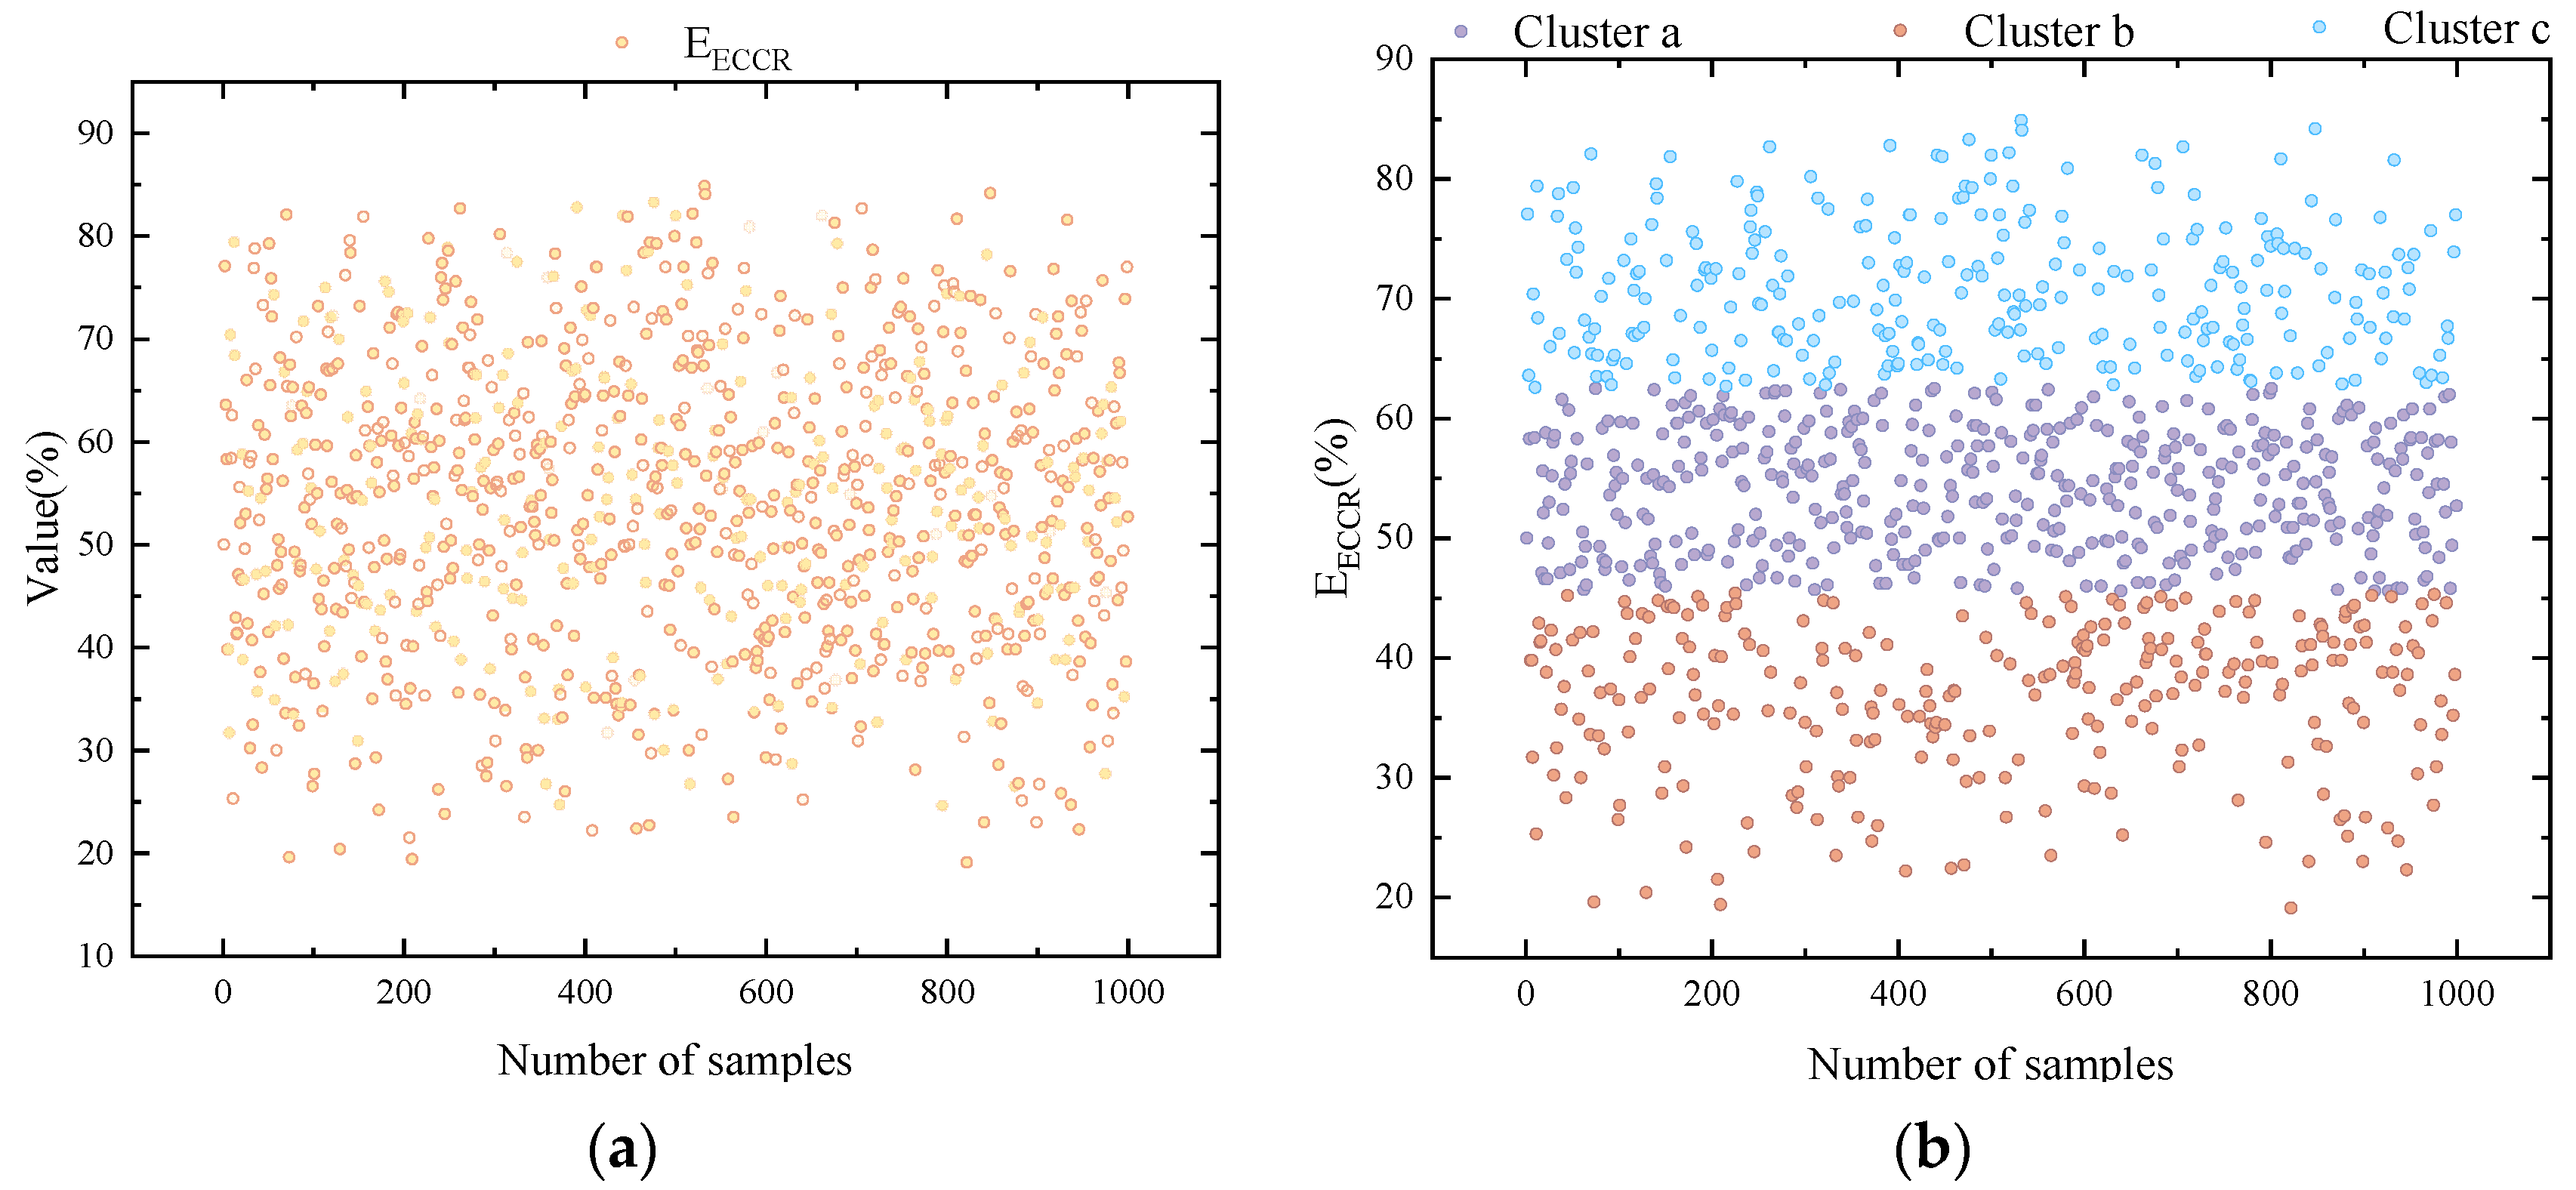
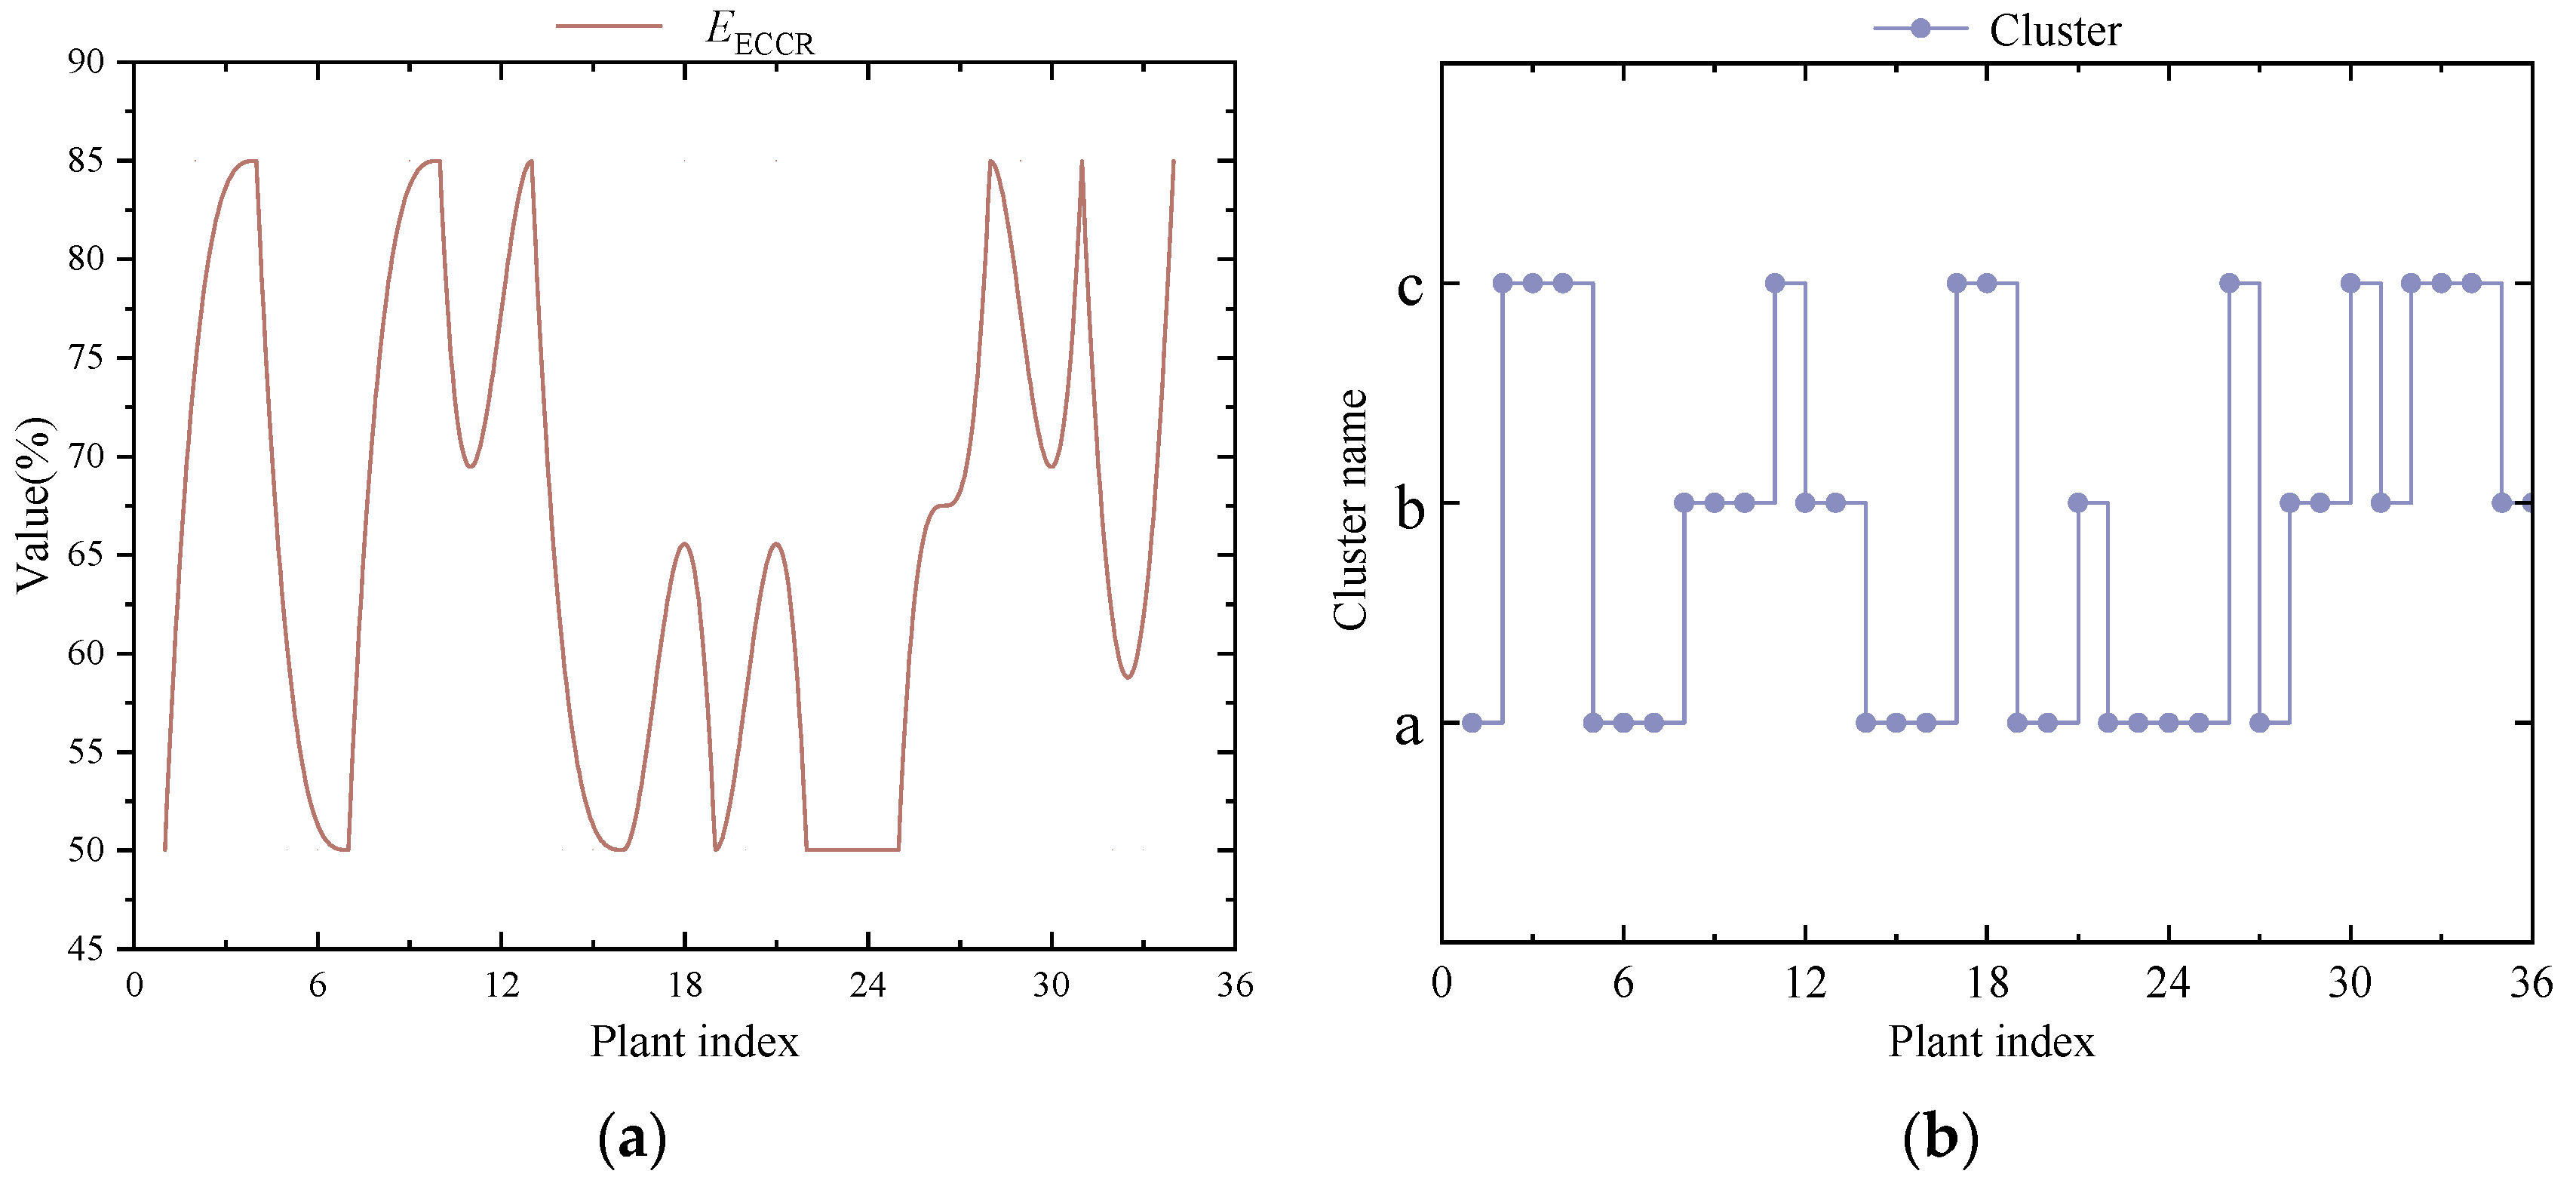
Figure 3 shows the evaluation system. K-means clustering is used for its efficiency and simplicity in classifying multidimensional CCUS performance data, enabling a clear interpretation and meaningful grouping. Its scalability and computational speed make it preferable over other clustering methods for large datasets. In the performance evaluation system of carbon capture technologies, this study employs the K-means clustering algorithm to conduct a multidimensional classification of carbon capture energy consumption and the carbon capture rate, enabling a systematic quantitative analysis of technological characteristics and energy efficiency relationships. By clustering technology samples with similar features into three categories, this approach effectively addresses the limitations of traditional single-indicator evaluation systems in capturing comprehensive performance. First,
EEC (GJ/tCO
2) and
EECCR (%) are standardized using the Z-score method to eliminate the influence of dimensional differences on the clustering results.
where
represents the original value of the
i-th sample for the
j-th feature (either
EEC or
EECCR),
and
are the mean and standard deviation of the
j-th feature, respectively, and
is the standardized value after applying Z-score normalization.
The Euclidean distance is used as the similarity metric.
where
m represents the number of feature dimensions.
Determine the optimal number of clusters using the elbow method:
where
represents the
i-th cluster,
is the centroid of the
i-th cluster, and
is the sample vector.
The iterative computation continues until the centroid stability reaches the threshold.
where
represents the
i-th cluster, and
denotes the centroid of the
i-th cluster at the
g-th iteration.
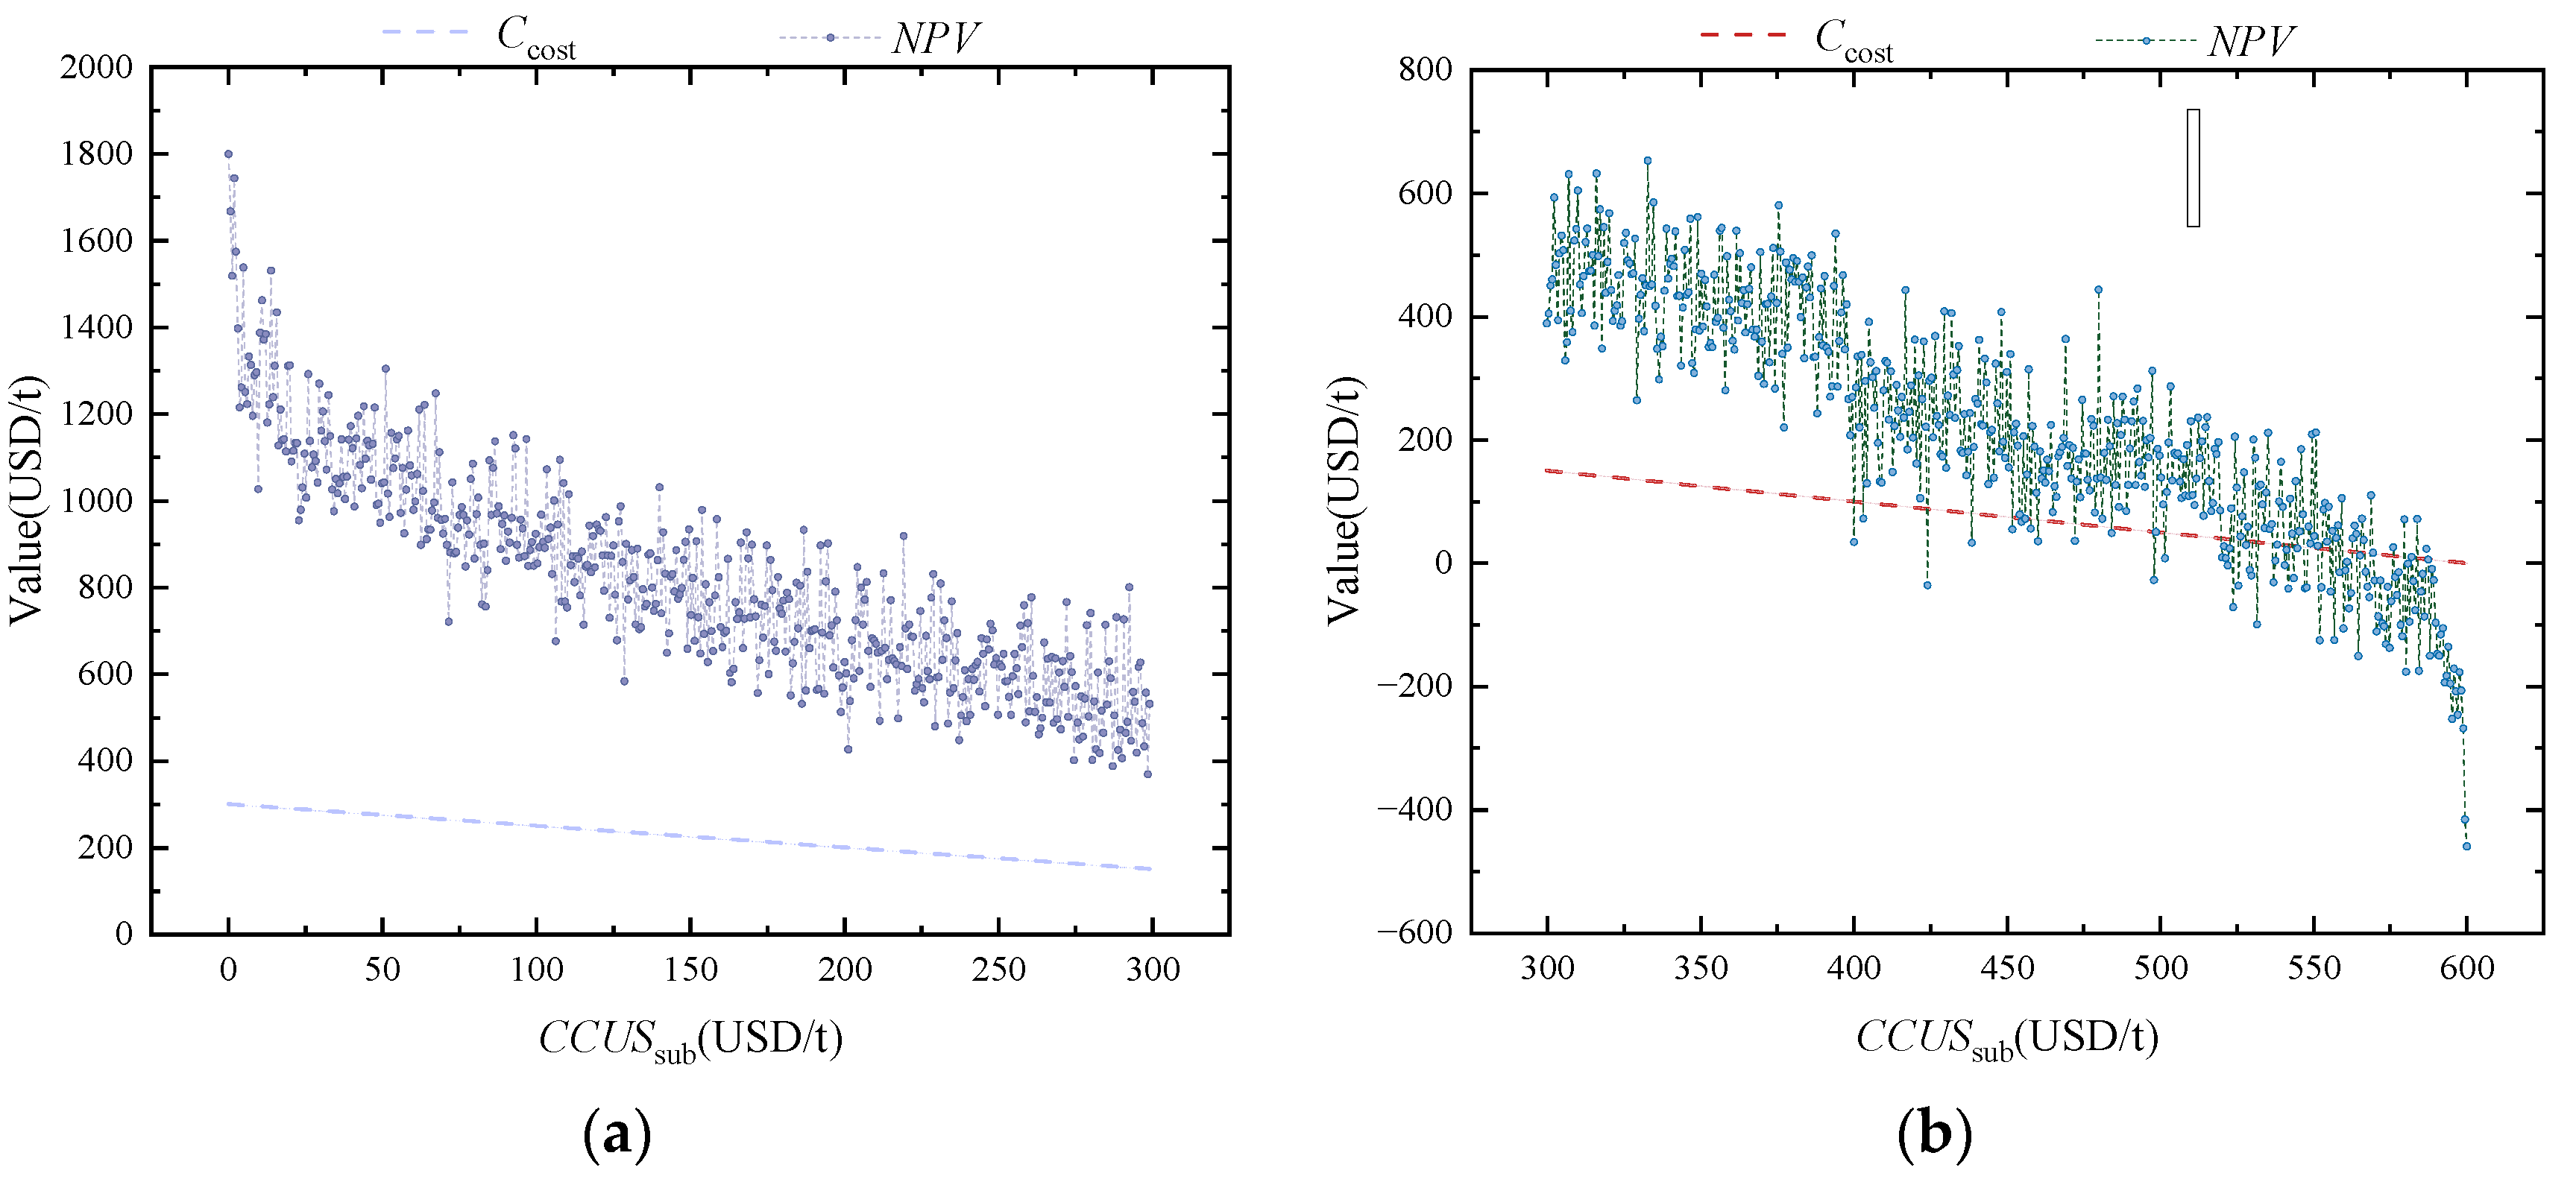
In the economic evaluation of CCUS projects, NPV and LAC serve as core indicators, providing a scientific basis for policy formulation from the perspectives of financial feasibility and full life-cycle costs, respectively. This study designs comparative scenarios of high carbon price–low subsidy and low carbon price–high subsidy to quantify the differential impacts of various policy combinations on technology pathway selection and economic performance using dynamic probabilistic models. Unlike the LC indicator, which focuses solely on unit capture costs, LAC emphasizes net social abatement costs, incorporating environmental performance factors such as the capture efficiency, system marginal emissions, and carbon leakage risks into its calculations.
Under the dynamic evaluation framework, Monte Carlo simulations and K-means clustering analysis reveal threshold effects among policy instruments: market mechanisms significantly drive technological upgrades in high-carbon-price scenarios, while high subsidy policies exhibit stronger incentivizing effects during the early stages of technology deployment. Through 10,000 path simulations, it is observed that when the carbon price exceeds 400 USD/ton, the LAC of solvent absorption technology begins to undercut that of membrane separation technology, validating the scientific rationale behind the combined strategy of “tiered carbon pricing + phased subsidy withdrawal”.


