Abstract
With the increasing penetration of renewable energy and the large-scale integration of electric vehicles (EVs), the economic optimization dispatch of EV-integrated virtual power plants (VPPs) faces multiple uncertainties and challenges. This paper first proposes an optimized dispatching model for EV clusters to form large-scale coordinated regulation capabilities. Subsequently, considering diversified resources such as energy storage systems and photovoltaic (PV) generation within VPPs, a low-carbon economic optimization dispatching model is established to minimize the total system operation costs and polluted gas emissions. To address the limitations of traditional algorithms in solving high-dimensional, nonlinear dispatching problems, this paper introduces a plant root-inspired growth optimization algorithm. By simulating the nutrient-adaptive uptake mechanism and branching expansion strategy of plant roots, the algorithm achieves a balance between global optimization and local fine-grained search. Compared with the genetic algorithm, particle swarm optimization algorithm and bat algorithm, simulation results demonstrate that the proposed method can effectively enhance the low-carbon operational economy of VPPs with high PV, ESS, and EV penetration. The research findings provide theoretical support and practical references for optimal dispatch of multi-stakeholder VPPs.
1. Introduction
With the rapid development of renewable energy, energy storage and electric vehicles, virtual power plants and microgrids, as an important way to integrate distributed energy resources, play an important role in improving energy utilization efficiency and promoting the consumption of renewable energy [1,2]. However, the economic optimal scheduling of virtual power plant/microgrid systems with electric vehicle/energy storage faces many challenges, such as the uncertainty of renewable energy output, the randomness of charging demand of electric vehicle, multi-time-scale coupling and so on [3,4,5].
A VPP/microgrid system comprises various types of distributed energy resources (DERs), such as photovoltaic power generation, wind power generation, electric vehicles and energy storage systems [6]. Due to the distinct output characteristics and control methods of these resources, as well as the uncertainty and randomness associated with renewable energy output and EV charging demands, the optimization and scheduling of such VPP/microgrid systems necessitate higher levels of flexibility and robustness [7,8,9].
Reference [10] proposed a multi-time-scale coordinated optimization framework to address the issue of the coupling of different time scales in VPP/microgrids. However, this method faces high computational complexity when dealing with large-scale systems. Reference [11] focused on the charging demand of electric vehicles (EVs) and presented a deep learning-based method for predicting EV charging loads. Nevertheless, acquiring the necessary data for this method in practical applications is relatively difficult. Reference [12] proposed a robust optimization-based scheduling method to address the uncertainty of renewable energy output in VPP/microgrids. This method utilizes probability distributions to describe renewable energy output and reduces computational complexity through scenario generation and reduction techniques. However, this approach tends to be overly conservative, resulting in lower economic efficiency [13,14,15,16,17]. Reference [18] introduced an optimization scheduling method based on mixed-integer linear programming (MILP), which can simultaneously consider electric vehicle (EV) charging demands and operational constraints of energy storage systems. This method performs well when solving optimization problems for small-scale systems, but it still faces high computational complexity when dealing with large-scale systems. Reference [19] proposed a multi-time-scale optimization method based on dynamic programming, which enhances computational efficiency by decomposing complex problems into multiple sub-problems. However, these methods still have limitations when dealing with nonlinear and non-convex problems.
Economic optimal dispatch is a core issue in the operation of virtual power plants and microgrids, with the objective of minimizing operational costs or maximizing economic benefits while satisfying various constraints [20,21,22,23]. Traditional optimization methods, such as linear programming and nonlinear programming, often face challenges such as high computational complexity and slow convergence when dealing with these complex problems. Intelligent optimization algorithms, such as genetic algorithms (GAs), particle swarm optimization (PSO) and bat algorithms (BA), have been widely applied in the field of complex system optimization due to their powerful global search capabilities and robustness [24]. Reference [25] proposed an improved GA that enhances the convergence speed and optimization effectiveness by introducing adaptive crossover and mutation probabilities. Their research demonstrates that this method exhibits good performance in solving the optimal dispatch problem for microgrids that include electric vehicles. On the other hand, Reference [26] introduced a multi-objective optimization method based on PSO, which can simultaneously consider economic and environmental benefits. However, these methods still face the issue of low computational efficiency when dealing with large-scale systems.
In recent years, the simulated plant root growth optimization algorithm, as a novel intelligent optimization algorithm, has been widely applied in the field of complex system optimization due to its powerful global search capability and robustness [27,28,29,30]. This algorithm effectively explores the solution space by simulating the growth process of plant roots seeking nutrients and water in the soil, making it particularly suitable for solving nonlinear, multi-modal optimization problems. The simulated plant root growth optimization algorithm demonstrates promising application prospects in the economic optimal dispatch of virtual power plants/microgrids that include electric vehicles/energy storage. Reference [31] was the first to apply this algorithm to the economic dispatch problem in power systems, and their research demonstrated that the algorithm exhibits good performance in solving complex economic dispatch problems. Reference [32], on the other hand, applied the algorithm to the optimal dispatch problem of microgrids with renewable energy sources, further enhancing the algorithm’s performance by introducing an adaptive mechanism.
GAs explore the solution space through crossover and mutation operations, but they are prone to becoming trapped in local optima. Adjusting parameters such as the crossover rate, mutation rate and population size is necessary, yet this parameter-tuning process relies heavily on experience and is time-consuming. BAs require the adjustment of parameters like loudness and pulse rate, exhibiting high parameter sensitivity. Improper parameter settings can easily lead to inefficient search performance. In PSO, particles tend to converge towards both individual and global optima, resulting in a rapid loss of diversity. Moreover, the algorithm’s performance is significantly influenced by the inertia weight, necessitating dynamic adjustment strategies. In contrast, the simulated plant root growth algorithm dynamically adjusts its growth direction based on resource distribution, reducing the reliance on parameters. By combining the deep penetration of the main root (exploitation) with the extensive expansion of lateral roots (exploration), it can avoid premature convergence. Additionally, its branching strategy naturally supports hierarchical exploration in multi-dimensional spaces. These characteristics make the simulated plant root growth algorithm superior to GA, BA and PSO in complex optimization problems, particularly in dynamic environments and high-dimensional scenarios [30,31,32].
To effectively address the multiple challenges faced in the economic optimal dispatch of virtual power plants/microgrids with electric vehicles/energy storage, a bio-inspired optimization approach for low-carbon dispatch in EV-integrated virtual power plants is proposed in this paper. The main contributions of this paper are as follows:
- (1)
- An optimized dispatch model for EV clusters is established to form large-scale coordinated regulation capabilities.
- (2)
- Considering diversified resources such as ESSs and photovoltaic (PV) generation within VPPs/microgrids, a low-carbon economic optimization dispatch model is established aiming to minimize the total system operation costs and harmful gas emissions.
- (3)
- By simulating the nutrient-adaptive uptake mechanism and branching expansion strategy of plant roots, a plant root-inspired growth optimization algorithm is adopted to address the limitations of traditional algorithms in solving high-dimensional, nonlinear dispatch problems.
2. Optimal Scheduling Model of Electric Vehicle Cluster Charging and Discharging
2.1. The Charging Model of EVs
The arrival time and departure time of electric vehicles are random, and the probability density function of the arrival time of electric vehicles can be described as [2]
where represents the time when EV arrives at the charging station; and are the standard deviation and mean value of EV arrival time at charging station, respectively; is the probability density function of the arrival time of EV.
The charging demand of electric vehicles is related to the driving distance, and it is generally considered to obey the probability density function based on lognormal distribution, which can be described as [3]
where represents the daily driving distance; and are the standard deviation and mean value of EV daily driving distance, respectively; is the probability density function of the daily driving distance of EV.
The charging demand of electric vehicles can be described as follows [3]:
where SOC is the state of charge for EV; is the maximum limit of SOC; is the initial state of SOC; is the daily driving distance of the k-th electric vehicle; w is the power consumption per unit mileage; is the battery capacity of electric vehicle; N is the total number of electric vehicles; is the charging demand of the k-th electric vehicle; is the total charging demand.
2.2. The Model of EV Cluster Regulation Ability
For a single electric vehicle, the charging and discharging model when it is connected to the grid is as follows:
where is the charging power of electric vehicle in time t; is the discharging power of electric vehicle in time t; and are the upper limits of the charging power and discharging powers of the electric vehicle, respectively; and are the battery power of the electric vehicle at time t and time t + 1; and are the lower limit and upper limits of the battery power of the electric vehicle, is the charging efficiency, and is the discharging efficiency; is the charging or discharging time interval.
In this paper, the scheduling capacity of the aggregated electric vehicle cluster is calculated by the Minkowski method, and Minkowski’s expression is as follows [4]:
where X and Y are two Euclidean spaces; x is the element in space X; y is the element in space Y; is the Minkowski summation process of a space.
The cluster includes all the electric vehicles participating in the dispatching; when each vehicle is connected to the grid, it meets the mathematical model of charging and discharging:
where is a variable of 0–1 obtained according to the grid connection and off-grid time of electric vehicles; when the value of is 1, it means that electric vehicles are connected to the grid, and when the value of is 0, it means that electric vehicles are disconnected to the grid; t is the period of time; and are the arrival time and departure time of the n-th electric vehicle, respectively.
The charging and discharging model of electric vehicles is extended to the whole time span, so as to realize the Minkowski summation of the whole cluster. The expanded mathematical model of a single electric vehicle is as follows:
where is the charging power of the n-th electric vehicle in time t; is the discharging power of the n-th electric vehicle in time t; and are the battery power of the n-th electric vehicle at time t and time t + 1.
is transformed and decomposed into the following three equations:
where is the battery power of the n-th electric vehicle arriving at the charging station, and is the battery power of the n-th electric vehicle leaving the charging station.
When the electric vehicle is connected to the network, it satisfies the condition of , and when the electric vehicle is off the network, it satisfies the condition of , so the time can be extended to the whole period to satisfy Minkowski additivity:
Then, the Minkowski summation of the whole electric vehicle cluster is
where N is the cluster of electric vehicles.
2.3. The Constraints of Electric Vehicle Cluster Regulation
When the electric vehicle is charging, the charging rate should not exceed the rated power of the charging pile, and the controller can adjust the charging rate [6]:
where is the rated power of the charging pile.
The battery SOC of EVs should be in the range of 20~90% of its battery capacity:
where is the SOC of the n-th electric vehicle.
3. Multi-Resource Model of Virtual Power Plant/Microgrids
3.1. Scheduling Model of Energy Storage Systems
In this paper, the electrochemical energy storage battery is used as distributed energy storage. When the distributed energy storage absorbs electric energy from the power grid—that is, it acts as a power load—the corresponding charging model is as follows [13]:
where and represent the electric energy stored in the n-th storage battery at time t and time t − 1; represents the charging power of the n-th storage battery at time t; represents the initial electric energy stored in the n-th battery; represents the charging efficiency of the battery.
When distributed energy storage releases electric energy to the power grid—that is, when it acts as a distributed power supply—the corresponding discharge model is as follows [13]:
where represents the discharging efficiency of the battery; represents the discharging power of the n-th storage battery at time t.
When there is no electric energy flowing between the distributed energy storage and the power grid—that is, it is in an idle state:
The constraint conditions of energy storage battery are as follows [13]:
where and represent the maximum charging and discharging power of the n-th storage battery; and represent the electric energy stored in the n-th storage battery at the initial time and end time; represent the energy storage capacity; and represent the maximum and minimum values of the energy–storage ratio.
3.2. Gas Turbine Model
Gas turbine is a common power generation equipment, which generates high-temperature and high-pressure gas by burning gas to drive the wheel to rotate and then generate mechanical energy, which is then converted into electrical energy. The model of gas turbine is as follows [15]:
where Pgas(t) is the output power of the gas turbine at time t; ηgt is the power generation efficiency; Lgas is the low calorific value of natural gas; Vgas(t) is the volume of natural gas consumed at time t.
3.3. Photovoltaic Power Generation Model
The output power of photovoltaic power generation is related to the light intensity and the uncertainty often described by Beta distribution. The probability distribution function of light intensity is as follows [33]:
where is the probability distribution function of light intensity; is the light intensity; is the mean value of light intensity; β is the standard deviation value of light intensity.
The output power of photovoltaic generation is as follows:
where is the output power of photovoltaic power generation; is the rated active power of photovoltaic power generation; is the loss coefficient; is the solar radiation intensity at time t; is the standard radiation intensity of the sun; is the temperature coefficient of photovoltaic cell; is the temperature of the photovoltaic cell at time t; is the standard temperature.
4. Low-Carbon and Economic Optimal Dispatching Method for VPPs
4.1. Objective Function of Virtual Power Plant/Microgrids
This paper aims at minimizing the total operating cost of the system and constructs the corresponding scheduling model. The costs during VPP operations include photovoltaic power generation operation cost, gas turbine operation cost, light rejection penalty cost, energy storage system operation cost, cost of electric vehicles participating in demand response and interaction cost between the VPP and distribution network. The objective function is as follows:
where is the total operating cost of the system; is the photovoltaic power generation operation cost; is the gas turbine operation cost; is the light rejection penalty cost; is the energy storage system operation cost; is the cost of electric vehicles participating in demand response; is the interaction cost between the VPP and distribution network.
The calculation expressions of various costs are as follows:
where is the operating cost coefficient of photovoltaic; is the photovoltaic output power in time t; and are the power management cost coefficient and fuel cost coefficient of gas turbine; is the penalty cost coefficient of abandoning light; is discarding power of photovoltaic in time t; is the operating cost coefficient of energy storage; is the compensation coefficient of electric vehicles participating in demand response; is the power of electric vehicles participating in demand response; is the price of electricity purchased from the power grid; is the power purchased from the power grid.
In addition, this paper also considers the minimum emission of polluted gas as the objective function to realize the low-carbon economic operation of the system. The polluted gas emissions considered in this paper comprise CO2, NOx and SOx emitted by natural gas and electric energy sources:
where , and represent the emission conversion coefficients (g/m3) for CO2, NOx and SOx emitted by natural gas; represents the natural gas conversion coefficient (m3/kWh); represents the power generation efficiency of the gas turbine; , and represent the emission conversion coefficients (g/kWh) for CO2, NOx and SOx emitted by electric energy; is the transformer efficiency.
4.2. Plant Root-Inspired Growth Optimization Algorithm
In this paper, the algorithm for simulating plant root growth first requires a clear understanding of the basic meanings represented by five terms: fibrous roots, adventitious roots, lateral roots, taproots and the soil space for root growth. Fibrous roots and adventitious roots serve as search agents in the solution space for the plant root algorithm, representing the basic units for exploring the solution space. Lateral roots originate from fibrous roots, integrating the nutrients absorbed by the previously grown fibrous roots, with the nutrients absorbed by a certain fibrous root during the current growth phase, promoting the growth of lateral roots. Taproots emerge from fibrous roots and lateral roots, integrating the nutrients absorbed by the previously grown fibrous roots and lateral roots, with the nutrients absorbed by a certain fibrous root located on them during the current growth phase, promoting the growth of the taproot. The soil space, in the context of the algorithm for simulating plant root growth, represents the solution space for solving the target problem.
Assuming that there are N fiber roots randomly distributed on a taproot plant—that is, {X1, X2, …, XN}—the fiber roots can not only absorb nutrients from the soil but also independently explore nutrient-rich areas in the soil, so each fiber root can be regarded as a tentative solution of the optimization problem, and the corresponding soil space can be regarded as the solution space of the target problem. The mathematical model of fiber root growth in soil space is
where Seed1 represents the i-th fiber root growing at the time t; indicates the i-th adventitious root at the time t; Xbest indicates that the best fiber root in history has been searched so far; Xr1 represents the fiber root randomly selected from the N fiber roots growing at the time t; is the random number in the interval of (−0.5, 1.5).
The mathematical model of lateral root growth in soil space is
where Seed2 represents the nutrient absorbed by the lateral root at the time t + 1; means that the average value of nutrients absorbed by all fiber roots growing; represents the fiber roots randomly selected from the N fiber roots growing at the time t; is the random number in the interval of (−1, 1).
The mathematical model of taproot growth in soil space is
where Seed3 represents the nutrients absorbed by the taproot at the time t + 1; is the whole soil space (that is, the search space of the target problem); u and l are the upper and lower bounds of the problem space, respectively; is a random integer number of 0 or 1.
The root growth of fibrous root plants can be modeled as follows:
where Seed4 the i-th fibrous root growing at the time t; Xc represents the nutrients absorbed by the current adventitious root to guide the other rhizomes to diffuse and grow in the soil; ∈ (0, 1) indicates that Xc has found a nutrient region in the soil, and when = 0, it indicates that Xc has not found a nutrient region in the soil; r3 and r4 are random integers selected from the interval (1, N) and r3 ≠ r4; represents the local optimal solution.
The realization steps of solving complex optimization problems based on the plant root-inspired growth optimization algorithm is as follows:
- Generate random values Xi for N fib roots based on that upper bound u and the lower bound l of the problem space, wherein i = 1, 2, …, N;
- Calculate the fitness value f(Xi) of each Xi according to the objective function;
- For each fiber root in the problem space, and Xc of all fiber roots can be calculated;
- For all fiber roots in the problem space, global optimal individuals Xbest; local optimal individuals and random individuals Xr1, Xr2, Xr3 and Xr4 can be selected;
- Generate random numbers α1, α2, α3 and α4;
- Set p = 0.5 and generate a random number rand; if p > rand, go to step (7); otherwise, go to step (8);
- Calculate the root growth of main root plants based on Formulas (25)–(27);
- Calculate the root growth of fibrous root plants based on Formulas (28) and (29);
- Check the newly generated root boundary and limit it in the allowable problem space;
- The fitness value f(Seedi) of the newly generated root is calculated by using the target problem, and the newly generated individuals Seedi with better fitness values are used to replace the original individuals with poor fitness values;
- When the iterative condition is satisfied, output the global optimal solution Xbest and its fitness value f(Xbest).
4.3. The Calculation Flow Chart of the Low-Carbon and Economic Optimal Dispatching Method for VPP
The calculation flow chart of the low-carbon and economic optimal dispatching method for VPPs is shown in Figure 1.
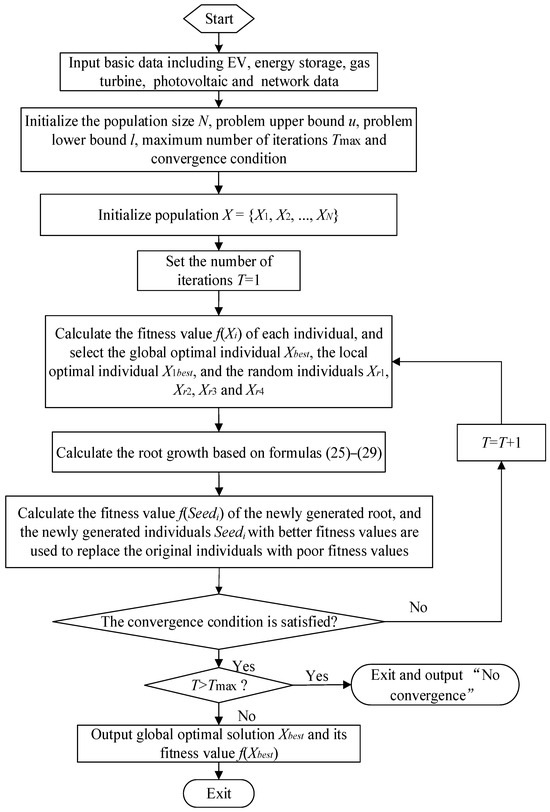
Figure 1.
The calculation flow chart of the low-carbon and economic optimal dispatching method for VPPs.
5. Numerical Test and Analysis
5.1. Basic Data and Simulation Conditions
In order to verify the effectiveness of the method proposed in this paper, a simulation experiment was carried out on an actual microgrid in Western China based on the simulation platform of MATLAB R2014a. For the plant root-inspired growth optimization algorithm, the initial step size of the algorithm was set to 0.5 units, the main root branching probability was set to 0.2, the lateral root branching angle was set to 75 degrees, the resource sensitivity was set to 0.8 (strong moisture guidance) and the stopping condition of the algorithm was set to depth > 3 units. The actual configuration of the microgrid is shown in Figure 2. Relevant simulation parameters can be found in Reference [30]. Additionally, the theoretical model of electric vehicle cluster is established in the second part of the paper, and then, the charging and discharging of the electric vehicle cluster is simulated based on the MATLAB simulation platform for numerical simulation.
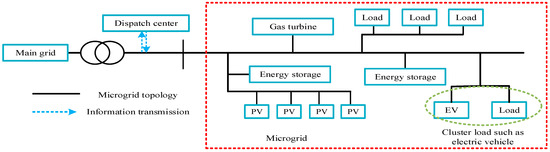
Figure 2.
The configuration of an actual microgrid in Western China.
The electricity purchase and gas purchase prices of the microgrid are shown in Table 1.

Table 1.
RP compensation scheme in the wet season.
5.2. Simulation Results and Analysis
As the objective function of the method proposed in this paper includes the minimum operating cost and the minimum emission of polluted gases, it is a multi-objective function optimization problem, and the solution obtained is a Pareto solution set. In order to verify the effectiveness of the proposed method, the proposed method is compared with the GA, PSO algorithm and BA, and the Pareto optimization solution set is shown in Figure 3.
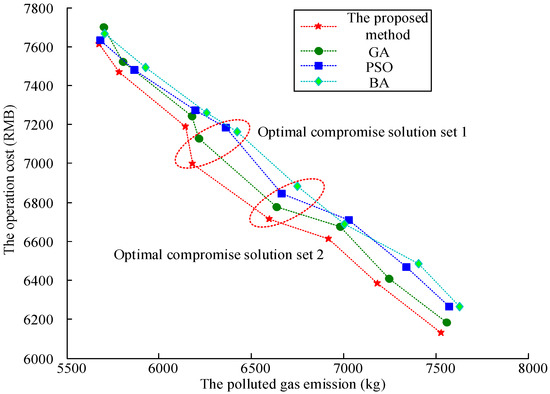
Figure 3.
The Pareto optimization solution set of various methods.
From the Pareto optimization solution set in Figure 3, it can be seen that, compared with the GA, PSO and BA, the Pareto optimization solution set of the proposed method has the smallest polluted gas emission and the best operation cost. However, the Pareto optimization solution set of the GA, PSO and BA has higher operation cost and polluted gas emission. In order to further compare the results obtained by each method in detail, this paper selects two optimal compromise solutions of each algorithm for comparison, as shown in Table 2.
Table 2.
Comparison of the optimal compromise solutions of various methods.
As can be seen from Table 2, for the GA method, in the optimal compromise solution set 1, the polluted gas emission and operating cost are 6215 kg and 7127 RMB, respectively; in the optimal compromise solution set 2, the polluted gas emission and operating cost are 6635 kg and 6779 RMB, respectively; for the PSO method, in the optimal compromise solution set 1, the polluted gas emission and operating cost are 6362 kg and 7184 RMB, respectively; in the optimal compromise solution set 2, the polluted gas emission and operating cost are 6663 kg and 6843 RMB, respectively; for the BA method, in the optimal compromise solution set 1, the polluted gas emission and operating cost are 6426 kg and 7161 RMB, respectively; in the optimal compromise solution set 2, the polluted gas emission and operating cost are 6748 kg and 6883 RMB, respectively; for the method proposed in this paper, in the optimal compromise solution set 1, the polluted gas emission and operating cost are 6183 kg and 6998 RMB, respectively; in the optimal compromise solution set 2, the polluted gas emission and operating cost are 6597 kg and 6713 RMB, respectively. By comparing the values in each column of Table 2, it can be found that the polluted gas emission and operation cost of the method proposed in this paper are the minimum, which further proves the effectiveness of the method proposed in this paper.
In order to further analyze the effect of electric vehicle cluster regulation in the demand response, and to reduce costs and increase efficiency for virtual power plants, this paper analyzes the influence through the change in load before and after the demand response, as shown in Figure 4.
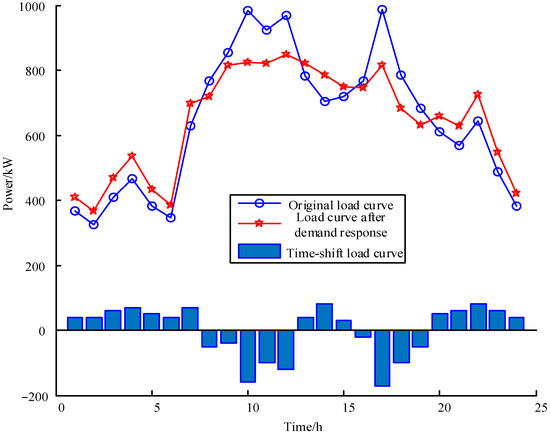
Figure 4.
The effect of electric vehicle cluster regulation in the demand response.
As shown in Figure 4, under the demand response of electric vehicle (EV) cluster regulation, the load curve after the demand response approaches the load during the off-peak periods of the power grid. While maintaining the total electric load unchanged, it reduces the peak-to-valley difference and the fluctuation range, fulfilling the role of a virtual power plant in peak shaving and valley filling. Moreover, the peak load power is significantly lower than the original load power, which helps improve the load factor, reduce energy losses and enhance the efficiency of power transmission and transformation equipment.
To further compare the effects of peak shaving and valley filling and the changes in load factor, Table 3 presents the maximum and minimum loads of the system, as well as the load factor values, before and after the demand response (DR).
Table 3.
Comparison of the power load under the demand response regulation.
It can be seen from Table 3 that the peak load changed from 986 kW to 847 kW, decreased by 139 kW, and the valley load changed from 326 kW to 366 kW, increased by 40 kW, under the condition of keeping the total power consumption of the system unchanged at 15,536 kWh. By restraining the peak load and raising the valley load, the load fluctuation was suppressed, which made the peak–valley difference of the load change from 560 kW to 381 kW, decreased by 179 kW, and the load fluctuation tended to be stable. The load factor changed from 65.65% to 76.43%, increased by 10.78%; therefore, the operating efficiency of the system was improved.
6. Conclusions
To effectively address the multiple challenges faced in the economic optimal dispatch of VPP/microgrids with electric vehicles, a bio-inspired optimization approach for low-carbon dispatch in EV-integrated virtual power plants is proposed in this paper. An optimized dispatching model for EV clusters is established to form large-scale coordinated regulation capabilities. Considering diversified resources such as ESS and PV generation within VPPs, a low-carbon economic optimization dispatch model is established aiming to minimize the total system operation costs and harmful gas emissions, and the plant root-inspired growth optimization algorithm is adopted to address the limitations of traditional algorithms in solving high-dimensional, nonlinear dispatch problems. Compared with genetic algorithm, particle swarm optimization algorithm and bat algorithm, the simulation results demonstrate that the proposed method can effectively enhance the low-carbon operational economy of VPP/microgrids with high PV, ESS and EV penetration. The research findings provide theoretical support and practical references for the optimal dispatch of multi-stakeholder VPP/microgrids.
As the dynamics and scale of distributed resources in VPPs increase, issues such as heightened computational complexity, as well as the heterogeneity and model incompatibility of various resources within VPPs, have emerged. This paper will subsequently focus on conducting further research to address these problems.
Author Contributions
Conceptualization, R.G., K.S., B.Z. and H.Z.; methodology, R.G., K.S., B.Z. and H.Z.; software, R.G., K.S., B.Z. and H.Z.; writing—original draft preparation, R.G., K.S., B.Z. and H.Z. All authors have read and agreed to the published version of the manuscript.
Funding
This research received no external funding.
Data Availability Statement
The original contributions presented in this study are included in the article. Further inquiries can be directed to the corresponding author.
Conflicts of Interest
The authors declare no conflicts of interest.
References
- Stenstadvolden, A.; Stenstadvolden, O.; Zhao, L.; Kapourchali, M.H.; Zhou, Y.; Lee, W.-J. Data-Driven Analysis of a NEVI-Compliant EV Charging Station in the Northern Region of the U.S. IEEE Trans. Ind. Appl. 2024, 60, 5352–5361. [Google Scholar] [CrossRef]
- Ko, H.; Kim, T.; Jung, D.; Pack, S. Software-Defined Electric Vehicle (EV)-to-EV Charging Framework with Mobile Aggregator. IEEE Syst. J. 2023, 17, 2815–2823. [Google Scholar] [CrossRef]
- Mishra, D.; Singh, B.; Panigrahi, B.K. Bi-Directional EV Charging with Robust Power Controlled Adaptive Phase-Shift Algorithm. IEEE Trans. Veh. Technol. 2023, 72, 15491–15501. [Google Scholar] [CrossRef]
- Sun, C.; Wang, R.; Sun, Q.; Zhang, H. A Novel Synchronous Rectification Scheme with Low Computational Burden for LLC Resonant Converter in EV Charger Applications. IEEE Trans. Ind. Electron. 2023, 70, 8991–9003. [Google Scholar] [CrossRef]
- Zhang, Y.; Sun, P.; Ji, X.; Yang, M.; Ye, P. Low-Carbon Economic Dispatch of Integrated Energy Systems Considering Full-Process Carbon Emission Tracking and Low Carbon Demand Response. IEEE Trans. Netw. Sci. Eng. 2024, 11, 5417–5431. [Google Scholar] [CrossRef]
- Patel, N.; Lopes, L.A.C.; Rathore, A.; Khadkikar, V. A Soft-Switched Single-Stage Single-Phase PFC Converter for Bidirectional Plug-In EV Charger. IEEE Trans. Ind. Appl. 2023, 59, 5123–5135. [Google Scholar] [CrossRef]
- Zhang, J.; Che, L.; Shahidehpour, M. Distributed Training and Distributed Execution-Based Stackelberg Multi-Agent Reinforcement Learning for EV Charging Scheduling. IEEE Trans. Smart Grid 2023, 14, 4976–4979. [Google Scholar] [CrossRef]
- Mathuria, K.; Tiwari, H. Analysis, Design, and Implementation of an MPWM Interleaved DC–DC Converter with Voltage Doubler for EV Charging. IEEE J. Emerg. Sel. Top. Ind. Electron. 2024, 5, 511–520. [Google Scholar] [CrossRef]
- Zhang, Y.; Han, Y.; Liu, D.; Dong, X. Low-Carbon Economic Dispatch of Electricity-Heat-Gas Integrated Energy Systems Based on Deep Reinforcement Learning. J. Mod. Power Syst. Clean Energy 2023, 11, 1827–1841. [Google Scholar] [CrossRef]
- Rahimi, F.; Ipakchi, A.; Albuyeh, F.; Mokhtari, S. Enterprise DERMS: A universal virtual power plant management platform. IEEE Electrif. Mag. 2025, 13, 22–29. [Google Scholar] [CrossRef]
- Huang, R.; Cui, C.; Towey, D.; Sun, W.; Lian, J. VPP-ART: An Efficient Implementation of Fixed-Size-Candidate-Set Adaptive Random Testing Using Vantage Point Partitioning. IEEE Trans. Reliab. 2023, 72, 1632–1647. [Google Scholar] [CrossRef]
- Mohy-ud-din, G.; Muttaqi, K.M.; Sutanto, D. A Cooperative Energy Transaction Model for VPP Integrated Renewable Energy Hubs in Deregulated Electricity Markets. IEEE Trans. Ind. Appl. 2022, 58, 7776–7791. [Google Scholar] [CrossRef]
- Yan, N.; Ma, G.; Li, X.; Guerrero, J.M. Low-Carbon Economic Dispatch Method for Integrated Energy System Considering Seasonal Carbon Flow Dynamic Balance. IEEE Trans. Sustain. Energy 2023, 14, 576–586. [Google Scholar] [CrossRef]
- Liu, C.; Wang, C.; Yao, W.; Liu, C. Distributed Low-Carbon Economic Dispatching for Multiple Park-level Integrated Energy Systems Based on Improved Shapley Value. IEEE Trans. Ind. Appl. 2024, 60, 8088–8102. [Google Scholar] [CrossRef]
- Wang, Q.; Zhang, X.; Xu, Y.; Yi, Z.; Xu, D. A Low-Carbon Economic Dispatch Method for Power Systems with Carbon Capture Plants Based on Safe Reinforcement Learning. IEEE Trans. Ind. Inform. 2024, 20, 10542–10553. [Google Scholar] [CrossRef]
- Zhang, K.; Wang, X.; Yang, H.; Chen, Q.; Jiang, C.; Ke, J. Industrial Virtual Power Plants in Western Inner Mongolia: The potential to enhance grid flexibility and improve energy management. IEEE Electrif. Mag. 2025, 13, 90–100. [Google Scholar] [CrossRef]
- Guo, J.; Dou, C.; Yue, D.; Kuzin, V.; Zhang, Z.; Zhang, Z. A Cyber-Physical Collaboration Based Control Method for Frequency Regulation with VPP. IEEE Syst. J. 2024, 18, 746–757. [Google Scholar] [CrossRef]
- Korukonda, M.P.; Shahidehpour, M.; Xie, L. Cyber Resilience in Virtual Power Plants: A multiscale multilayer approach toward secure energy management. IEEE Electrif. Mag. 2025, 13, 54–65. [Google Scholar] [CrossRef]
- Majumder, S.; Khaparde, S.A.; Agalgaonkar, A.P.; Kulkarni, S.V.; Srivastava, A.K.; Perera, S. Chance-Constrained Pre-Contingency Joint Self- Scheduling of Energy and Reserve in VPP. IEEE Trans. Power Syst. 2024, 39, 245–260. [Google Scholar] [CrossRef]
- Mahani, K.; Farzan, F.; Masiello, R. Deployment of Virtual Power Plants for Electrification Enablement: Increasing hosting capacity to support electrification. IEEE Electrif. Mag. 2025, 13, 84–89. [Google Scholar] [CrossRef]
- Dai, Z.; Tan, M.; Yang, Y.; Liu, X.; Wang, R.; Su, Y. Massive Coordination of Distributed Energy Resources in VPP: A Mean Field RL-Based Bi-Level Optimization Approach. IEEE Trans. Cybern. 2025, 55, 1332–1346. [Google Scholar] [CrossRef] [PubMed]
- Hammerstrom, D.J. Spokane Eco-District Campus Performance Under Alternative Electricity Rates: Benefits for virtual power plant participants and suppliers. IEEE Electrif. Mag. 2025, 13, 42–53. [Google Scholar] [CrossRef]
- Lu, X.; Qiu, J.; Zhang, C.; Lei, G.; Zhu, J. Assembly and Competition for Virtual Power Plants with Multiple ESPs Through a “Recruitment–Participation” Approach. IEEE Trans. Power Syst. 2024, 39, 4382–4396. [Google Scholar] [CrossRef]
- Yang, L.; Sun, X.; Cao, X.; Chen, M.; Guan, X. Joint chance-constrained coordinated scheduling for electricity-heat coupled systems considering hydrogen storage. Energy Internet 2024, 1, 99–111. [Google Scholar] [CrossRef]
- de la Cruz, J.; Wu, Y.; Candelo-Becerra, J.E.; Vásquez, J.C.; Guerrero, J.M. Review of Networked Microgrid Protection: Architectures, Challenges, Solutions, and Future Trends. CSEE J. Power Energy Syst. 2024, 10, 448–467. [Google Scholar]
- Wang, W.; Huo, Q.; Liu, Q.; Ni, J.; Zhu, J.; Wei, T. Energy Optimal Dispatching of Ports Multi-Energy Integrated System Considering Optimal Carbon Flow. IEEE Trans. Intell. Transp. Syst. 2024, 25, 4181–4191. [Google Scholar] [CrossRef]
- Chen, Q.; Wang, X.; Feng, C.; Li, C.; Zheng, K. Empowering the Grid Edge to Think: Applications of Artificial Intelligence for Virtual Power Plants in China. IEEE Power Energy Mag. 2024, 22, 66–77. [Google Scholar] [CrossRef]
- Saha, D.; Bazmohammadi, N.; Lashab, A.; Vasquez, J.C.; Guerrero, J.M. Power and Energy Management System of a Lunar Microgrid—Part II: Optimal Sizing and Operation of ISRU. IEEE Trans. Aerosp. Electron. Syst. 2024, 60, 1376–1385. [Google Scholar] [CrossRef]
- Peng, J.; Fan, B.; Yang, Q.; Liu, W. Fully Distributed Discrete-Time Control of DC Microgrids with ZIP Loads. IEEE Syst. J. 2022, 16, 155–165. [Google Scholar] [CrossRef]
- Peng, J.; Fan, B.; Liu, W. Voltage-Based Distributed Optimal Control for Generation Cost Minimization and Bounded Bus Voltage Regulation in DC Microgrids. IEEE Trans. Smart Grid 2021, 12, 106–116. [Google Scholar] [CrossRef]
- Pirrone, S.R.M.; Del Dottore, E.; Sibille, L.; Mazzolai, B. A Methodology to Investigate the Design Requirements of Plant Root-Inspired Robots for Soil Exploration. IEEE Robot. Autom. Lett. 2023, 8, 3438–3445. [Google Scholar] [CrossRef]
- Zheng, Z.; Li, J.; Liu, X.; Huang, C.; Hu, W.; Xiao, X.; Zhang, S.; Zhou, Y.; Yue, S.; Zong, Y. A De-aggregation strategy based optimal co-scheduling of heterogeneous flexible resources in virtual power plant. Appl. Energy 2025, 383, 125404. [Google Scholar] [CrossRef]
- Agarwal, A.; Vashishtha, V.K.; Mishra, S.N. Solar Tilt Measurement of Array for Building Application and Error Analysis. Int. J. Renew. Energy Res. 2012, 2, 781–789. [Google Scholar]
Disclaimer/Publisher’s Note: The statements, opinions and data contained in all publications are solely those of the individual author(s) and contributor(s) and not of MDPI and/or the editor(s). MDPI and/or the editor(s) disclaim responsibility for any injury to people or property resulting from any ideas, methods, instructions or products referred to in the content. |
© 2025 by the authors. Licensee MDPI, Basel, Switzerland. This article is an open access article distributed under the terms and conditions of the Creative Commons Attribution (CC BY) license (https://creativecommons.org/licenses/by/4.0/).