Article

Pre-Failure Deformation Response and Dilatancy Damage Characteristics of Beishan Granite Under Different Stress Paths

1
State Key Laboratory of Disaster Prevention and Mitigation of Explosion & Impact, Army Engineering University of PLA, Nanjing 210007, China
2
Nanjing Urban Construction Management Group Co., Ltd., Nanjing 210006, China
*
Author to whom correspondence should be addressed.
Processes 2025, 13(6), 1892; https://doi.org/10.3390/pr13061892
Submission received: 21 April 2025 / Revised: 3 June 2025 / Accepted: 11 June 2025 / Published: 15 June 2025

Abstract

Different from general underground engineering, the micro-damage prior to failure of the surrounding rock has a significant influence on the geological disposal of high-level radioactive waste. However, the quantitative research on pre-failure dilatancy damage characteristics and stress path influence of hard brittle rocks under high stress levels is insufficient currently, and especially, the stress path under simultaneous unloading of axial and confining pressures is rarely discussed. Therefore, three representative mechanical experimental studies were conducted on the Beishan granite in the pre-selected area for high-level radioactive waste (HLW) geological disposal in China, including increasing axial pressure with constant confining pressure (path I), increasing axial pressure with unloading confining pressure (path II), and simultaneous unloading of axial and confining pressures (path III). Using the deviatoric stress ratio as a reference, the evolution laws and characteristics of stress–strain relationships, deformation modulus, generalized Poisson’s ratio, dilatancy index, and dilation angle during the path bifurcation stage were quantitatively analyzed and compared. The results indicate that macro-deformation and the plastic dilatancy process exhibit strong path dependency. The critical value and growth gradient of the dilatancy parameter for path I are both the smallest, and the suppressive effect of the initial confining pressure is the most significant. The dilation gradient of path II is the largest, but the degree of dilatancy before the critical point is the smallest due to its susceptibility to fracture. The critical values of the dilatancy parameters for path III are the highest and are minimally affected by the initial confining pressure, indicating the most significant dilatancy properties. Establish the relationship between the deformation parameters and the crack-induced volumetric strain and define the damage variable accordingly. The critical damage state and the damage accumulation process under various stress paths were examined in detail. The results show that the damage evolution is obviously differentiated with the bifurcation of the stress paths, and three different types of damage curve clusters are formed, indicating that the damage accumulation path is highly dependent on the stress path. The research findings quantitatively reveal the differences in deformation response and damage characteristics of Beishan granite under varying stress paths, providing a foundation for studying the nonlinear mechanical behavior and damage failure mechanisms of hard brittle rock under complex loading conditions.

1. Introduction

As fission nuclear energy technology continues to advance and gain widespread adoption, the safe management and disposal of radioactive waste, particularly high-level waste (HLW), has emerged as a critical global challenge requiring immediate attention. Currently, deep geological disposal is widely regarded as a viable and secure solution [1]. China has identified the Beishan area in Gansu province as a pre-selected site for the geological disposal of HLW, due to its abundance of high-strength, low-porosity granite. Moreover, China′s first underground research laboratory (URL) is being intensively constructed in the region [2,3,4,5]. In underground engineering applications, including mining, transportation, and hydropower projects, the excavation and construction of deep hard rock tunnels frequently give rise to sudden and severe geological hazards, such as rockbursts, spalling, collapses, and instability issues [6,7,8,9,10,11,12,13,14,15]. For the special project of the HLW geological disposal repository, in addition to the potential safety issues mentioned above, the disturbance and damage caused by the excavation and unloading of the surrounding rock may also become a potential channel for nuclide migration, leading to the failure of geological isolation barriers and catastrophic consequences [16,17,18]. Consequently, investigating the deformation damage characteristics and mechanisms of Beishan granite is of significant importance.
Since rock excavation is inherently an unloading process, many researchers have extensively investigated the mechanical behavior of hard and brittle rocks, such as granite, under unloading conditions through true triaxial and conventional triaxial unloading tests. These studies focus on unloading response characteristics, including deformation, strength, failure, and energy, and systematically examine how unloading conditions, such as the unloading rate, stress level, and intermediate principal stress [19,20,21], as well as factors like aspect ratio and anisotropy [22,23], influence the mechanical behavior of rocks. Furthermore, advanced techniques, including acoustic emission (AE), computed tomography (CT), and nuclear magnetic resonance (NMR) [24,25,26], were employed to thoroughly investigate the damage and fracture mechanisms, as well as the evolution laws, of rocks during unloading.
From a mechanical standpoint, the issue of excavation unloading fundamentally falls under the category of stress path problems [27]. However, the mechanical behavior and response characteristics of rocks are influenced not only by their stress history but also are closely tied to the loading paths [28]. Consequently, stress changes and stress paths play a crucial role in assessing surrounding rock stability, designing support systems, and addressing other relevant aspects [29]. The differences in mechanical properties between the loading and unloading paths have been preliminarily investigated in the aforementioned literature [20,21,23,24]. Furthermore, other researchers have carried out significant explorations on the influence of different unloading paths and loading methods on the mechanical properties of hard brittle rocks. For instance, Feng et al. [30] investigated the strength, deformation, and failure mechanisms of Jinping marble under various loading and unloading stress paths using true triaxial compression tests, revealing substantial differences in the failure characteristics of different tunnel sections. Li et al. [31] and Zhao et al. [32] both examined the deformation and failure processes of granite under varying stress paths from an energy perspective, highlighting the path-dependent nature of its energy evolution characteristics and conversion mechanisms. Zhang et al. [33] further developed a nonlinear energy evolution model for rocks, considering the interaction between energy accumulation and dissipation mechanisms. Studies have demonstrated that the mechanical properties of rocks are influenced not only by their current stress state but also by the stress path leading to that state. Duan et al. [34] systematically investigated the impacts of stress paths and confining pressure on the mechanical properties and failure mechanisms of hard brittle sandstone, providing a detailed analysis of the progressive damage evolution under different loading paths. Chen et al. [35] performed a series of comparative experiments on crack propagation behavior, observing significant variations in crack propagation speed across different loading modes. The above research results deepen the understanding of the mechanical behavior of hard brittle rocks under different stress paths. However, the comparative analysis of rock response during loading and unloading mainly focuses on key features such as peak strength and failure point, and the quantitative description of its evolution process is relatively lacking. In addition, the comparison of different unloading paths mostly focuses on the influence of confining pressure unloading, and the effect of synchronous changes of other principal stress components is not fully considered.
Early studies have shown that the phenomenon of dilatancy is frequently observed in brittle rocks [36,37], serving as a key characteristic of rock deformation and failure processes and being closely linked to damage accumulation and significant failure events [38]. Consequently, some researchers have carried out both experimental and theoretical investigations into the dilatancy characteristics of hard rocks. Among them, Zheng et al. [39] investigated the deformation and failure characteristics of phyllite under unloading stress paths experimentally, revealing significant anisotropy in its post-peak dilatancy angle. Furthermore, by analyzing multi-scale failure characteristics, the underlying mechanism governing the evolution of the shear dilation angle was explored in greater depth. Zhang et al. [38] performed a comparative analysis of the dilatancy characteristics of hard rocks under various loading modes, including conventional triaxial compression, true triaxial compression, and cyclic loading–unloading. Additionally, a comprehensive rock dilatancy angle model was proposed, accounting for the effects of intermediate principal stress and plastic volumetric strain. Meng et al. [40] investigated the strength, deformation, and dilatancy characteristics of limestone under varying initial confining pressures and triaxial cyclic loading–unloading conditions. Additionally, a post-peak dilatancy angle model was developed, accounting for the influences of confining pressure and plastic shear strain. Arzúa et al. [41,42] examined the dilatancy characteristics of various intact and jointed granites under uniaxial and triaxial cyclic loading–unloading conditions, finding that their dilatancy behavior demonstrated a similar dependency on confining pressure and plastic shear strain, as observed in sedimentary and metamorphic rocks. Wu et al. [43] investigated the dilatancy characteristics of saturated sandstone under uniaxial and triaxial compression conditions, analyzing the impacts of confining pressure and pore pressure. Furthermore, a predictive model for the initial dilatancy stress was established. Salehnia et al. [44] proposed a variable dilation angle model based on plastic shear strain and applied it to the simulation of strain localization in the excavation damage zone of underground engineering. Walton et al. [45,46,47] conducted extensive uniaxial and triaxial compression tests on both marble and limestone and proposed a dilation angle model with separate treatment for dilatancy mobilization and decay. These research findings offer a foundational understanding of the dilatancy behavior in hard rocks. However, existing studies predominantly focus on the post-peak dilation effects, with limited attention given to the pre-peak dilatancy characteristics. Moreover, there remains a lack of systematic comparative analyses regarding the unloading paths without a peak and the evolution of dilatancy under diverse stress paths.
The Beishan underground laboratory consists of a spiral ramp, shaft, and horizontal roadway, forming a complex three-dimensional spatial structure [3]. In practical engineering applications, varying excavation methods and locations result in substantial differences in stress adjustment paths, as well as deformation and failure characteristics. Additionally, micro-damage prior to rock fracture significantly influences the geological disposal functionality for HLW. To address these challenges, considering the limitations of existing research on quantitatively comparing different stress paths and the evolution of dilatancy in hard rocks, Beishan granite is selected as the research subject. Mechanical tests under three representative stress paths are designed and conducted accordingly. A systematic analysis is performed on the macro deformation and plastic dilatancy evolution laws, along with their characteristics prior to rock failure. Based on the damage theory, the quantitative relationship between dilatancy and damage is further established, and the differences in dilatancy and damage evolution of Beishan granite under different stress paths and its confining pressure effect are revealed. This study provides a theoretical basis and technical support for further exploring the nonlinear mechanical behavior and damage failure mechanism of Beishan granite and other hard brittle rocks under complex stress paths.

2. Experiment Scheme

2.1. Specimen Preparation

The granite specimens were collected from the Beishan exploration tunnel (BET) test platform, which serves as a pre-research platform for the safety technologies related to the construction of underground laboratories for geological disposal of HLW in China [48]. It is situated in the Shiyuejing fault zone of the Jiujing section within the Beishan pre-selection area of Gansu province, where granite geological bodies are widely developed with large areas of rock foundations. Positioned in the shallow subsurface layer at a vertical depth of 50 m, the BET provides access to critical geological features for study. The exposed rock type is mainly monzogranite, which has a granite and blocky structure.
Horizontal drilling was carried out on the side wall of the “L-shaped” test chamber far from the fault zone to obtain complete homogeneous core specimens. Then, according to the recommended standards of the International Society for Rock Mechanics [49], cylindrical specimens measuring ϕ50 mm × 100 mm were processed coaxially, see Figure 1a–f. The Beishan granite specimen is in a natural water-bearing state, and the appearance is flesh red with grayish white. The mineral compositions of the granite were obtained by X-ray diffraction (XRD) and petrographic analysis: Pl (38.6%), Pf (30.1%), Qz (25.3%), Bi (2.5%), and Mu (3.5%) in Figure 2.

2.2. Experimental Equipment

The mechanical tests of Beishan granite under different stress paths in this article were conducted on the MTS815 rock mechanics test system at Sichuan University. The axial loading system can provide a maximum load of 4600 kN, and the triaxial pressure chamber can provide a confining pressure of up to 140 MPa [50]. The axial and radial deformations of the specimen were measured using an axial extensometer and a circumferential extensometer placed in the middle, with ranges of −2.5~5.0 mm and −2.5~8.0 mm, respectively, and the axial extensometer had a gauge length of 50 mm in Figure 1g–i.
The test system is equipped with a multi-channel Flex Test GT controller, which can not only directly control the load, but also control the loading process in the form of axial and circumferential displacement change rates. The axial displacement is measured and fed back through two built-in linear displacement sensors (LVDT), with a stroke of ±2.5 mm. The circumferential displacement control is measured and fed back by the circumferential extensometer, which can achieve a stable fracture of high-strength brittle rocks to obtain the post-peak curve [51].

2.3. Experimental Path

In engineering, the stress state of a rock mass will change under the action of construction, and the method of stress adjustment and change varies depending upon the excavation method, excavation area, section geometry, and stress environment [29,34]. Consequently, based on the existing research results [52,53,54,55], three representative stress paths, see Figure 3a, were selected to explore the influence of these paths on the mechanical properties of Beishan granite, in view of the evolution process of complex stress paths in the construction process of underground engineering surrounding rock. Specifically, path I (increasing axial pressure and constant confining pressure) corresponds to a conventional triaxial compression experiment, and is used to determine the stress level at the bifurcation point and obtain the mechanical response law under the loading path for comparison with other stress paths; path II (increasing axial pressure unloading confining pressure) simulates the situation of the stress change process of the surrounding rock at the vault caused by general tunnel excavation, where the maximum principal stress increases and the minimum principal stress decreases; and path III (unloading of axial and confining pressures) reflects the multi-directional unloading phenomenon at the high side walls, bifurcation tunnel, disposal pit, and other parts of underground caverns. The excavation scenarios of underground engineering, corresponding to the unloading paths (path II and III), are shown in Figure 3b.
In order to compare and study the mechanical response and damage evolution law of Beishan granite with a high stress level under different stress paths, three test paths are divided into a common path and a bifurcation path, with the bifurcation point as the boundary. Specifically, each test path adopts the same loading method before the bifurcation point and undergoes a common stress path, while after the bifurcation point, different loading and unloading methods are used to bifurcate into different stress paths. At the same time, considering the large number of cracks in actual engineering rock masses, their mechanical properties are different from intact rocks. Therefore, the axial stress level at the bifurcation point is taken as 80% of the peak deviatoric stress of conventional triaxial compression (path I) to study the mechanical properties of Beishan granite under different stress paths when internal microcracks have developed to a certain extent. According to the measured in situ stress conditions in the pre-selected area of Beishan, Gansu province [19,56], the initial confining pressures at the bifurcation point σ30 were taken as 15 MPa, 25 MPa, and 35 MPa, respectively. The initial stress conditions for each test rock specimen at the path bifurcation point are shown in Table 1.

2.4. Loading and Unloading Process

The common path follows the same loading control method: First, apply the hydrostatic pressure (σ1 = σ2 = σ3) at a rate of 3 MPa/min to the initial confining pressure design value, and then maintain the confining pressure stable. Subsequently, using the load control method, increase the axial pressure at a rate of 30 KN/min to the initial design value, and then the specimen reaches the initial stress state at the bifurcation point. The bifurcation path loading and unloading control methods are as follows:
(1)
Path I (increasing axial pressure and constant confining pressure)
Starting from the bifurcation point, the axial pressure is loaded using circumferential displacement control at a rate of 0.08 mm/min, while the confining pressure remains constant until failure to ensure smooth crossing of the peak value and obtain the full stress-strain curve.
(2)
Path II (increasing axial pressure and unloading confining pressure)
Starting from the bifurcation point, the axial pressure is loaded using a circumferential displacement control method at a rate of 0.04 mm/min, while the confining pressure is unloaded at a rate of 2 MPa/min. After the failure of the specimen, the unloading is immediately stopped, and the confining pressure is kept constant. The axial pressure continues to be applied until it does not decrease with the change of axial strain, and the test is stopped.
(3)
Path III (unloading axial pressure and confining pressure)
The axial load remains unchanged from the bifurcation point, and the confining pressure is gradually unloaded by hydrostatic pressure (σ1 = σ2 = σ3) at a rate of 2 MPa/min. The unloading is stopped immediately after the failure of the specimen, and the confining pressure is kept unchanged. It is converted into LVDT axial displacement control mode. The axial pressure is applied at a rate of 0.01 mm/min until it does not decrease with the axial strain, and the test is stopped.
It is worth mentioning that, considering the fast failure of path II, in order to prolong and stabilize the control process, the axial loading rate of path II is lower than that of path I. The test results show that rock under path II is still the most prone to failure, with the smallest development of plastic strain, so the difference in axial loading rate has little effect on the regularity and conclusions obtained from the comparative study in the article.

3. Experimental Result

3.1. Full Stress–Strain Curve

Figure 4 shows the stress–strain curves of different stress paths throughout the entire process, where ε1, ε3, and εv are the axial, radial, and volumetric strains, respectively, and εv = ε1 + 2ε3. The strains are all positive in compression and negative in tension.
(1)
Stress path I
The full process curve of the axial strain shows that the specimen has fewer primary defects, and the characteristics of the pre-peak curve are basically the same under different initial confining pressures. The nonlinear characteristics of the crack compaction and propagation stages are not significant, and the overall behavior is linear elastic. However, as the initial confining pressure increases, the curve gradually exhibits yield characteristics near the peak stress, and the shape of the post-peak curve gradually changes from mode II to mode I, reducing axial rebound deformation and rock brittleness. When the initial confining pressure is 35 MPa, there is a strain softening phenomenon in the post-peak stage. After significant deformation (strain limit is 0.0276), it eventually enters the residual stage, but it is still brittle failure, far from reaching the confining pressure condition of brittle–ductile transformation.
The radial strain curve generally shows an accelerated growth trend in the pre-peak stage, but its acceleration characteristics are relatively weak before the proportional limit, approximately exhibiting linear growth. In addition, the growth rate of radial strain affected by confining pressure is relatively low, significantly lower than axial strain. When approaching the peak point, the slope of the curve rapidly decreases, showing a clear trend of accelerated growth. In the post-peak stage, as the stress decreases, the radial strain continues to increase until the specimen reaches the ultimate failure state.
The volumetric strain curve first shows a slowing growth trend along the compression direction in the pre-peak stage and, then, turns to the dilatancy direction after reaching the maximum compaction point, exhibiting an accelerated dilatancy trend. Under different initial confining pressure conditions, the stress peak points are in a state of volume dilatancy, and in the post-peak failure stage, the volume continues to increase.
(2)
Stress path II
In the pre-peak stage, there is a significant linear relationship between axial strain and deviatoric stress, and the slope of the curve remains relatively constant after the bifurcation point. No yielding phenomenon was observed under different initial confining pressure conditions, showing strong elastic characteristics. In the post-peak stage, as the confining pressure decreases, the deviatoric stress undergoes a brittle drop, leading to the fracture of the specimen. After maintaining stable confining pressure, axial pressure continues to be applied, and the deviatoric stress slightly increases with the increase in axial strain. The curve shows a small strain strengthening characteristic, indicating that under the post-peak confining pressure holding condition, the rock still has a certain bearing capacity, and then the deviatoric stress falls again. Under different initial confining pressure conditions, rocks exhibit significant brittle failure characteristics, showing an overall trend of mode II curve development. However, as the initial confining pressure increases, its failure mode gradually evolves from direct brittle drop to multi-stage drop and eventually enters the strain-softening stage.
Before unloading, the radial strain curve has gradually deviated from a linear relationship. After unloading, the slope of the curve rapidly decreases and exhibits accelerated dilatancy characteristics along the unloading direction. However, because of the high stress level during unloading, the rock fractures after undergoing only small stress increments, resulting in a low radial strain value at the end of the unloading process. In the post-peak stage, with the occurrence of strain strengthening, brittle fracture, and strain softening, the radial strain increases rapidly.
Before unloading, the volumetric strain curve has begun to shift towards the direction of dilatancy. After unloading, its development rate further accelerates. However, when reaching the peak stress, the volumetric strain is still mainly in a compressed state, and the dilatancy characteristics are not yet obvious. In the post-peak stage, as the confining pressure further decreases, the rock gradually enters a state of volume dilatancy and shows a sharp increase trend before failure.
(3)
Stress path III
Under constant deviatoric stress, the axial strain curve does not show a clear peak point. After unloading, the axial strain continues to increase and forms a stress plateau. When the confining pressure drops to a certain level, the deviatoric stress rapidly decreases. Under low confining pressure (15 MPa) conditions, axial deformation exhibits significant rebound characteristics. However, as the initial confining pressure increases, the rebound strength gradually weakens. Nonetheless, under different initial confining pressure conditions, the axial strain curve still exhibits typical mode II characteristics, without entering the strain-softening stage, ultimately leading to severe brittle failure. The above results indicate that, due to the high stress level during the unloading process, the rock specimen has already suffered some degree of damage before unloading. When the confining pressure is released while maintaining a constant deviatoric stress, the axial strain does not gradually decrease according to the elastic theory calculation results or the deformation characteristics of unloading at low stress levels [57], until it sharply increases at the time of failure, but continues to increase from the beginning of unloading. This phenomenon indicates that cracks rapidly propagate during the unloading stage, causing compression deformation that exceeds unloading rebound deformation.
Before unloading, the radial strain and volumetric strain curves showed a clear trend of dilatation. After unloading, both curves extend in an approximately horizontal manner, but their growth rate significantly accelerates, and the magnitude of change far exceeds the axial strain. Prior to failure, the specimen undergoes significant lateral dilatancy, exhibiting a rapid dilatancy in volume.

3.2. Comparison of Stress–Strain During Path Bifurcation Stage

From the above analysis, it can be seen that, under different stress path conditions, the stress–strain relationship curve of the specimen exhibits diverse variation characteristics. Among these, path III does not show obvious stress peaks, but all paths exhibit significant brittle failure characteristics. Therefore, in order to compare the effects of different stress paths on the mechanical response and failure behavior of the specimens, taking into account the evolution process of the stress states and referring to the research method in references [58,59], the state before brittle fracture is uniformly defined as the critical state. Therefore, when determining the critical point, the stability and controllability of the experimental loading and unloading process are used as the standard, and the determination methods for each path are different. Among them, the confining pressure of path I remains constant, and the peak point of its deviatoric stress is the critical point. Path II increases the axial pressure while unloading the confining pressure before brittle fracture, and the testing machine automatically stops unloading the confining pressure immediately after the fracture. Therefore, the critical point is determined by the termination of the unloading of the testing machine. The deviatoric stress of path III remains constant before the brittle drop, so the critical point can be determined by the sudden change in deviatoric stress from constant to drop. Based on this, quantitative comparative analysis can be conducted for the bifurcation stage of the path (from the bifurcation point to the critical point).
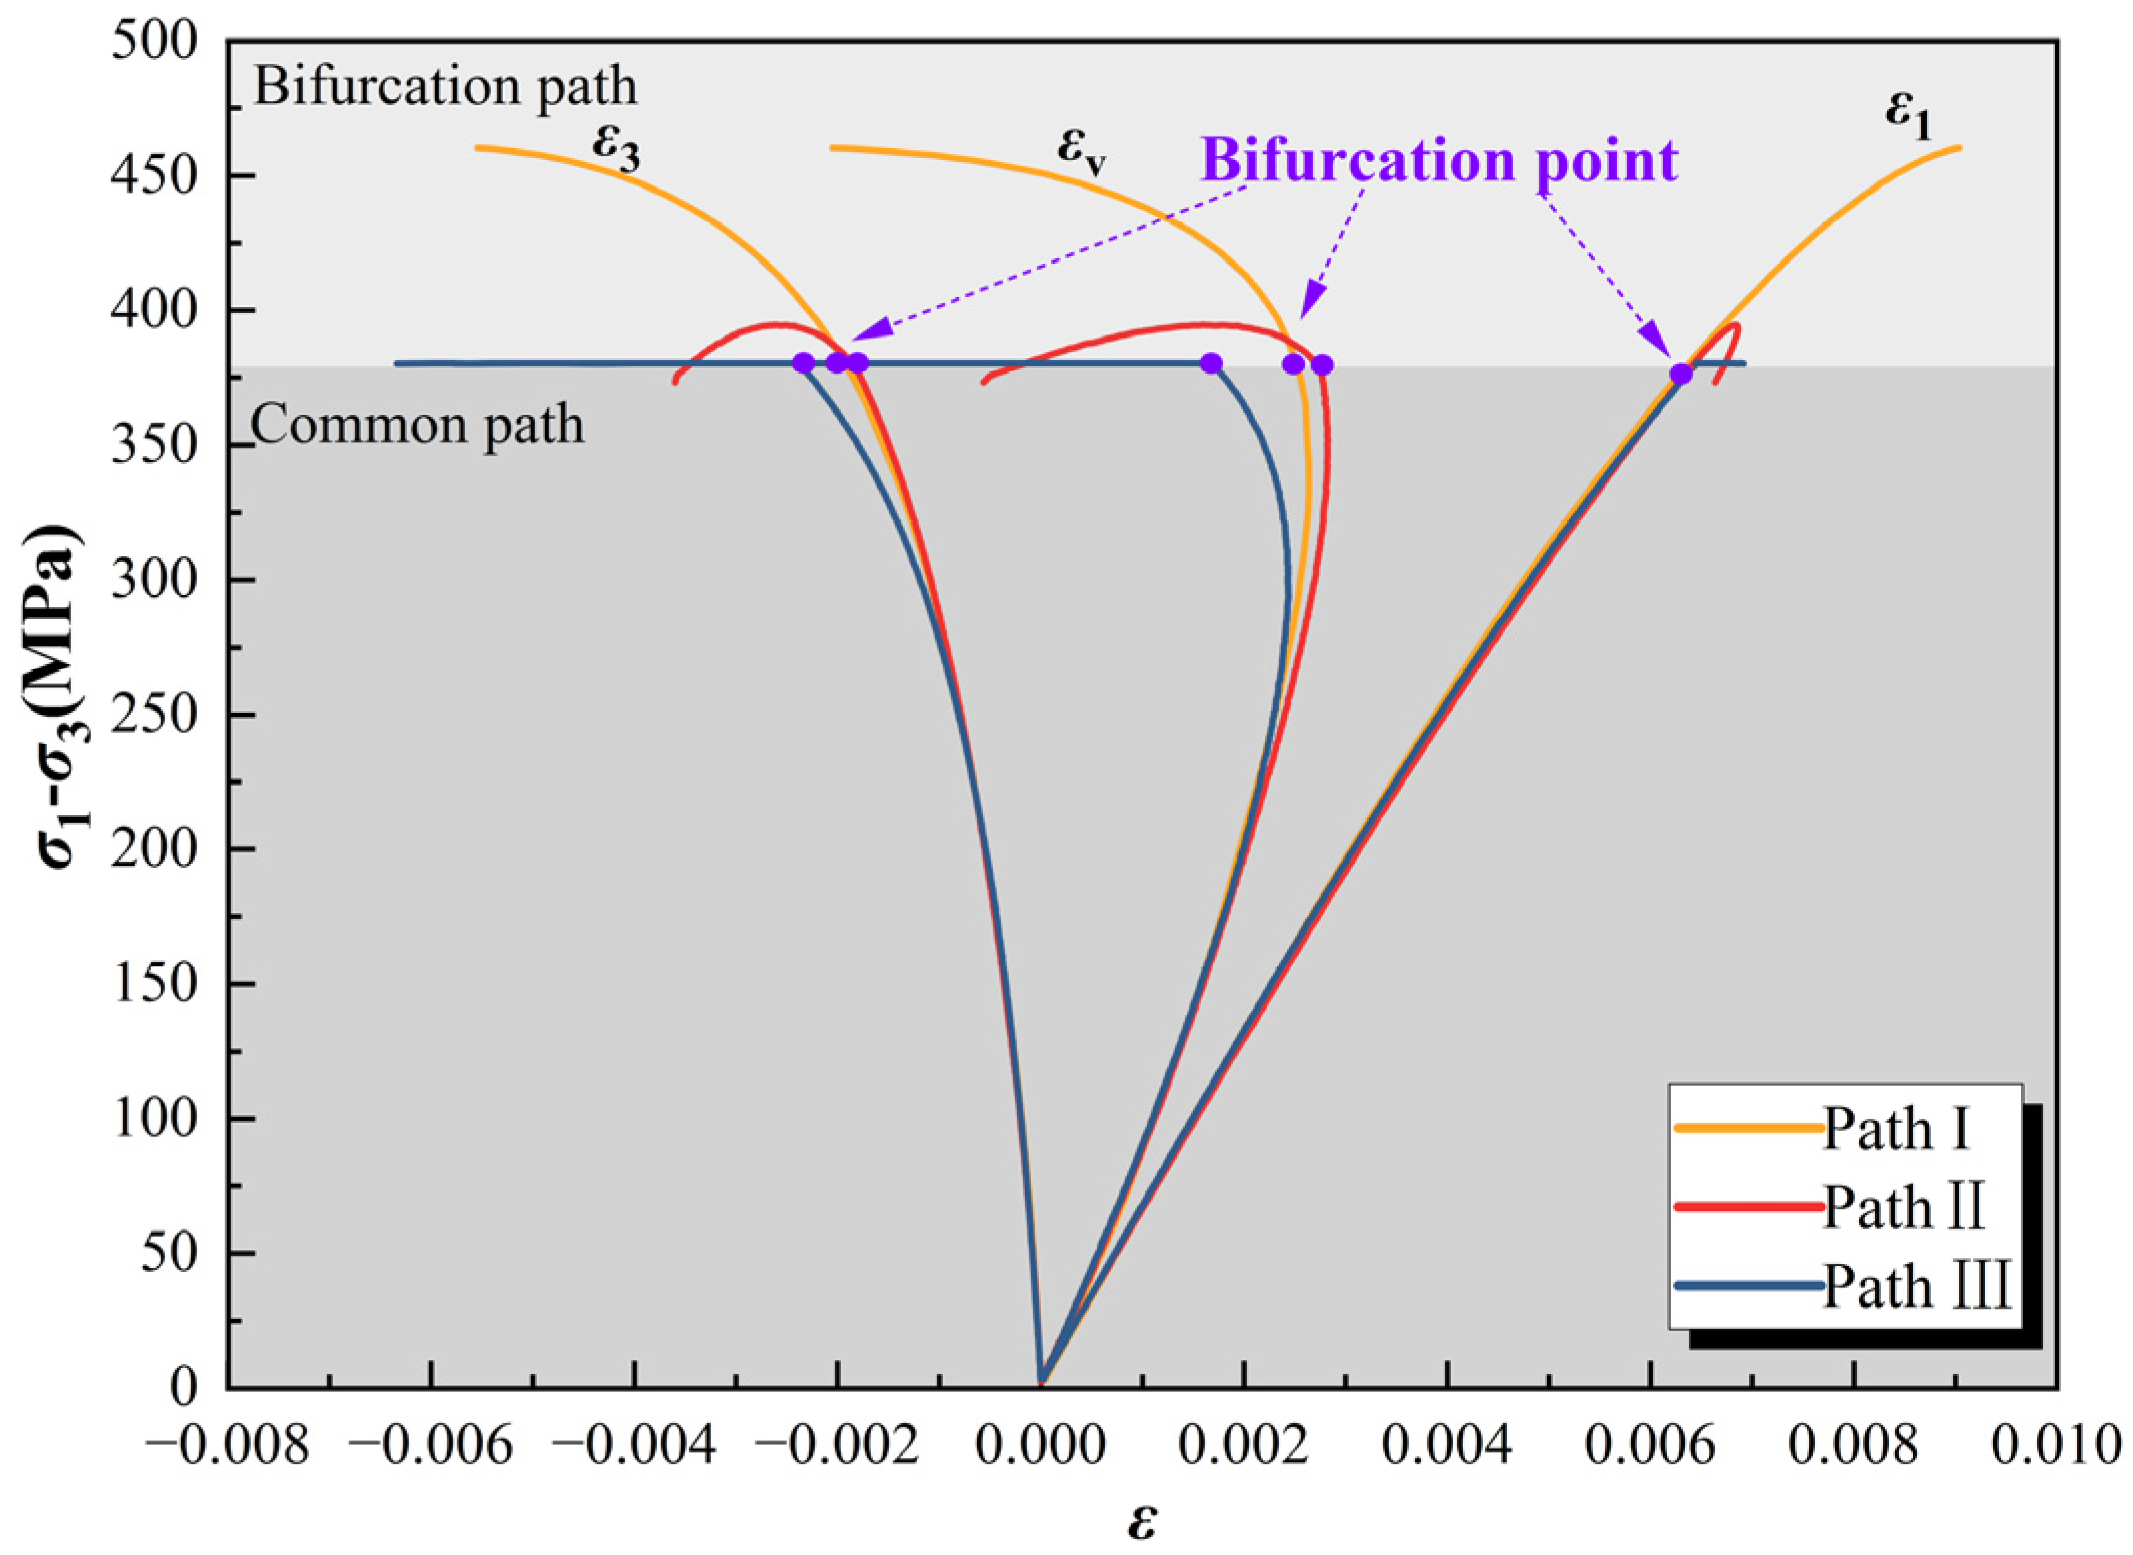
Figure 5 shows the stress–strain curves of different stress paths before the critical point under an initial confining pressure of 35 MPa. From this, it can be seen that, before the bifurcation point, due to the same stress paths, the curves basically coincide, especially the highly consistent linear elastic stage of each strain curve, indicating that the mechanical properties of the rock specimens used in the experiment are stable and have low discreteness. However, the curves during the bifurcation stage of the path show significant differences, exhibiting different mechanical response characteristics.
By analyzing the stress and strain values of the critical point in Table 2 and referring to Figure 4, it is evident that, under varying stress path conditions, the critical axial stress increases significantly with rising initial confining pressure. Additionally, the corresponding critical axial strain exhibits a near-linear growth trend. Furthermore, the critical radial strain exhibits a general upward trend as the initial confining pressure increases. The critical volumetric strain differs across the various paths. Specifically, for paths I and III, the critical volumetric strain progressively increases with a rising initial confining pressure, and the values are both below zero, suggesting that the sample is in an expanded state. Conversely, for path II, the critical volumetric strain progressively decreases with increasing initial confining pressure, and the values remain above zero, indicating the specimen is in a compressed state.
By comparing the critical stress–strain values of different paths under identical initial confining pressure conditions (with radial and volumetric strains defined as increasing in the dilatancy direction), the following observations can be made. The critical axial strain follows the order: path I > path III > path II; the critical radial strain follows: path III > path I > path II; and the critical volumetric strain also follows: path III > path I > path II. The critical axial stress exhibits the trend path I > path II > path III, with paths II and III demonstrating significantly lower critical axial stress than path I during the confining pressure unloading phase. Furthermore, the critical confining pressure follows the order: path I > path II > path III, suggesting that path II involves less confining pressure unloading at the time of failure compared to path III. Based on the aforementioned analysis of strain and stress under critical conditions, it can be inferred that rocks subjected to axial loading while unloading confining pressure are more susceptible to failure and display pronounced brittle behavior. Additionally, the deformation and dilatancy processes in these rocks do not fully develop prior to fracture.
Further analysis of the axial, radial, and volumetric strain increments (Table 2) during the bifurcation stage of the path reveals that, under different stress path conditions, each strain increment is affected to varying degrees by the initial confining pressure and shows an increasing trend with the increase in initial confining pressure. Among them, the confining pressure effect of path I is the most significant; The axial strain increment of path II is relatively small, and the influence of the confining pressure on it is not obvious. Meanwhile, the radial and volumetric strain increments are positively correlated with the initial confining pressure. When the initial confining pressure of path III increases to a certain level (35 MPa), its influence on the strain increments gradually weakens.
There is a close relationship between strain increment and stress path. Among them, the axial strain increment of path I is significantly higher than that of path II and path III, reaching 6.30–14.30 times and 4.17–8.35 times of the latter, respectively. The radial strain increment of path III is the largest, which is 1.20–2.06 times that of path I and 2.88–4.89 times that of path II, respectively. In addition, path III has the highest degree of dilatancy, which is 1.61–3.13 times that of path I and 2.90–4.66 times that of path II, respectively. Further analysis shows that, during the process of unloading confining pressure, regardless of whether the axial pressure increases or decreases, the axial strain increment before the critical point is significantly lower than path I, where the confining pressure remains constant and only increases the axial pressure (Figure 5). Especially in the case of unloading confining pressure while increasing the axial pressure, the axial strain increment is more limited. From this, it can be seen that changes in confining pressure have a significant impact on the development of axial strain. A decrease in confining pressure weakens the axial plastic deformation ability of the rock sample and further strengthens its brittle characteristics.

3.3. Relationship Between Various Strains

By comparing the absolute values of the different strain increments in Table 2, it can be found that, under various stress path conditions, the axial strain increment is smaller than the radial strain increment and the volumetric strain increment. Specifically, the axial strain increment of path I is relatively large, ranging from 55.23% to ~73.78% of the radial strain increment, and gradually stabilizes with the increase in the initial confining pressure. The axial strain increment of path II is significantly lower than the radial strain increment, only ranging from 12.27% to ~21.62%; The axial strain increment of path III is the smallest, accounting for only 5.51%~10.96% of the radial strain increment, and this proportion increases with the increase in initial confining pressure. Radial deformation shows the most significant dominant role in path III. In summary, under different initial confining pressure conditions, the ratio relationship between axial and radial strain increments is as follows: path I > path II > path III.
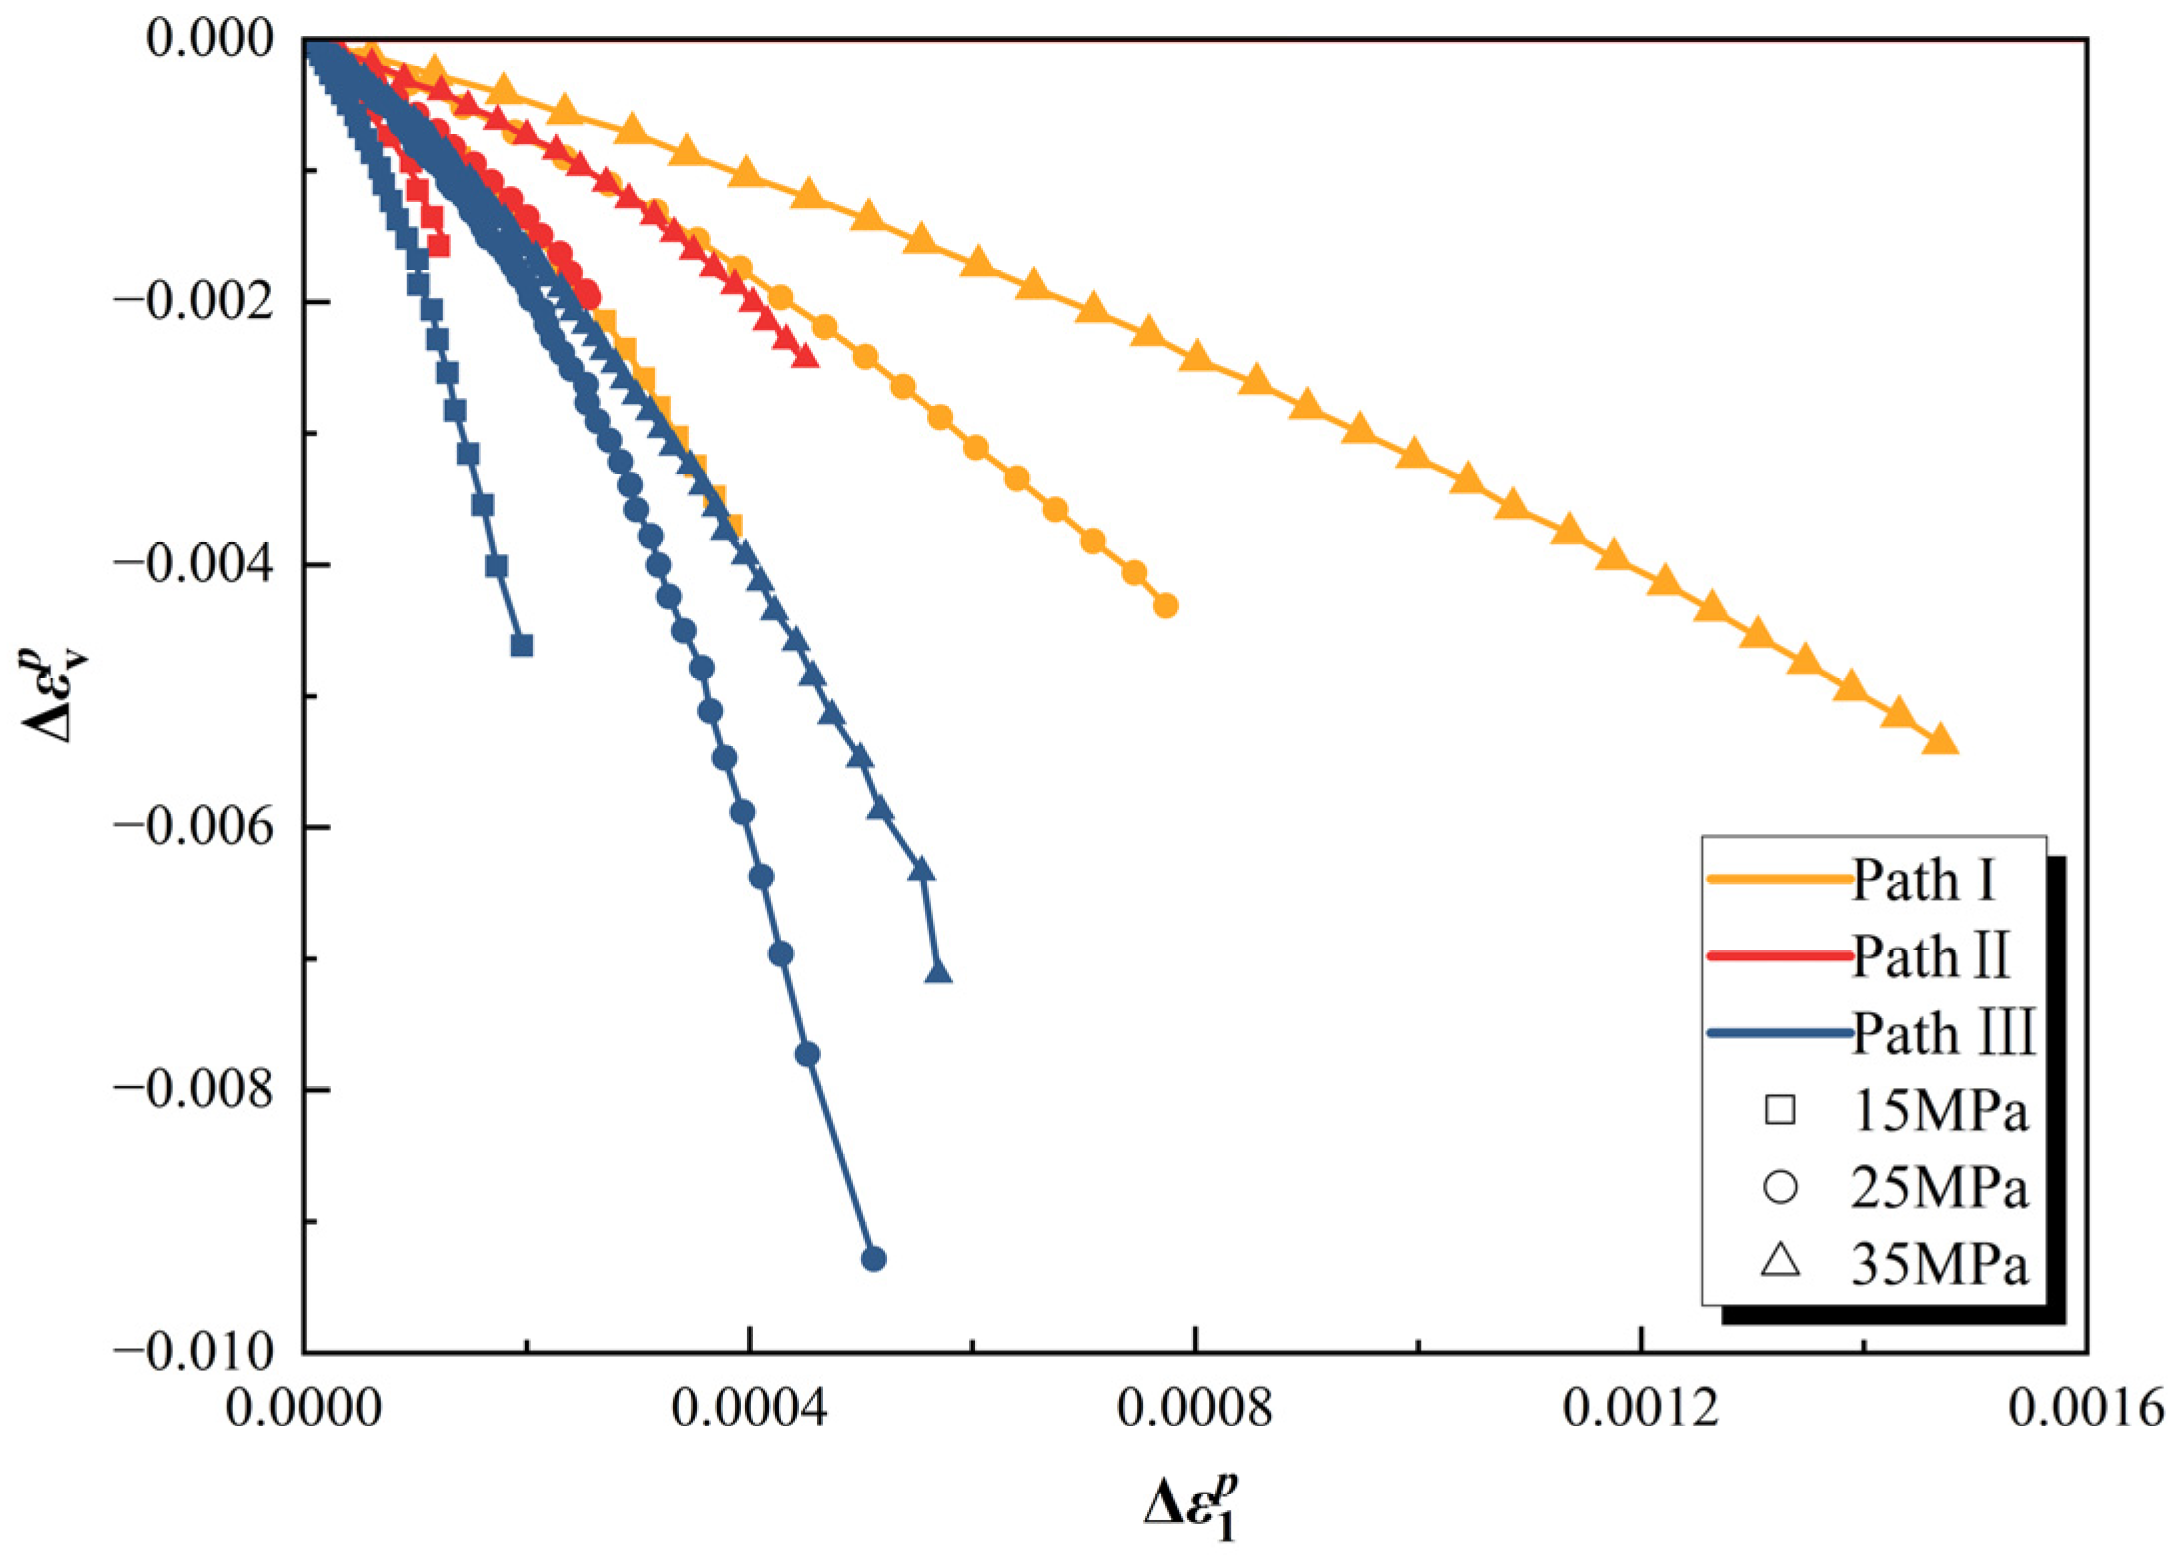
Figure 6 shows the relationship curve between volumetric strain and axial strain before the critical point under different stress paths. An analysis shows that, under all path conditions, the volume of the specimen undergoes a transition from compression to dilatancy before the critical point and gradually tends to expand when reaching the critical point. In addition, after the bifurcation point, the curve shapes corresponding to different initial confining pressures on the same path exhibit good consistency, almost showing a parallel distribution. However, there are significant differences in the curve shapes under different stress paths. Specifically, under the condition of path I, the volume of the specimen smoothly transitions to the dilatancy stage after being compressed to the maximum compaction point, with a smooth curve and no obvious turning points. In contrast, the curves of path II and path III deviate at the bifurcation point, and the volumetric strain rapidly accelerates and turns towards the dilatancy state.
By comparing the curves after the bifurcation point, it can be found that, under the same axial strain conditions, the corresponding volumetric strain exhibits path I > path II > path III. This means that, when the same axial strain is reached, the dilatancy of path III is the largest, while the dilatancy of path I is the smallest. The average gradient of the curve after the bifurcation point, which is the ratio of the volumetric strain dilatancy increment to the axial strain increment (Δεvε1), shows the following order under different paths: path III (17.24~35.29) > path II (8.46~16.33) > path I (1.70~2.62). In addition, during this stage, the axial strain growth of path III and path II is significantly lower than that of path I. This indicates that the dilatancy speed of path III is the fastest and most intense, while the dilatancy process of path I is the smoothest. Although path II exhibits a stronger dilatancy trend compared to path I, the overall dilatancy capacity at the critical point is actually lower for Path II due to the specimen being more susceptible to fracture when simultaneously unloading confining pressure and applying axial pressure. In addition, the analysis shows that all bifurcation points have exceeded the maximum compaction point, indicating that, when the stress path bifurcates, the rock has entered the stage of crack propagation, which is consistent with the high stress level and initial conditions for rock damage preset in this article.

4. Analysis of Deformation Parameters Characteristics

In order to compare and analyze the mechanical behavior and characteristics of damaged rocks under different stress paths, while considering the influence of changes in the loading and unloading control methods after the critical point on the results, and combining the differences and ranges of stress paths, this article focuses on studying the deformation and damage evolution process between the bifurcation point and the critical point, in order to ensure the comparability of the research results.

4.1. Deformation Modulus and Generalized Poisson’s Ratio

The Poisson’s ratio and deformation modulus are important parameters that characterize the macro-deformation characteristics of rocks, and the calculation of their tangent and secant values is usually based on stress conditions where the confining pressure remains constant. However, in paths II and III, the confining pressure continues to decrease, and according to the previous analysis, the axial strain changes under these two paths are relatively small. Therefore, the results obtained by using tangent or secant methods may exhibit a tendency towards larger values, and even lead to an increase in the deformation modulus, which is clearly inconsistent with the actual mechanical behavior of rocks gradually cracking and ultimately failing. Based on the brittle and hard characteristics and small deformation conditions of Beishan granite, and considering the influence of different stress paths on the stress and strain in all directions, this paper uses the generalized Hooke′s law and the relevant methods from references [26,52,60] to solve the comprehensive deformation parameters using the following formula.
E d = σ 1 2 μ σ 3 ε 1 μ d = B σ 1 σ 3 2 B 1 σ 3 σ 1 B = ε 3 ε 1
where E d is the deformation modulus and μ d is the generalized Poisson’s ratio.
Considering the differences in the changes in the axial and confining pressures under different stress paths, in order to achieve a unified comparison of the various parameters, this article introduces the deviatoric stress ratio parameter η = (σ1σ3)/σ3. This parameter is directly proportional to the deviatoric stress σ1σ3 and inversely proportional to the confining pressure σ3. Therefore, in the different stress paths studied in this article, the deviatoric stress ratio η gradually increases with the evolution process. Furthermore, normalization is applied to the evolution process between the bifurcation point and the critical point, as follows:
η ˜ = Δ σ 1 σ 3 / σ 3 Δ σ 1 σ 3 / σ 3 f
where η ˜ is the normalized deviatoric stress ratio; Δ σ 1 σ 3 / σ 3 is the increment of the deviatoric stress ratio between a certain state and the bifurcation point; and Δ σ 1 σ 3 / σ 3 f is the total increment of the deviatoric stress ratio between the critical point and the bifurcation point.
Figure 7 shows the relationship curve between the deformation modulus, generalized Poisson’s ratio, and normalized deviatoric stress ratio. An analysis shows that, under different stress path conditions, the deformation modulus gradually decreases with the increase in the normalized deviatoric stress ratio. Under the same path but different initial confining pressures, the curve exhibits good consistency. However, the degradation process of the deformation modulus exhibits certain differences under divergent paths. Specifically, under the condition of path I, the deformation modulus decreases approximately linearly with the increase in the deviatoric stress ratio in the initial stage. When the deviatoric stress ratio reaches a certain value, its decreasing speed begins to accelerate, and the curve exhibits a concave characteristic as a whole. Under the condition of path II, the deformation modulus shows a slowing down and decreasing trend with the increase of the deviatoric stress ratio throughout the process, with a relatively gentle change and an overall convex curve. In the initial stage of path III, the deformation modulus shows a slight deceleration and decrease, then tends to stabilize, and accelerates again when approaching the critical point, presenting an “S”-shaped curve. Path III combines the characteristics of both paths I and II, and the degradation process of deformation modulus shows a changing pattern of first deceleration, then uniform velocity, and finally acceleration. As the initial confining pressure increases, the nonlinear characteristics of deformation modulus degradation gradually strengthen under different paths. This is primarily due to the increased initial confining pressure enhancing lateral constraints, which results in more extensive internal crack propagation within the rock prior to failure. Consequently, the reduction in the deformation modulus before reaching the critical point becomes more pronounced. In addition, under the same initial confining pressure conditions, path I exhibits a stronger acceleration and reduction trend compared to path III when approaching failure, and its nonlinear characteristics are also more prominent. Under various stress path conditions, the critical value of deformation modulus gradually decreases with the increase of initial confining pressure, while the corresponding attenuation shows an increasing trend. When the initial confining pressure is the same, the critical values and the attenuation of the deformation modulus under different stress paths are shown in the following order: path I > path III > path II, as shown in Table 3.
Under various stress path conditions, the generalized Poisson’s ratio continues to increase with the increase in the deviatoric stress ratio. Under different initial confining pressures, the curve characteristics exhibit a high degree of consistency. However, there are significant differences in the evolution process and characteristics of the generalized Poisson’s ratio under different paths. Specifically, under the condition of path I, the change in the generalized Poisson’s ratio in the initial stage is relatively gentle, and it roughly increases linearly with the increase of deviatoric stress ratio. When the deviatoric stress ratio reaches a certain value, its growth rate gradually accelerates. Under the condition of path II, there is a significant linear relationship between the generalized Poisson’s ratio and the deviatoric stress ratio. Under the condition of path III, the growth rate of the generalized Poisson’s ratio is relatively high from the initial stage and shows a clear acceleration trend with the increase in the deviatoric stress ratio, presenting an exponential development characteristic as a whole.
From Figure 7 and Table 3, it can be seen that the generalized Poisson’s ratio of path III exhibits more significant nonlinear characteristics than path I, and its critical value is also higher. This trend is exactly opposite to the variation law of the deformation modulus. Under the same path but different initial confining pressure conditions, the critical value of the generalized Poisson’s ratio is relatively close, indicating that the effect of the confining pressure on this parameter is relatively small. Under the same initial confining pressure conditions, the critical value, increment, and rate of change of the generalized Poisson’s ratio exhibit the following order: path III > path I > path II. Among them, the generalized Poisson’s ratio of path III is significantly higher than other paths, with a critical value of about 1.4–2.1 times that of path II and path I, and the increase reaches 1.4–4.2 times that of both paths. The critical value of the generalized Poisson’s ratio for path I has exceeded 0.5. Path II is close to 0.5, and path III has reached over 0.8, exceeding the definition range of Poisson’s ratio in traditional elastoplastic theory, which is because it contains the deformation caused by crack propagation. Under the initial high stress level of the path bifurcation point, microcracks have already appeared inside the rock, resulting in not only rebound deformation but also crack propagation and opening deformation during unloading. In particular, the opening of cracks perpendicular to the direction of the unloading confining pressure leads to a significant increase in the lateral deformation and volume dilatancy, which is manifested macroscopically as the generalized Poisson′s ratio exceeding the range of elastic theory. However, it can still be used as an apparent parameter to describe the inelastic deformation of rocks and, to some extent, characterize the damage caused by crack propagation.
A comparison shows that the deformation modulus degradation effect of path I is the most significant. The generalized Poisson’s ratio degradation effect of path III is the most significant, and path II has the lowest degree of degradation due to the fastest damage. In addition, previous studies only investigated the evolution of the deformation parameters based on the decrease in confining pressure, without considering the influence of simultaneous changes of other principal stresses. Consequently, both the generalized Poisson′s ratio and the deformation modulus curve are approximately negative exponential functions, and their variation patterns are similar. However, based on the deviatoric stress ratio, this article investigates the evolution process of the generalized Poisson’s ratio and the deformation modulus and finds that there are significant differences between the two, as well as that the curve shapes of each stress path are also significantly different. Therefore, the influence of different stress paths on the deformation parameters can be well-characterized and distinguished through the use of the deviatoric stress ratio.

4.2. Volume Stress and Strain

From the above analysis, it can be seen that, before reaching the critical state, different stress paths undergo significant dilatancy processes. To further investigate the relationship between the volumetric strain εv and the volumetric stress σv (σv = (σ1 + 2σ3)/3) during the bifurcation stage of the stress paths, an analysis will be conducted in conjunction with Figure 8.
The analysis shows that, under various stress path conditions, the volumetric strain shows an increasing (dilatancy) trend with the change in volumetric stress. Under the same stress path but different initial confining pressures, the evolution characteristics of the curve exhibit a high degree of consistency. However, there are significant differences in the process of dilatancy under different stress paths. Specifically, under the condition of path I, the volumetric strain shows a continuously accelerating growth trend with the increase in volumetric stress. Under the condition of path II, in the initial stage, the volumetric strain exhibits a slowing growth characteristic with the decrease of volumetric stress, and then, its growth rate gradually stabilizes. Under the condition of path III, the volumetric strain shows an accelerated growth trend with the decrease in volumetric stress. This indicates that the stress path has a significant impact on the evolution process of the volumetric strain in damaged rocks. Whether the volume stress increases or decreases, it will lead to the phenomenon of dilatancy, but the underlying mechanisms differ.
To further quantify and compare the effects of different stress paths and the initial confining pressure on rock dilatancy, an exponential function was used to fit the curve evolution characteristics:
ε v = ε v 0 + A e K σ v σ v 0 sgn σ v σ v 0
where σ v 0 and ε v 0 is the volume stress at the bifurcation point, and A and K are fitting parameters, where K represents the dilatancy gradient. sgn σ v σ v 0 is a function of positive and negative values. That is, when the volume stress of path I increases, it is taken as 1, and when the volume stress of paths II and III decreases, it is taken as −1.
The fitting results (Figure 8 and Table 4) show that the exponential function can well-describe the evolution process of dilatancy, and the fitting curve is highly consistent with the experimental data, with the correlation coefficients mostly exceeding 0.99. The fitting parameter K represents the gradient of volume strain increasing with the change in volume stress. The larger the K value, the more significant the volume dilatancy under the same volume stress variation. In physical terms, the higher the initial confining pressure, the stronger the constraint effect, and the corresponding crack density is smaller. By comparing the dilatancy gradient K, it can be seen that, under different stress path conditions, as the initial confining pressure increases, the K value shows a decreasing trend. This indicates that the fitting parameter K can comprehensively reflect the sensitivity of rock volume deformation and is positively correlated with the damage state, such as the internal crack density. Under the same initial confining pressure conditions, the magnitude of the dilatancy gradient K follows the order of path III > path I > path II. This indicates that, although the curves of path I and path III both tend to be horizontal near the critical point and the volumetric strain significantly increases, as the decrease in volume stress under path III, its dilatancy rate is higher, and the unloading-induced dilatancy effect is more significant than the loading-induced dilatancy. This is mainly because there are differences in the composition of dilatancy deformation and the confining pressure experienced under different stress paths. During the unloading and dilatancy process, in addition to the plastic deformation caused by crack propagation, it also includes the elastic volume recovery part. During the process of loading and dilatancy, deformation is mainly caused by crack propagation, and it is also necessary to overcome the elastic dilatancy effect caused by the increase in volume stress. Therefore, the degree and rate of loading-induced dilatancy are generally lower than those of unloading-induced dilatancy. However, in path II, there is both axial compression loading and confining pressure unloading, resulting in a rapid development of deformation and failure processes, resulting in the smallest degree and rate of dilatancy.

5. Analysis of Dilatancy Characteristics

To further explore the characteristics and underlying mechanisms of loading and unloading dilatancy, the plastic deformation characteristics and dilatancy evolution of rocks under different stress paths were analyzed based on plastic theory in this section.

5.1. Plastic Strain

According to the phenomenological description of plastic flow, the macro-deformation of rocks includes plastic and elastic parts. That is, plastic strain can be obtained by subtracting the elastic strain from the measured strain [39,61]:
ε i p = ε i ε i e
where subscripts i = 1, 3, v, representing the axial, radial, and volume, respectively; the superscripts e and p represent elasticity and plasticity, respectively; and the elastic strain is calculated based on the generalized Hooke’s law:
ε 1 e = σ 1 2 μ e σ 3 E e ε 3 e = σ 3 σ 1 + σ 3 μ e E e ε v e = ε 1 e + 2 ε 3 e
Among them, E e is the elastic modulus and μ e is the Poisson’s ratio, which are taken from the elastic deformation stage of the full stress–strain curve of each specimen, and are generally regarded as the inherent mechanical indicators of the rock and assumed to remain constant during loading and unloading processes. It should be pointed out that, due to the neglect of the modulus changes caused by damage, the elastic modulus and elastic strain are overestimated, resulting in a smaller calculated value of the plastic strain. However, considering that the degree of deformation and damage of hard brittle granite is relatively small before the critical point, this approximate treatment still has certain rationality and scientific value in the comparative analysis of evolution laws and trends.
To compare the plastic strain characteristics of different stress paths, starting from the bifurcation point, the axial plastic strain increment Δ ε 1 p and radial plastic strain increment Δ ε 3 p were calculated separately. Based on the normalized deviatoric stress ratio η ˜ proposed earlier, the evolution curves of the plastic strain increment under different stress paths before the critical point were obtained, as shown in Figure 9.
It can be seen from this that, as η ˜ increases, both Δ ε 1 p and Δ ε 3 p continue to increase under different stress paths. The curve characteristics under different initial confining pressures of the same stress path are consistent, while pronounced disparities emerge in the evolution process of plastic strain across distinct paths. In each stress path, the initial stage exhibits linear growth characteristics, and the growth rate increases with the increase of the initial confining pressure. Among them, paths I and III gradually show a non-linear acceleration trend as the normalized stress ratio increases, and their non-linear characteristics become more significant with the increase in the initial confining pressure. In contrast, path II always approaches linear growth throughout the entire process. From the comparison of the critical point plastic strain increment data in Table 5, it can be seen that, under various stress path conditions, the critical point plastic strain increment generally increases with the increase in the initial confining pressure. Under the same initial confining pressure conditions, the critical point axial plastic strain under different paths is as follows: path I > path III > path II. The radial plastic strain at the critical point is manifested as path III > path I > path II. In addition, the degree of nonlinearity of the plastic strain increment curve between different stress paths is consistent with its corresponding critical point plastic strain increment relationship.
In addition, under different stress path conditions, the ratio of axial and radial plastic strain increments at the critical point increases with the increase in initial confining pressure. This indicates that the higher the initial confining pressure, the stronger the suppression effect on lateral plastic deformation, while the development of axial plastic deformation is more sufficient. However, there are differences in the confining pressure effects of different paths, with the order of significance being path I > path II > path III. It is worth noting that the impact of initial confining pressure on path III is much smaller than in other paths. Further comparison of the plastic strain increment ratios of different paths under the identical initial confining pressure shows a consistent ordering: path I > path II > path III. By comparing path I and path II, as well as path II and path III, it can be found that, compared with confining pressure unloading, the change in axial pressure has a greater influence on the ratio of axial and radial plastic strain increments, while the increment ratio caused by the decrease in axial pressure is significantly reduced.

5.2. Dilatancy Indicators

To conduct an in-depth quantitative analysis of the dilatancy characteristics of rocks under different stress paths, a relationship curve between the volumetric plastic strain increment Δ ε v p and the axial plastic strain increment Δ ε 1 p were plotted as shown in Figure 10. An analysis shows that, under various path conditions, the increment of volumetric plastic strain gradually accelerates with the increase in axial plastic strain increment. In addition, the critical values of both are positively correlated with the initial confining pressure, and the angle between the curve and the horizontal line decreases with the increase in the initial confining pressure. This indicates that, under different stress paths, the plastic deformation-bearing capacity of the rocks increases with the increase in the initial confining pressure, and the plastic dilatancy effect becomes more significant. Under the same initial confining pressure conditions, the angle between different path curves and the horizontal line follows the order of path III > path II > path I. This indicates that the volume plastic strain increment of path III has the fastest growth rate. Therefore, at the same axial plastic strain increment, path III corresponds to the largest plastic dilatancy capacity.
To refine the analysis of the volumetric plastic dilatancy process of each stress path before the critical point, the concept of apparent dilatancy angle proposed by Yuan et al. [62,63] is referenced, which is defined as:
θ = arctan Δ ε v p Δ ε 1 p
where Δ ε v p is positive for dilatancy and Δ ε 1 p is positive for compression.
However, this model is a bilinear simplified dilation model based on the results of triaxial compression tests, assuming that dilation begins at the peak strength point, with the linear elastic compression before the peak and equal rate dilation after the peak. The results in Figure 10 indicate that significant dilatancy phenomena have already occurred under different stress paths before the critical point, and the dilatancy rate is not a constant value. Therefore, this article introduces the variable processing of the apparent dilatancy angle, starting from the bifurcation point, to explore its variation law under different stress paths, and draws the relationship curve between the apparent dilatancy angle and the normalized axial plastic strain, as shown in Figure 11.
An analysis indicates that, under various stress paths and initial confining pressure conditions prior to the critical point, the apparent dilatancy angle generally increases progressively with the rise in axial plastic strain. After a brief fluctuation near the bifurcation point, the curve generally shows a linear growth trend. Under the same stress path, as the initial confining pressure increases, the curve moves downward as a whole, and the apparent dilatancy angle at the critical point decreases (Table 6). However, the curve of path III is mainly concentrated in the high apparent dilatancy angle region, where the decrease in apparent dilatancy angle with the increasing initial confining pressure is the smallest. Under the same initial confining pressure conditions, for the same normalized axial plastic strain, the apparent dilatancy angles, corresponding to each path, are as follows: path III > path II > path I. In addition, as the initial confining pressure increases, this gap becomes more obvious.
To quantitatively describe the effect of the initial confining pressure on the dilatancy characteristics of rocks, Yuan et al. [62,63] also proposed a dilatancy index relative to uniaxial compression (initial confining pressure of zero), which can be expressed as:
I d = θ p θ 0
In the formula, θ is the apparent dilatancy angle, and subscripts 0 and p represent uniaxial and triaxial tests, respectively.
To achieve a unified comparison of different stress paths, this article adopted the method of Yuan et al. [62], taking the apparent dilatancy angle of the rock under uniaxial compression conditions as the ideal value of 90°. For the hard, brittle granite used in this article, the pre-peak axial plastic strain increment under uniaxial compression is very small, and it is appropriate to use 90° as an approximation value. Meanwhile, the introduction of the expansion index is to quantitatively compare the influence of the initial confining pressure on the dilatancy characteristics of rocks under different paths, so the ratio of the apparent dilatancy angle under different stress paths to any constant value has no effect on the research results. Based on this, the relationship between the critical point dilatancy index and the initial confining pressure, as shown in Figure 12, was obtained, and a recommended negative exponential function was used to fit it:
I d = e m d σ 30
Among them, md is a fitting parameter that can characterize the influence of the initial confining pressure on the dilatancy index.
The fitting results of each stress path show good consistency, and the critical point dilatancy index gradually decreases with the increase in the initial confining pressure, indicating that the plastic dilatancy characteristics of the rock have weakened. Further analysis shows that the fitting parameters md under different paths are in the following order: path I > path II > path III. This indicates that the reduction of the dilatancy index in path I has the most significant effect on the confining pressure, while the dilatancy index in path III is relatively less affected by the initial confining pressure.

5.3. Dilatancy Angle

To further explore the dilatancy characteristics of Beishan granite before the critical state, according to the suggestion of Vermeer et al. [64], the dilation angle is used to quantitatively analyze the influence of the initial confining pressure and the stress path on the dilatancy properties. The expression is:
ψ = arcsin Δ ε v p Δ ε v p 2 Δ ε 1 p
The physical meaning of the parameters in Equation (9) is the same as Equation (6).
For the triaxial tests of the different paths in this article, the second and third principal stresses are always equal to the applied confining pressure (σ2 = σ3). At the same time, the increment of plastic strain satisfies Δ ε V p = Δ ε 1 p + 2 Δ ε 3 p , so Equation (9) can be expressed as:
ψ = arcsin 2 Δ ε 3 p + Δ ε 1 p 2 Δ ε 3 p Δ ε 1 p
The study by Detournay et al. [65] showed that the dilation angle ψ is a function of the plastic parameters and the confining pressure. Therefore, following the relevant practices [66,67,68], and using plastic shear strain γ p = ε 1 p ε 3 p as the plastic parameter, a relationship curve of which and the dilation angle from the bifurcation point to the critical point was drawn, as shown in Figure 13.
The analysis shows that, under different stress paths before the critical point, the dilation angle continues to increase with the increase in plastic shear strain, exhibiting significant dilation characteristics. Meanwhile, under the same stress path but different initial confining pressure conditions, the curve characteristics exhibit good consistency. However, further observation revealed that, as the initial confining pressure increased, the curve moved downward as a whole and tended to flatten out. When the critical point is reached, the plastic shear strain gradually increases, while the dilation angle and its growth rate gradually decrease. This indicates that the initial confining pressure has a suppressive effect on the dilatancy of rocks under different stress paths. Under different initial confining pressure conditions, the curve distribution of path I and path II is relatively scattered, while the curve of path III is relatively concentrated in the higher shear dilation angle region. In addition, the decrease in the critical value of the dilation angle with an increasing initial confining pressure follows the order of path I > path II > path III. This indicates that there are differences in the degree of influence of initial confining pressure on the dilatancy effect under different stress paths.
The variation process and characteristics of the dilation angle under different stress paths show significant differences. Among them, the curves of path I and path III exhibit a concave feature, and the dilation angle shows a slowing of growth in the initial stage, gradually tending to increase linearly as it approaches the critical point. In contrast, the dilation angle of path II shows an approximately linear increasing trend throughout the entire process. According to the data in Table 6, when different paths reach the critical point, the magnitude of the dilation angle follows the order of path III > path II > path I. The magnitude of plastic shear strain follows the order of path III > path I > path II. In addition, during the bifurcation stage of the stress paths studied in this article, the average gradient of the dilation angle follows the order of path II > path III > path I. This indicates that the critical point plastic shear strain corresponding to the stress path of increasing axial pressure and unloading confining pressure is the smallest, the growth rate of the dilation angle is the fastest, and its shear dilation evolution characteristics are the most significant. This path corresponds to the stress field changes during the excavation process of underground caverns. Therefore, for hard and brittle fractured rock masses, especially under low confining pressure conditions, it is necessary to focus on and deeply study the changes and characteristics of dilation during excavation. At present, most of the research on the dilatancy of hard rocks focuses on the change in the post-peak dilation angle and assumes that the dilatancy begins after the peak when studying the apparent dilatancy angle. However, in this article, it is found that rocks undergo significant plastic dilatancy before the critical failure point under a high stress level and show stress path dependence. Therefore, the construction of the shear dilation and dilatancy model needs to fully consider the path influence and pre-peak evolution process.

6. Discussion

6.1. Relationship Between Deformation Parameters and Crack Volumetric Strain

The macro-mechanical properties of brittle rocks are the external manifestation of the initiation, propagation, and eventual penetration of internal microcracks. The crack strain model proposed by Martin et al. [35,69,70] can be used to describe the development of cracks and their induced deformation. In this model, the total volumetric strain ε v of rock is approximately decomposed into two parts, namely elastic volumetric strain ε v e and crack volumetric strain ε v c , so it can be expressed as:
ε v c = ε v 1 2 μ e E e σ 1 + 2 σ 3
where the physical meanings of parameters E e and μ e in the equation are the same as in Equation (5).
It can be seen that the crack volumetric strain ε v c introduced in this section is numerically the same as the plastic volumetric strain ε v p in Section 5.1, but this section focuses on analyzing and exploring from the micro-perspective of crack evolution. In addition, according to the previous analysis, during the stress path bifurcation stage studied in this article, the rock exhibits significant dilatancy characteristics, accompanied by the deterioration of macro-deformation parameters. Especially, the generalized Poisson’s ratio has exceeded the limit value of elastic–plastic theory, indicating that it clearly contains deformation caused by crack opening. Therefore, the relationship between macro deformation parameters and crack volumetric strain can be established, as shown in Figure 14.
Among them, the deformation modulus E d and crack volumetric strain ε v c follow an exponential relationship, so the following equation is used for fitting:
E d = E d 0 + A e λ ε v c
where E d 0 , A , and λ are all fitting parameters, and the results are shown in Table 7.
The correlation coefficients R 2 of the fitted curves are all greater than 0.99, which is highly consistent with the experimental data. This indicates that, under different stress path conditions, the deformation modulus of rocks shows a negative exponential decay trend with the increase of crack volumetric strain (dilatancy direction). The fitting parameter E d 0 reflects the approaching value of the deformation modulus attenuation, and under different stress paths, this parameter decreases with the increase in the initial confining pressure. This indicates that, although there may be some differences in the initial modulus of natural rocks, the influence of confining pressure on the deformation modulus is still significant during the process of attenuation to the critical point. The attenuation coefficient λ is used to characterize the attenuation rate of the deformation modulus, and the larger its value, the faster the attenuation rate. Under different stress paths, the coefficient gradually decreases with the increase in the initial confining pressure. This indicates that, although an increase in initial confining pressure can delay and suppress the failure process, it also promotes a more sufficient internal rupture damage, leading to a further decrease in the critical deformation modulus.
In addition, under the same initial confining pressure conditions, the relationship between the λ values under different stress paths are as follows: path II > path I > path III. This indicates that, under the path of increasing axial pressure while unloading confining pressure, the deformation modulus decays the fastest with crack propagation. Under the path of unloading both axial and confining pressures simultaneously, the attenuation rate of the deformation modulus is the slowest. Therefore, an increase in axial pressure and a decrease in confining pressure both lead to an accelerated attenuation of macroscopic deformation modulus, but the effect of axial pressure is more significant. The main reasons for this are reflected in two aspects. On the one hand, the overall axial pressure is much greater than the confining pressure, so there are differences in the degree of influence of their changes on the deformation modulus. On the other hand, although unloading the axial pressure and confining pressure simultaneously can lead to increased lateral deformation and dilatancy, this process prolongs the evolution time of cracks, and the decrease in axial pressure reduces the axial deformation rate, resulting in a relatively small decay rate of the overall deformation modulus.
There is a significant linear relationship between the generalized Poisson’s ratio μ d and the crack volumetric strain ε v c , which can be fitted using a linear equation:
μ d = μ d 0 b ε v c
where μ d 0 and b are the fitting parameters, and the results are shown in Table 7.
The correlation coefficients R 2 of the fitted curves are all greater than 0.99, which is highly consistent with the experimental data. This indicates that, under different stress path conditions, the generalized Poisson’s ratio of the rocks shows a linear increasing trend with the increase in the crack volumetric strain (dilatancy direction). The fitting parameters μ d 0 reflect the generalized Poisson’s ratio when the crack volumetric strain is zero, while the other parameter b characterizes the rate at which the generalized Poisson’s ratio linearly increases with the crack volumetric strain. The larger the value of b , the faster the growth rate of the generalized Poisson’s ratio, indicating a more rapid deterioration process of the rock.
Under various stress path conditions, the parameters b significantly decrease with the increase in the initial confining pressure. This indicates that the increase in initial confining pressure reduces the growth rate of the generalized Poisson’s ratio and enhances the constraint effect on lateral deformation and vertical crack opening. Under the same initial confining pressure conditions, the relationship between the parameter b values under different stress paths is as follows: path II > path III > path I. This means that, under the path of increasing the axial pressure and unloading confining pressure, the generalized Poisson’s ratio deteriorates the fastest with crack propagation. Under the conventional triaxial compression path with constant confining pressure (path I), the degradation rate of the generalized Poisson’s ratio is the slowest. This result is consistent with the relationship between the average growth rate of the dilation angle in Section 5.3, indicating that the degradation rate of the generalized Poisson’s ratio is significantly affected by confining pressure unloading and is positively correlated with the dilatation rate. This is because unloading the confining pressure can be regarded as applying lateral tensile stress under the original stress state, which leads to the formation of tensile cracks perpendicular to the unloading direction on the surface of the specimen. These cracks gradually propagate inward during the loading and unloading process and macroscopically show as an increase in lateral deformation and volume dilatancy. In addition, when the axial pressure increases simultaneously, the development of cracks will further accelerate.

6.2. Characteristics of Damage Evolution

The macro-deformation and failure process of rocks is accompanied by the accumulation and development of damage. To quantitatively describe and compare the damage state and evolution law of Beishan granite under different stress paths, the damage variable is defined based on the degradation of the deformation modulus [71,72]:
D = 1 E d E e
where E d is the deformation modulus calculated by Equation (1), E e is the elastic modulus and has the same meaning and value method as in Equation (5).
During the bifurcation stage of the stress path, the variation curve of the damage variable, with respect to the normalized deviatoric stress ratio, is shown in Figure 15. The absolute damage values of D 0 and D f in Table 8 correspond to the bifurcation point and critical point, respectively. As shown in the figure, due to inherent differences in the microstructures of different rock specimens, the damage values exhibit a certain degree of discreteness at a unified bifurcation point stress level. However, from the overall trend, the damage value gradually increases with the increase in the initial confining pressure. In addition, the critical damage values under different stress paths show significant confining pressure effects, indicating that, as the initial confining pressure increases, the propagation of internal cracks in the rock becomes more sufficient, resulting in a larger damage value at the critical point. By comparing the critical damage values of different paths, it can be found that path II has the smallest damage value, due to the simultaneous application of axial pressure and removal of confining pressure, resulting in a faster failure process and insufficient extension of internal cracks. Under medium-to-low confining pressures (15 MPa and 25 MPa), the critical damage value of path III is the highest. Under high confining pressure (35 MPa), the critical damage of path I is the most severe. This indicates that, under high confining pressure, loading-induced dilatancy causes more damage to rocks than unloading-induced dilatancy, while under medium and low confining pressure conditions, the opposite trend is observed.
According to the relationship in Equation (12) between the deformation modulus and the crack volumetric strain in the previous section, it can be concluded that:
E e = E d 0 + A
Furthermore, by substituting Equations (12) and (15) into Equation (14), the damage variable represented by the crack volumetric strain can be obtained:
D = A 1 e λ ε v c E d 0 + A
Normalizing the damage variables during the bifurcation stage of the stress path under investigation yields:
D ˜ = D D 0 D f D 0 = 1 e λ ε v c ε v 0 c 1 e λ ε v f c ε v 0 c
where ε v f c and ε v 0 c are the crack volumetric strain at the bifurcation point and critical point, respectively. Therefore, if the initial damage D 0 is zero, then, it can be obtained:
D ˜ = 1 e λ ε v c 1 e λ ε v f c
The damage evolution law during the bifurcation stage of the stress path was investigated, and the relationship curve between D ˜ and η ˜ was obtained through the crack volumetric strain. As shown in Figure 16, based on the normalized deviatoric stress ratio, there are significant differences in the evolution process and characteristics of rock damage under different stress paths. The damage accumulation of path I is relatively slow, but then shows an accelerated growth trend, with an upward curved damage curve. The damage of path II accumulates rapidly in the initial stage and gradually slows down, and its damage curve shows a downward curved shape. The damage accumulation of path III exhibits a characteristic of first slowing down and then accelerating, with its damage curve showing an inverse “S” shape, located in the middle of the former two curves. These three types of curves together form the leaf-shaped damage curve clusters. This phenomenon indicates that, starting from the bifurcation point of the path, the damage curve also bifurcates, and the change in the stress path has a significant impact on the damage evolution process. At the same time, this also indirectly indicates that the deviatoric stress ratio defined in this article can effectively describe and distinguish the damage accumulation process under different paths.
At the same level of the deviatoric stress ratio, the degree of damage development is in the order of path II > path III > path I, which is consistent with the results of the generalized Poisson’s ratio degradation and shear dilation angle evolution rate discussed in the previous analysis. This further indicates that the dilatancy damage of rocks is the fastest under the path of increasing axial pressure and unloading confining pressure, while the dilatancy damage of conventional triaxial compression is the slowest. In addition, the damage curve shapes of different initial confining pressures under various stress paths are consistent and relatively close, but it can still be seen that the curve gradually shifts downwards with increasing confining pressure, indicating that confining pressure has a certain effect on inhibiting the development of damage.
In summary, under high stress conditions, the deformation, dilation, and damage accumulation of Beishan granite show significant stress path dependence. Specifically, under the path of increasing axial pressure unloading confining pressure (path II), the rock is most susceptible to fracturing, with the dilation damage increasing most rapidly and showing pronounced pre-peak dilation characteristics. Therefore, when excavating hard and brittle jointed rock masses in underground engineering, particular attention must be paid to the evolution and characteristics of dilation. Under the unloading of axial and confining pressures (path III), the dilation damage sustained by the rock prior to failure is the most severe and is minimally influenced by the initial confining pressure suppression. Therefore, more serious damage may occur in the multi-directional unloading areas, such as the high side walls and the bifurcation tunnels of underground caverns. For high-level radioactive waste repositories and underground laboratories, it is crucial to monitor the progression of micro-damage in these regions to ensure the integrity of the disposal barriers. Additionally, when employing active unloading techniques (such as borehole pressure relief) to reduce surrounding rock pressure and prevent dynamic disasters, the influence of unloading direction and its control measures must be fully considered.

7. Conclusions

This article conducted mechanical tests on three typical stress paths of Beishan granite under high stress levels, including increasing axial pressure with constant confining pressure (path I), increasing axial pressure with unloading confining pressure (path II), and simultaneous unloading of axial and confining pressures (path III). The study focuses on the bifurcation stage of the path before the critical point, quantitatively analyzes and compares the effects of stress path and initial confining pressure, and deeply explores the deformation response characteristics and dilatancy damage evolution laws of rocks. The main conclusions are as follows:
(1)
The macro-deformation properties of rocks are significantly different after the bifurcation of various stress paths. From the stress–strain relationship, the axial deformation of path I is the largest, and its brittle weakening confining pressure effect is the most significant. The critical strain value and increment of path II are both the smallest, indicating that the rock under this path is most prone to fracture. The radial deformation of path III dominates, with the most prominent characteristics, and its dilatancy degree is also the strongest. Based on the parameter deviatoric stress ratio, the deterioration process of the deformation parameters is compared uniformly. It is found that the deformation modulus degradation effect of path I is the most significant, while the generalized Poisson’s ratio degradation effect of path III is the most prominent. Meanwhile, the confining pressure effect of deformation modulus degradation is significant in all paths, while the confining pressure effect of the generalized Poisson′s ratio degradation is relatively less pronounced. Under different stress paths, rocks undergo a process of volume dilatancy before the critical state, and the exponential function can uniformly describe the relationship between volume stress and strain. Furthermore, by comparing the dilatancy gradient, it can be seen that the unloading-induced dilatancy (path III) is more intense than the loading-induced dilatancy (path I);
(2)
Based on plastic theory, the plastic dilatancy behavior of rocks under different stress paths is analyzed by the variable apparent dilatancy angle, dilatancy index, and dilation angle. The apparent dilatancy angle and dilation angle of each path before the critical point show an increasing trend, and the critical point dilatancy index decreases in a negative exponential form with the increase in initial confining pressure. However, there are significant differences in the evolution process and characteristics of the dilatancy parameters between different paths. The critical values of the apparent dilatancy angle and dilation angle for path I are both the smallest, and the confining pressure effect of the reduction of dilatancy index is the most significant. The average gradient of the dilation angle of path II is the largest, the plastic shear strain at the critical point is the smallest, and the dilation strengthening property is the most prominent. Path III is opposite to path I, with the highest critical values of apparent dilatancy angle and dilation angle, and the dilatancy index being least affected by the initial confining pressure;
(3)
Based on the degradation characteristics of the deformation modulus, the damage variable is defined, and the critical damage states under different paths are compared. It is found that path II has the smallest absolute damage value. Under high confining pressure conditions (35 MPa), the damage caused by loading dilatancy (path I) is greater than that caused by unloading dilatancy (path III). Under medium-to-low confining pressure conditions (15 MPa and 25 MPa), the situation is exactly the opposite. According to the relationship between the deformation modulus and the crack volume strain, a damage variable based on the crack volume strain is constructed, and the damage evolution curves of different paths are obtained based on the normalized deviatoric stress ratio. The damage evolution curve of path I shows a downward curved shape, path II shows an upward curved shape, and path III is between the first two, exhibiting an inverse “S” shape. These three curves together form the leaf-shaped damage curve clusters. This phenomenon indicates that the process of damage accumulation is closely related to the stress path, and as the stress path bifurcates, the damage evolution path also exhibits significant differentiation. Meanwhile, the deviatoric stress ratio defined in this article can effectively describe and distinguish the damage evolution process under different stress paths.
The test results reveal the regular influence of stress path and initial confining pressure on the dilatancy damage behavior of Beishan granite before failure, but it must be recognized that there are limitations in the number of specimens. Due to the limited number of cores with a consistent appearance, each stress path and confining pressure combination was tested using a single specimen. In the next stage of research, further quantitative studies will be conducted on the effects of heterogeneity through repeated experiments with multiple specimens. Based on a statistical analysis of variance and uncertainty, quantitative research will be carried out on the parameter ranges and confidence intervals related to rock dilatancy damage under different paths and initial confining pressures. In addition, we fully recognize the significance of rock strength parameters and post-failure mechanical behavior and will conduct further research on the influence of pre-failure strain behavior of hard brittle rocks under different stress paths on post-failure strength degradation, failure modes, etc.

Author Contributions

Y.H. and D.Z.: Writing—original draft, software, and conceptualization. E.L.: Writing—review and editing. Z.Z. and S.P.: Methodology and data curation. J.D. and L.G.: Visualization and investigation. All authors have read and agreed to the published version of the manuscript.

Funding

This research was supported by the National Natural Science Foundation of China (Grant No. 52278420) and the Jiangsu Province Youth Science and Technology Talent Support Project. This support is greatly appreciated.

Institutional Review Board Statement

Not applicable.

Informed Consent Statement

Not applicable.

Data Availability Statement

The data underlying this article will be shared upon reasonable request to the corresponding author.

Conflicts of Interest

Yang Han was employed by the company Nanjing Urban Construction Management Group Co., Ltd. The remaining authors declare that the research was conducted in the absence of any commercial or financial relationships that could be construed as a potential conflict of interest.

References

  1. Wang, J. On area-specific underground research laboratory for geological disposal of high-level radioactive waste in China. J. Rock Mech. Geotech. 2014, 6, 99–104. [Google Scholar] [CrossRef]
  2. Li, H.H.; Wang, J.; Mao, L.; Zhao, S.W.; Jia, M.L.; Liu, Y.C.; Huang, S.L. Safety assessment of Beishan pre-selection area for geological disposal of high-level radioactive waste in China. J. Radioanal. Nucl. Chem. 2022, 331, 2573–2581. [Google Scholar] [CrossRef]
  3. Ma, H.S.; Wang, J.; Man, K.; Chen, L.; Gong, Q.M.; Zhao, X.G. Excavation of underground research laboratory ramp in granite using tunnel boring machine: Feasibility study. J. Rock Mech. Geotech. Eng. 2020, 12, 1201–1213. [Google Scholar] [CrossRef]
  4. Zhang, Y.; Zhang, Q.Y.; Duan, K.; Yu, G.Y.; Jiao, Y.Y. Reliability analysis of deep underground research laboratory in Beishan for geological disposal of high-level radioactive waste. Comput. Geotech. 2020, 118, 103328. [Google Scholar] [CrossRef]
  5. Wei, X.; Guo, Y.; Cheng, H.L.; Meng, X.D.; Cheng, M.Q.; Yang, T.; Xu, C.M. Rock mass characteristics in Beishan, a preselected area for China’s high-level radioactive waste disposal. Acta Geol. Sin. Engl. Ed. 2019, 93, 362–372. [Google Scholar] [CrossRef]
  6. Qian, Q.H.; Lin, P. Safety risk management of underground engineering in China: Progress, challenges and strategies. J. Rock Mech. Geotech. Eng. 2016, 8, 423–442. [Google Scholar] [CrossRef]
  7. Feng, X.T.; Liu, J.P.; Chen, B.R.; Xiao, Y.X.; Feng, G.L.; Zhang, F.P. Monitoring, warning, and control of rockburst in deep metal mines. Engineering 2017, 3, 538–545. [Google Scholar] [CrossRef]
  8. Gong, H.; Li, D.Y.; Ru, W.K.; Luo, P.K.; Zhang, G.H.; Liu, Y.P. Characteristics of damage deterioration and strategy of zonal support for surrounding rock in deep mine roadway. Eng. Fail. Anal. 2025, 170, 109316. [Google Scholar] [CrossRef]
  9. He, M.C.; Zhao, F.; Cai, M.; Du, S. A novel experimental technique to simulate pillar burst in laboratory. Rock Mech. Rock Eng. 2015, 48, 1833–1848. [Google Scholar] [CrossRef]
  10. Feng, G.L.; Feng, X.T.; Chen, B.R.; Xiao, Y.X.; Zhao, Z.N. Effects of structural planes on the microseismicity associated with rockburst development processes in deep tunnels of the Jinping-II Hydropower Station, China. Tunn. Undergr. Space Technol. 2019, 84, 273–280. [Google Scholar] [CrossRef]
  11. Li, B.; Xu, N.W.; Xiao, P.W.; Xia, Y.; Zhou, X.; Gu, G.K.; Yang, X.G. Microseismic monitoring and forecasting of dynamic disasters in underground hydropower projects in southwest China: A review. J. Rock Mech. Geotech. Eng. 2023, 15, 2158–2177. [Google Scholar] [CrossRef]
  12. Huang, X.; Xu, D.P.; Chen, D.F.; Li, C.X.; Feng, G.L.; Xu, H.S.; Liu, X.Y. Damage assessment of High-Stress brittle surrounding rock masses in a deep Large-Span High-Sidewall underground Cavern: In situ measurement and numerical simulation. Eng. Fail. Anal. 2024, 161, 108273. [Google Scholar] [CrossRef]
  13. Wang, M.; Li, H.B.; Han, J.Q.; Xiao, X.H.; Zhou, J.W. Large deformation evolution and failure mechanism analysis of the multi-freeface surrounding rock mass in the Baihetan underground powerhouse. Eng. Fail. Anal. 2019, 100, 214–226. [Google Scholar] [CrossRef]
  14. Demina, T.; Zhumabekova, A.; Medeubayev, N.; Meiram, D.; Sherubayev, S.; Abdrasheva, Z.; Gabitova, A. Simulation of the enclosing rock displacements around the development mine workings. Min. Miner. Deposits 2024, 18, 153–161. [Google Scholar] [CrossRef]
  15. Abdiev, A.R.; Wang, J.; Mambetova, R.S.; Abdiev, A.A.; Abdiev, A.S. Geomechanical assessment of stress-strain conditions in structurally heterogeneous rock masses of Kyrgyzstan. Eng. J. Satbayev Univ. 2025, 147, 31–39. [Google Scholar] [CrossRef]
  16. Tsang, C.F.; Bernier, F.; Davies, C. Geohydromechanical processes in the Excavation Damaged Zone in crystalline rock, rock salt, and indurated and plastic clays—In the context of radioactive waste disposal. Int. J. Rock Mech. Min. Sci. 2005, 42, 109–125. [Google Scholar] [CrossRef]
  17. Jia, S.; Dai, Z.X.; Yang, Z.J.; Du, Z.Y.; Zhang, X.Y.; Ershadnia, R.; Soltanian, M.R. Uncertainty quantification of radionuclide migration in fractured granite. J. Clean. Prod. 2022, 366, 132944. [Google Scholar] [CrossRef]
  18. Zhang, J.T.; Wang, J.; Ji, R.L.; Zhao, Z.H.; Zhao, Y.Y.; Wu, J.; Liu, Z.N.; Wu, Y.; Liu, J.; Zhao, X.G. In-situ interference and tracer tests in granite rock with fractures at Beishan exploration tunnel, China. Int. J. Rock Mech. Min. Sci. 2025, 192, 106166. [Google Scholar] [CrossRef]
  19. Zhao, X.G.; Wang, J.; Cai, M.; Cheng, C.; Ma, L.K.; Su, R.; Zhao, F.; Li, D.J. Influence of unloading rate on the strainburst characteristics of Beishan granite under true-triaxial unloading conditions. Rock Mech. Rock Eng. 2014, 47, 467–483. [Google Scholar] [CrossRef]
  20. Huang, D.; Li, Y.R. Conversion of strain energy in triaxial unloading tests on marble. Int. J. Rock Mech. Min. Sci. 2014, 66, 160–168. [Google Scholar] [CrossRef]
  21. Si, X.F.; Gong, F.Q. Strength-weakening effect and shear-tension failure mode transformation mechanism of rockburst for fine-grained granite under triaxial unloading compression. Int. J. Rock Mech. Min. Sci. 2020, 131, 104347. [Google Scholar] [CrossRef]
  22. Li, X.B.; Feng, F.; Li, D.Y.; Du, K.; Ranjith, P.G.; Rostami, J. Failure characteristics of granite influenced by sample height-to-width ratios and intermediate principal stress under true-triaxial unloading conditions. Rock Mech. Rock Eng. 2018, 51, 1321–1345. [Google Scholar] [CrossRef]
  23. Li, J.L.; Wang, L.H.; Wang, X.X.; Wang, R.H.; Cheng, Z.; Dang, L. Research on unloading nonlinear mechanical characteristics of jointed rock masses. J. Rock Mech. Geotech. Eng. 2010, 2, 357–364. [Google Scholar] [CrossRef]
  24. Duan, K.; Ji, Y.L.; Wu, W.; Kwok, C.Y. Unloading-induced failure of brittle rock and implications for excavation-induced strain burst. Tunn. Undergr. Space Technol. 2019, 84, 495–506. [Google Scholar] [CrossRef]
  25. Zhou, X.P.; Zhang, Y.X.; Ha, Q.L. Real-time computerized tomography (CT) experiments on limestone damage evolution during unloading. Theor. Appl. Fract. Mech. 2008, 50, 49–56. [Google Scholar] [CrossRef]
  26. Zhou, K.P.; Liu, T.Y.; Hu, Z.X. Exploration of damage evolution in marble due to lateral unloading using nuclear magnetic resonance. Eng. Geol. 2018, 244, 75–85. [Google Scholar] [CrossRef]
  27. Wu, G.; Zhang, L. Studying unloading failure characteristics of a rock mass using the disturbed state concept. Int. J. Rock Mech. Min. Sci. 2004, 41, 419–425. [Google Scholar] [CrossRef]
  28. Chen, J.; Jiang, D.Y.; Ren, S.; Yang, C.H. Comparison of the characteristics of rock salt exposed to loading and unloading of confining pressures. Acta Geotech. 2016, 11, 221–230. [Google Scholar] [CrossRef]
  29. Kaiser, P.K.; Yazici, S.; Maloney, S. Mining-induced stress change and consequences of stress path on excavation stability—A case study. Int. J. Rock Mech. Min. Sci. 2001, 38, 167–180. [Google Scholar] [CrossRef]
  30. Feng, X.T.; Xu, H.; Yang, C.X.; Zhang, X.W.; Gao, Y.H. Influence of loading and unloading stress paths on the deformation and failure features of Jinping marble under true triaxial compression. Rock Mech. Rock Eng. 2020, 53, 3287–3301. [Google Scholar] [CrossRef]
  31. Li, D.Y.; Sun, Z.; Xie, T.; Li, X.B.; Ranjith, P.G. Energy evolution characteristics of hard rock during triaxial failure with different loading and unloading paths. Eng. Geol. 2017, 228, 270–281. [Google Scholar] [CrossRef]
  32. Zhao, G.Y.; Dai, B.; Dong, L.J.; Yang, C. Energy conversion of rocks in process of unloading confining pressure under different unloading paths. Trans. Nonferrous Met. Soc. China. 2015, 25, 1626–1632. [Google Scholar] [CrossRef]
  33. Zhang, L.M.; Cong, Y.; Meng, F.Z.; Wang, Z.Q.; Zhang, P.; Gao, S. Energy evolution analysis and failure criteria for rock under different stress paths. Acta Geotech. 2021, 16, 569–580. [Google Scholar] [CrossRef]
  34. Duan, S.Q.; Jiang, Q.; Liu, G.F.; Xiong, J.C.; Gao, P.; Xu, D.P.; Li, M.Y. An insight into the excavation-induced stress paths on mechanical response of weak interlayer zone in underground cavern under high geostress. Rock Mech. Rock Eng. 2021, 54, 1331–1354. [Google Scholar] [CrossRef]
  35. Chen, Y.; Zuo, J.P.; Li, Z.H.; Dou, R. Experimental investigation on the crack propagation behaviors of sandstone under different loading and unloading conditions. Int. J. Rock Mech. Min. Sci. 2020, 130, 104310. [Google Scholar] [CrossRef]
  36. Scholz, C.H. Microfracturing and the inelastic deformation of rock in compression. J. Geophys. Res. 1968, 73, 1417–1432. [Google Scholar] [CrossRef]
  37. Crouch, S.L. Experimental determination of volumetric strains in failed rock. Int. J. Rock Mech. Min. Sci. Geomech. Abstr. 1970, 7, 589–603. [Google Scholar] [CrossRef]
  38. Zhang, Y.; Wang, Z.F.; Xu, D.P.; Gao, Y.H.; Zhou, Y.Y.; Gu, L.J. True triaxial stresses mobilizing dilatant fracturing and engineering failure of hard rocks. Eng. Fail. Anal. 2023, 154, 107652. [Google Scholar] [CrossRef]
  39. Zheng, Z.Q.; Kong, Q.X.; Xiao, M.L.; Pei, J.L.; Zhuo, L.; He, J.D. Dilatancy and multi-scale failure characteristics of a foliated rock under triaxial confinement unloading conditions. Eng. Fail. Anal. 2024, 160, 108168. [Google Scholar] [CrossRef]
  40. Meng, Q.B.; Liu, J.F.; Ren, L.; Pu, H.; Chen, Y.L. Experimental study on rock strength and deformation characteristics under triaxial cyclic loading and unloading conditions. Rock Mech. Rock Eng. 2021, 54, 777–797. [Google Scholar] [CrossRef]
  41. Arzúa, J.; Alejano, L.R. Dilation in granite during servo-controlled triaxial strength tests. Int. J. Rock Mech. Min. Sci. 2013, 61, 43–56. [Google Scholar] [CrossRef]
  42. Arzúa, J.; Alejano, L.R.; Walton, G. Strength and dilation of jointed granite specimens in servo-controlled triaxial tests. Int. J. Rock Mech. Min. Sci. 2014, 69, 93–104. [Google Scholar] [CrossRef]
  43. Wu, J.Y.; Feng, M.M.; Yu, B.Y.; Zhang, W.L.; Ni, X.Y.; Han, G.S. Experimental investigation on dilatancy behavior of water-saturated sandstone. Int. J. Min. Sci. Technol. 2018, 28, 323–329. [Google Scholar] [CrossRef]
  44. Salehnia, F.; Collin, F.; Charlier, R. On the variable dilatancy angle in rocks around underground galleries. Rock Mech. Rock Eng. 2017, 50, 587–601. [Google Scholar] [CrossRef]
  45. Walton, G.; Diederichs, M.S. A new model for the dilation of brittle rocks based on laboratory compression test data with separate treatment of dilatancy mobilization and decay. Geotech. Geol. Eng. 2015, 33, 661–679. [Google Scholar] [CrossRef]
  46. Walton, G.; Arzúa, J.; Alejano, L.R.; Diederichs, M.S. A laboratory-testing-based study on the strength, deformability, and dilatancy of carbonate rocks at low confinement. Rock Mech. Rock Eng. 2015, 48, 941–958. [Google Scholar] [CrossRef]
  47. Walton, G.; Hedayat, A.; Kim, E.; Labrie, D. Post-yield strength and dilatancy evolution across the brittle–ductile transition in Indiana limestone. Rock Mech. Rock Eng. 2017, 50, 1691–1710. [Google Scholar] [CrossRef]
  48. Wang, J.; Chen, L.; Su, R.; Zhao, X.G. The Beishan underground research laboratory for geological disposal of high-level radioactive waste in China: Planning, site selection, site characterization and in situ tests. J. Rock Mech. Geotech. Eng. 2018, 10, 411–435. [Google Scholar] [CrossRef]
  49. Fairhurst, C.E.; Hudson, J.A. Draft ISRM suggested method for the complete stress-strain curve for intact rock in uniaxial compression. Int. J. Rock Mech. Min. Sci. 1999, 36, 279–289. [Google Scholar] [CrossRef]
  50. Liu, J.F.; Qiu, X.S.; Yang, J.X.; Liang, C.; Dai, J.J.; Bian, Y. Failure transition of shear-to-dilation band of rock salt under triaxial stresses. J. Rock Mech. Geotech. Eng. 2024, 16, 56–64. [Google Scholar] [CrossRef]
  51. Hou, P.Y.; Cai, M.; Zhang, X.W.; Feng, X.T. Post-peak stress–strain curves of brittle rocks under axial-and lateral-strain-controlled loadings. Rock Mech. Rock Eng. 2022, 55, 855–884. [Google Scholar] [CrossRef]
  52. Duan, S.Q.; Wang, H.; Gao, P.; Xu, D.P.; Jiang, Q.; Cao, B.; Jiang, X.Q.; Xiong, J.C. Constitutive modeling of weak interlayer zone subject to unloading stress paths in underground excavation based on modified equivalent plastic work. Eng. Fail. Anal. 2024, 160, 108179. [Google Scholar] [CrossRef]
  53. Bai, Q.S.; Tibbo, M.; Nasseri, M.H.B.; Young, R.P. True triaxial experimental investigation of rock response around the mine-by tunnel under an in situ 3D stress path. Rock Mech. Rock Eng. 2019, 52, 3971–3986. [Google Scholar] [CrossRef]
  54. Cai, M. Influence of stress path on tunnel excavation response–Numerical tool selection and modeling strategy. Tunn. Undergr. Space Technol. 2008, 23, 618–628. [Google Scholar] [CrossRef]
  55. Cai, M.; Kaiser, P.K.; Tasaka, Y.; Maejim, T.; Morioka, H.; Minami, M. Generalized crack initiation and crack damage stress thresholds of brittle rock masses near underground excavations. Int. J. Rock Mech. Min. Sci. 2004, 41, 833–847. [Google Scholar] [CrossRef]
  56. Zhao, X.G.; Wang, J.; Cai, M.; Ma, L.K.; Zong, Z.H.; Wang, X.Y.; Su, R.; Chen, W.M.; Zhao, H.G.; Chen, Q.C.; et al. In-situ stress measurements and regional stress field assessment of the Beishan area, China. Eng. Geol. 2013, 163, 26–40. [Google Scholar] [CrossRef]
  57. Walton, G.; Gaines, S. Evaluation of stress path and load rate effects on rock strength using compression testing data for Stanstead Granite. Int. J. Rock Mech. Min. Sci. 2023, 169, 105455. [Google Scholar] [CrossRef]
  58. Stacey, T.R.; Wesseloo, J. Design and prediction in rock engineering: The importance of mechanisms of failure, with focus on high stress, brittle rock conditions. Rock Mech. Rock Eng. 2022, 55, 1517–1535. [Google Scholar] [CrossRef]
  59. Hoek, E.; Martin, C.D. Fracture initiation and propagation in intact rock—A review. J. Rock Mech. Geotech. Eng. 2014, 6, 287–300. [Google Scholar] [CrossRef]
  60. Fu, J.X.; Chen, W.C.; Tan, Y.Y.; Wang, J.; Song, W.D. Experimental study on pore variation and meso-damage of saturated sandstone under unloading condition. Rock Mech. Rock Eng. 2023, 56, 4669–4695. [Google Scholar] [CrossRef]
  61. Cai, W.Q.; Zhu, H.H.; Liang, W.H.; Wang, X.J.; Su, C.L.; Wei, X.Y. A post-peak dilatancy model for soft rock and its application in deep tunnel excavation. J. Rock Mech. Geotech. Eng. 2023, 15, 683–701. [Google Scholar] [CrossRef]
  62. Yuan, S.C.; Harrison, J.P. An empirical dilatancy index for the dilatant deformation of rock. Int. J. Rock Mech. Min. Sci. 2004, 41, 679–686. [Google Scholar] [CrossRef]
  63. Yuan, S.C.; Harrison, J.P. Development of a hydro-mechanical local degradation approach and its application to modelling fluid flow during progressive fracturing of heterogeneous rocks. Int. J. Rock Mech. Min. Sci. 2005, 42, 961–984. [Google Scholar] [CrossRef]
  64. Vermeer, P.A. Non-associated plasticity for soils, concrete and rock. In Physics of Dry Granular Media; Springer: Dordrecht, The Netherlands, 1998; pp. 163–196. [Google Scholar] [CrossRef]
  65. Detournay, E. Elastoplastic model of a deep tunnel for a rock with variable dilatancy. Rock Mech. Rock Eng. 1986, 19, 99–108. [Google Scholar] [CrossRef]
  66. Alejano, L.R.; Alonso, E. Considerations of the dilatancy angle in rocks and rock masses. Int. J. Rock Mech. Min. Sci. 2005, 42, 481–507. [Google Scholar] [CrossRef]
  67. Zhao, X.G.; Cai, M. A mobilized dilation angle model for rocks. Int. J. Rock Mech. Min. Sci. 2010, 47, 368–384. [Google Scholar] [CrossRef]
  68. Zhao, X.G.; Cai, M. Influence of plastic shear strain and confinement-dependent rock dilation on rock failure and displacement near an excavation boundary. Int. J. Rock Mech. Min. Sci. 2010, 47, 723–738. [Google Scholar] [CrossRef]
  69. Martin, C.D. The Strength of Massive Lac du Bonnet Granite Around Underground Openings. Ph.D. Thesis, University of Manitoba, Winnipeg, MB, Canada, 1993. [Google Scholar]
  70. Martin, C.D.; Chandler, N.A. The progressive fracture of Lac du Bonnet granite. Int. J. Rock Mech. Min. Sci. Geomech. Abstr. 1994, 31, 643–659. [Google Scholar] [CrossRef]
  71. Meng, Q.B.; Zhang, M.W.; Han, L.J.; Pu, H.; Chen, Y.L. Acoustic emission characteristics of red sandstone specimens under uniaxial cyclic loading and unloading compression. Rock Mech. Rock Eng. 2018, 51, 969–988. [Google Scholar] [CrossRef]
  72. Chen, W.; Konietzky, H.; Tan, X.; Frühwirt, T. Pre-failure damage analysis for brittle rocks under triaxial compression. Comput. Geotech. 2016, 74, 45–55. [Google Scholar] [CrossRef]
Figure 1. Specimen preparation and experimental equipment schematic diagram: (a) Beishan exploration tunnel (BET) test platform; (b) Schematic diagram of spatial structure of BET test platform; (c) Core location; (d) Drilling rock sample; (e) Cutting treatment of rock specimens; (f) Standard cylindrical specimen (Φ 50 × 100 mm); (g) MTS815 loading system; (h) Pressure chamber; (i) Axial extensometer and radial extensometer.
Processes 13 01892 g001
Figure 2. Mineral composition of Beishan granite (Plagioclase—Pl; potassium feldspar—Pf; quartz—Qz; biotite—Bi; muscovite—Mu). (a) XRD diffraction results. (b) Petrographic observation.
Processes 13 01892 g002
Figure 3. Schematic diagram of experimental path (a) and corresponding scenarios in deep underground excavations (b).
Processes 13 01892 g003
Figure 4. Full stress–strain curves for different stress paths: (a) path I; (b) path II; (c) path III.
Processes 13 01892 g004aProcesses 13 01892 g004b
Figure 5. The deviatoric stress–strain curves under different paths before the critical point (35 MPa).
Processes 13 01892 g005
Figure 6. Relationship curve between volumetric strain and axial strain before the critical point.
Processes 13 01892 g006
Figure 7. Relationship curve between normalized deviatoric stress ratio with (a) deformation modulus and (b) generalized Poisson’s ratio.
Processes 13 01892 g007
Figure 8. Volume stress–strain relationship curve: (a) path I; (b) path II; (c) path III.
Processes 13 01892 g008
Figure 9. Relationship curves between (a) axial and (b) radial plastic strain increment with normalized deviatoric stress ratio.
Processes 13 01892 g009
Figure 10. Relationship curve between volumetric plastic strain increment and axial plastic strain increment.
Processes 13 01892 g010
Figure 11. Relationship curve between apparent dilatancy angle and normalized axial plastic strain.
Processes 13 01892 g011
Figure 12. Relationship between critical point dilatancy index and initial confining pressure.
Processes 13 01892 g012
Figure 13. Relationship curve between dilation angle and plastic shear strain.
Processes 13 01892 g013
Figure 14. Relationship curve between crack volumetric strain with (a) deformation modulus and (b) generalized Poisson’s ratio.
Processes 13 01892 g014aProcesses 13 01892 g014b
Figure 15. Evolution curve of damage variables.
Processes 13 01892 g015
Figure 16. Normalized damage variable evolution curve.
Processes 13 01892 g016
Table 1. Initial stress conditions at the path bifurcation point of specimens.
PathNo.σ30/MPa(σ1σ3)0/MPa
I1-115280
1-225330
1-335380
II2-115280
2-225330
2-335380
III3-115280
3-225330
3-335380
σ30: initial confining pressure of bifurcation point; (σ1σ3)0: initial deviatoric stress of bifurcation point.
Table 2. Critical point stress–strain and strain increment.
PathNo.σ1f/MPaσ3f/MPaε1f/10−2ε3f/10−2εvf/10−2Δε1f/10−2Δε3f/10−2Δεvf/10−2
I1-1359.67515.0000.548−0.358−0.1680.133−0.241−0.349
1-2442.23325.0000.731−0.424−0.1170.211−0.285−0.359
1-3495.69435.0000.905−0.557−0.2090.268−0.364−0.459
II2-1306.03212.2600.445−0.1780.0890.021−0.098−0.179
2-2355.97222.3140.543−0.2070.1280.015−0.120−0.241
2-3426.46430.7530.657−0.2520.1530.029−0.156−0.293
III3-1290.6309.4590.484−0.473−0.4620.016−0.289−0.563
3-2346.15110.5300.568−0.755−0.9420.051−0.587−1.124
3-3402.71822.2870.693−0.687−0.6800.049−0.449−0.849
σ1f: critical axial stress; σ3f: critical confining pressure; ε1f: critical axial strain; ε3f: critical radial strain; εvf: critical volumetric strain; Δε1f: axial strain increment; Δε3f: radial strain increment; Δεvf: incremental volumetric strain.
Table 3. Critical values and variations of deformation parameters.
PathNo.μdfEdf/GPaΔμdfΔEdf/GPa
I1-10.57761.2360.3015.744
1-20.52455.2930.2667.783
1-30.54948.9120.26510.601
II2-10.46063.8360.1692.305
2-20.49157.7160.1753.716
2-30.48055.8270.1755.194
III3-10.80655.2420.4263.660
3-21.05256.0110.7378.050
3-30.77750.8930.4316.841
μdf: critical Poisson’s ratio; Edf: critical deformation modulus; Δμdf: generalized Poisson’s ratio variation; ΔEdf: change in deformation modulus.
Table 4. Fitting results of volume stress–strain curve.
PathNo. ε v 0 A K R 2
I1-10.00191−1.208 × 10−110.1490.9994
1-20.00251−1.620 × 10−110.1160.9986
1-30.00257−9.156 × 10−140.1300.9958
II2-1−0.000425.764 × 10−180.3010.9825
2-2−0.001566.292 × 10−80.0800.9959
2-3−0.001735.148 × 10−80.0680.9941
III3-10.00128−4.049 × 10180.4660.9967
3-20.00162−6.297 × 10130.2990.9874
3-30.00187−1.899 × 10120.2230.9941
Table 5. Incremental and ratio of plastic strain.
PathNo. ε 1 f p /10−2 ε 3 f p /10−2 Δ ε 1 f p /10−2 Δ ε 3 f p /10−2 Δ ε 1 f p Δ ε 3 f p
I1-10.053−0.2420.038−0.20518.72%
1-20.095−0.2910.077−0.25430.46%
1-30.192−0.4000.147−0.34143.11%
II2-10.031−0.1390.012−0.08514.30%
2-20.053−0.1750.026−0.11123.03%
2-30.094−0.2160.045−0.14431.25%
III3-10.049−0.3330.020−0.2418.14%
3-20.077−0.5410.051−0.49010.44%
3-30.106−0.5000.057−0.38414.84%
ε 1 f p : critical axial plastic strain; ε 3 f p : critical radial plastic strain; Δ ε 1 f p : axial plastic strain increment; Δ ε 3 f p : radial plastic strain increment.
Table 6. Dilatancy parameters of critical point.
PathNo. θ f I d f ψ f γ f p /10−2
I1-184.090.93453.340.295
1-279.830.88745.960.386
1-374.670.83037.750.592
II2-185.600.95152.780.170
2-282.590.91847.360.229
2-379.530.88439.940.311
III3-187.570.97359.710.382
3-286.850.96560.200.618
3-385.420.94953.890.607
θ f : critical apparent dilatancy angle; I d f : critical dilatancy index; ψ f : critical dilation angle; γ f p : critical plastic shear strain.
Table 7. Fitting results of relationship between deformation parameters and crack volumetric strain.
PathNo. E d - ε v c μ d - ε v c
E d 0 /GPa A λ R 2 μ d 0 b R 2
I1-158.7669.842311.5260.99920.23580.6070.9986
1-251.40413.107242.1310.99840.23560.6990.9972
1-343.48618.126194.9320.99920.26248.6990.9959
II2-162.0776.612549.4510.99870.196106.5180.9998
2-253.22611.147305.8100.99970.22588.1530.9994
2-352.16212.286352.1130.99960.23771.2830.9998
III3-153.1167.799202.0200.99770.23892.7440.9998
3-255.23710.066203.2520.99670.25781.3430.9991
3-347.37213.361147.7100.99910.23861.6510.9990
Table 8. Critical point dilatancy parameters.
PathNo. D 0 D f Δ D f
I1-10.04190.12410.0822
1-20.04050.15890.1184
1-30.08030.24410.1638
II2-10.05360.08660.0330
2-20.06350.12010.0567
2-30.08780.16540.0776
III3-10.07600.13350.0574
3-20.05770.17610.1184
3-30.09480.20210.1073
Disclaimer/Publisher’s Note: The statements, opinions and data contained in all publications are solely those of the individual author(s) and contributor(s) and not of MDPI and/or the editor(s). MDPI and/or the editor(s) disclaim responsibility for any injury to people or property resulting from any ideas, methods, instructions or products referred to in the content.

