Article

Spatial Distribution Characteristics of Droplet Size and Velocity in a Methanol Spray

1
Institute for Energy Research, Jiangsu University, Zhenjiang 212013, China
2
Binzhou Polytechnic, Binzhou 256603, China
*
Authors to whom correspondence should be addressed.
Processes 2025, 13(6), 1883; https://doi.org/10.3390/pr13061883
Submission received: 12 May 2025 / Revised: 4 June 2025 / Accepted: 12 June 2025 / Published: 13 June 2025

Abstract

The atomization performance of methanol fuel plays a crucial role in enhancing methanol engine efficiency, contributing to the decarbonization of the shipping industry. The droplet microscopic characteristics of methanol spray were experimentally investigated using a single-hole direct injection injector in a constant volume chamber. The particle image analysis (PIA) system equipped with a slicer was employed for droplet detecting at a series of measurement positions in both the dense spray region and dilute spray region, then the spatial distributions of droplet size and velocity were examined. Key findings reveal distinct atomization behaviors between dense and dilute spray regions. Along the centerline, the methanol spray exhibited poor atomization, characterized by a high concentration of aggregated droplets, interconnected liquid structures, and large liquid masses. In contrast, the spray periphery demonstrated effective atomization, with only well-dispersed individual droplets observed. Droplet size distribution analysis showed a sharp decrease from the dense region to the dilute region near the nozzle. In the spray midbody, droplet diameter initially decreased significantly within the dense spray zone, stabilized in the transition zone, and then exhibited a slight increase in the dilute region—though remaining smaller than values observed at the central axis. Velocity measurements indicated a consistent decline in the axial velocity component due to air drag. In contrast, the radial velocity component displayed irregular variations, attributed to vortex-induced flow interactions. These experimentally observed droplet behaviors provide critical insights for refining spray models and enhancing computational simulations of methanol injection processes.

1. Introduction

Anthropogenic greenhouse gas (GHG) emissions have been the primary driver of global warming since the mid-20th century, exacerbating climate change and posing severe threats to daily life and agricultural productivity [1,2,3,4,5]. Amid the ongoing global energy transition, the urgent need for sustainable and clean alternative fuels has become increasingly apparent [6,7,8,9,10,11], particularly in order to reduce the environmental footprint of conventional fossil fuels. Methanol has emerged as a highly promising candidate in this regard [12], especially for the maritime industry, where its application in compression ignition engines has garnered significant attention. This interest stems from methanol’s unique advantages [13]. On the one hand, methanol is a renewable product, as it can be synthesized from biomass, green hydrogen, or carbon capture technologies, aligning with global decarbonization goals [14]. On the other hand, as a low-carbon fuel, it has a high hydrogen-to-carbon ratio and oxygen content, which produces less CO2, particulate matter, and sulfur oxides compared to conventional marine fuels.
However, there are still many challenges in applying methanol to compression ignition engines, due to its low cetane number and high latent heat of vaporization. Three primary methods have been proposed [15]: emulsifying methanol with diesel, and employing port injection to form a pre-mixed combustible gas, or utilizing in-cylinder direct injection followed by ignition via pilot diesel fuel. Many studies have been performed to realize more efficient use of methanol in compression-ignition engines. Jin et al. [16] discussed the characteristics of macroscopic and microscopic structures of carbon neutral methanol blended fuels by measuring the surface tension, electrical conductivity, and particle size. The mixed fuel properties including the density, lower calorific value and corrosivity have also been reported. The effects of injection timing and split injection strategy on the mixture formation, combustion process and emissions were investigated in methanol engines to provide an optimization direction for high efficiency and clean combustion [17,18]. The combustion and emissions characteristics of methanol fuel under stratified lean-burn strategies and port injection strategy were also investigated [19,20]. Liu et al. [21] embedded exhaust gas recirculation (EGR) system in a 3D numerical model of a heavy-duty methanol engine, and analyzed the in-cylinder flow, combustion characteristics, knock tendency, and thermal efficiency of five combustion chamber shapes. The evaporation characteristics of a single methanol droplet were investigated by Yuan et al. [22] to propose effective improvement measures of the cold start issue of methanol engines.
The atomization quality of a fuel jet is typically characterized by key parameters such as droplet size distribution and velocity profile, as demonstrated in prior studies [23,24,25,26,27]. We have also researched the droplet microscopic characteristics of alternative fuel sprays by using a droplet tracking velocimetry technology [28,29]. In internal combustion engines, effective spray atomization is critical for achieving homogeneous fuel dispersion. This uniformity mitigates the formation of fuel-rich or fuel-lean zones, thereby reducing incomplete combustion and suppressing soot formation [30]. Studies demonstrate that methanol spray behavior, influenced by injection pressure, ambient temperature, and fuel composition, is critical for enhancing in-cylinder mixing and combustion efficiency. Wang et al. [31] investigated the effects of injection pressure, ambient temperature and pressure on the tip penetration and cone angle of methanol sprays by using schlieren imaging technology. The results show that an increase in injection pressure will extend the spray tip penetration and expand the cone angle, while an increase in ambient temperature accelerates the evaporation of methanol, leading to the contraction of the liquid core and a decrease in the visible cone angle. Li et al. [32] investigated the macro- and micro- morphologies of superheated flash boiling methanol sprays under extremely low-temperature conditions. It was found that flash boiling occurred in the methanol spray at 373 K, the spray rapidly collapsed into a single stream and formed a vortex structure, and the spray tip penetration increased significantly. In a low-temperature environment (243–293 K), the spray presented a multi-stream shape expanding like an umbrella. A comprehensive visualization experimental study of the effect of injection pressures, durations, ambient pressures, and environmental temperatures on methanol spray evolution was also conducted by Leng et al. [33], and empirical formulas and a deep learning network model for high-pressure methanol spray characteristics were developed.
Previous studies have explored the macroscopic characteristics on methanol spray, but there are deficiencies in the microscopic characteristics of spray research, especially the spatial distribution of microscopic droplets [34]. The spray generated by a direct-flow nozzle inherently produces a dense region characterized by intensified liquid–liquid and gas–liquid interactions. Within this region, droplet morphology exhibits greater complexity and variability compared to the dilute region, manifesting as elongated liquid ligaments, non-spherical droplets [35,36]. Moreover, the droplet collision and breakup processes are more frequent, and their impact on the atomization quality is more obvious. However, the liquid phase concentration in the dense region is higher, the optical depth is larger, and the two-phase flow is more complex, which greatly limits the application of optical diagnostic techniques in this region. Gouesbet et al. [37] analyzed optical techniques using lasers as illumination sources to characterize discrete particles in fluids and concluded that Phase Doppler Anemometry (PDA), Laser-Induced Fluorescence (LIF), and holography are highly effective and efficient for diagnosing particle size and velocity information in the dilute region of sprays. However, they noted that as liquid concentration increases, multiple scattering by particles leads to elevated noise and reduced image contrast, making particle detection challenging.
Despite these limitations, researchers have attempted such measurements, yet only a small fraction yield useful quantitative information. Recently, Jing et al. [38] measured the spatial distribution of the Sauter Mean Diameter (SMD) in high-pressure diesel sprays using a Phase Doppler Particle Analyzer (PDPA). Their results showed that at the same axial position below the nozzle, the SMD gradually increases from the dense region to the dilute region of the spray. Similar results were also reported by Mo et al. [39], in which a Particle/Droplet Image Analysis (PDIA) method was applied. However, Magnotti et al. [40] reported contrasting findings by using X-ray technology, concluding that the SMD in the central dense region of high-pressure diesel sprays remains nearly constant along the radial direction, while it gradually decreases with radial distance at the spray periphery. So, the experimental data of the atomization characteristics in the dense region are seriously lacking and of low credibility [41,42]. It also complicates the development of spray and atomization models [43,44,45], which requires reliable experimental results for validation.
Three major challenges contribute to the scarcity and controversy of experimental data in dense spray regions: high liquid-phase concentration, poor optical accessibility, and complex droplet morphology. To address these limitations, Particle Image Analysis (PIA) combined with physical segmentation has emerged as a promising solution [46,47]. The PIA technique employs a laser with extremely short light pulse and a high-resolution CCD camera to capture actual spray droplet structures, offering distinct advantages in measuring multi-form droplet size [48]. Previously, Kashdan et al. [49] and Berg et al. [50] compared the PIA technique with the well-established technique Phase Doppler Anemometry (PDA), and the results show that PIA is a reliable technique to measure the size of spherical and non-spherical droplets. However, this technology requires high transparency for the diagnostic area, which is difficult to achieve in dense sprays. To overcome this constraint, physical segmentation technology is employed, where a slicer-based filtering device selectively allows only a thin spray layer to pass through, significantly improving light transmittance. This combined approach substantially enhances measurement accuracy in dense spray regions.
Therefore, the primary objective of this study is to accurately characterize droplet behaviors in the dense spray region using the PIA technique enhanced with a slicer. The secondary objective is to advance the understanding of methanol fuel atomization by experimentally elucidating the spatial distributions of droplet size and velocity. The anticipated outcomes of this research are expected to enhance methanol engine technologies, thereby supporting the shipping industry’s decarbonization efforts. Furthermore, the theoretical insights gained from this work may contribute to the refinement of spray models, offering valuable guidance for future developments in this field.

2. Experimental Setup

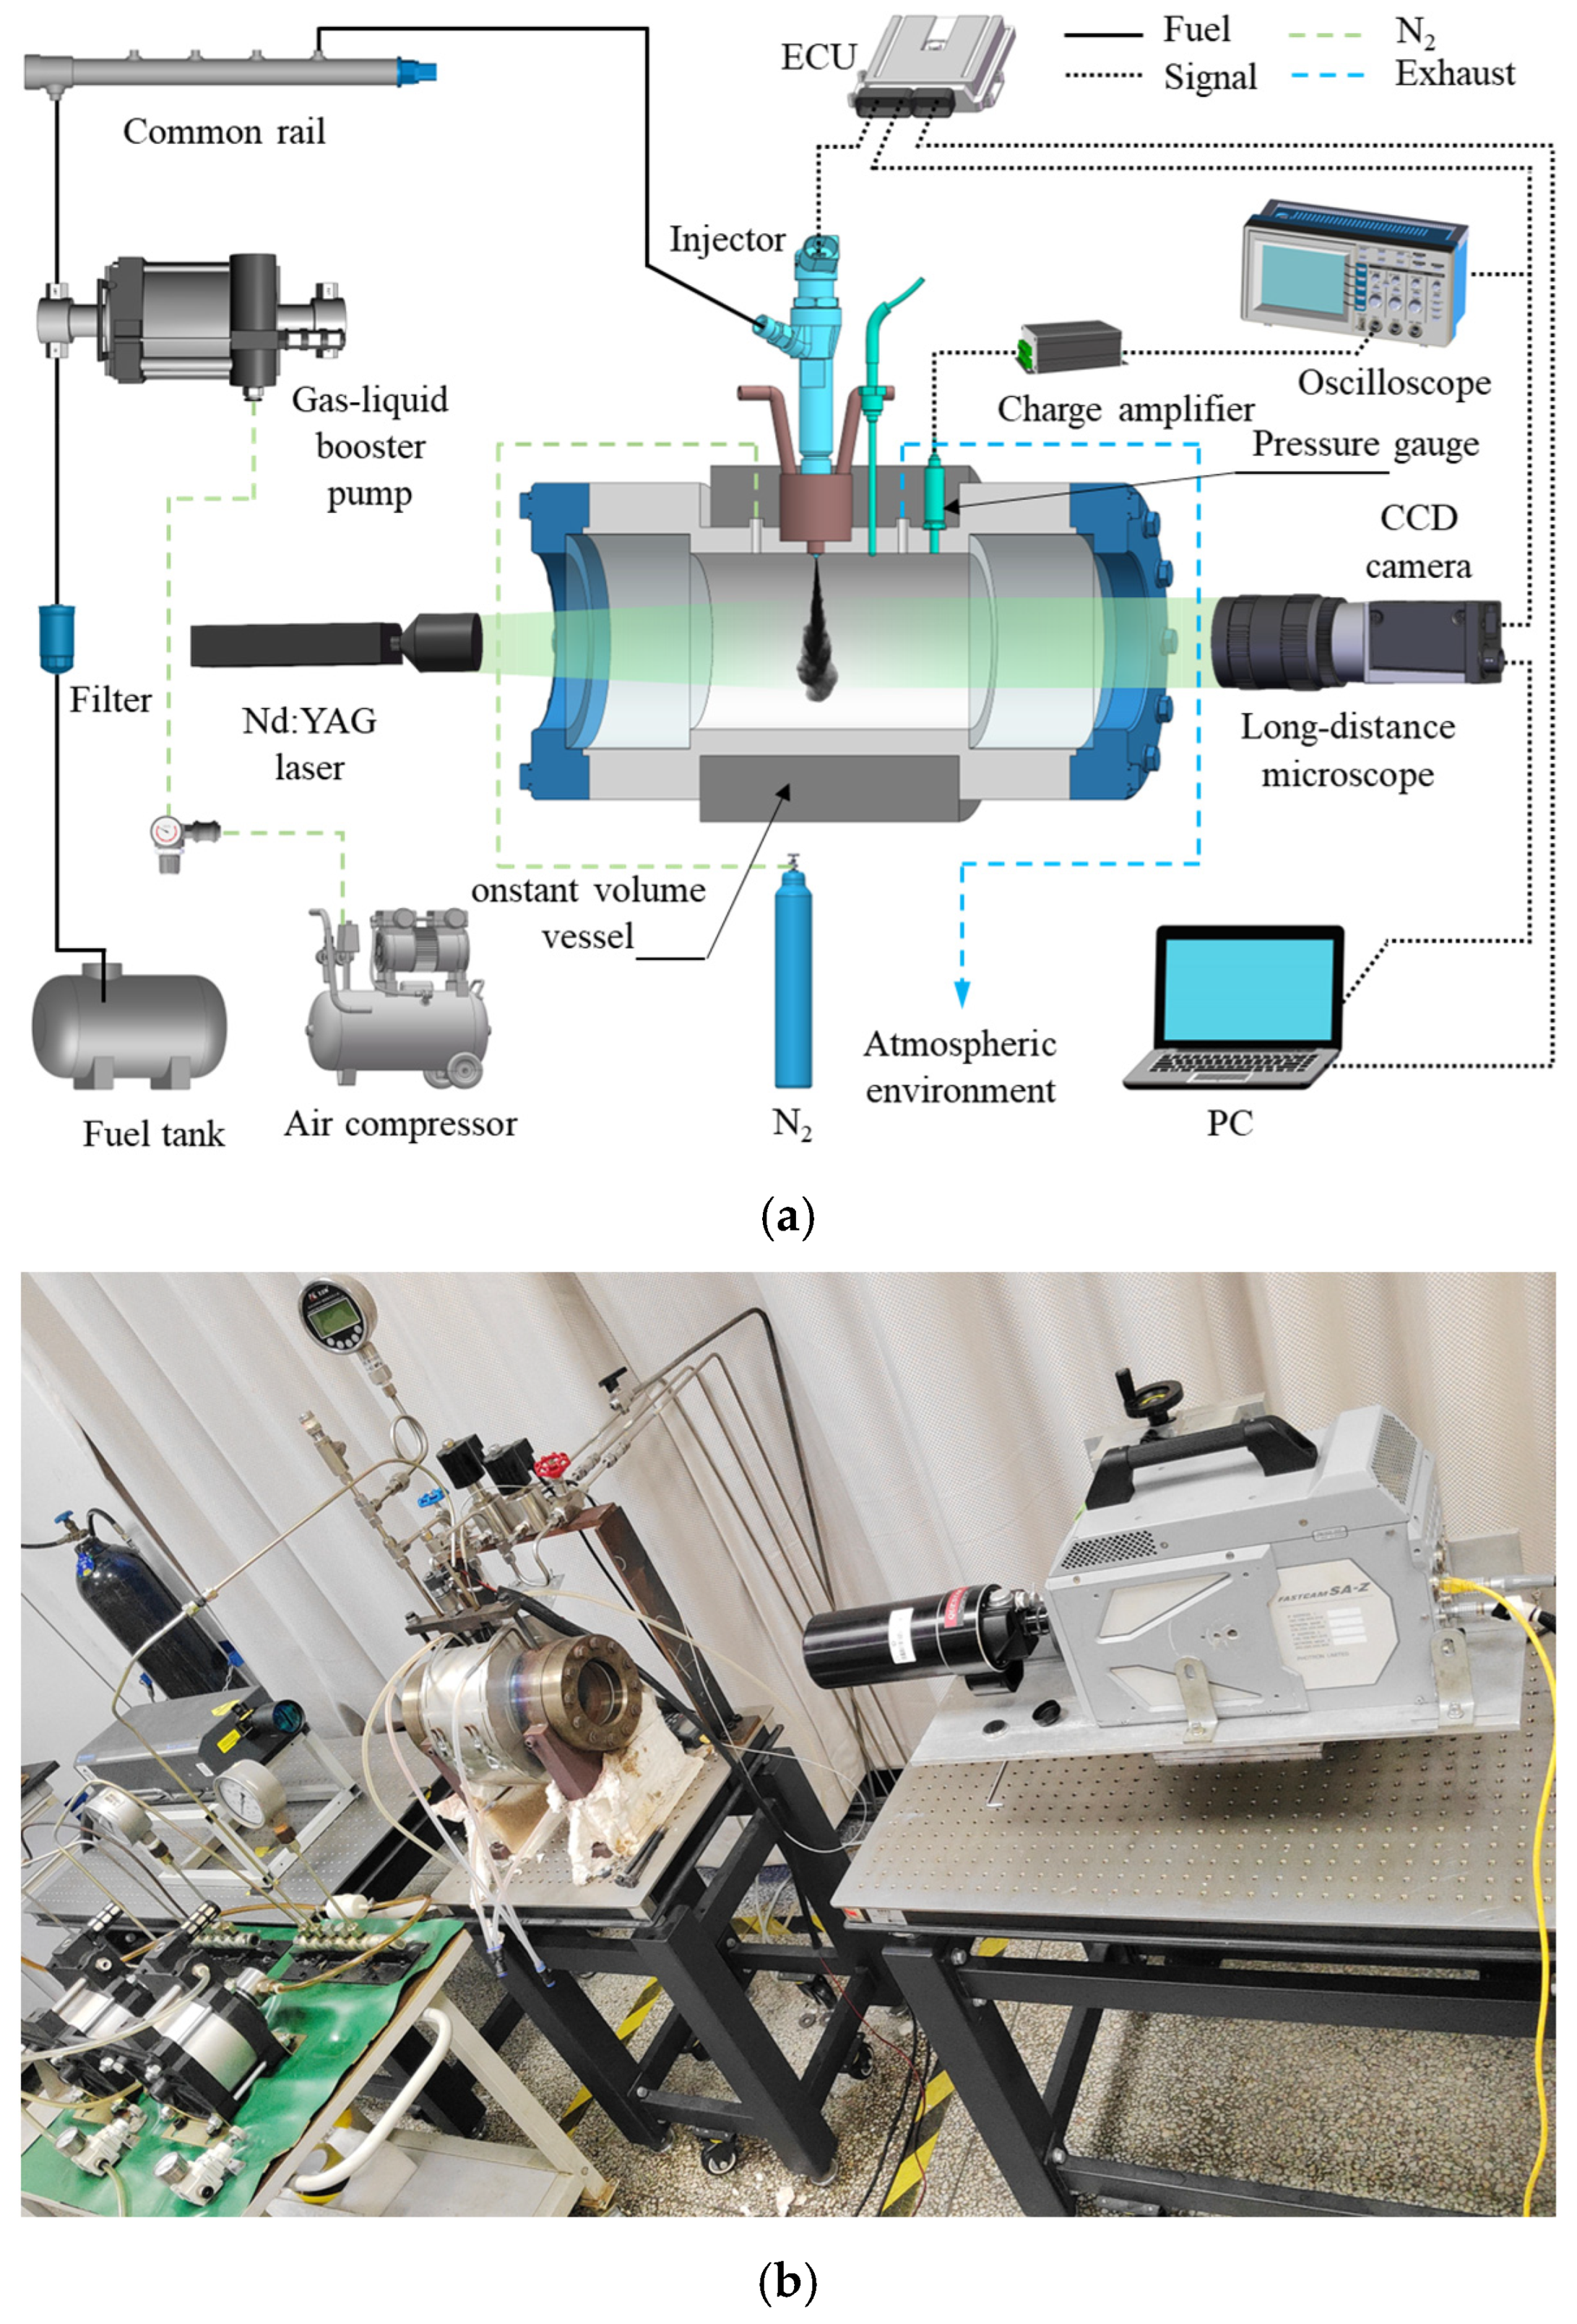
2.1. Experimental System
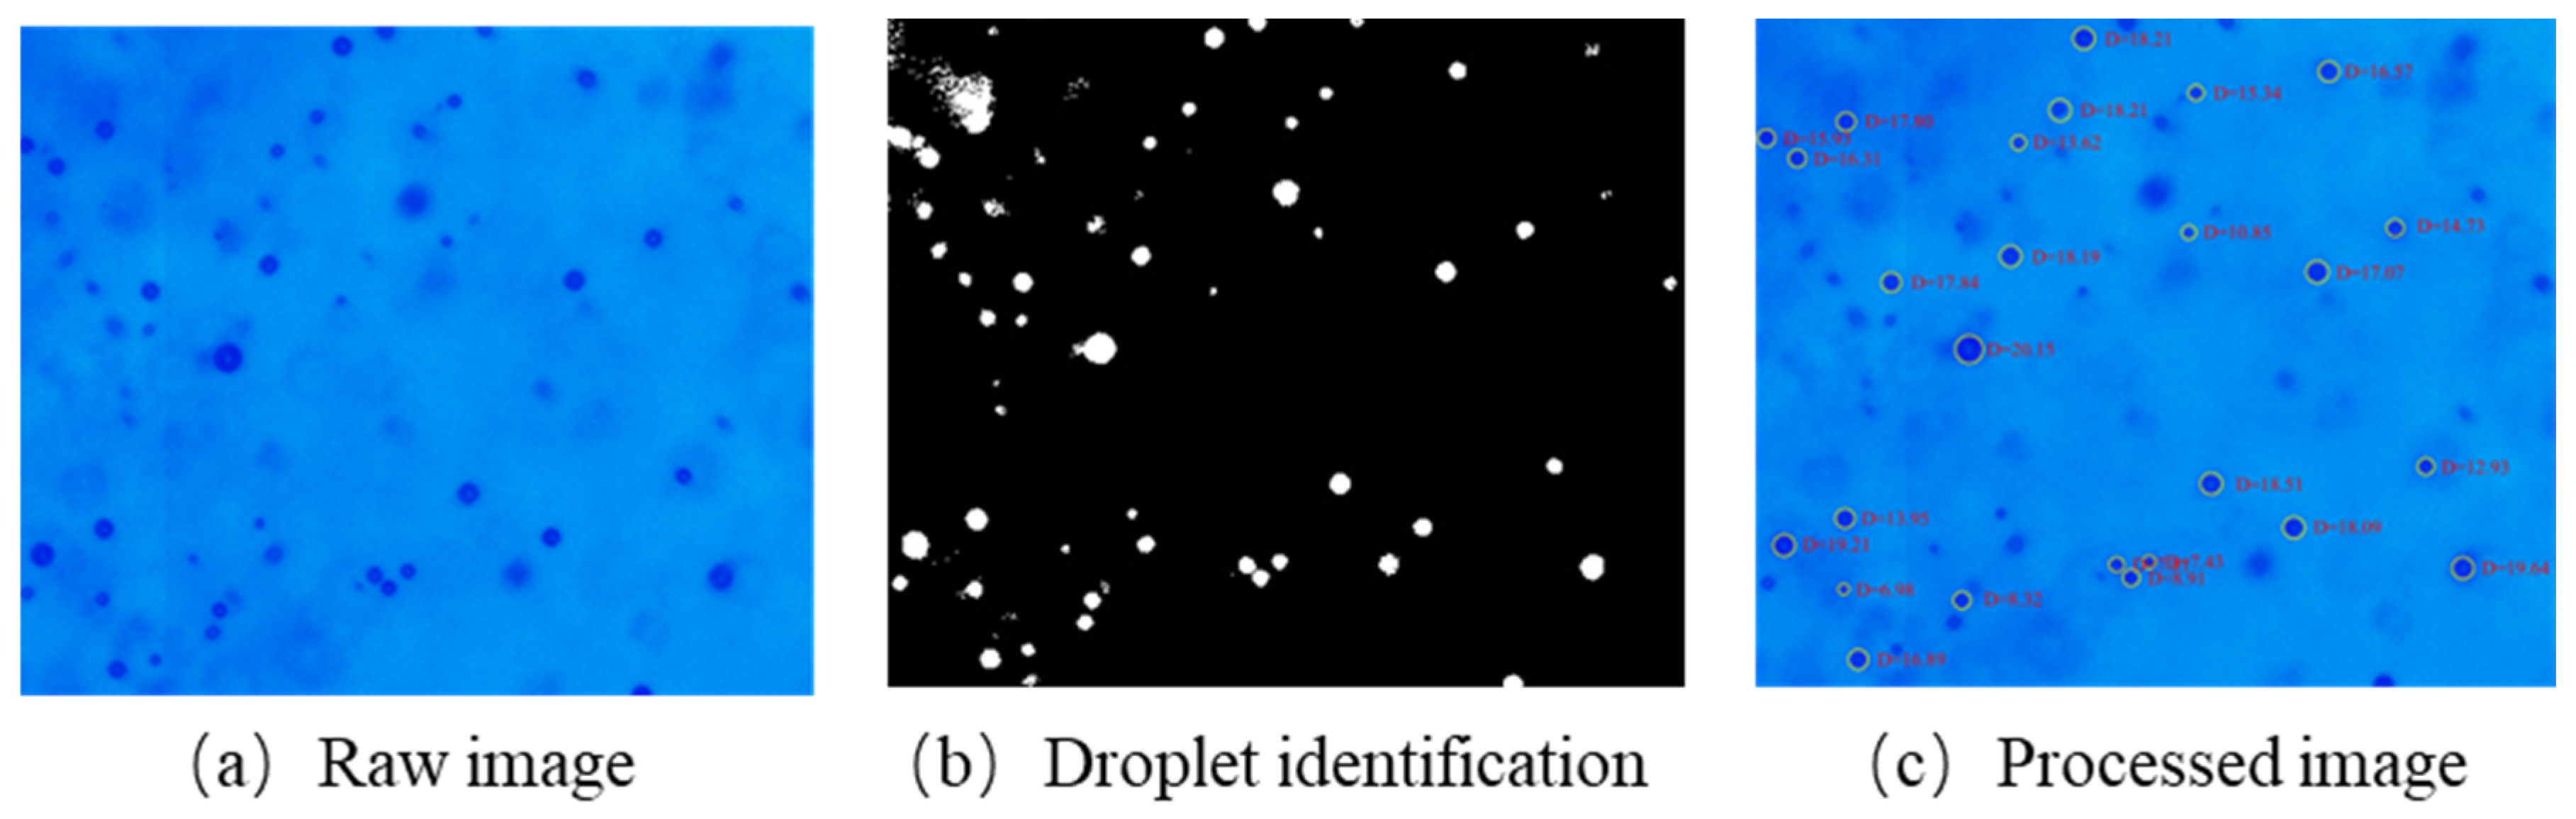
A schematic diagram of the experimental system for drop size measurement with PIA technique is presented in Figure 1. The system consists of a constant volume vessel, a fuel supply system, a droplet imaging system, a spray slicer and a synchronization circuit. The constant volume vessel, designed to withstand pressures up to 5 MPa, features a sectional view in the illustration. The ambient pressure inside the chamber is precisely controlled by a nitrogen gas filling system and monitored using a pressure gauge. Two windows with a diameter of 80 mm and a thickness of 40 mm are placed diametrically opposite, suitable to perform shadowgraph imaging. The fuel supply system consists of a fuel tank to store fuel, a filter, a gas–liquid booster pump driven by air compressor, a high-pressure common rail, and a single-hole fuel injector with a diameter of 0.14 mm (model: NFI3) manufactured by Liaoning Xinfeng Company (Yingkou, China). The maximum rail pressure is up to 120 MPa, and a pressure sensor is installed on the common rail to monitor and synchronously transport the rail pressure. Throughout the experiments, the chamber was maintained at 2 MPa and 293 K, and the fuel pressure is maintained at 80 MPa.

2.2. PIA System

The PIA system is a shadow-graphic approach with a superiority of capturing micro-size droplets in an actual spray field. As shown in Figure 1, the optical setup includes a double-pulsed Nd:YAG laser with a wavelength of 532 nm, a diffuser with a dye plate, a long distance microscope (Questar QM1), and a CCD camera (ImagerProSX 5M). The measured intensity of each laser beam is 220 mJ/pulse and the duration of each pulse is 5 ns. After passing the diffuser, a uniformly distributed cylindrical light beam with a diameter of 120 mm is obtained, so that the whole field of the chamber is illuminated. Droplet imaging is achieved using the CCD camera coupled with the long-distance microscope, which is installed on an electrically controlled three-way positioner MC600 (with a resolution of 1 μm).

2.3. Spray Slicer

In order to capture the clear image of the microscopic droplets across the entire spray region, a spray slicer was implemented. This device operates on the principle of selectively transmitting only a narrow portion of the spray, thereby filtering out the rest of the liquid phase, to solve the problems of high liquid concentration and poor light transmission of the dense spray region. The structure and the specification of the spray slicer are shown in Figure 2. The slicer consists of two 4 mm-high steel plates arranged at a 120° angle to minimize interference with spray development. The gap between the plate tips is adjustable with a precision of 0.1 mm. For this study, it was set to 0.4 mm; this is based on prior validation studies that balanced optimal observation quality with minimal perturbation of spray dynamics [46]. Comparative images in Figure 2 demonstrate the slicer’s effectiveness in clarifying the dense spray region. Frankly speaking, using the spray slicer may affect the spray macroscopic and microscopic behaviors to some extent. So, we minimized the slicer height to 4 mm, and the images were captured at just 5 mm below the cut point to reduce this impact. In addition, based on free development law of the spray, the size and velocity of the droplets on the measurement plane which is perpendicular to the light beam are little affected. This is because the spray spreads outwards, and the surrounding droplets have little effect on the droplets remaining in the center. This is also verified by the comparison of droplet size distributions before and after using the slicer, as shown in Figure 2b, in which the distribution curves at the same position almost overlapped. Given the inherent difficulties in visualizing dense sprays, the PIA system combined with the spray slicer provides a reliable and accurate method for characterizing droplet size and velocity in such challenging conditions.

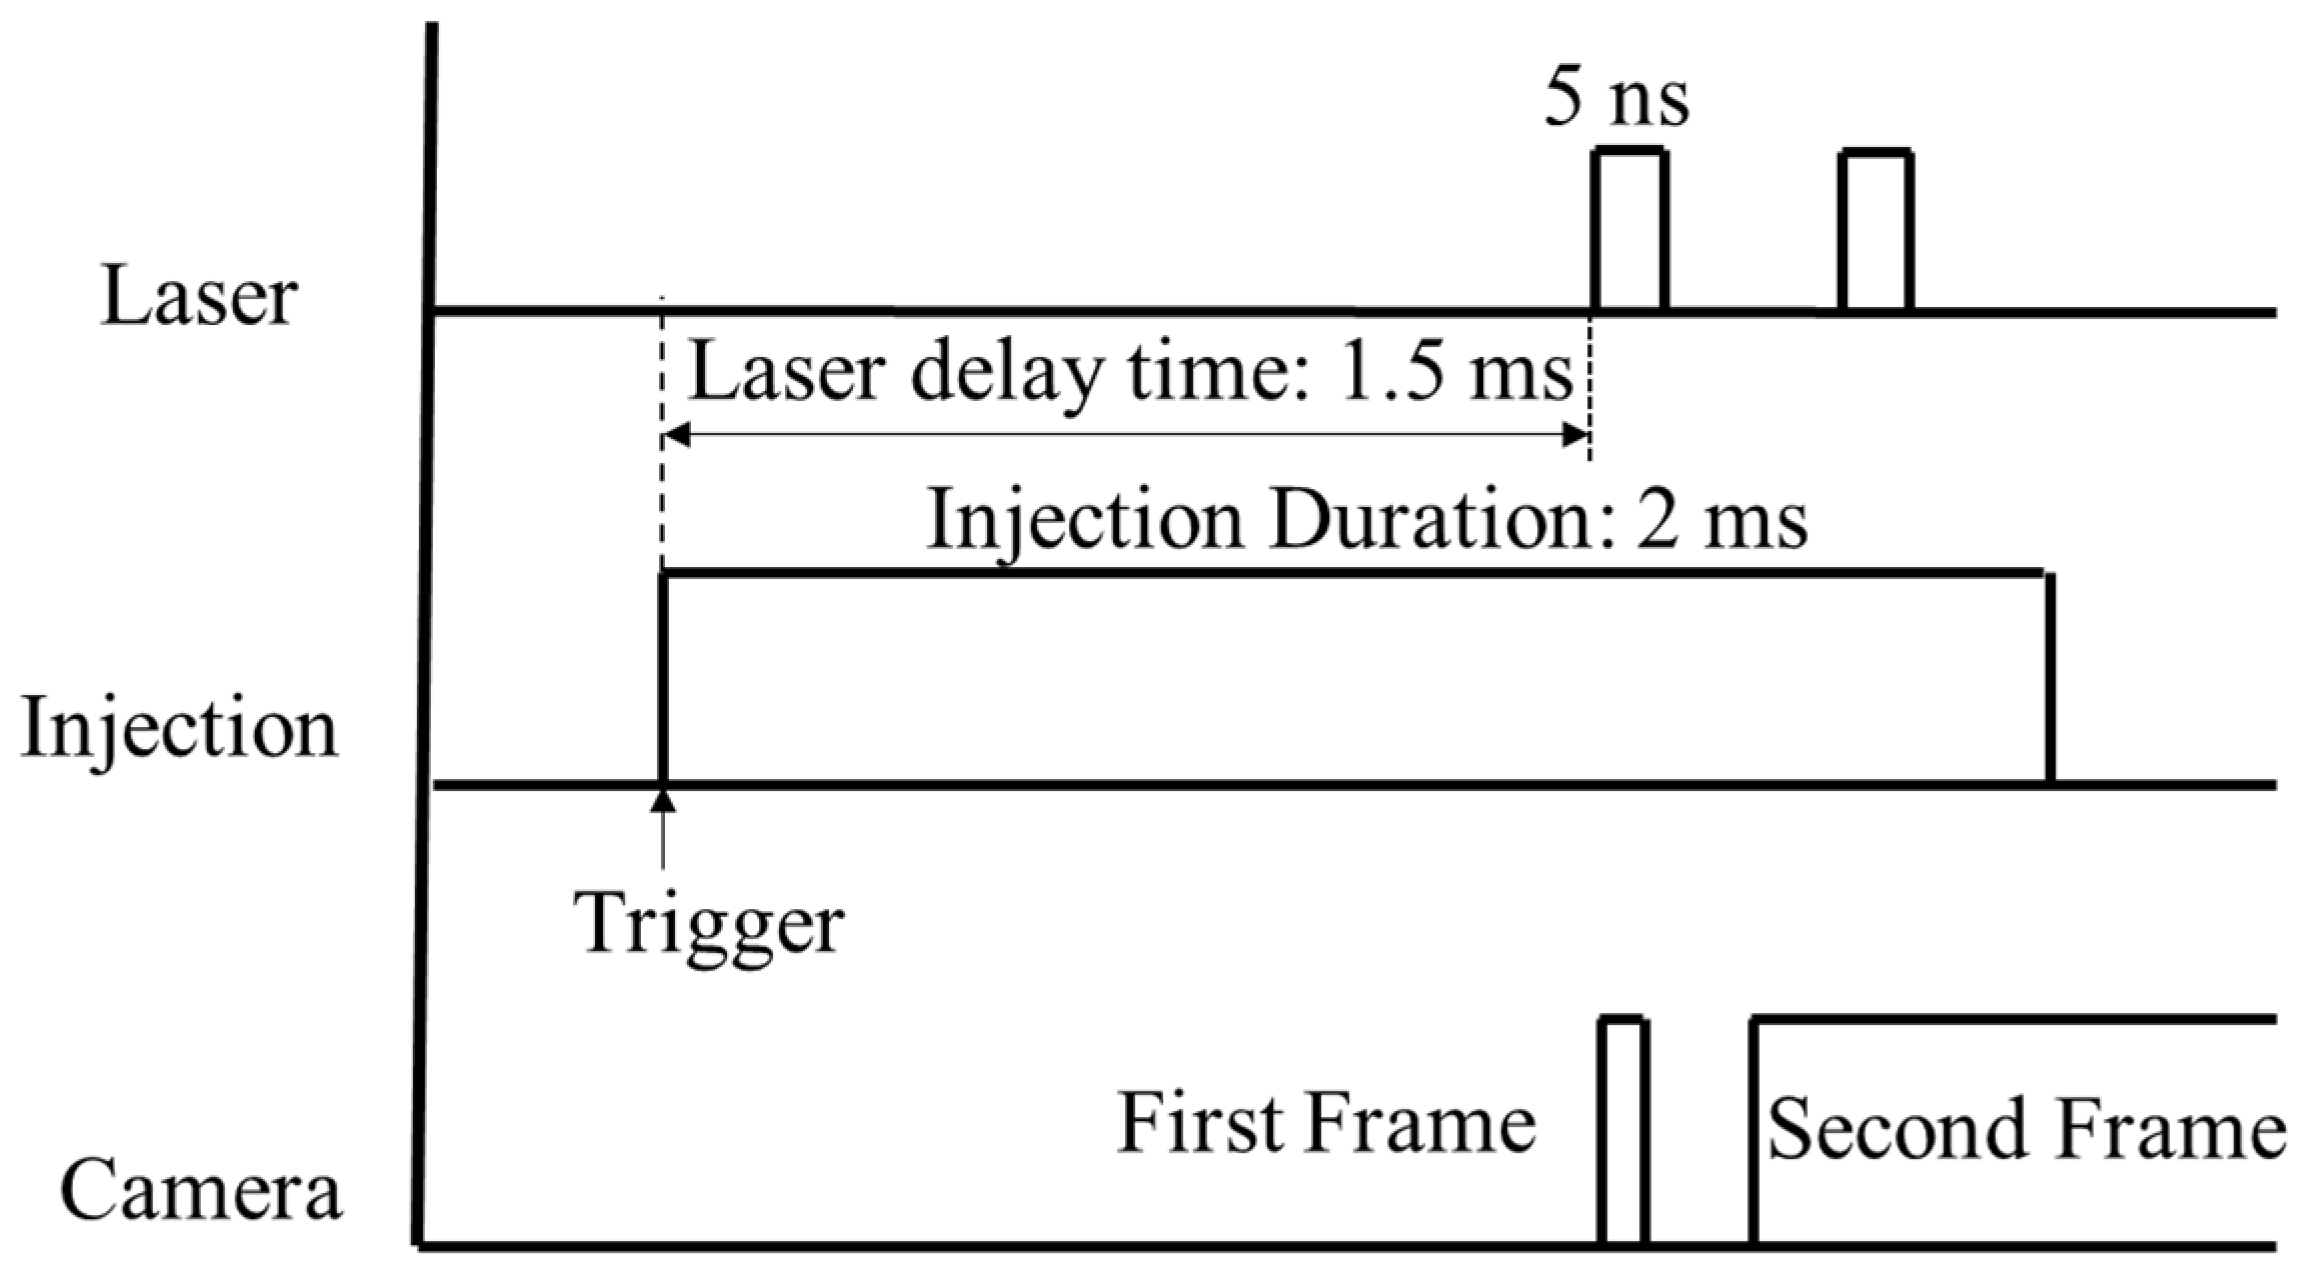
2.4. Test Locations and Procedure

The signals of laser triggering, camera capturing, injector solenoid valve driving, rail pressure monitoring, and controlling are regulated by a synchronization circuit. The pulse sequence of different trigger signals is shown in Figure 3. The injection duration was set as 2 ms in this experiment, and the droplet images were recorded at 1.5 ms after the start of injection when the spray was fully developed (captured by using the high-speed photography before this experiment). A grid of measurement locations labeled by the red squares is shown in Figure 4. The droplet measurements are conducted on one side of the spray axis, and performed from 20 to 80 mm below the nozzle tip in steps of 20 mm in the axial direction, indicated as Z = 20, 40, 60, 80 mm. Z = 20 mm represents a near-nozzle region, Z = 40 and 60 mm are in spray midbody, and Z = 80 mm reaches the spray tip. The measurements also performed in steps of 2 mm along the radial direction from the axis of the spray concluding dense regions and dilute regions, indicated as R = 0, 2, 4, 6, 8 mm. The positive directions of Z and R were also labeled in this figure. When different locations in Z direction were measured, the position of the slicer was adjusted accordingly. A total of 20 injection events at each test location were recorded and more than 5000 validated droplets counted, ensuring that the statistical droplet size and velocity distributions were independent of the number of droplets.
During the testing process, the laser and the camera are operated in the double-pulse, double-frame mode. The imaging system provided a field of view of 2.0 × 1.7 mm2 with a resolution of 0.81 µm/pixel. Figure 5 shows the raw microscope image and droplet sizing process. In the procedure, the color images were first converted to the grayscale style after subtracting background, then the droplet boundary was recognized by using Hough transformation and watershed algorithm methods. Subsequently, each droplet size was calculated by counting the number of occupied pixels and then labeled in the processed image. Droplet velocities were determined by tracking displacement between consecutive frames during the known laser pulse delay interval. The details have been described in our previous studies [28,29]. The complete experimental conditions and fuel properties are summarized in Table 1.

3. Results and Discussion

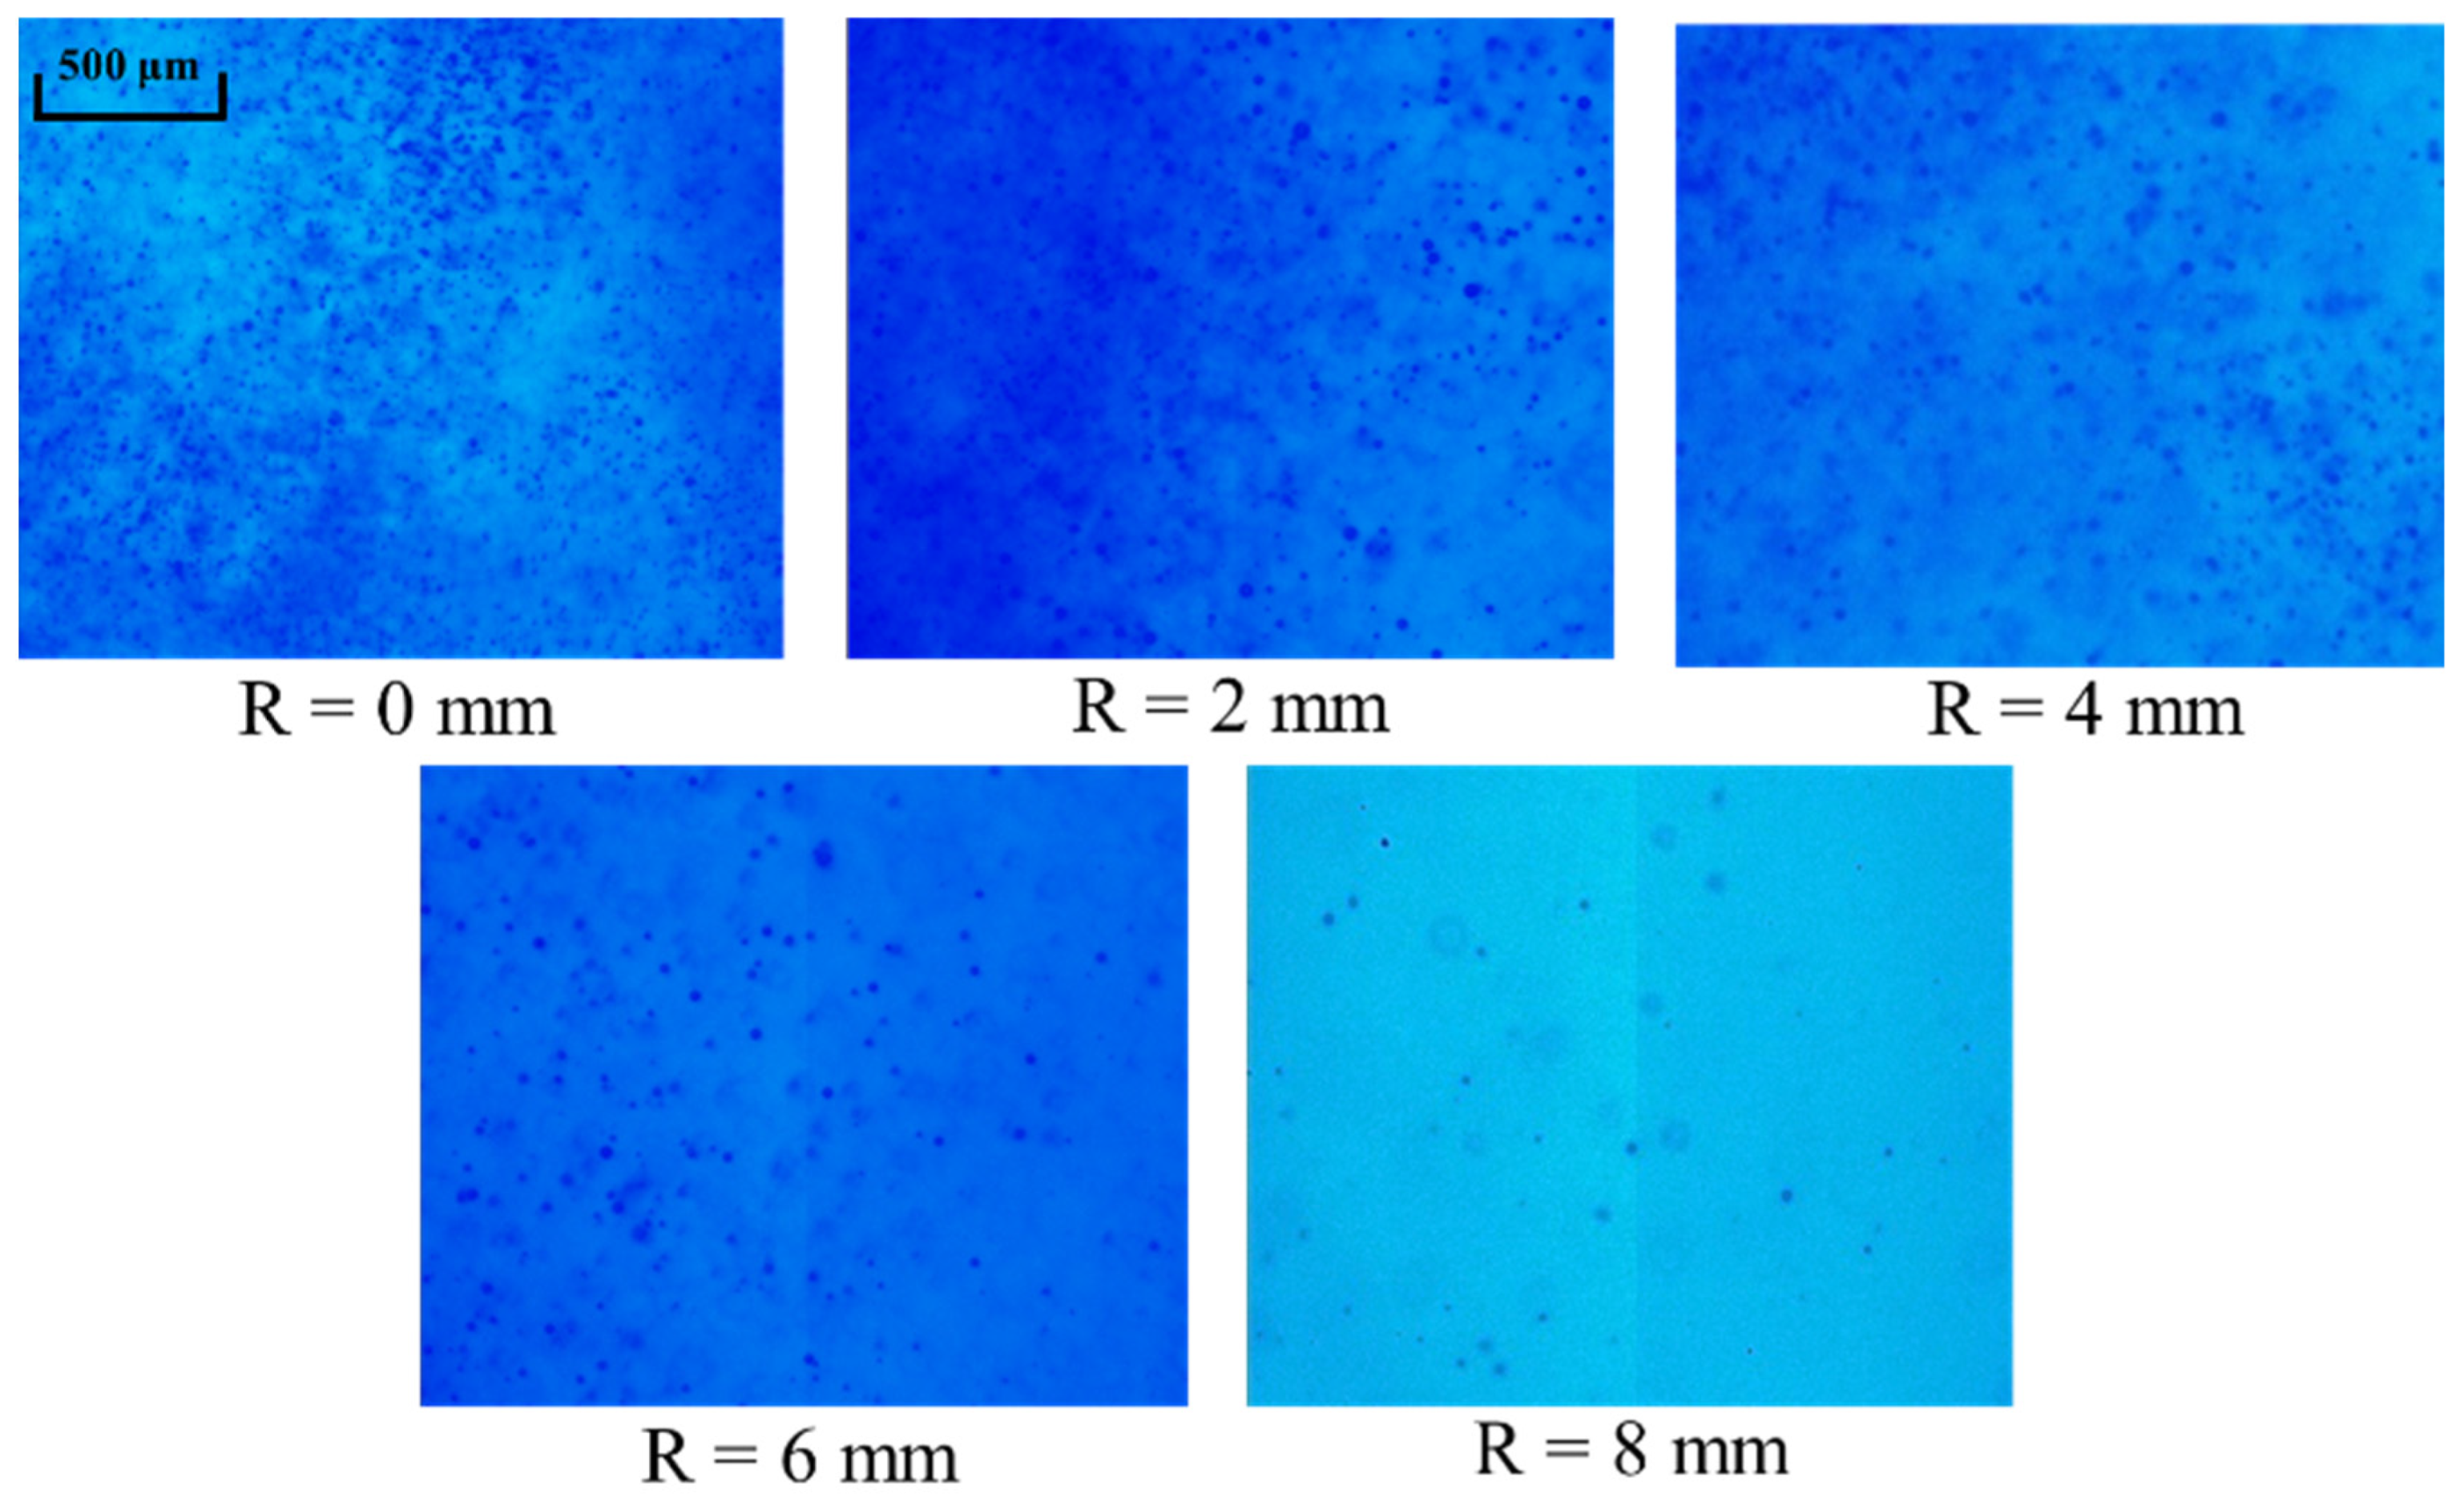
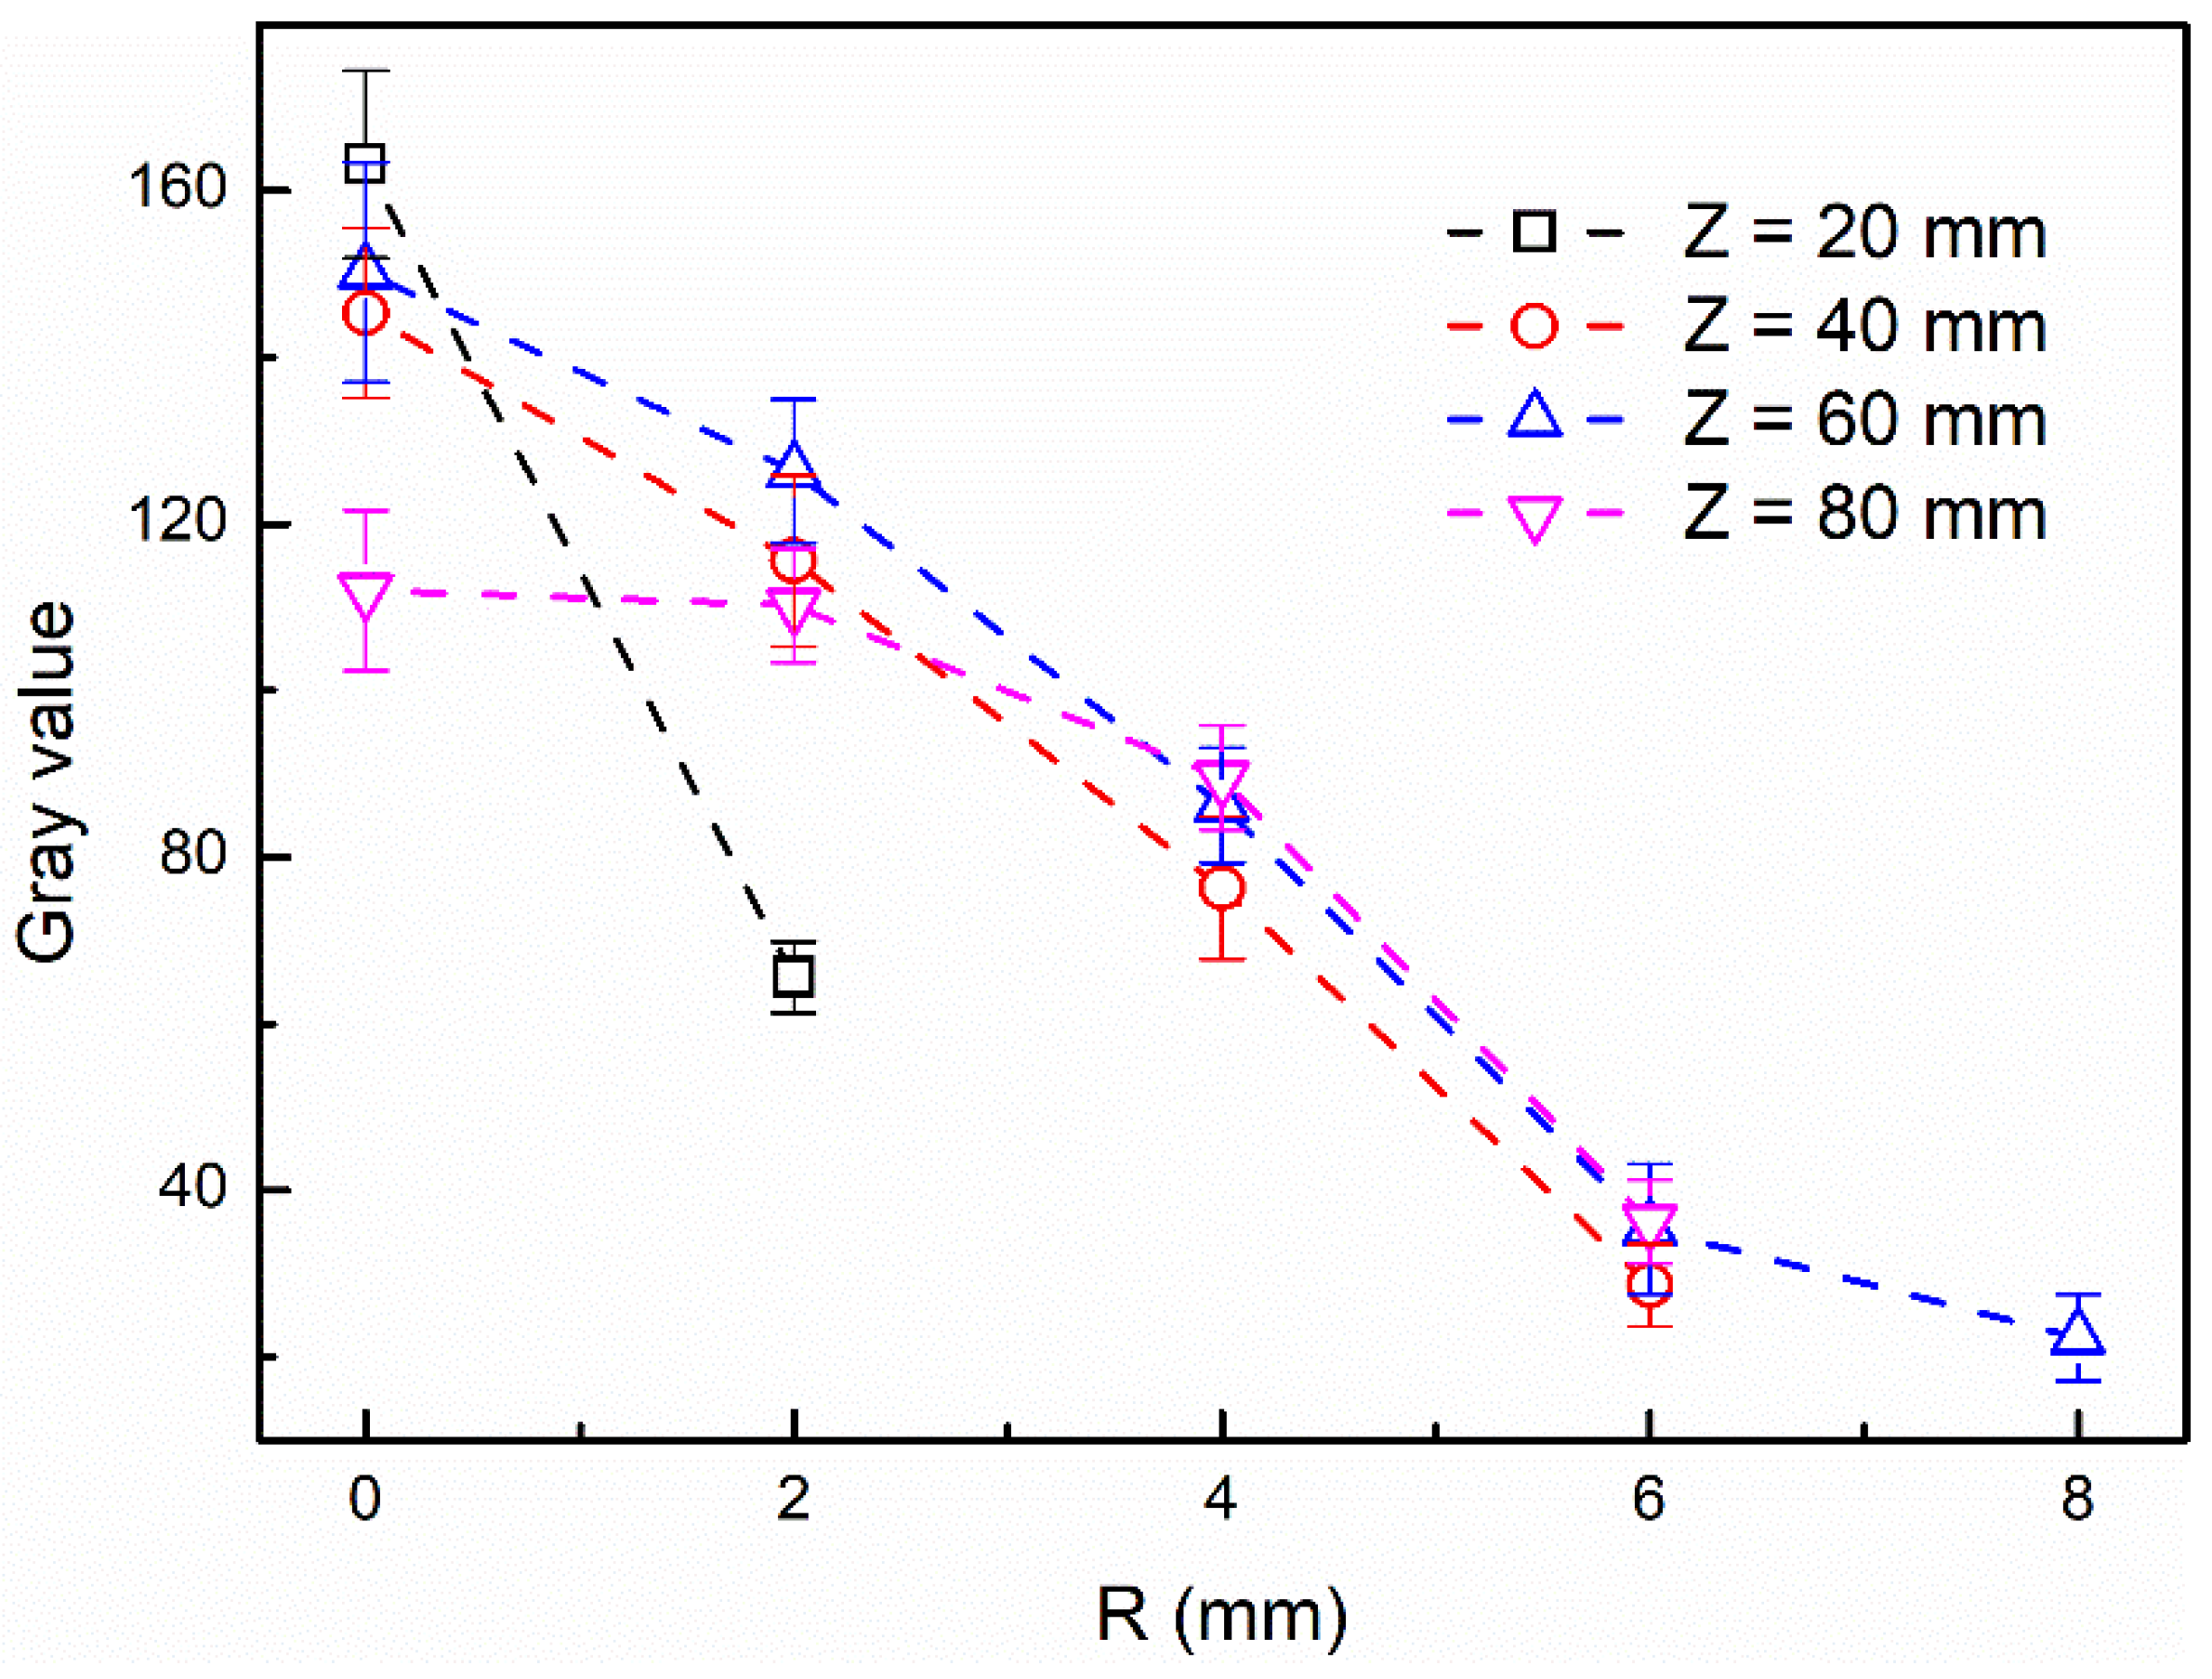
3.1. Microscopic Spray Structure

Figure 6 shows typical microscopic images at the centerline of the methanol spray (R = 0 mm). A large number of dispersed and jointed droplets as well as lumped liquid masses were observed at all the four axial locations, indicating that all the measurement positions are all located in dense spray region and present poor atomization. For droplet size and velocity distribution analysis, only clearly focused individual droplets in the focal plane were considered statistically significant. The images also show out-of-focus liquid structures appearing as blurred clouds, resulting from numerous defocused ligaments and liquid masses interconnected beyond the focal plane. These structures were excluded from quantitative analysis due to boundary ambiguity caused by depth-of-field limitations. Notably, at Z = 20 mm, distinctive droplet dynamics are observed, including droplet coalescence forming larger droplets and ligament fragmentation producing non-spherical droplets, as highlighted by the red box. The big droplets and ligaments are much fewer in number compared to small, dispersed droplets, constituting a considerable mass of liquid in the methanol spray. They play a significant role in hydrocarbon emission due to local lower air-fuel ratio, as mentioned by reference [51]. The observed interconnected ligaments and droplets suggest ongoing secondary breakup processes, with their frequency decreasing substantially along the axial direction. This phenomenon aligns with established droplet breakup theory, where secondary breakup primarily results from aerodynamic shear. The developing shear layer at the air–liquid interface, driven by the velocity differential, weakens progressively as momentum transfer between droplets and ambient gas reduces their relative velocity, consequently diminishing secondary breakup intensity along the spray axis.
The liquid phase distribution of the spray also differs radially due to the air entrainment. In order to analyze the distribution along the radial direction, Figure 7 presents typical images captured at Z = 60 mm. It is observed that the liquid phase concentration decreased significantly along the radial direction. At R = 2 mm, the interconnected droplets and blurry droplet clouds were also detected, indicating that this measurement window also located in dense spray region and the secondary breakup is in process. By contrast, at R = 4 mm, liquid masses nearly disappear, marking a transition from the dense spray region to the dilute spray region. Further outward, at R = 6 mm and 8 mm, only isolated, well-defined droplets are detected, indicating the dilute spray regime. Beyond R = 8 mm, droplet counts diminish sharply, suggesting limited radial expansion of the spray. Droplets at these extreme radial positions were excluded from statistical analysis.
Since the PIA technique provided shadow images of the methanol spray in this study, the gray value of the image qualitatively indicates the liquid-phase density. Gray value refers to the numerical representation of the brightness or intensity of a pixel in a grayscale image. It quantifies how light or dark a pixel appears, typically ranging from 0 to 255. So, the calculated mean gray values of the test windows are shown in Figure 8. In the figure, different axial positions were depicted by different color lines, and the error bars represent the standard deviation of the repeated tests. Along the center axis, Z = 20 mm has the maximum value of about 160, indicating maximum liquid phase concentration in this location. Similar values were detected at Z = 40 mm and 60 mm, which is about a 10% reduction compared to Z = 20 mm. Z = 80 mm exhibits a more substantial decline, with values dropping by approximately 31%. Additionally, all four axial positions display a pronounced radial decrease in grayscale intensity. The steepest gradient occurs at Z = 20 mm, while the other three positions follow a comparable trend. Notably, the spray boundary regions exhibit uniformly low values (less than 20% of those in the dense core), reflecting minimal liquid concentration near the gas–liquid interface.

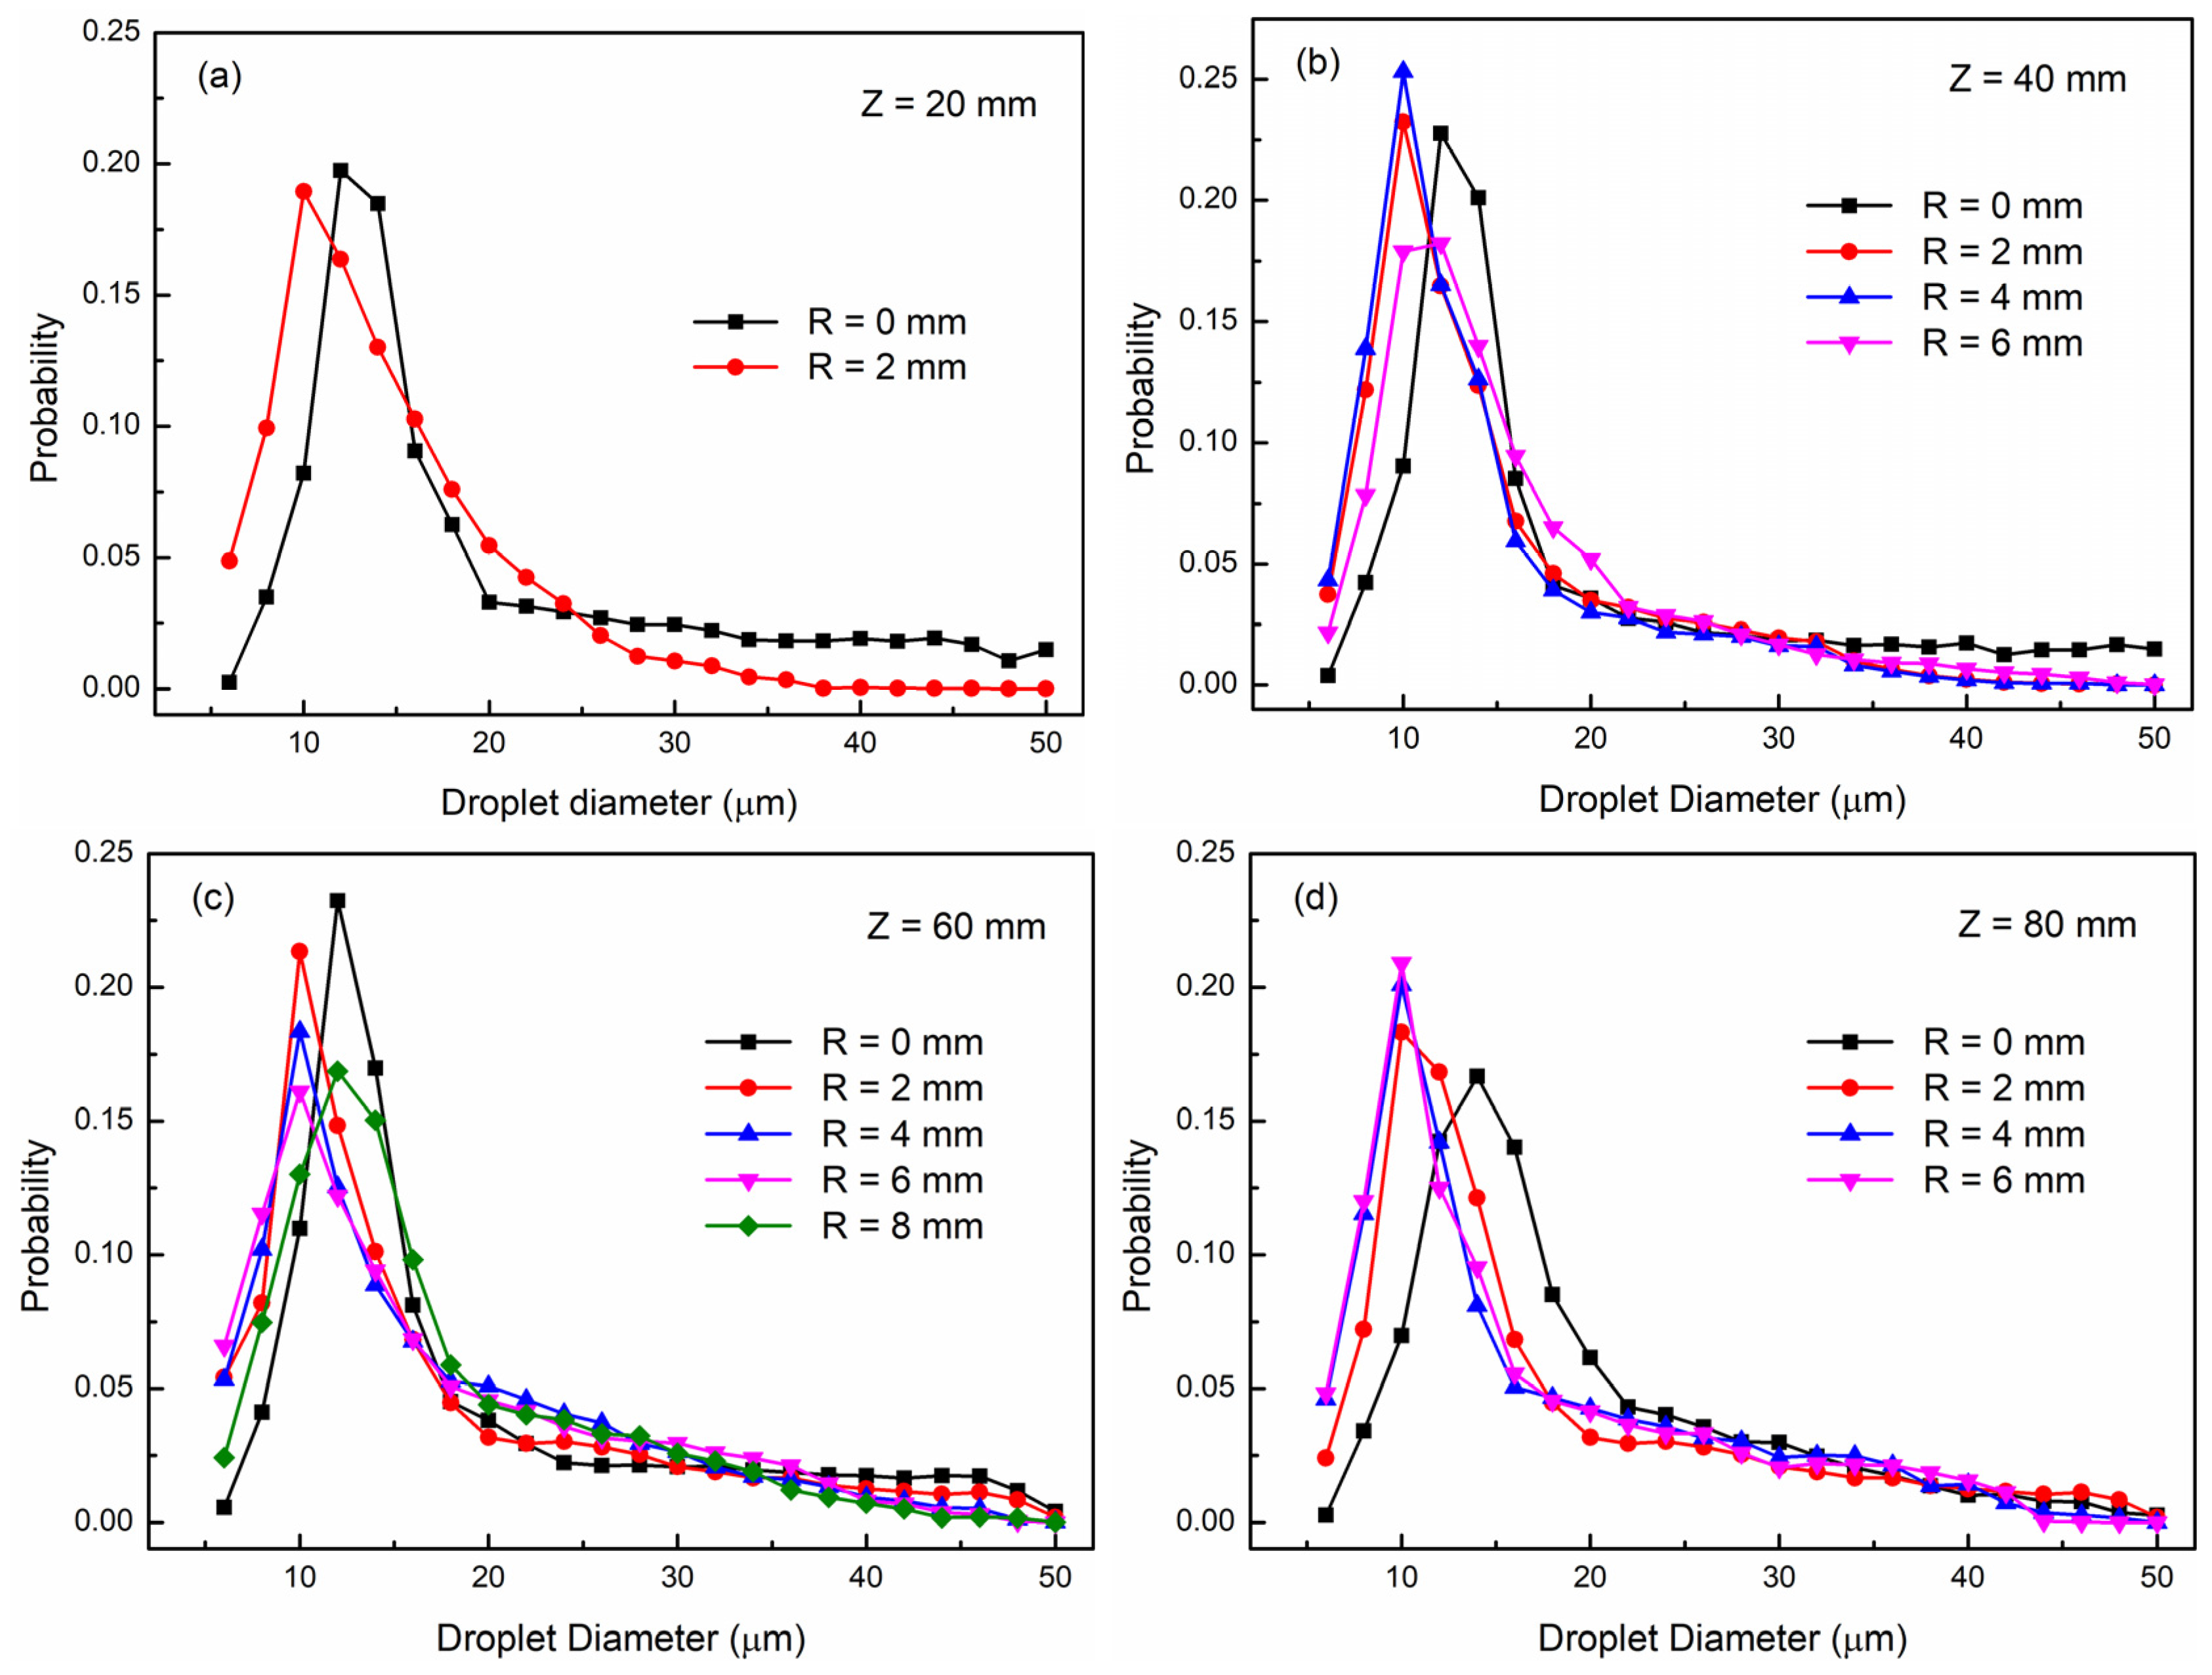
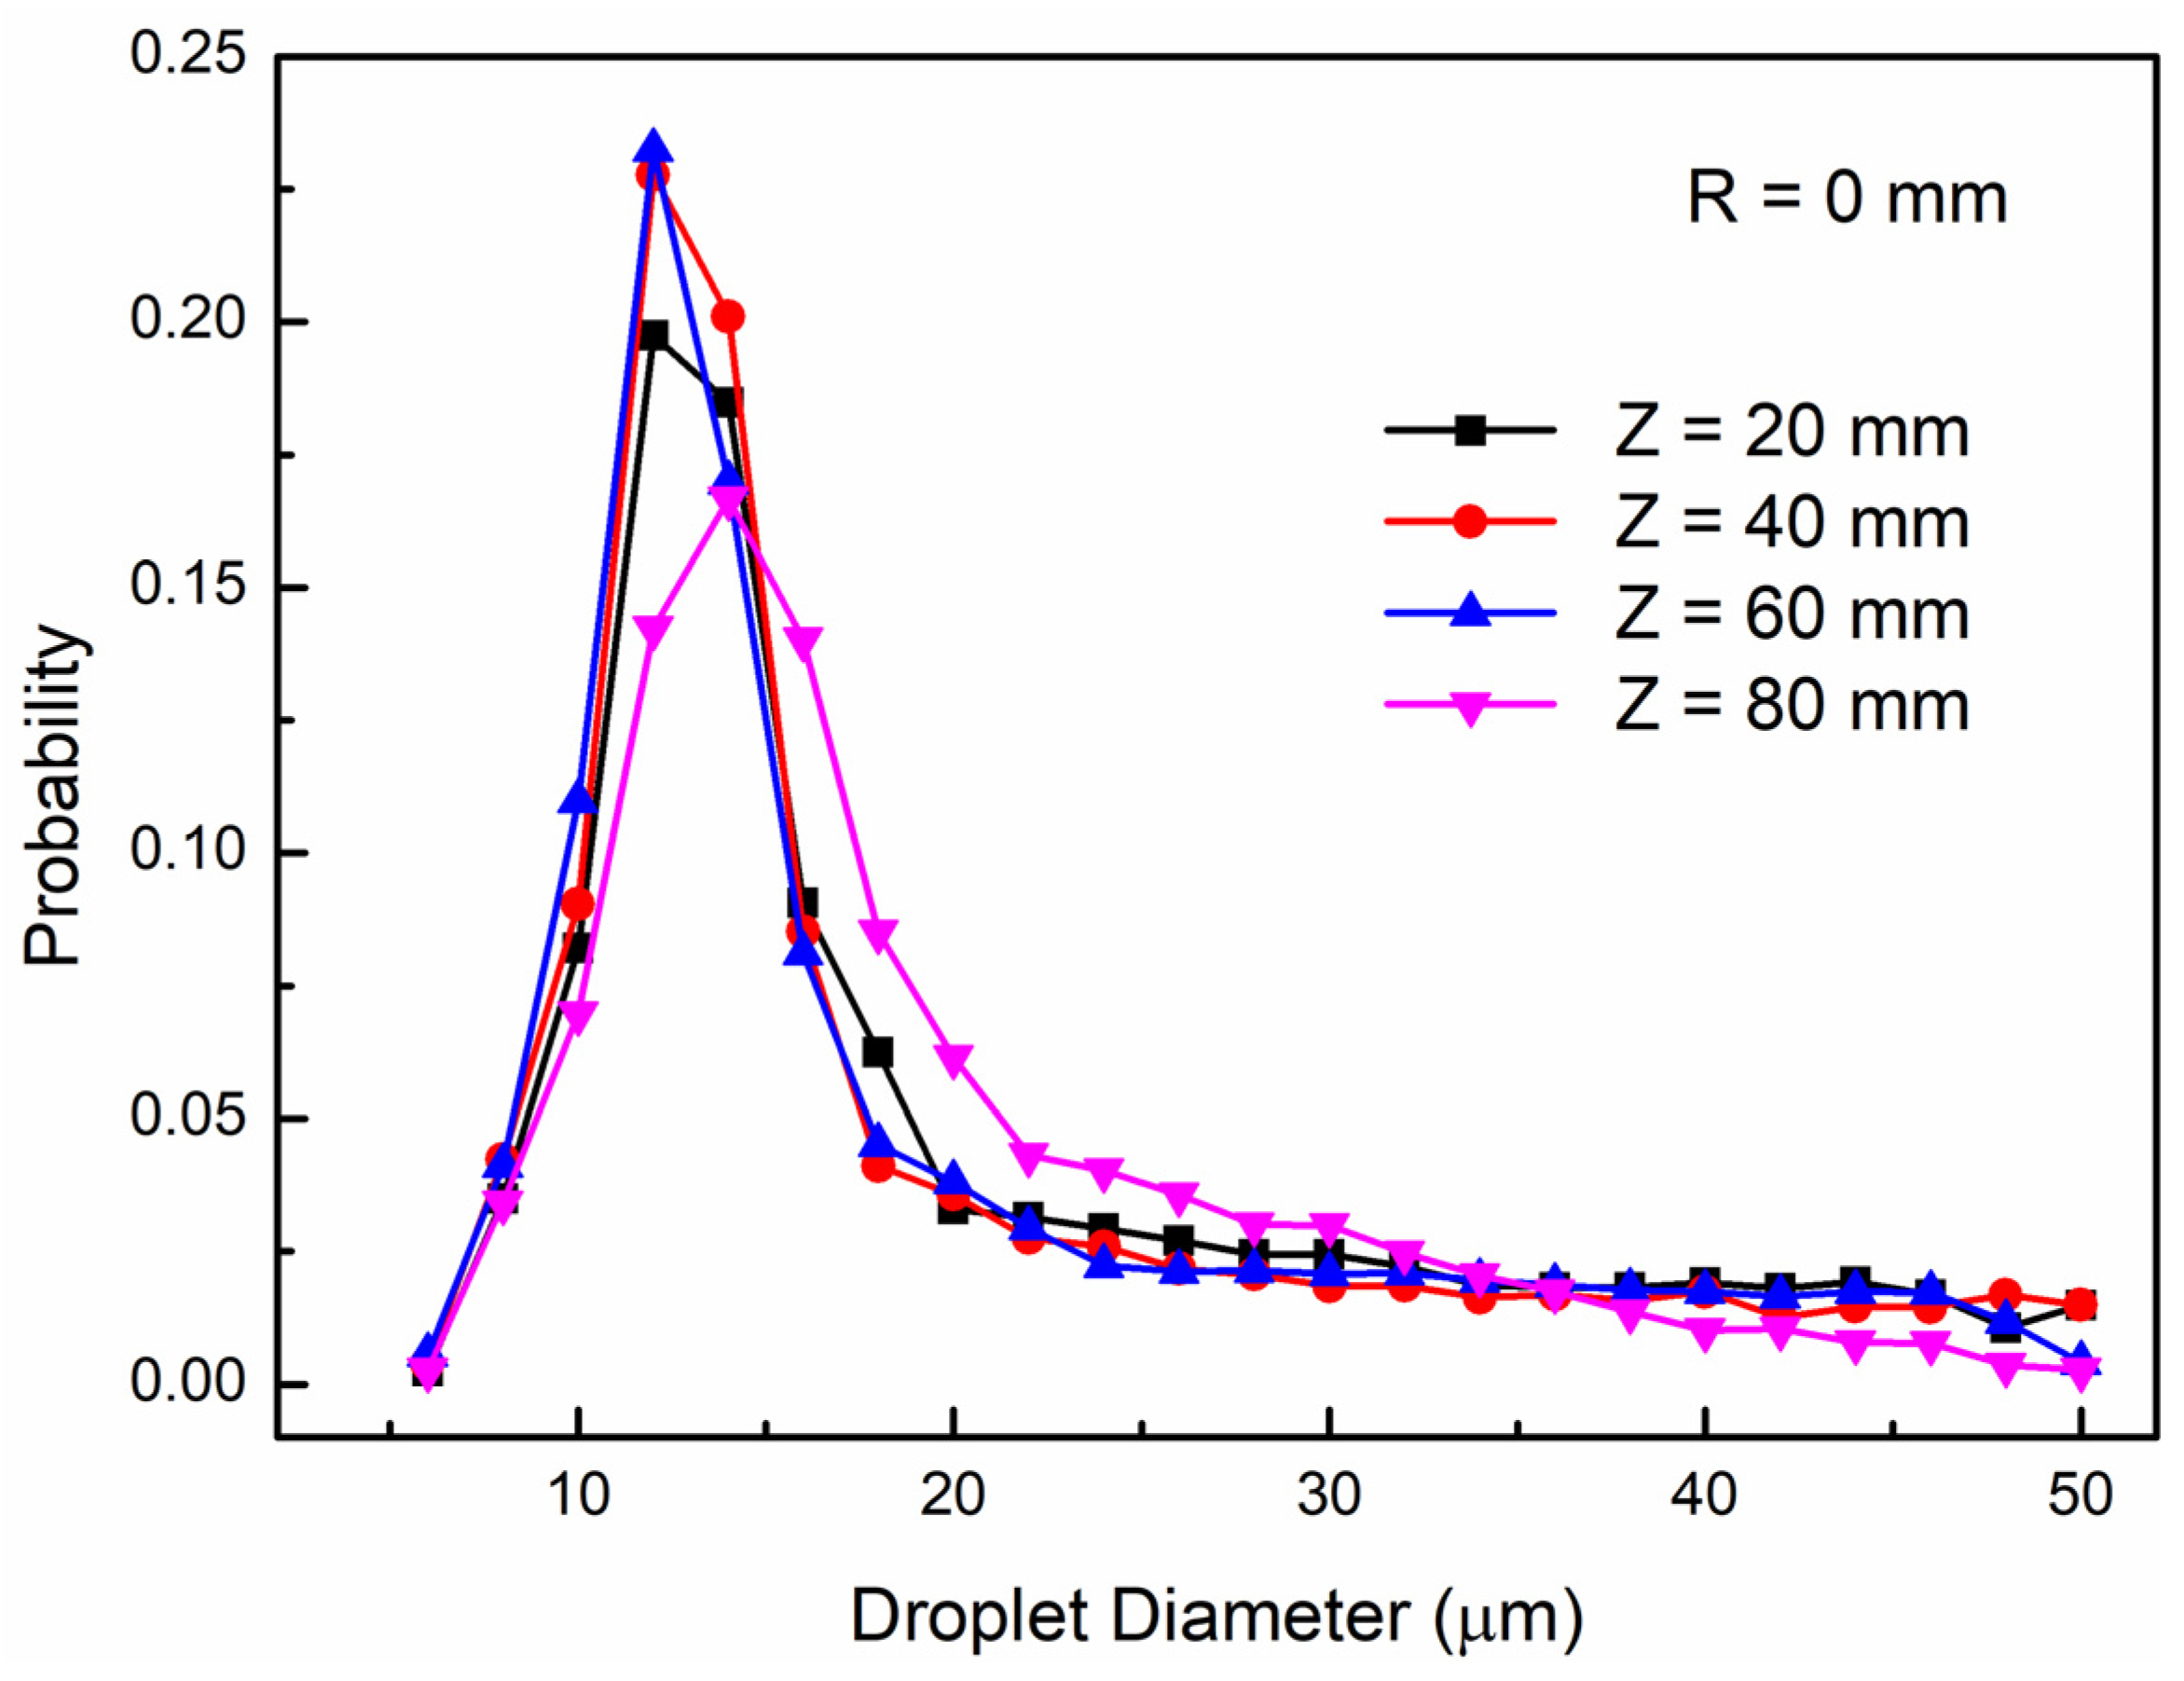
3.2. Droplet Size Distribution

The PIA technique provides droplet size for an entire range, and further analysis of the microscopic characteristics of droplets is carried out by quantifying the droplet statistics. Figure 9 and Figure 10 present the droplet size distributions of all test locations. The probability is the ratio of the droplet number with a specific size to the total number. Figure 9 organizes the data by axial position to highlight radial variations, while Figure 10 presents the same data to emphasize axial trends. Notably, all test conditions yielded maximum droplet diameters exceeding 50 µm. However, these large droplets account for less than 0.1% of the total population, showing minimal variation across conditions. The distributions consistently exhibit unimodal characteristics across all measurement locations. The highest probability density occurs for droplets in the 8~20 µm diameter range, while the frequency of maximum-sized droplets remains extremely low.
At Z = 20 mm, the distribution curves exhibit a distinct shift in peak probability density toward smaller droplet sizes. Specifically, the most probable droplet diameter decreases from 12 μm at R = 0 mm to 10 μm at R = 2 mm. As discussed in Ref. [52], the liquid jet has a high velocity near the nozzle tip, the primary breakup is in process, with high disruptive shearing forces acting on the liquid, rough surface columns consisting of branched and elongated liquid fragments are formed, and droplets and ligaments are pinched off from the column and branches with initial radial momentums. Smaller droplets experience greater aerodynamic drag, enhancing their radial dispersion, while larger droplets maintain sufficient momentum to continue downstream. Consequently, our measurements show a pronounced reduction in the probability of droplets exceeding 25 μm diameter with increasing radial distance, consistent with this size-dependent transport mechanism.
For Z = 40 mm, the peak frequency also occurs for droplets with a diameter of around 12 μm at R = 0 mm, the peak value is higher than that of Z = 20 mm, while the number of larger droplets decreases, as shown in Figure 10. This is because the secondary breakup was occurring dramatically at Z = 20 mm and many big droplets split into small droplets with the spray evolution. Similarly, the curves shift to a smaller droplet size at R = 2 and 4 mm, and the probability of small droplets is higher for R = 4 mm. It can also be explained by the radial movement of small droplets. However, it is interesting to find that at spray periphery R = 6 mm, the proportion of large droplets increases, and the curve is much smoother, indicating a more uniform size distribution. This may be caused by the collisional effects and vortex effects [53]. Because of the air shear forces, the droplets in the outer layer of the spray have more disordered movement than the central region, so coalescences after collisions between droplets become more frequent, leading to an increase in the number probability of big droplets. We also note that the momentum transfer from the decelerating spray generates turbulent shear flow vortices. These vortices preferentially transport larger droplets toward the spray periphery through centrifugal effects, while simultaneously promoting more homogeneous mixing of droplet sizes.
Further downstream at Z = 60 mm along the spray centerline, the droplet size distribution maintains characteristics similar to those observed at Z = 40 mm, suggesting that the intensity of secondary breakup diminishes significantly beyond 40 mm from the nozzle. The radial evolution of the distribution shows a consistent trend toward smaller droplet sizes at R = 2, 4, and 6 mm, accompanied by a gradual reduction in peak probability density. However, an interesting reversal occurs at the outermost measured position (R = 8 mm), where the most probable droplet diameter returns to 12 μm and the fraction of larger droplets increases substantially. This distribution can also be explained by the mechanisms of collisional effects and vortex effects. It should be noted that the droplet velocity decreased with spray evolution, the coalesces of the droplets would become more frequent at the location of R = 4 mm, resulting in a decrease in the proportion of small droplets.
For the spray tip, Z = 80 mm, very different droplet size distributions were observed. At the spray centerline, the distributions curve shift to the larger droplet size, the peak value decreases significantly, and the size distribution becomes more uniform. Along the radial direction, the curves shift to the smaller droplet size, and the peak value increases. In addition, very similar distributions of R = 4 mm and R = 6 mm were detected. This is because since the spray and droplets penetrate a large area, the initial axial momentum decreases to a very low level. The strong gas entrainment at the spray tip promotes radial diffusion of droplets, particularly smaller ones. The weakening of entrainment effects at locations farther from the axis further contributes to these observed distribution characteristics.

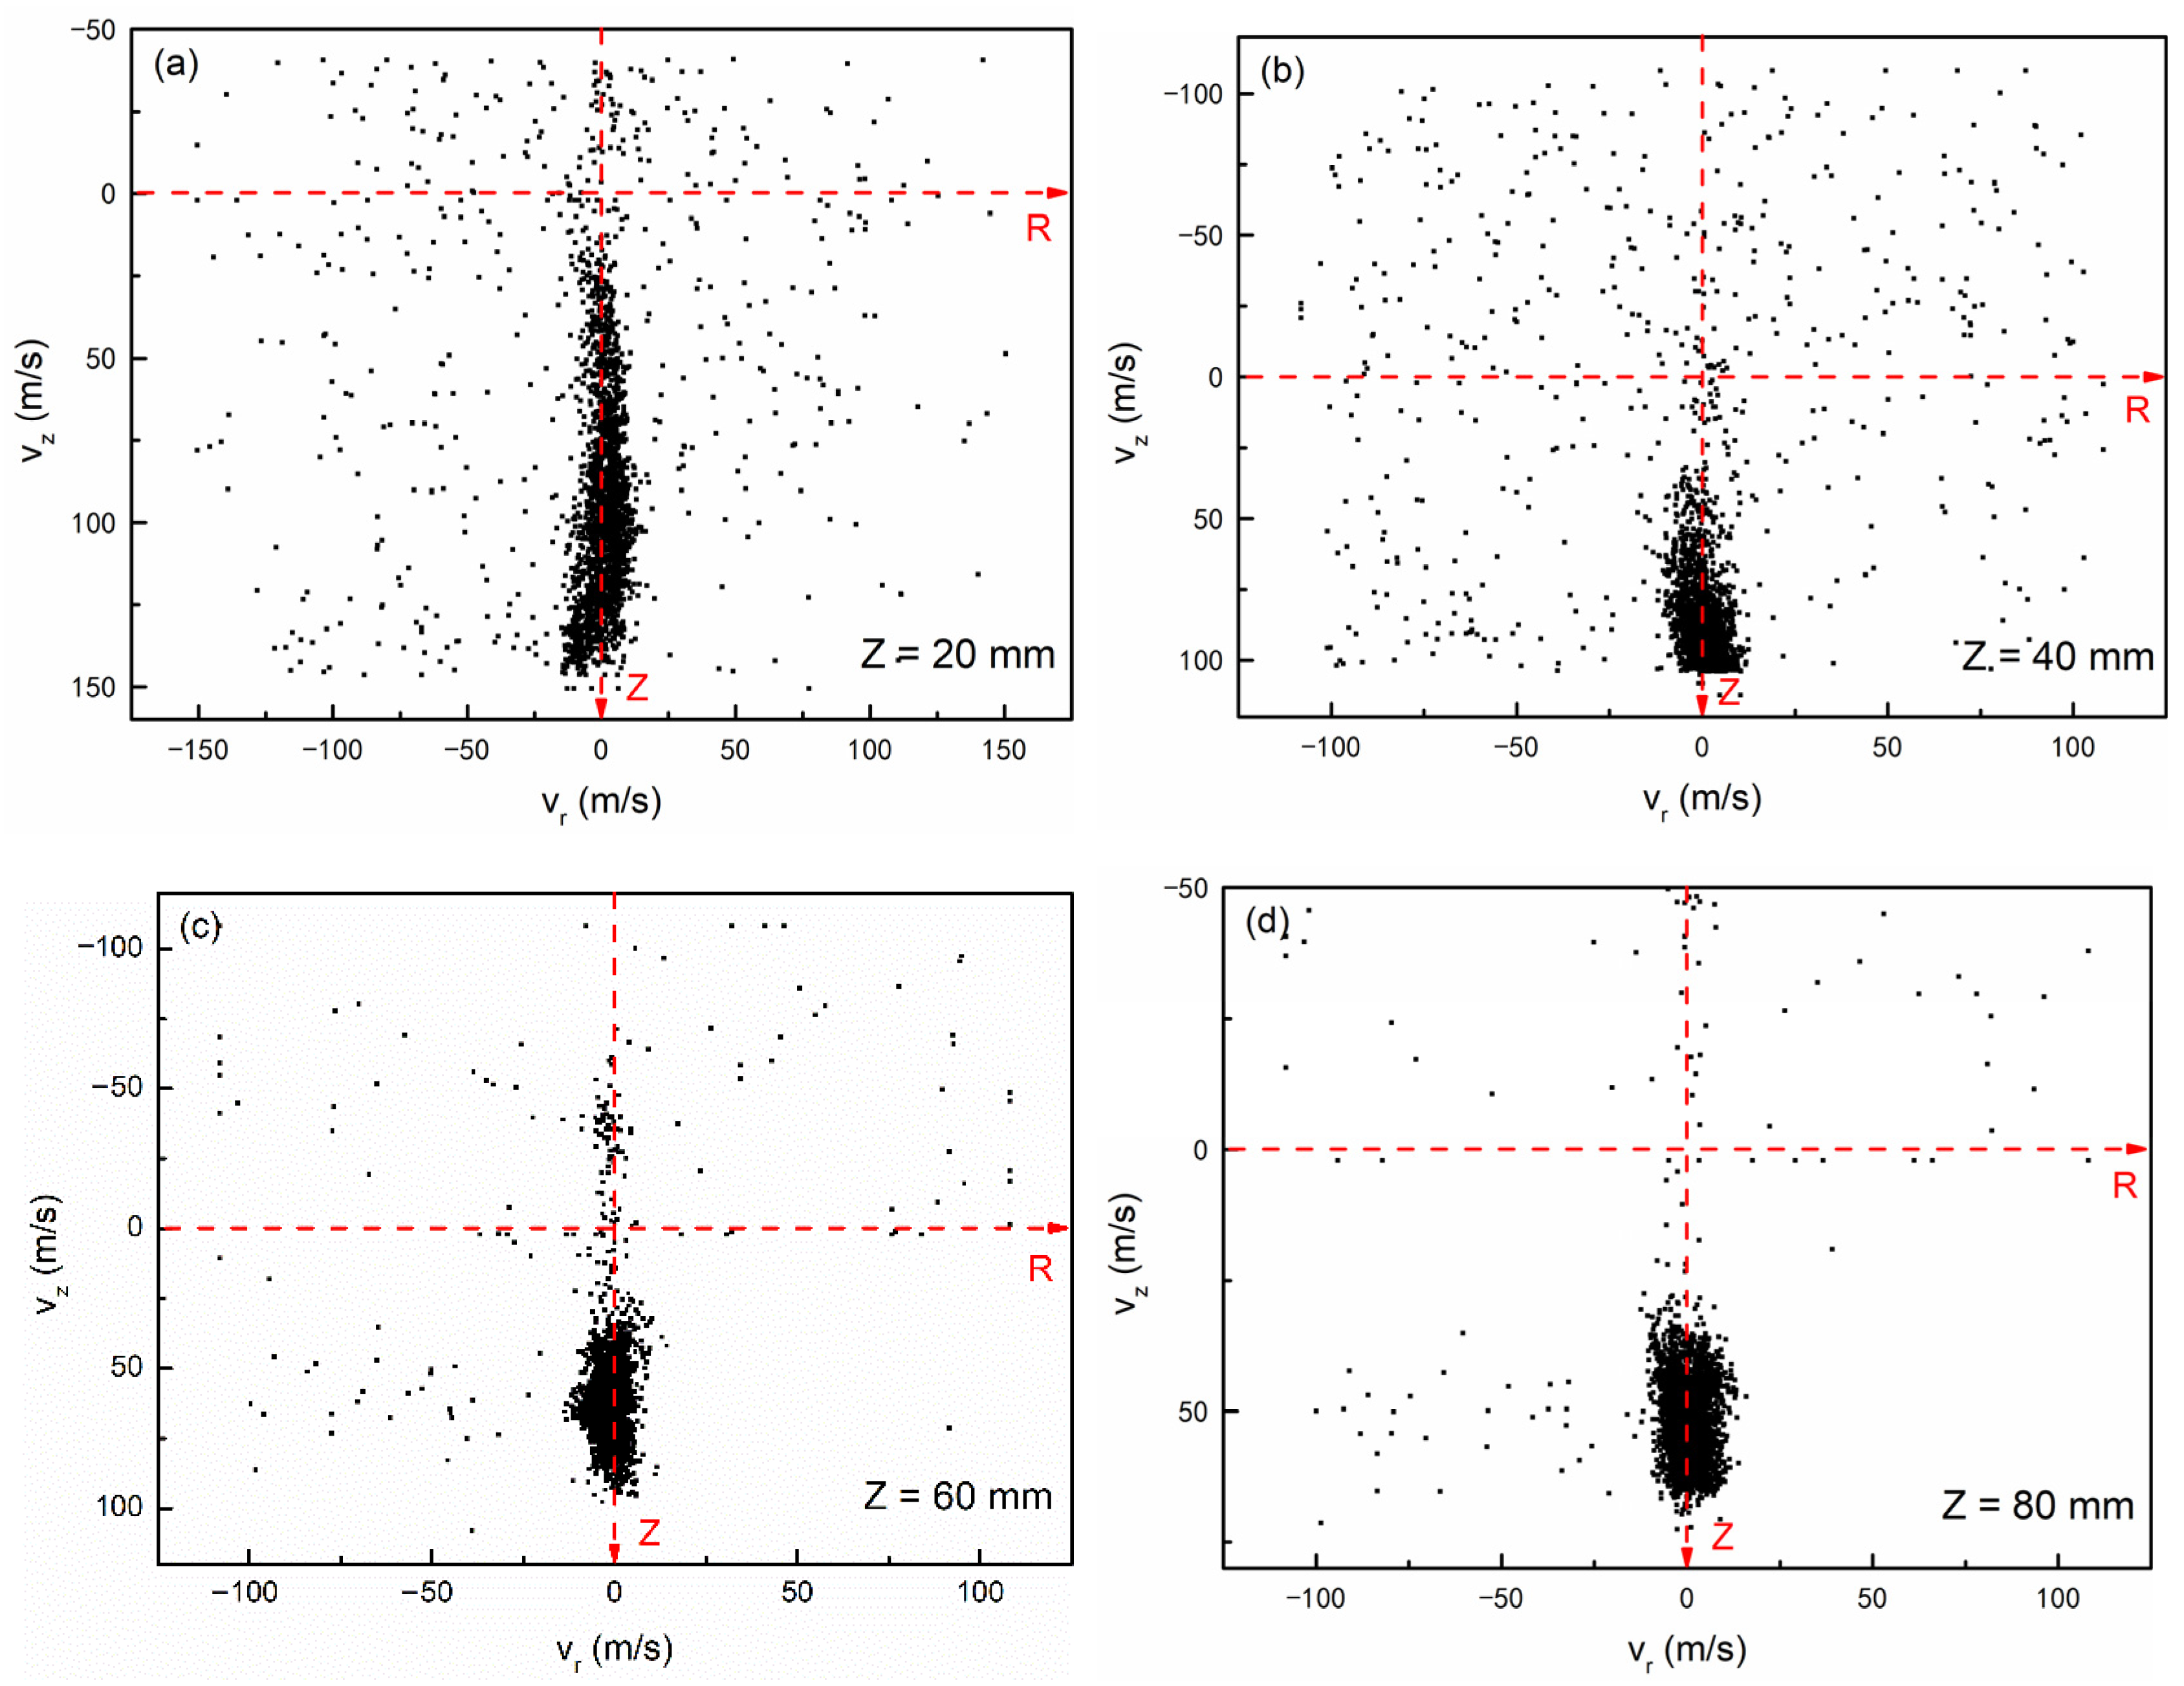
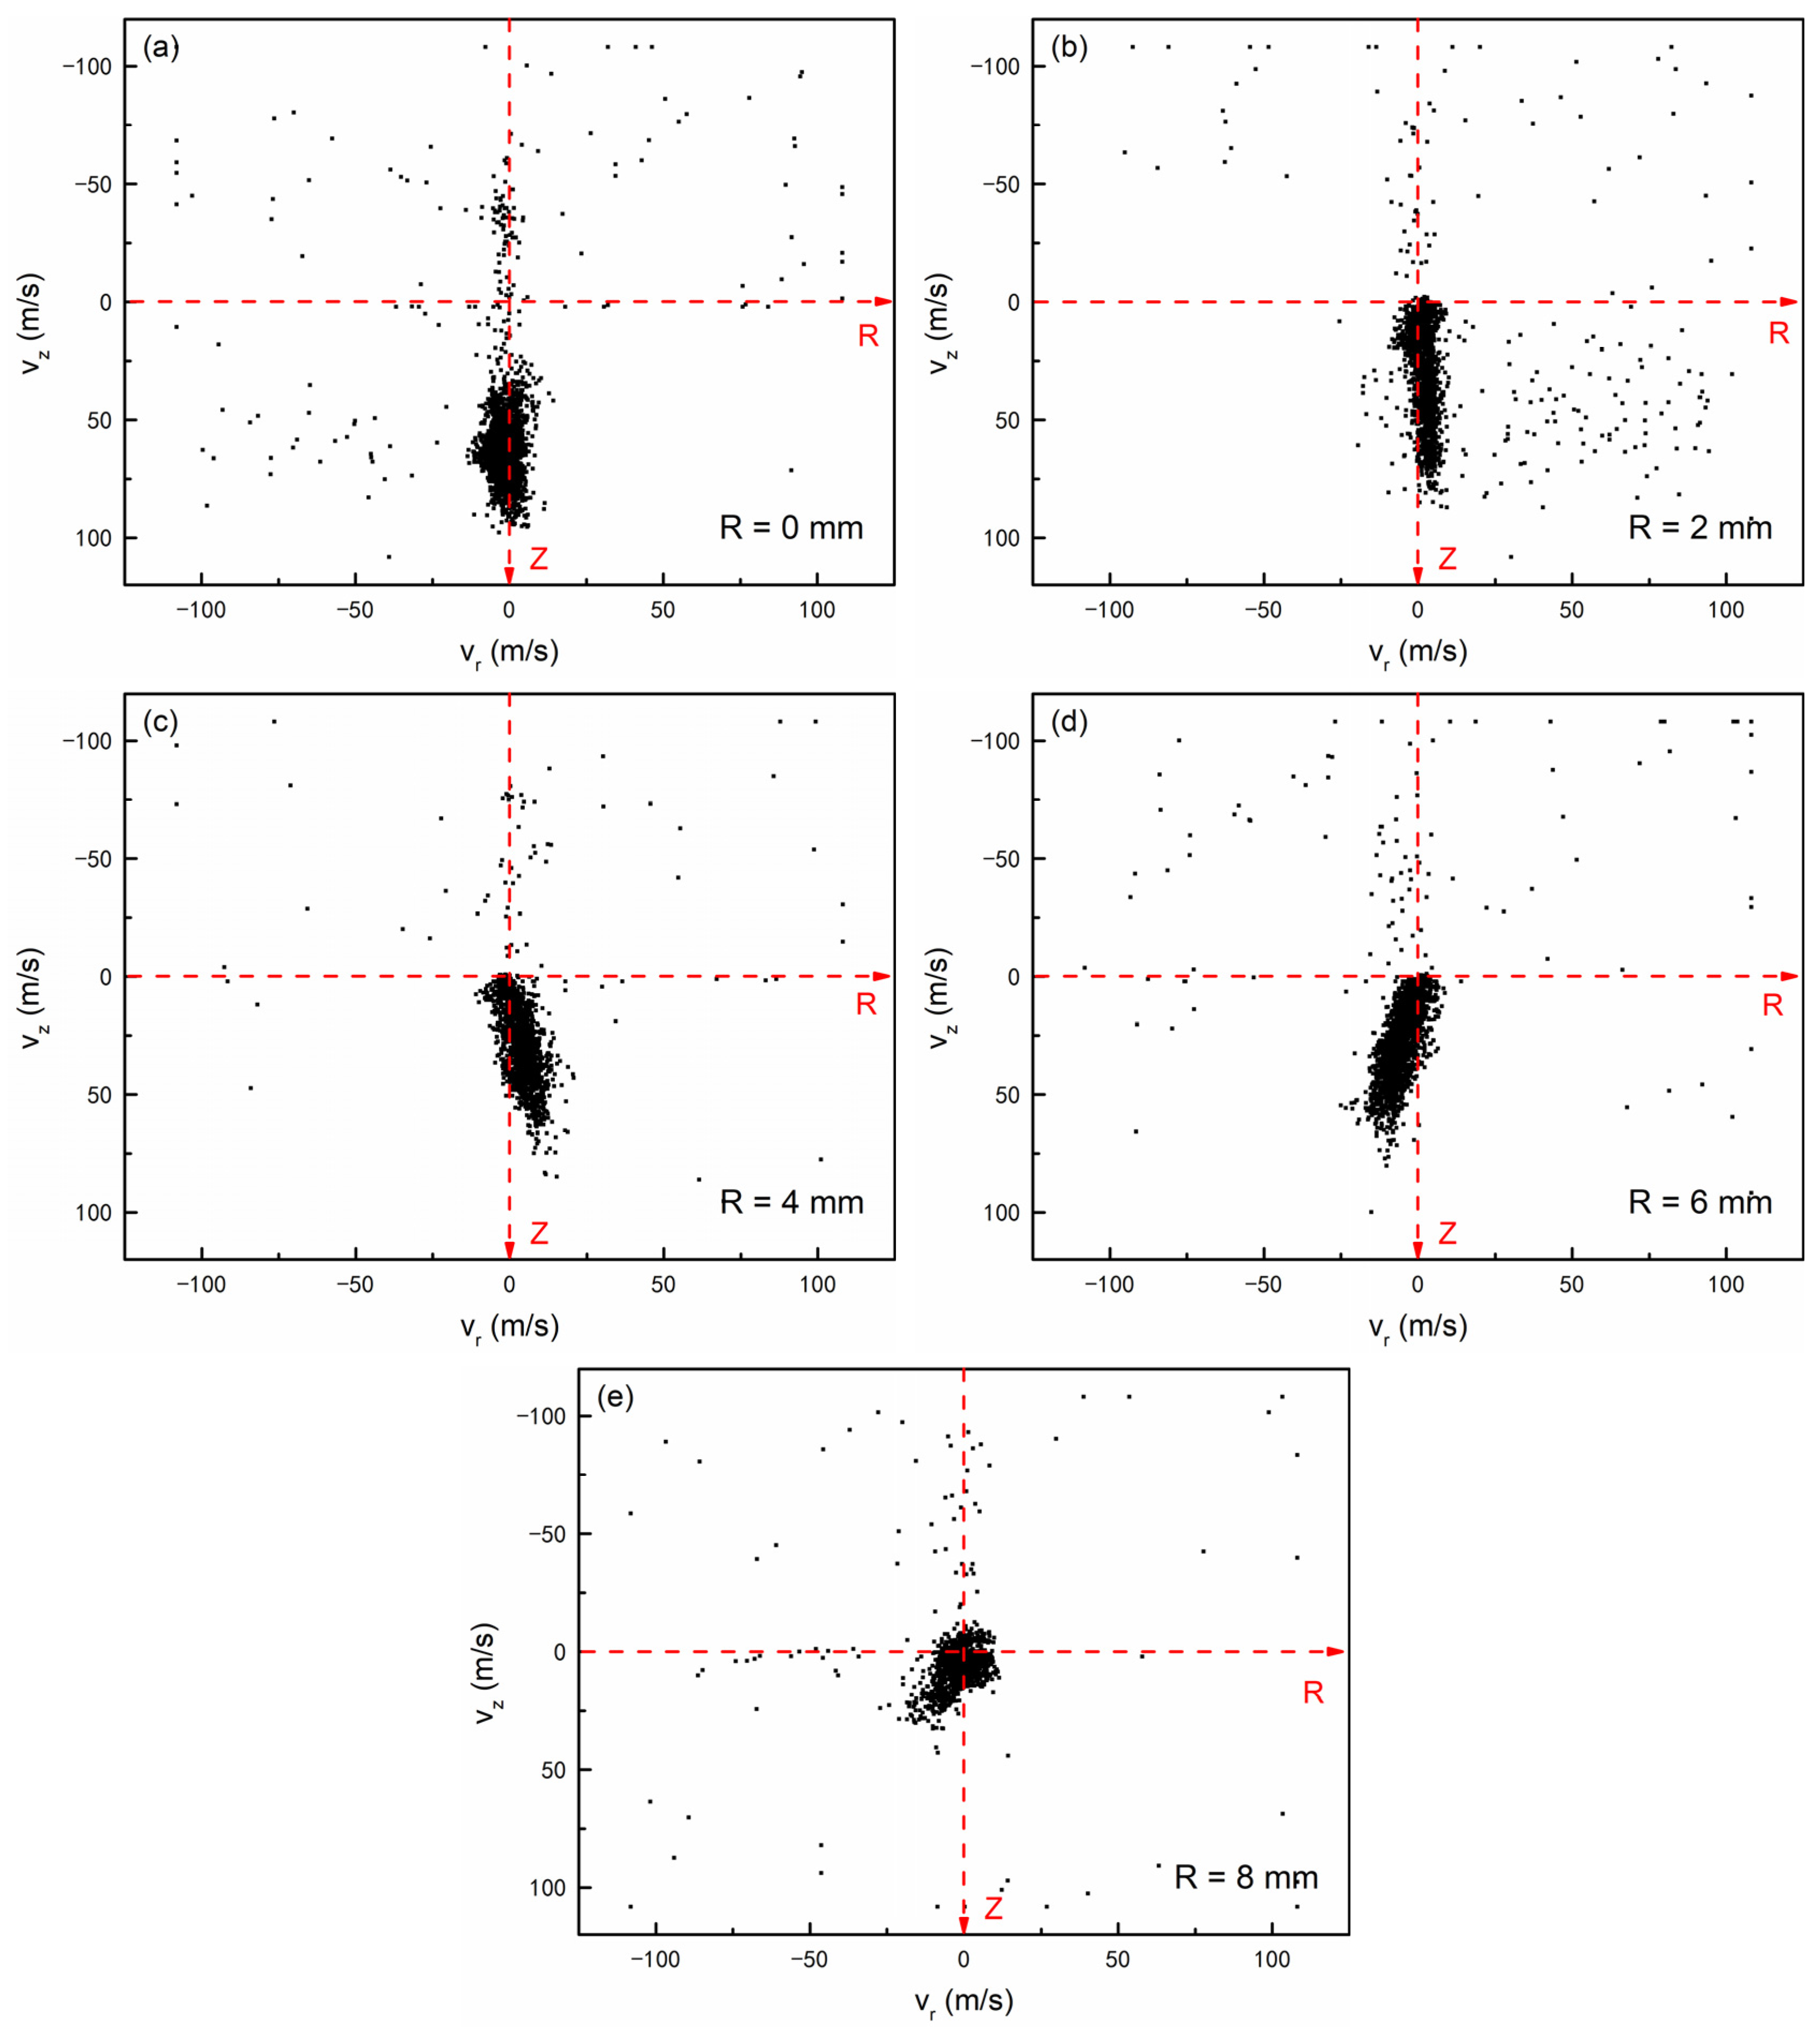
3.3. Droplet Velocity Distribution

The velocities of each test droplet at R = 0 mm are presented in Figure 11, where scattered black dots indicate the detected droplets. The horizontal and vertical axes correspond to the radial (Vr) and axial (Vz) velocity components, respectively, with clearly indicated positive directions and zero point. At Z = 20 mm, it is observed that the velocities concentrate in a narrow and long area, with radial components ranging from −20 to 20 m/s and axial components spanning 20~150 m/s. This distribution indicates that most droplets initially exhibit a dominant positive axial velocity with minor radial disturbances. However, it is interesting to find that some droplets anomalously exhibit a large radial velocity component and a negative axial component. The vigorous primary breakup of the jet and the rebound after impact are possible reasons for such unusual droplets. Primary breakup typically occurs within millimeters downstream of the injector nozzle and is driven by aerodynamic forces, cavitation, and internal nozzle turbulence. Our previous study [54] observed that the liquid film at the jet tip may expand to the radial direction at a very high speed due to severe disturbance of the liquid column, leading to a high radial velocity component of some pinched off droplets. We also found that the compressed air bubbles which formed inside the nozzle due to the cavitation may catastrophically collapse when ejected out the nozzle, creating irregularly moving droplets. Furthermore, high-speed droplet impacts with liquid films can lead to rebound events, contributing to the observed velocity anomalies.
Due to droplet–air interactions, the axial velocity component gradually decreases as the spray develops. At Z = 40 mm, the maximum axial velocity is approximately 110 m/s, with most droplets distributed between 30~105 m/s. Notably, we observe a greater number of droplets exhibiting negative axial velocity components, with some even exceeding 50 m/s in magnitude. It is indicated that beyond Z = 20 mm, the primary breakup process weakens, suggesting more frequent droplet rebound events and enhanced droplet–droplet interactions. At Z = 60 mm, the axial velocity component mostly distributed at a range of 25–90 m/s, and less dropets have a negtive axial velocity component due to reduced momentum. A further decrease in the axial velocity component is found at Z = 80 mm. Interestingly, at both Z = 60 and 80 mm, there are unsymmetrical distributions of the radial velocity component, with droplets moving downstream rarely having a large positive radial velocity component. It should be noted that these distributions represent statistical aggregates from 20 injection events. The data points appearing simultaneously in the positive Z-axis and negative R-axis regions originate from just one injection event, likely resulting from local flow disturbances. This observation indicates a finite probability of unstable injection conditions that can significantly affect droplet distribution patterns.
Figure 12 shows the velocities of each detected droplet at Z = 60 mm. It is observed that the axial velocity component presents a significant decrease along the radial direction, and the radial velocity component presents a non-axisymmetric distribution. At R = 2 mm, droplets with higher axial velocity components predominantly exhibit positive radial velocities, indicating radial expansion of the spray. This trend persists at R = 4 mm, but reverses at R = 6 mm where negative radial velocities become more prevalent. These distribution patterns arise from vortex structures generated by air entrainment, as previously discussed in Section 3.2. The two test windows located in two different vertexes or two sides of the same vortex resulted in irregular movement, which increased the collision frequency between the droplets, having a significant impact on the size distributions. Near the spray periphery (R = 8 mm), the effect of air entrainment is more obvious, resulting in nearly centrosymmetric velocity distributions around the zero point that reflect highly disordered droplet motion. Furthermore, the number of droplets exhibiting strong negative axial velocities along the radial direction decreases significantly due to diminished rebound effects. This reduction occurs because peripheral droplets possess insufficient momentum to sustain rebound phenomena observed closer to the spray core.

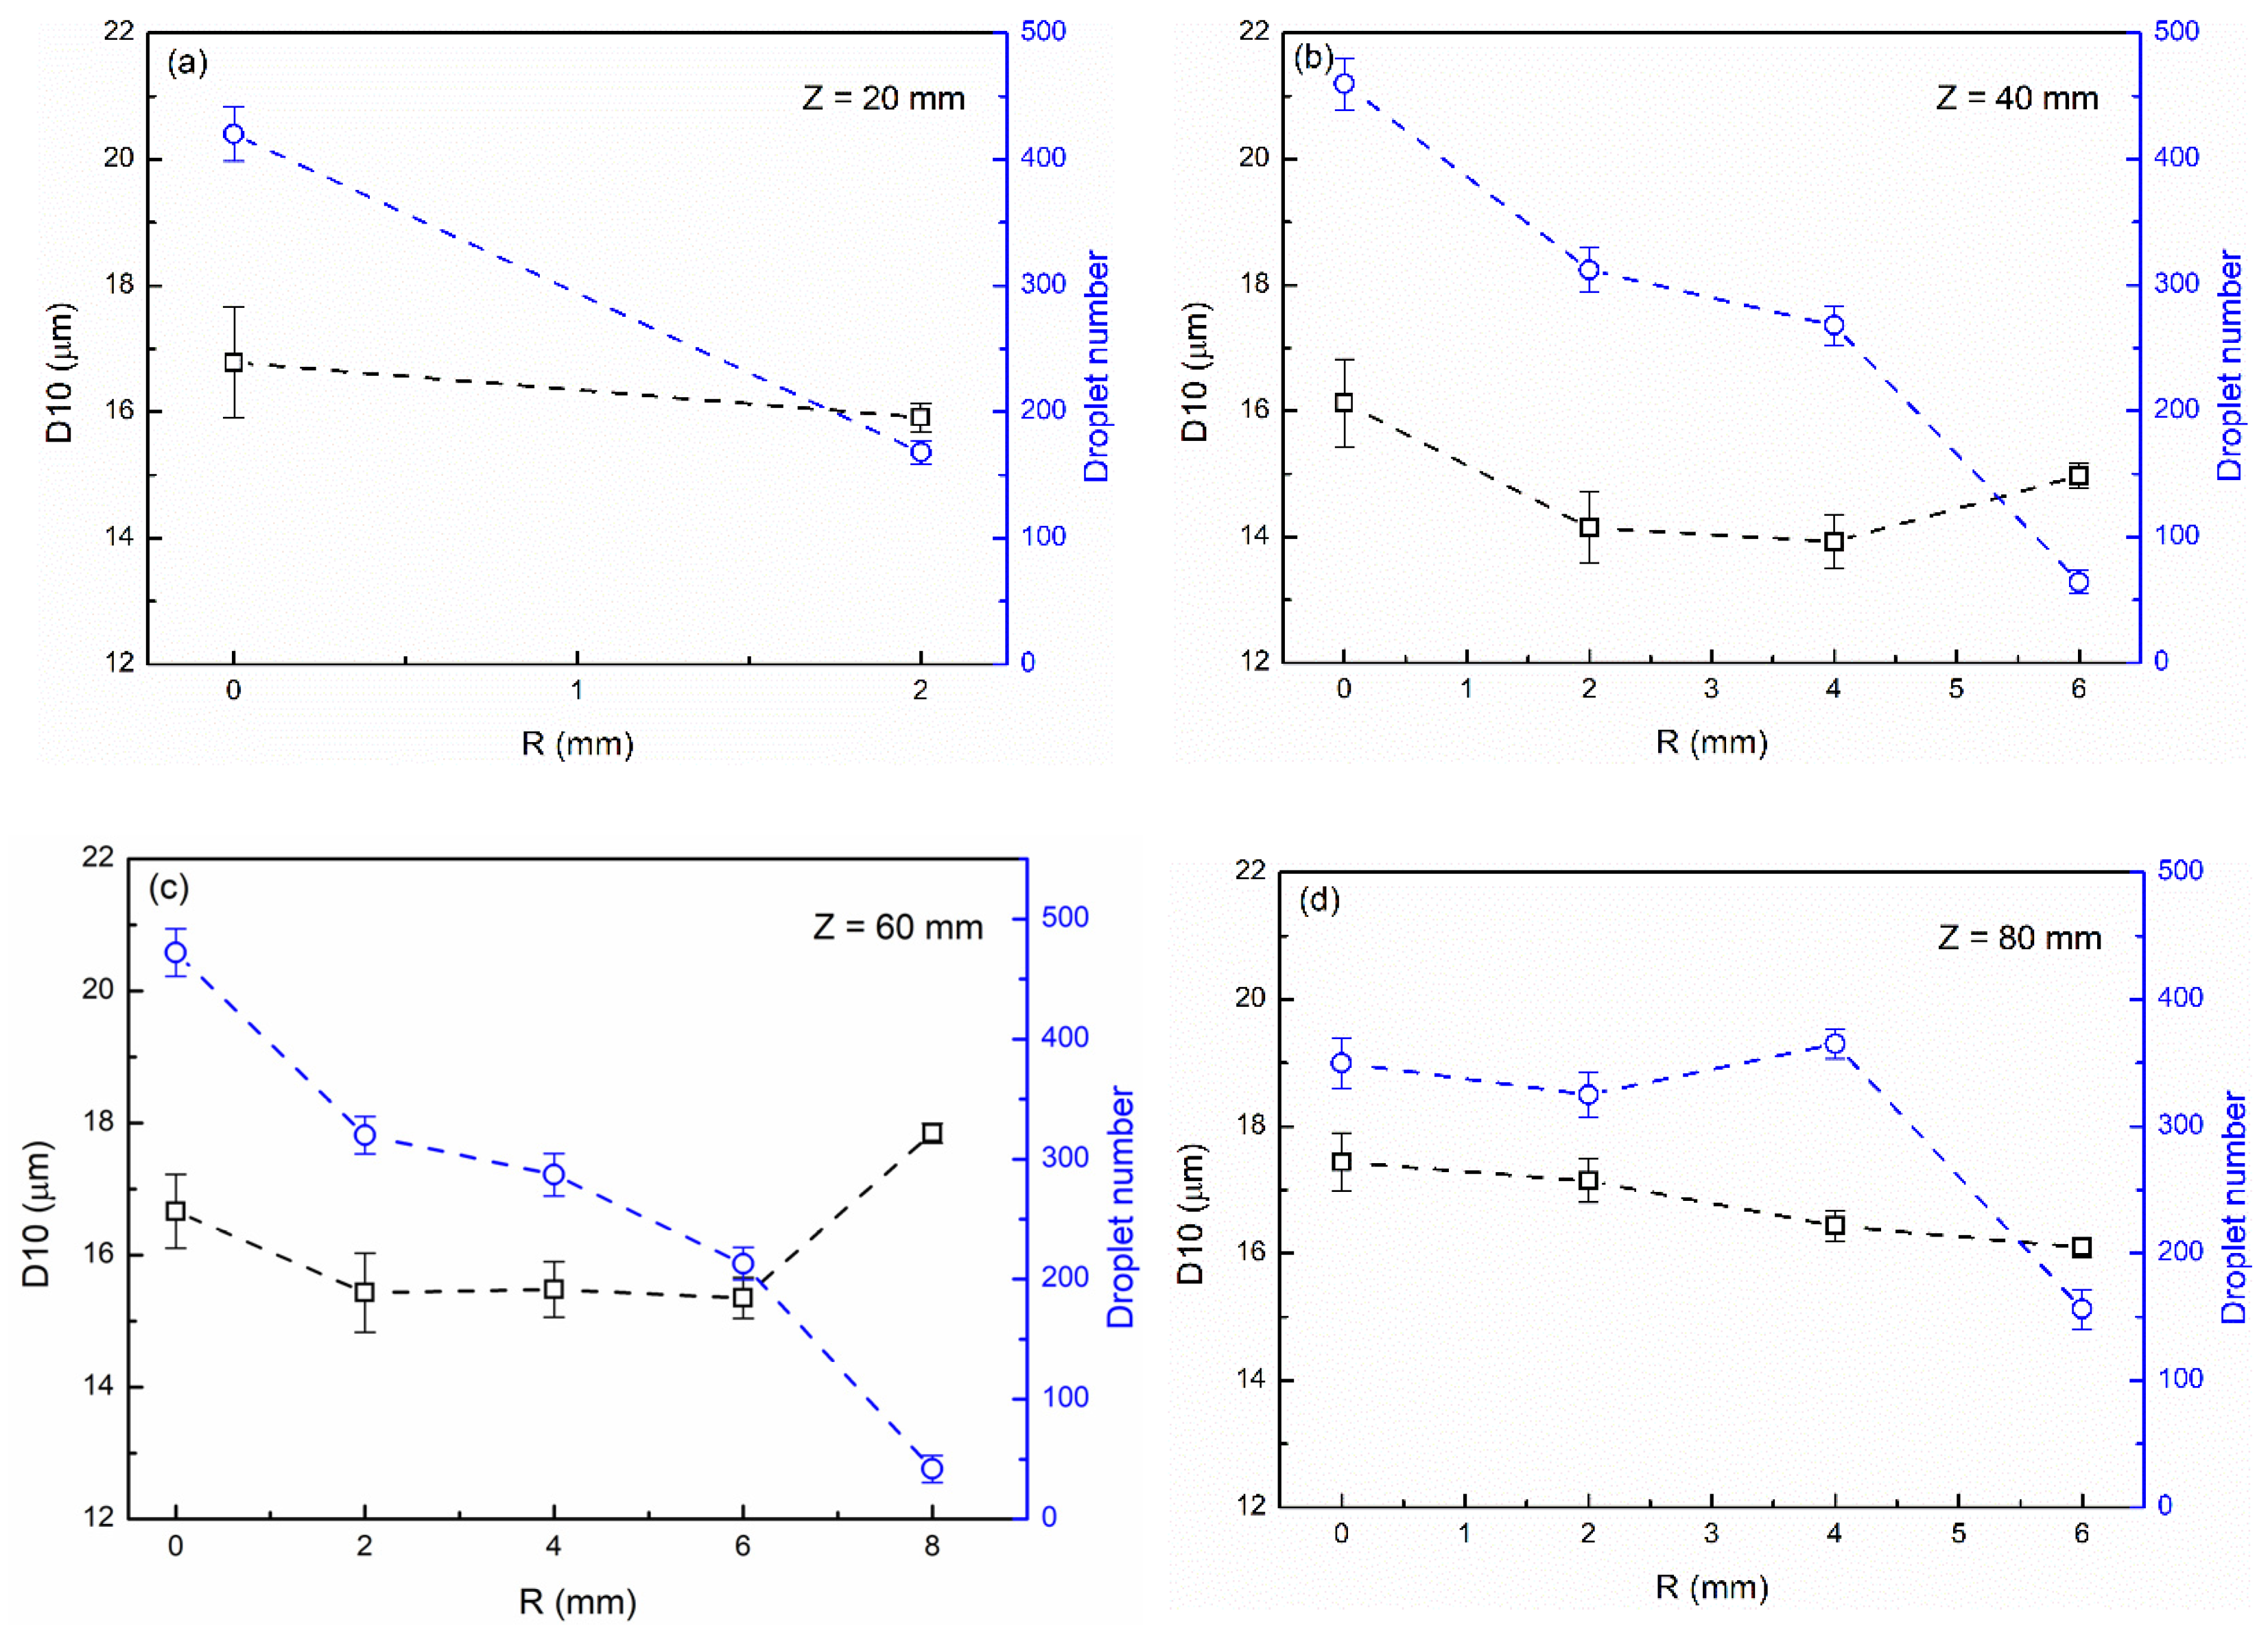
3.4. Spatial Distributions of Droplet Size and Velocity

Figure 13 shows the variations in the statistical arithmetic diameter (D10) and number of the methanol droplets along the ratial direction. The black line represents D10 values averaged of 20 injection events, while the blue line shows the droplet number averaged per single injection, with error bars indicating the standard deviation across repeated tests. Along the spray centerline, the droplet number increases and the D10 decreases at first due to the droplet breakup, then the number shows a significant drop, and the D10 increases a lot due to the radial diffusion of small droplets. In the near-nozzle region (Z = 20 mm), D10 exhibits a modest decrease from the dense region to dilute region, while droplet numbers drop significantly. For the spray midbody (Z = 40 and 60 mm), both parameters decrease rapidly from the center R = 0 mm to R = 2 mm in the dense region. The transition region (R = 2~4 mm) shows a slower reduction in droplet count with nearly constant D10 values. In the outer dilute region (R > 4 mm), droplet numbers decrease sharply while D10 increases. The spray tip (Z = 80 mm) demonstrates distinct behavior. D10 decreases slightly along the radial direction, while droplet number initially remained stable before undergoing rapid depletion. These patterns reflect the competing effects of droplet breakup, coalescence, and transport phenomena at different spray locations.
Figure 14 presents the variations in the droplet mean radial velocity component (vx) and mean axial velocity component (vy) along the radial direction. It is found that the droplets in the near-nozzle field have relatively large downward momentum, and, later, the kinetic energy continuously decreases due to the drag resistance. A slight negative radial velocity component is observed, likely attributable to minor injector installation misalignment. However, this systematic error is negligible compared to measurement uncertainties and has minimal impact on the overall size and velocity distributions. In addition, the vys show significant decreases along the radial direction at all measured axial positions. In the near-nozzle area, the vx shows an increase from R = 0 mm to R = 2 mm, and this is because the downward momentum is transferred to the radial direction due to air shear. For the spray midbody, the vx increases from R = 0 mm to R = 4 mm. However, in the dilute region, the vx becomes irregular, thus reflecting the air entrainment. For the spray tip, the vx at first increases to a maximum value at R = 2 mm and then decreases. In addition, the periphery shows the complete dissipation of mean axial velocity (vy → 0), resulting from intensive droplet–droplet and droplet–air interactions.
To further investigate the spatial distribution of droplet size and velocity, the methanol local SMDs and velocity vectors at all the tested locations are illustrated in Figure 15. SMD defined by the ratio of the total volume of all the droplets to the total surface area of all the droplets determines the mixing rate of fuel and air and its spatial distribution reflects the atomization stability. The maximum value is 25.05 μm, located at Z = 80 mm and R = 0 mm, while the minimum value is 17.41 μm, located at Z = 40 mm and R = 4 mm, representing a substantial 30.5% variation. It should be noted that the unmeasured droplet masses in the dense core region, particularly near the nozzle exit, would likely yield even higher SMD values in practice. So, the spatial SMD of methanol spray from a direct-flow nozzle is not well-distributed. For qualitative analysis, the spatial distribution regularity of SMD is similar with D10, but the values are larger. The radial evolution from dense region to dilute region of SMD exhibits distinct axial dependencies. At Z = 20 mm, the SMD decreased by 9.9%. At Z = 40 mm, the fairly constant value at the transition region is about 17.5 μm, which represents a 20.1% reduction compared to the dense region and a 9.5% decrease relative to the dilute region, marking this transition zone as containing the smallest droplets in the entire spray field. This phenomenon can be attributed to momentum effects, where larger droplets retain sufficient inertia to remain concentrated along the central axis rather than dispersing radially. We also note that at spray midbody, although the SMD increases at the spray periphery, it is still smaller than that in the central axis. At Z = 80 mm, the SMD initially decreased by 13.5% along the radial direction, and this percentage reduction is much larger than that of D10. As the contribution of large droplets is more compared to the SMD, it indicated that many large droplets remained at the tip, which is not expected. The mean droplet velocity in the test window reflects the overall movement trend of the liquid phase, and it shows a decreasing trend along both the radial and axial directions, and fluctuates slightly at Z = 60 mm and R = 6 mm. The gas entrainment and vortexes caused the disorder movement of the droplets, but the vectors after averaging can also depict the trajectory of the entrainment.

4. Conclusions

This study experimentally investigated the local microscopic structure, droplet size and velocity distributions at both the dense and dilute regions of a methanol fuel spray by applying the PIA technique and a slicer. The quantitative spatial distributions of droplet SMD and mean velocity were reported. A high concentration of aggregated droplets, interconnected liquid structures, and large liquid masses were observed at the centerline of the methanol spray, indicating poor atomization in dense regions. In contrast, the spray periphery demonstrated effective atomization, with only well-dispersed individual droplets detected. The droplet size distribution exhibits complex spatial evolution governed by two competing mechanisms. First, smaller droplets experience significantly higher aerodynamic drag forces, which promotes their radial dispersion and consequently increases the probability density along the radial direction. Second, droplet coalescence processes coupled with vortex-induced transport mechanisms collectively contribute to a gradual decrease in local small droplet concentration. The radial evolution from the dense region to dilute region of SMD exhibits distinct axial dependencies. In the near-nozzle area, the size decreases significantly from the dense region to dilute region. At spray midbody, the size initially reduces significantly in the dense region and then remains fairly constant in the transition region, following which, the size increases in the dilute region, but the value is still smaller than that in the central axis. A spatially nonuniform SMD distribution is obtained, as the maximum SMD (25.05 μm) appears at the spray tip, while the minimum (17.41 μm) is in the transition region of Z = 40 mm, revealing a difference exceeding 30%, highlighting a key limitation of the direct injection of methanol fuel. The droplets in the near-nozzle field have relatively large downward momentum; interestingly, there are still some droplets moving to the opposite direction, perhaps due to the vigorous primary breakup of the jet and the rebound mechnism. The axial velocity component decreases along both the radial and axial direction due to the air drag. In contrast, the radial velocity component displays less distinct variation patterns, owing to vortex-induced flow interactions. At the spray periphery, the movement of droplets are more disordered under the dual influence of vortexes inside the spray and the air entrainment.

Author Contributions

Conceptualization, Z.F. and Y.J.; software, J.Z. and J.G.; investigation, Z.F., J.Z. and J.G.; data curation, Z.F., J.Z. and J.G.; writing—review and editing, Z.F., X.T. and Z.H.; visualization, Z.F. and Y.J.; supervision, Z.H.; funding acquisition, Z.F. All authors have read and agreed to the published version of the manuscript.

Funding

This work was supported by the China Postdoctoral Science Foundation (No. 2024M751177). We also acknowledged financial support from Natural Science Foundation of Jiangsu Province (BK 20240859), Jiangsu University Foundation (Grant No. 22JDG040).

Data Availability Statement

The original contributions presented in this study are included in the article. Further inquiries can be directed to the corresponding authors.

Conflicts of Interest

The authors declare no conflicts of interest.

References

  1. Ren, G.; Cui, M.; Yu, H.; Fan, X.; Zhu, Z.; Zhang, H.; Dai, Z.; Sun, J.; Yang, B.; Du, D. Global Environmental Change Shifts Ecological Stoichiometry Coupling Between Plant and Soil in Early-Stage Invasions. J. Soil Sci. Plant Nutr. 2024, 24, 2402–2412. [Google Scholar] [CrossRef]
  2. Feng, Y.; Wang, N.; Xie, H.; Li, J.; Li, G.; Xue, L.; Fu, H.; Feng, Y.; Poinern, G.E.J.; Chen, D. Livestock manure-derived hydrochar is more inclined to mitigate soil Global Warming Potential than raw materials based on soil stoichiometry analysis. Biol. Fertil. Soils 2023, 59, 459–472. [Google Scholar] [CrossRef]
  3. Yan, H.; Acquah, S.J.; Zhang, J.; Wang, G.; Zhang, C.; Darko, R.O. Overview of modelling techniques for greenhouse microclimate environment and evapotranspiration. Int. J. Agric. Biol. Eng. 2021, 14, 1–8. [Google Scholar] [CrossRef]
  4. Nazir, M.J.; Li, G.; Nazir, M.M.; Zulfiqar, F.; Siddique, K.H.M.; Iqbal, B.; Du, D. Harnessing soil carbon sequestration to address climate change challenges in agriculture. Soil. Tillage Res. 2024, 237, 105959. [Google Scholar] [CrossRef]
  5. Chauhdary, J.N.; Li, H.; Ragab, R.; Rakibuzzaman, M.; Khan, A.I.; Zhao, J.; Akbar, N. Climate Change Impacts on Future Wheat (Triticum aestivum) Yield, Growth Periods and Irrigation Requirements: A SALTMED Model Simulations Analysis. Agronomy 2024, 14, 1484. [Google Scholar] [CrossRef]
  6. Pan, S.; Zabed, H.M.; Wei, Y.; Qi, X. Technoeconomic and environmental perspectives of biofuel production from sugarcane bagasse: Current status, challenges and future outlook. Ind. Crops Prod. 2022, 188, 115684. [Google Scholar] [CrossRef]
  7. Hassan, G.; Shabbir, M.A.; Ahmad, F.; Pasha, I.; Aslam, N.; Ahmad, T.; Rehman, A.; Manzoor, M.F.; Inam-Ur-Raheem, M.; Aadil, R.M. Cereal processing waste, an environmental impact and value addition perspectives: A comprehensive treatise. Food Chem. 2021, 363, 130352. [Google Scholar] [CrossRef]
  8. Shanbhag, M.M.; Mishra, S.; Shetti, N.P.; Pollet, B.G.; Kalanur, S.S. Exploring the role of saline water splitting in sustainable energy solutions and hydrogen economy. Appl. Energy 2025, 389, 125733. [Google Scholar] [CrossRef]
  9. Shao, S.; Sun, T.; Li, X.; Wang, Y.; Ma, L.; Liu, Z.; Wu, S. Preparation of heavy bio-oil-based porous carbon by pyrolysis gas activation and its performance in the aldol condensation for aviation fuel as catalyst carrier. Ind. Crops Prod. 2024, 218, 118963. [Google Scholar] [CrossRef]
  10. Chu, W.; Li, H.; Liu, Y.; Zhou, B.; Luo, H.; Kim, W. Three-dimensional simulation analysis of in-cylinder combustion in space in-orbit hydrogen–oxygen internal combustion engine. Appl. Therm. Eng. 2025, 263, 125391. [Google Scholar] [CrossRef]
  11. Shao, S.; Ma, L.; Li, X.; Zhang, H.; Xiao, R. Preparation of activated carbon with heavy fraction of bio-oil from rape straw pyrolysis as carbon source and its performance in the aldol condensation for aviation fuel as carrier. Ind. Crops Prod. 2023, 192, 115912. [Google Scholar] [CrossRef]
  12. Chen, X.; Kitts, D.D.; Ji, D.; Ding, J. Free radical scavenging activities of phytochemical mixtures and aqueous methanolic extracts recovered from processed coffee leaves. Int. J. Food Sci. Technol. 2019, 54, 2872–2879. [Google Scholar] [CrossRef]
  13. Kiouranakis, K.I.; de Vos, P.; Zoumpourlos, K.; Coraddu, A.; Geertsma, R. Methanol for heavy-duty internal combustion engines: Review of experimental studies and combustion strategies. Renew. Sustain. Energy Rev. 2025, 214, 115529. [Google Scholar] [CrossRef]
  14. Chen, J.; Wang, X.; Fan, W.; Liu, T.; Wang, Y.; Geng, W. Experimental study of NO emission in coal-methanol co-combustion under air-staged condition. J. Energy Inst. 2024, 117, 101835. [Google Scholar] [CrossRef]
  15. Chen, Z.; Chen, H.; Wang, L.; Geng, L.; Zeng, K. Parametric study on effects of excess air/fuel ratio, spark timing, and methanol injection timing on combustion characteristics and performance of natural gas/methanol dual-fuel engine at low loads. Energy Convers. Manag. 2020, 210, 112742. [Google Scholar] [CrossRef]
  16. Jin, C.; Ding, C.; Hu, J.; Geng, Z.; Li, X.; Dong, J.; Xu, T.; Liu, H. Study on the stability and properties of carbon neutral methanol in blends with diesel fuel. Fuel 2024, 374, 132453. [Google Scholar] [CrossRef]
  17. Kou, H.; Hu, W.; Li, T.; Duan, Q.; Yin, X.; Duan, H.; Zeng, K. Effects of injection timing on combustion and mixture formation of a methanol direct injection engine equipped with a small volume passive pre-chamber. Fuel 2025, 384, 133910. [Google Scholar] [CrossRef]
  18. Yu, J.; Zhou, F.; Fu, J.; Huang, D.; Wu, C.; Liu, J. Research on the influence of injection strategies on the in-cylinder combustion process and emissions of methanol. Biomass Bioenergy 2024, 188, 107340. [Google Scholar] [CrossRef]
  19. Zhang, M.; Cao, J. Comparative study on combustion and emission characteristics of methanol/gasoline blend fueled DISI engine under different stratified lean burn modes. Fuel Process. Technol. 2024, 266, 108160. [Google Scholar] [CrossRef]
  20. Wang, X.; Liu, Y.; Li, X.; Jiang, B.; Xie, J.; Jin, Z.; Dou, H. Impact of dissociated methanol gas direct injection strategy on performance of port-injection methanol engines under dilution combustion condition. Energy 2025, 321, 135503. [Google Scholar] [CrossRef]
  21. Liu, H.; Yang, Y.; Zhou, Z.; Baig, A.; Liu, S.; Zhu, Z.; Wei, Y. Numerical investigation on the efficiency improvement and knock mitigation through combustion chamber optimization in a heavy-duty spark-ignition methanol engine with EGR. Appl. Therm. Eng. 2025, 264, 125469. [Google Scholar] [CrossRef]
  22. Yuan, B.; Zhao, H.; Huang, Y.; Zhang, M.; Song, Z.; Shen, Y.; Cheng, X.; Wang, Z. Investigation on cold start issues of methanol engines and its improvement from the perspective of droplet evaporation. Fuel 2025, 380, 133249. [Google Scholar] [CrossRef]
  23. Liu, J.; Liu, X.; Zhu, X.; Yuan, S. Droplet characterisation of a complete fluidic sprinkler with different nozzle dimensions. Biosyst. Eng. 2016, 148, 90–100. [Google Scholar] [CrossRef]
  24. Jiang, Y.; Chen, C.; Li, H.; Xiang, Q. Influences of nozzle parameters and low-pressure on jet breakup and droplet characteristics. Int. J. Agric. Biol. Eng. 2016, 9, 22–32. [Google Scholar]
  25. Liu, J.; Yuan, S.; Darko, R.O. Characteristics of water and droplet size distribution from fluidic sprinklers. Irrig. Drain. 2016, 65, 522–529. [Google Scholar] [CrossRef]
  26. He, C.; Zhu, F.; Chen, H.; Ji, H.; He, Z. Enhancement of liquid sheet breakup and atomization for spinning jet–jet impingement. Phys. Fluids 2025, 37, 022141. [Google Scholar] [CrossRef]
  27. Liao, J.; Luo, X.; Wang, P.; Zhou, Z.; O’Donnell, C.C.; Zang, Y.; Hewitt, A.J. Analysis of the Influence of Different Parameters on Droplet Characteristics and Droplet Size Classification Categories for Air Induction Nozzle. Agronomy 2020, 10, 256. [Google Scholar] [CrossRef]
  28. Feng, Z.; Yang, Z.; Jin, Y.; Si, Z.; He, Z. Experimental study on dribbling characteristics of gasoline/biodiesel blends after the end-of-injection. Int. J. Eng. Res. 2023, 25, 1053–1068. [Google Scholar] [CrossRef]
  29. Lai, S.; Zhong, W.; Jiang, Z.; Pachiannan, T.; Wang, W.; Wang, C.; Zhang, L.; He, Z. Study on the microscopic characteristics of pentanol/highly active fuel spray based on high-speed droplet tracking velocimetry technology. Exp. Therm. Fluid Sci. 2024, 159, 111279. [Google Scholar] [CrossRef]
  30. Jin, Y.; Zhang, Y.; Dong, P.; Zhai, C.; Nishida, K.; Yang, W.; Leng, X. Diesel spray characteristics of multi-hole injectors under geometrical similarity condition. At. Sprays 2025, 35, 19–45. [Google Scholar] [CrossRef]
  31. Wang, X.; Chang, X.; Liu, J.; Gao, J.; Wu, J.; He, H. Experimental investigation of high-pressure methanol spray characteristics for engines. Appl. Therm. Eng. 2025, 271, 126388. [Google Scholar] [CrossRef]
  32. Li, X.; Xiang, L.; Wang, L.; Wang, Z.; Hu, Y. Experimental study on macroscopic and microscopic characteristics of flash boiling methanol spray under extremely cold conditions. Energy Convers. Manag. 2025, 333, 119780. [Google Scholar] [CrossRef]
  33. Leng, X.; Xing, M.; Luo, Z.; Jin, Y.; He, Z.; Wei, S. An investigation on methanol high pressure spray characteristics and their predictive models. Energy 2024, 313, 133732. [Google Scholar] [CrossRef]
  34. Chen, R.; Li, H.; Wang, J.; Guo, X. Analysis of Droplet Characteristics and Kinetic Energy Distribution for Fixed Spray Plate Sprinkler at Low Working Pressure. Trans. ASABE 2021, 64, 447–460. [Google Scholar] [CrossRef]
  35. Gong, C.; Kang, C.; Jia, W.; Yang, W.; Wang, Y. The effect of spray structure of oil-based emulsion spray on the droplet characteristics. Biosyst. Eng. 2020, 198, 78–90. [Google Scholar] [CrossRef]
  36. Jiang, Y.; Liu, J.; Li, H.; Hua, L.; Yong, Y. Droplet distribution characteristics of impact sprinklers with circular and noncircular nozzles: Effect of nozzle aspect ratios and equivalent diameters. Biosyst. Eng. 2021, 212, 200–214. [Google Scholar] [CrossRef]
  37. Gouesbet, G.; Gréhan, G. Laser-based optical measurement techniques of discrete particles: A review [invited keynote]. Int. J. Multiph. Flow. 2015, 72, 288–297. [Google Scholar] [CrossRef]
  38. Jing, D.; Zhang, F.; Li, Y.; Xu, H.; Shuai, S. Experimental investigation on the macroscopic and microscopic spray characteristics of dieseline fuel. Fuel 2017, 199, 478–487. [Google Scholar] [CrossRef]
  39. Mo, J.; Tang, C.; Li, J.; Guan, L.; Huang, Z. Experimental investigation on the effect of n-butanol blending on spray characteristics of soybean biodiesel in a common-rail fuel injection system. Fuel 2016, 182, 391–401. [Google Scholar] [CrossRef]
  40. Magnotti, G.M.; Genzale, C.L. Detailed assessment of diesel spray atomization models using visible and X-ray extinction measurements. Int. J. Multiph. Flow 2017, 97, 33–45. [Google Scholar] [CrossRef]
  41. Li, Y.; Ning, Z.; Lü, M. Experimental study on fusion and break-up motion after droplet collision. Chin. J. Chem. Eng. 2020, 28, 712–720. [Google Scholar] [CrossRef]
  42. Desantes, J.M.; García-Oliver, J.M.; Pastor, J.M.; Olmeda, I.; Pandal, A.; Naud, B. LES Eulerian diffuse-interface modeling of fuel dense sprays near- and far-field. Int. J. Multiph. Flow 2020, 127, 103272. [Google Scholar] [CrossRef]
  43. Liao, J.; Hewitt, A.J.; Wang, P.; Luo, X.; Zang, Y.; Zhou, Z.; Lan, Y.; O’Donnell, C. Development of droplet characteristics prediction models for air induction nozzles based on wind tunnel tests. Int. J. Agric. Biol. Eng. 2019, 12, 1–6. [Google Scholar] [CrossRef]
  44. Liu, J.; Zhu, X.; Yuan, S.; Liu, X. Droplet Motion Model and Simulation of a Complete Fluidic Sprinkler. Trans. ASABE 2018, 61, 1297–1306. [Google Scholar] [CrossRef]
  45. Qin, W.; Xue, X.; Cui, L.; Zhou, Q.; Xu, Z.; Chang, F. Optimization and test for spraying parameters of cotton defoliant sprayer. Int. J. Agric. Biol. Eng. 2016, 9, 63–72. [Google Scholar] [CrossRef]
  46. Luo, H.; Jin, Y.; Nishida, K.; Ogata, Y.; Yao, J.; Chen, R. Microscopic characteristics of impinging spray sliced by a cone structure under increased injection pressures. Fuel 2021, 284, 119033. [Google Scholar] [CrossRef]
  47. Wang, Z.; Xu, H.; Jiang, C.; Wyszynski, M.L. Experimental study on microscopic and macroscopic characteristics of diesel spray with split injection. Fuel 2016, 174, 140–152. [Google Scholar] [CrossRef]
  48. Anand, T.N.C.; Mohan, A.M.; Ravikrishna, R.V. Spray characterization of gasoline-ethanol blends from a multi-hole port fuel injector. Fuel 2012, 102, 613–623. [Google Scholar] [CrossRef]
  49. Kashdan, J.T.; Shrimpton, J.S.; Whybrew, A. A digital image analysis technique for quantitative characterisation of high-speed sprays. Opt. Lasers Eng. 2007, 45, 106–115. [Google Scholar] [CrossRef]
  50. Berg, T.; Deppe, J.; Michaelis, D.; Voges, H.; Wissel, S. Comparison of particle size and velocity investigations in sprays carried out by means of different measurement techniques. In Proceedings of the ICLASS’06, Kyoto, Japan, 27 August–1 September 2006. [Google Scholar]
  51. Kulkarni, A.P.; Deshmukh, D. Spatial drop-sizing in airblast atomization-an experimental study. At. Sprays 2017, 27, 949–961. [Google Scholar] [CrossRef]
  52. Feng, Z.; Zhai, C.; Si, Z.; Tang, C.; He, Z. Experimental study on spray microscopic characteristics in cross flow: Droplet morphology, statistics and breakup. At. Sprays 2022, 32, 51–69. [Google Scholar] [CrossRef]
  53. Feng, Z.; Zhan, C.; Tang, C.; Yang, K.; Huang, Z. Experimental investigation on spray and atomization characteristics of diesel/gasoline/ethanol blends in high pressure common rail injection system. Energy 2016, 112, 549–561. [Google Scholar] [CrossRef]
  54. Feng, Z.; Tong, S.; Tang, C.; Zhan, C.; Nishida, K.; Huang, Z. Decoupling the effect of surface tension and viscosity on spray characteristics under different ambient pressures: Near-nozzle behavior and macroscopic characteristics. At. Sprays 2019, 29, 629–654. [Google Scholar] [CrossRef]
Figure 1. Experimental setup for drop measurement with PIA technique: (a) schematic diagram of the experimental apparatus; (b) physical image.
Processes 13 01883 g001
Figure 2. (a) The structure and the specification of the spray slicer; (b) the comparison of droplet size distributions before and after using the slicer.
Processes 13 01883 g002
Figure 3. Time sequence of the laser, injection, and camera.
Processes 13 01883 g003
Figure 4. PIA measurement locations of methanol spray.
Processes 13 01883 g004
Figure 5. Droplet sizing process.
Processes 13 01883 g005
Figure 6. Typical microscopic images at the centerline of the methanol spray.
Processes 13 01883 g006
Figure 7. Typical methanol spray microscopic images at Z = 60 mm.
Processes 13 01883 g007
Figure 8. The mean gray values of the test windows.
Processes 13 01883 g008
Figure 9. The variation in droplet size distribution along the radial direction: (a) Z = 20 mm; (b) Z = 40 mm; (c) Z = 60 mm; (d) Z = 80 mm.
Processes 13 01883 g009
Figure 10. The variation in droplet size distribution along the axial direction.
Processes 13 01883 g010
Figure 11. Droplet velocity distributions at the centerline of the methanol spray: (a) Z = 20 mm; (b) Z = 40 mm; (c) Z = 60 mm; (d) Z = 80 mm.
Processes 13 01883 g011
Figure 12. Droplet velocity distributions at Z = 60 mm: (a) R = 0 mm; (b) R = 2 mm; (c) R = 4 mm; (d) R = 6 mm; (e) R = 8 mm.
Processes 13 01883 g012
Figure 13. The variations in D10 and droplet number along radial direction: (a) Z = 20 mm; (b) Z = 40 mm; (c) Z = 60 mm; (d) Z = 80 mm.
Processes 13 01883 g013
Figure 14. The variations in the averaged vx and vy along radial direction: (a) Z = 20 mm; (b) Z = 40 mm; (c) Z = 60 mm; (d) Z = 80 mm.
Processes 13 01883 g014
Figure 15. The spatial distribution of methanol droplet SMD and average velocity.
Processes 13 01883 g015
Table 1. Experimental conditions and fuel properties.
Experimental Conditions
Injector typeSingle-hole fuel injector
Hole diameter (mm)0.14
Injection pressure, Pinj (MPa)80
Injection width (ms)2
Ambient gasNitrogen
Ambient temperature, T (K)293
Ambient pressure (MPa)2
Image resolution (pixel)2456 × 2058
Scaling factor (μm/pixel)0.81
Tested fuelMethanol
Fuel temperature (K)293
Density (Kg/m3)790
Dynamic viscosity (mPa·s)0.57
Surface tension (mN/m)22.1
Disclaimer/Publisher’s Note: The statements, opinions and data contained in all publications are solely those of the individual author(s) and contributor(s) and not of MDPI and/or the editor(s). MDPI and/or the editor(s) disclaim responsibility for any injury to people or property resulting from any ideas, methods, instructions or products referred to in the content.

