Article

Full-Scale Pore Structure and Gas Adsorption Characteristics of the Medium-Rank Coals from Qinshui Basin, North China

1
School of Energy Resources, China University of Geosciences (Beijing), Beijing 100083, China
2
Coal Reservoir Laboratory of National Engineering Research Center of CBM Development & Utilization, China University of Geosciences, Beijing 100083, China
3
CBM Branch Company, Huabei Oilfield of PetroChina, Changzhi 046000, China
4
SINOPEC, Beijing 100728, China
5
Inner Mongolia Coal Geological Exploration (Group) 153 Co., Ltd., Hohhot 010030, China
*
Author to whom correspondence should be addressed.
Processes 2025, 13(6), 1862; https://doi.org/10.3390/pr13061862
Submission received: 8 April 2025 / Revised: 23 May 2025 / Accepted: 10 June 2025 / Published: 12 June 2025
(This article belongs to the Section Energy Systems)

Abstract

:
To elucidate the gas adsorption characteristics of medium-rank coal, this study collected samples from fresh mining faces in the Qinshui Basin. A series of experiments were conducted, including low-temperature carbon dioxide adsorption, low-temperature liquid nitrogen adsorption, mercury intrusion, and methane isothermal adsorption experiments, which clarify the pore structure characteristics of medium-rank coals, reveal the gas adsorption behavior in medium-rank coal, and identify the control mechanism. The results demonstrate that the modified Dubinin–Radushkevich (D-R) isothermal adsorption model accurately describes the gas adsorption in medium-rank coal, with fitting errors remaining below 1%. Comprehensive pore structure analysis reveals that the coal pore volume consists primarily of absorption pores (<2 nm), transitional pores (10–100 nm), and seepage pores (>100 nm), while the specific surface area is predominantly contributed by absorption pores (<2 nm). At low pressures, gas molecules form monolayer adsorption on absorption pore (<2 nm) and adsorption pore (2–10 nm) surfaces. With increasing pressure, multilayer adsorption dominates. As pore filling approaches the maximum capacity, the adsorption rate decreases progressively until reaching an equilibrium, at which point the adsorption capacity attains its saturation limit. The adsorption data of the gas in medium-rank coal can be explained by the improved D-R isothermal adsorption model. The priority of gas filling in pores is different, and the absorption pore is normally better than the adsorption pore. The results provide a new idea and understanding for the further study of the coalbed gas adsorption mechanism.

1. Introduction

With the deepening of the exploration and development of coal and associated mineral resources, coalbed methane (CBM) has emerged as a critically important energy resource. While serving as a byproduct of coal mining, methane presents significant safety hazards, including mine explosions [1,2,3,4]. Nevertheless, its high calorific value (35.8 MJ/m3) exceeds that of conventional fossil fuels, making it an attractive energy source. By the end of 2023, the cumulative proven reserves of CBM nationwide will reach 1.1 trillion cubic meters, with huge economic and environmental benefits [5]. With the continuous development of exploration technology, China now has the largest amount of deep CBM resources, accounting for 40% of the total [6,7]. Shallow CBM is distributed in 300~1000 m, with the corresponding formation temperature of 10~50 °C, where the formation pressure is in 3~13 MPa. CBM is mainly in an adsorption state and less supercritical adsorption state [7,8]. Consequently, the precise characterization of methane adsorption behavior under reservoir conditions is crucial for an accurate CBM resource assessment, optimized production strategies, and potential CO2 sequestration in deep coal seams [9,10,11].
Numerous studies have investigated gas adsorption behavior. Zheng et al. demonstrated that high-pressure gas adsorption on activated carbon exhibits non-equilibrium characteristics [12]. Elevated pressures increase the free gas density and intermolecular interactions, thereby reducing the adsorption affinity on coal surfaces [13]. Bae et al. found that excess adsorption peaks in coal are governed by adsorbent–adsorbate interactions, reaching a maximum near critical fugacity conditions [14]. Okolo et al. reported that the gas adsorption capacity in coal correlates positively with the critical temperature and pressure. While CO2 exhibits the distinct adsorption maximum near critical pressure, this behavior is less pronounced for CH₄ and N2, likely due to experimental temperatures exceeding their critical points [15]. Sang et al. identified multiple adsorption regimes in coal-gas systems: monolayer adsorption dominates at low pressures (<8 MPa), while higher pressures induce transitional adsorption mechanisms [16].
Gas adsorption in coal is affected by both extrinsic factors such as the pressure and temperature, and intrinsic factors such as the coal rank, microcomponent type and content, water content, and porosity. Among them, the coal rank and microcomponents affect the adsorption of coal by changing pore characteristics [17]. Wang et al. consider the distance between the adsorbed gas layer and the pore surface to be a constant value for a given nanopore [13]. Stuart et al. argued that gases are in a supercritical state and that porous materials with pore diameters greater than a certain value cannot be filled by gases [18]. Han et al. concluded that the correlation between pore characterization parameters and adsorption parameters better reflects the adsorption mechanism of coal, and that gas under high pressures is tightly stacked in the micropores of the coal matrix and multilayered molecularly stacked in large mesopores [19]. Wang et al. concluded that the adsorption capacity of low-rank coal for gas mainly depends on the size of the specific surface area of the mesopores; the low-pressure section is mainly adsorbed in the mesopores and macropores and the high-pressure section begins to enter the micropores for adsorption [20]. Sang et al. suggest that gas adsorption in coal under high-pressure conditions is related to coalescence–adsorption pore development [16].
The adsorption potential theory states that physical adsorption is controlled by the external adsorption potential of the fluid–solid interaction between the adsorbent and the adsorbate. By studying the thermodynamic properties of the fluid, it is possible to investigate the effect of microporous materials on adsorption [21,22]. In adsorption theory, the density of the free gas is characterized by the gas equation of state. The thermodynamic properties of the adsorbed phase gas, such as the density, fugacity, pressure, and compression coefficient, are all functions of the potential. The potential is a function of the microporous volume z, which is a function of the distance d of the adsorbate molecules perpendicular to the adsorbed surface and the specific surface area of the adsorbent, such as, z = d × As. There are potential decreases with an increasing volume of micropores [23]; therefore, gases are preferentially adsorbed on smaller pores (having a larger specific surface area). With the increase in the adsorption pressure, the density of the free phase gas increases, on the one hand, increasing the interaction between gas molecules and the difficulty of gas adsorption on the solid surface [12]; on the other hand, when the density of the free phase is equal to the density of the adsorption phase, the gas will no longer adsorb [18]. There is a maximum pore size, below which adsorbed gases can fill the pores under supercritical conditions, and this pore size decreases as the temperature rises above the critical temperature [18].
Under low-pressure conditions, CBM molecules preferentially adsorb in absorption pores (<2 nm) and adsorption pores (2–10 nm) with high specific surface areas, where the surface adsorption potential is maximized [16,19,20,24]. This regime is characterized by monolayer adsorption with a high adsorbed-phase density, resulting in a significant adsorption capacity. With the increase in the adsorption pressure, basically complete monolayer adsorption and multilayer adsorption gradually enhanced, manifested in the filling of pores by the adsorption potential to reduce the gas molecules and increase the influence of intermolecular forces. Furthermore, adsorption capacity was weakened, the adsorption of the phase density decreased, and the adsorption amount was small. Pore filling reaching the maximum pore size will stop adsorption and the adsorption amount will reach the maximum value [16,19,20,24].
The Qinshui Basin contains predominantly medium- and high-rank coals. Previous studies have demonstrated that medium-rank coals exhibit superior CBM recovery rates compared to high-rank coals [25,26,27]. Given this finding and the critical need to optimize CBM production, we selected medium-rank coal as our research focus for isothermal adsorption characterization. The coal seams exhibited pressure coefficients of 0.9–1.1 MPa/100 m, with all sampled depths shallower than 800 m. Isothermal adsorption experiments were conducted at pressures up to 11 MPa. The study of the adsorption of medium-rank coal conditions can accurately evaluate the adsorption capacity of medium-rank coal and analyze the mechanism of gas adsorption in medium-rank coal. This study employed a multi-technique approach combining low-temperature CO2 adsorption, low-temperature liquid nitrogen adsorption, and mercury intrusion porosimetry to characterize the complete pore structure spectrum. The experimental adsorption data were analyzed using a modified Dubinin–Radushkevich (D-R) model to elucidate the gas storage mechanisms in medium-rank coals. To clarify the adsorption mechanism and dynamic adsorption process of methane in coal, this work investigated the methane adsorption characteristics and its influencing factors in medium-rank coal under different pressure conditions. Therefore, this work may provide the theoretical basis for CBM exploration and reserve predictions.

2. Samples and Experiments

2.1. Samples

Coal samples were collected from newly exposed mining faces in the Qinshui Basin, located in southeastern Shanxi Province, China. To minimize potential interference from tectonic deformation and compositional variations, the coal structure of the selected coal samples were all primary structural coals and the macroscopic coal types were all semibright coals. The experimental coal samples are shown in Figure 1a. The Qinshui Basin is a key production area for commercial CBM development in China, of which the northern part is dominated by medium-rank coal and possesses strong CBM development potential, and the selected experimental samples are all from the gas-developed coal seams. The sampling locations and targeted seams of the experimental samples are shown in Table 1.

2.2. Methodology

In accordance with Chinese national standards GB/T6948-2008 [28] and GB/T8899-2013 [29], basic tests on the vitrinite reflectance, maceral components, and mineral content of the coal samples were performed. Additionally, the coal samples conducted a proximate analysis following Chinese national standards GB/T212-2008 [30]. The above results are presented in Table 2.

2.2.1. Methane Isothermal Adsorption

A TerraTek-300 isothermal adsorption instrument (TerraTek, Houston, TX, USA) was used to carry out methane isothermal adsorption experiments with reference to the Chinese national standards GB/T19560-2008 [31], and nine experimental points were set up in each group of experiments, with the highest adsorption pressure of 12 MPa, in order to reveal the trend of the change of excess adsorption amount of coal samples under different pressure conditions. The structure of isothermal adsorption experiments is shown in Figure 1c. The samples were of 60–80 mesh in particle size with the temperature of 30 °C (303.15 K) and pressure of 0–12 MPa.

2.2.2. Low-Temperature Carbon Dioxide Adsorption, Liquid Nitrogen Adsorption, and Mercury Intrusion Experiments

Coal samples were adsorbed with low-temperature carbon dioxide (LC) and liquid nitrogen (LN) using ASAP2020 series fully automatic rapid specific surface area and pore space analyzer produced by Micromeritics, Norcross, GA, USA. The low-temperature carbon dioxide adsorption experiments mainly characterized the pore volume and specific surface area of ultramicropores < 2 nm, and the low-temperature liquid nitrogen adsorption mainly characterized the pore volume and specific surface area of ultramicropores, pores, and mesopores between 1.7 and 250 nm. The coal specific surface area was calculated according to the BET (Brunauer–Emmett–Teller) multimolecular layer adsorption theory [32]; the coal pore aperture and volume distribution were obtained by applying the BJH (Barrett–Johner–Halenda) theory and the Kelvin equation [33]. The coal samples were subjected to mercury intrusion (MI) experiments using a 9310-type mercury porosimeter (Micromeritics, Norcross, GA, USA), which was mainly used to determine the volume of pores, mesopores, and macropores of 10–1000 nm and above, and to obtain the distribution of the pore size and volume of the pores of the coal samples.

3. Result

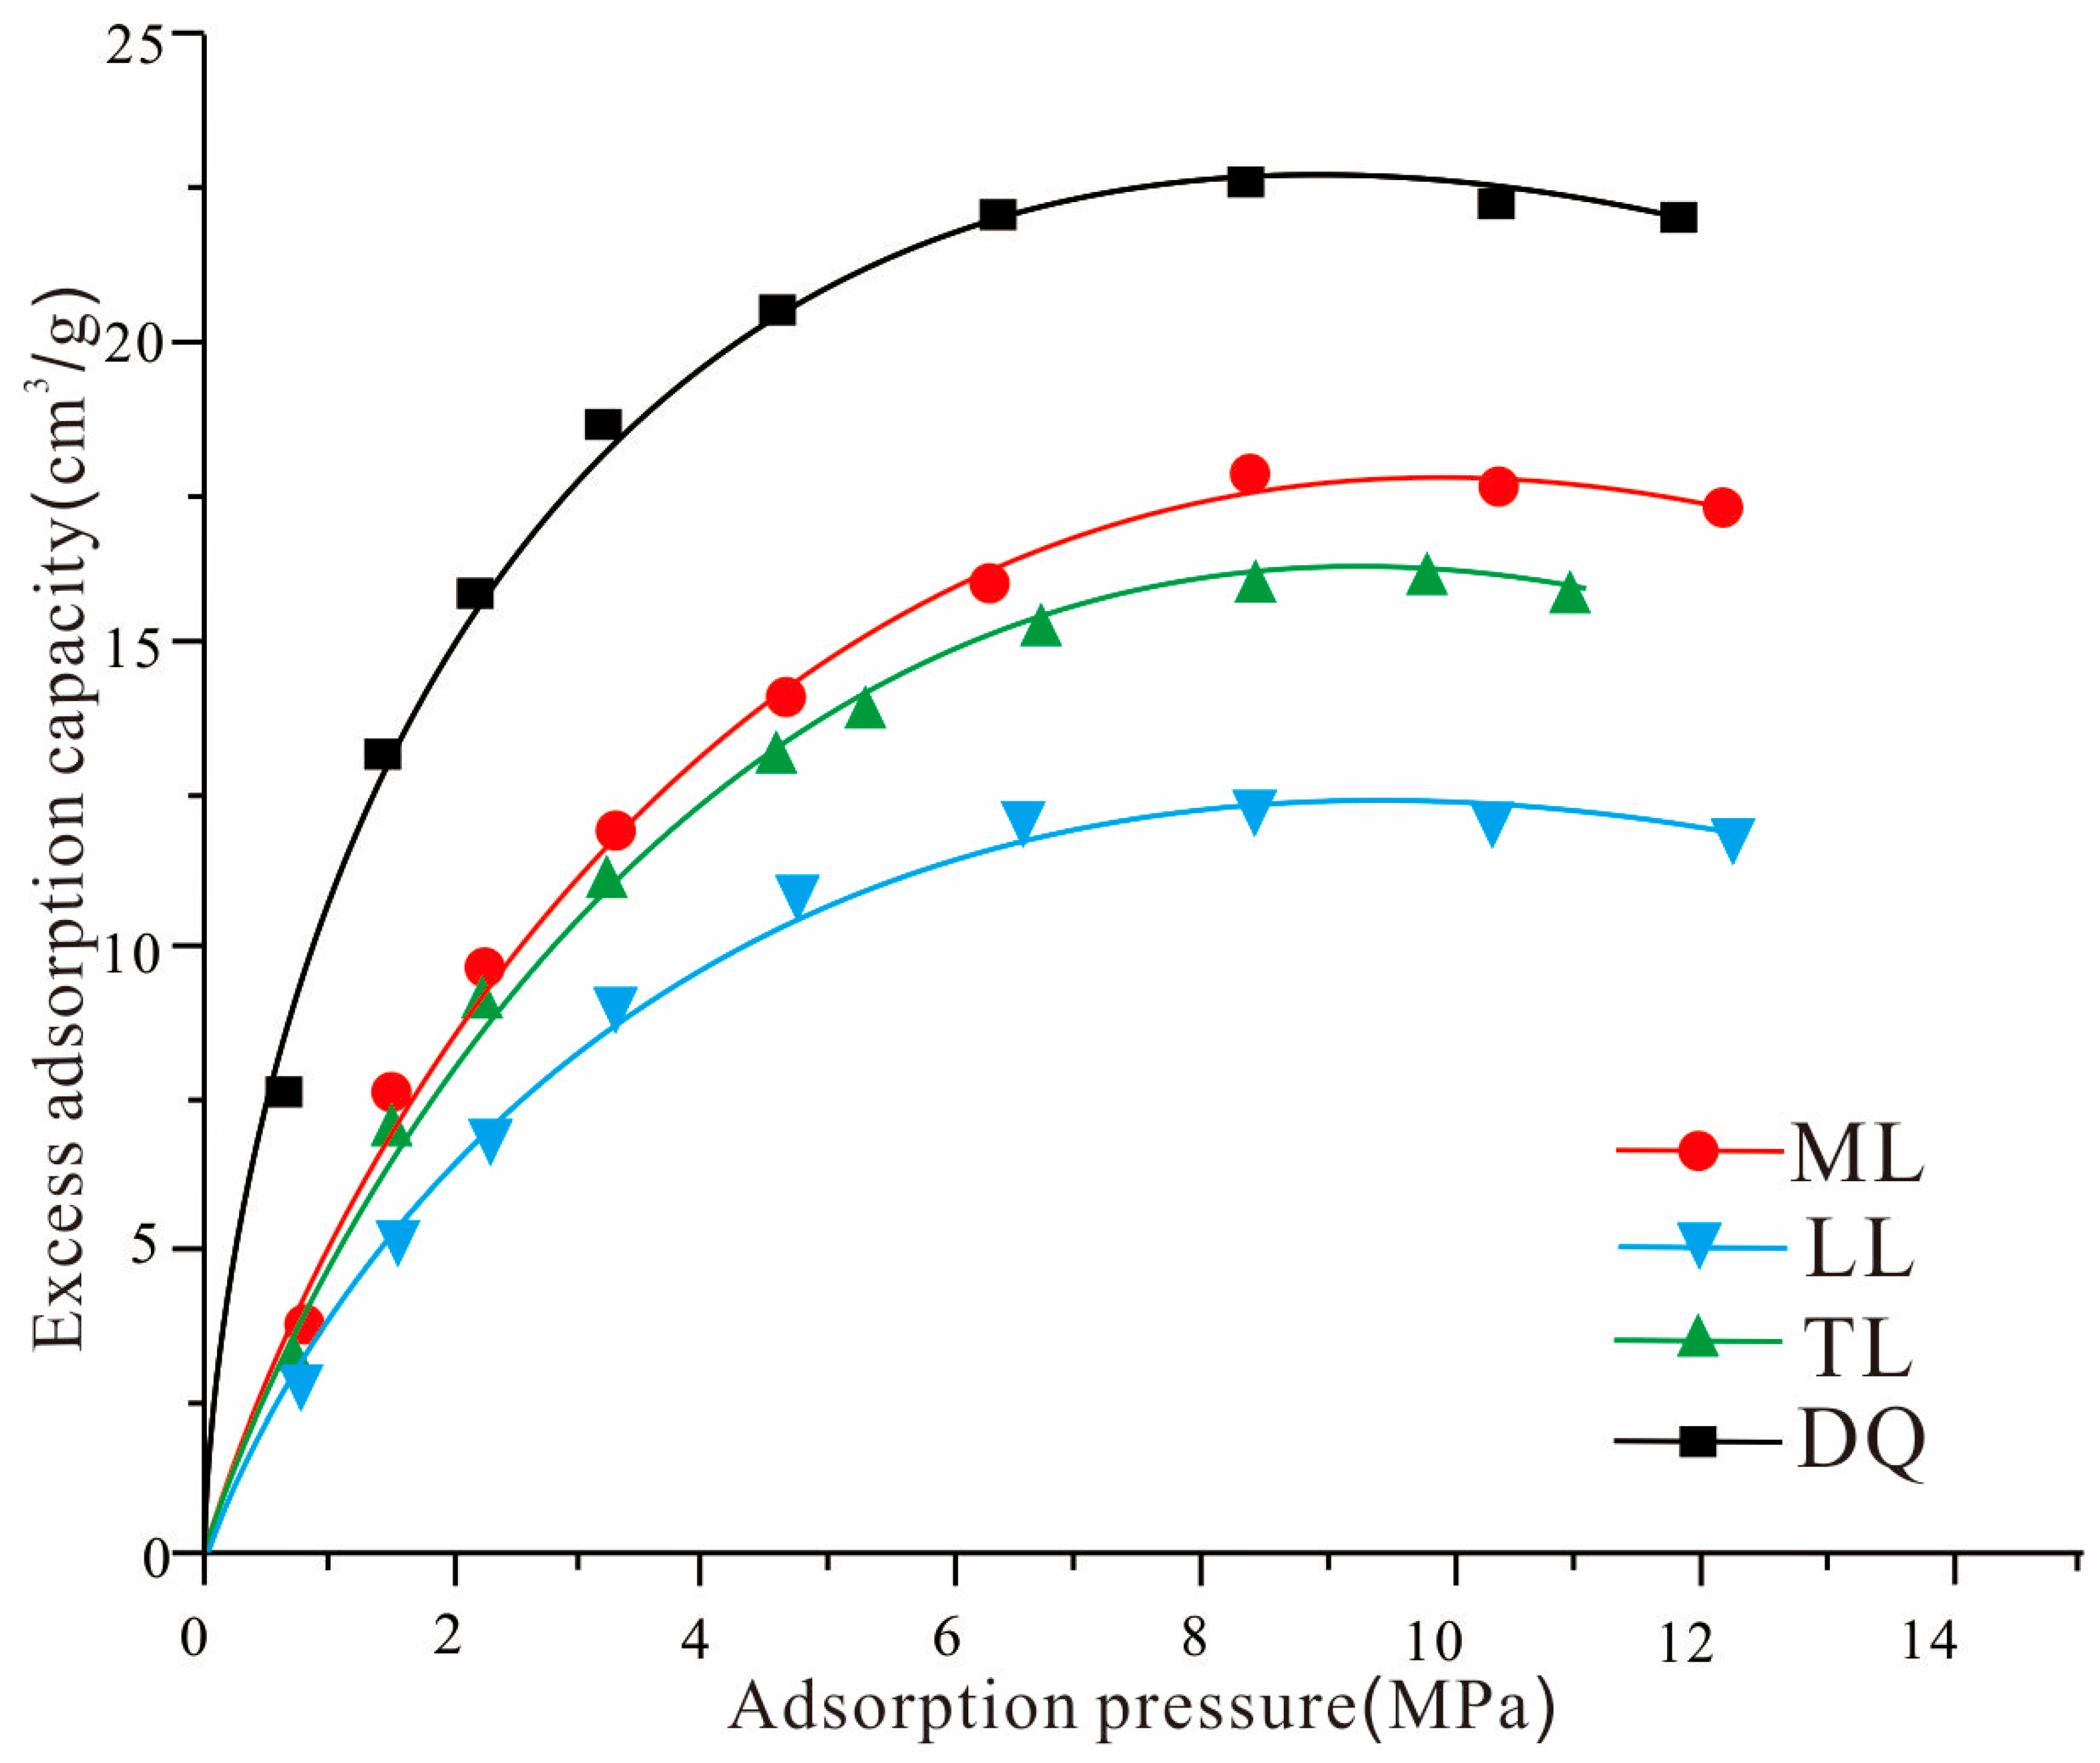
3.1. Gas Isothermal Adsorption

The results of isothermal adsorption experiments are shown in Figure 2. Different coal samples were selected for isothermal adsorption experiments, and the excess adsorption amount of coal samples generally showed the following: the increasing trend of the excess adsorption of the four coals in the low-pressure range is obvious; however, the growth rate of an excess adsorption amount was slower with the increase in the adsorption pressure, the growth curve of the excess adsorption amount tended to be flattened when the adsorption pressure reached 6 MPa, and the phenomenon of a decrease in the adsorption amount began to appear when the adsorption pressure reached 8 MPa.

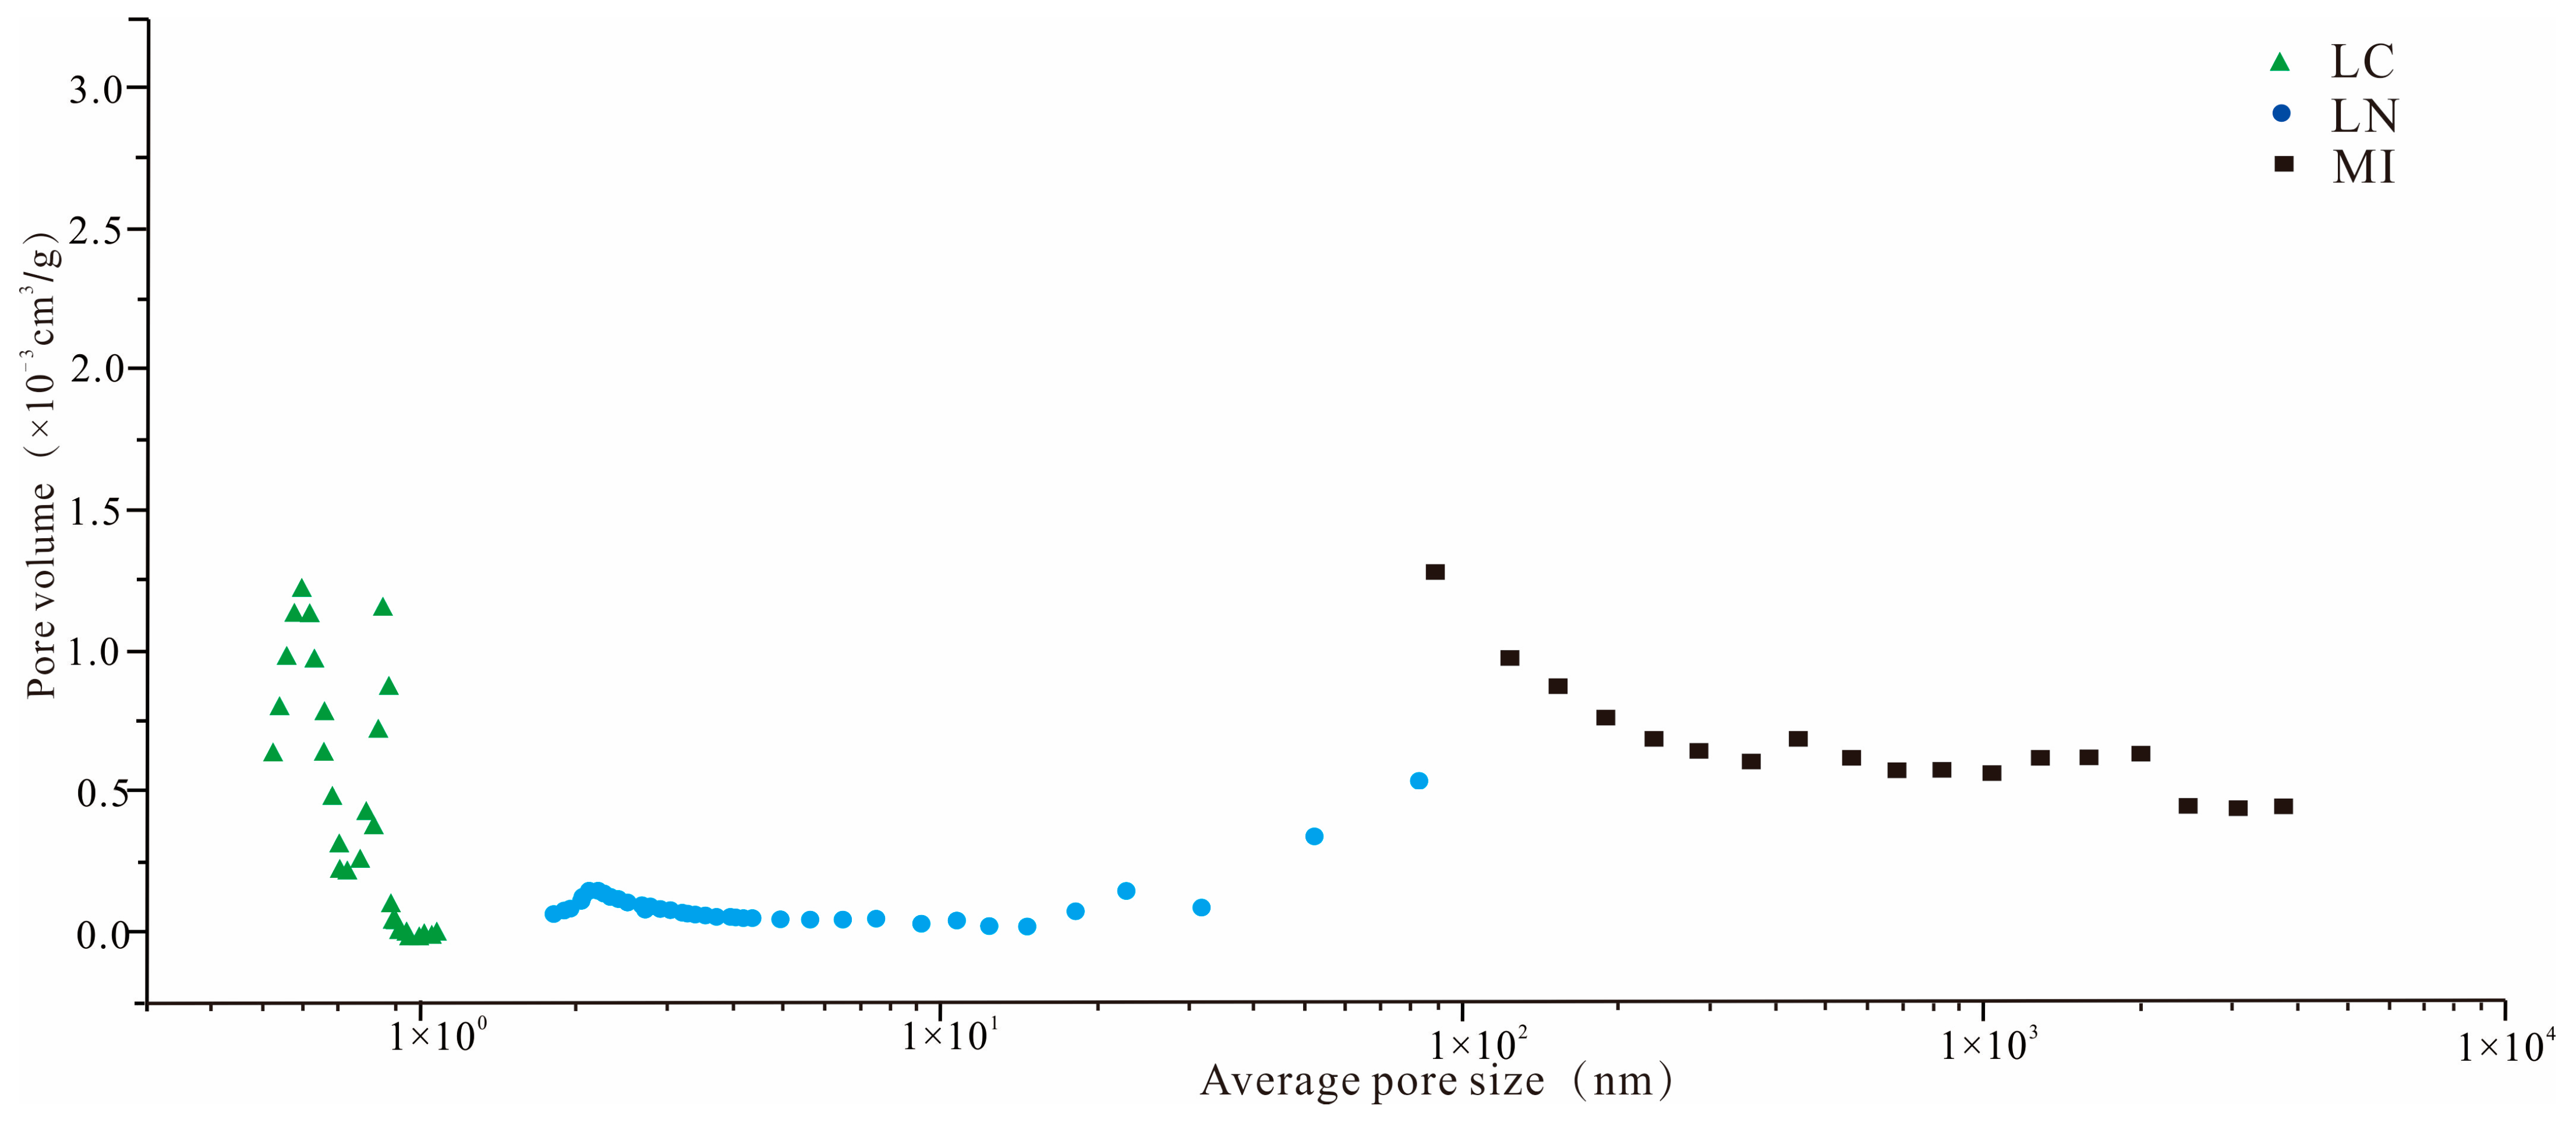
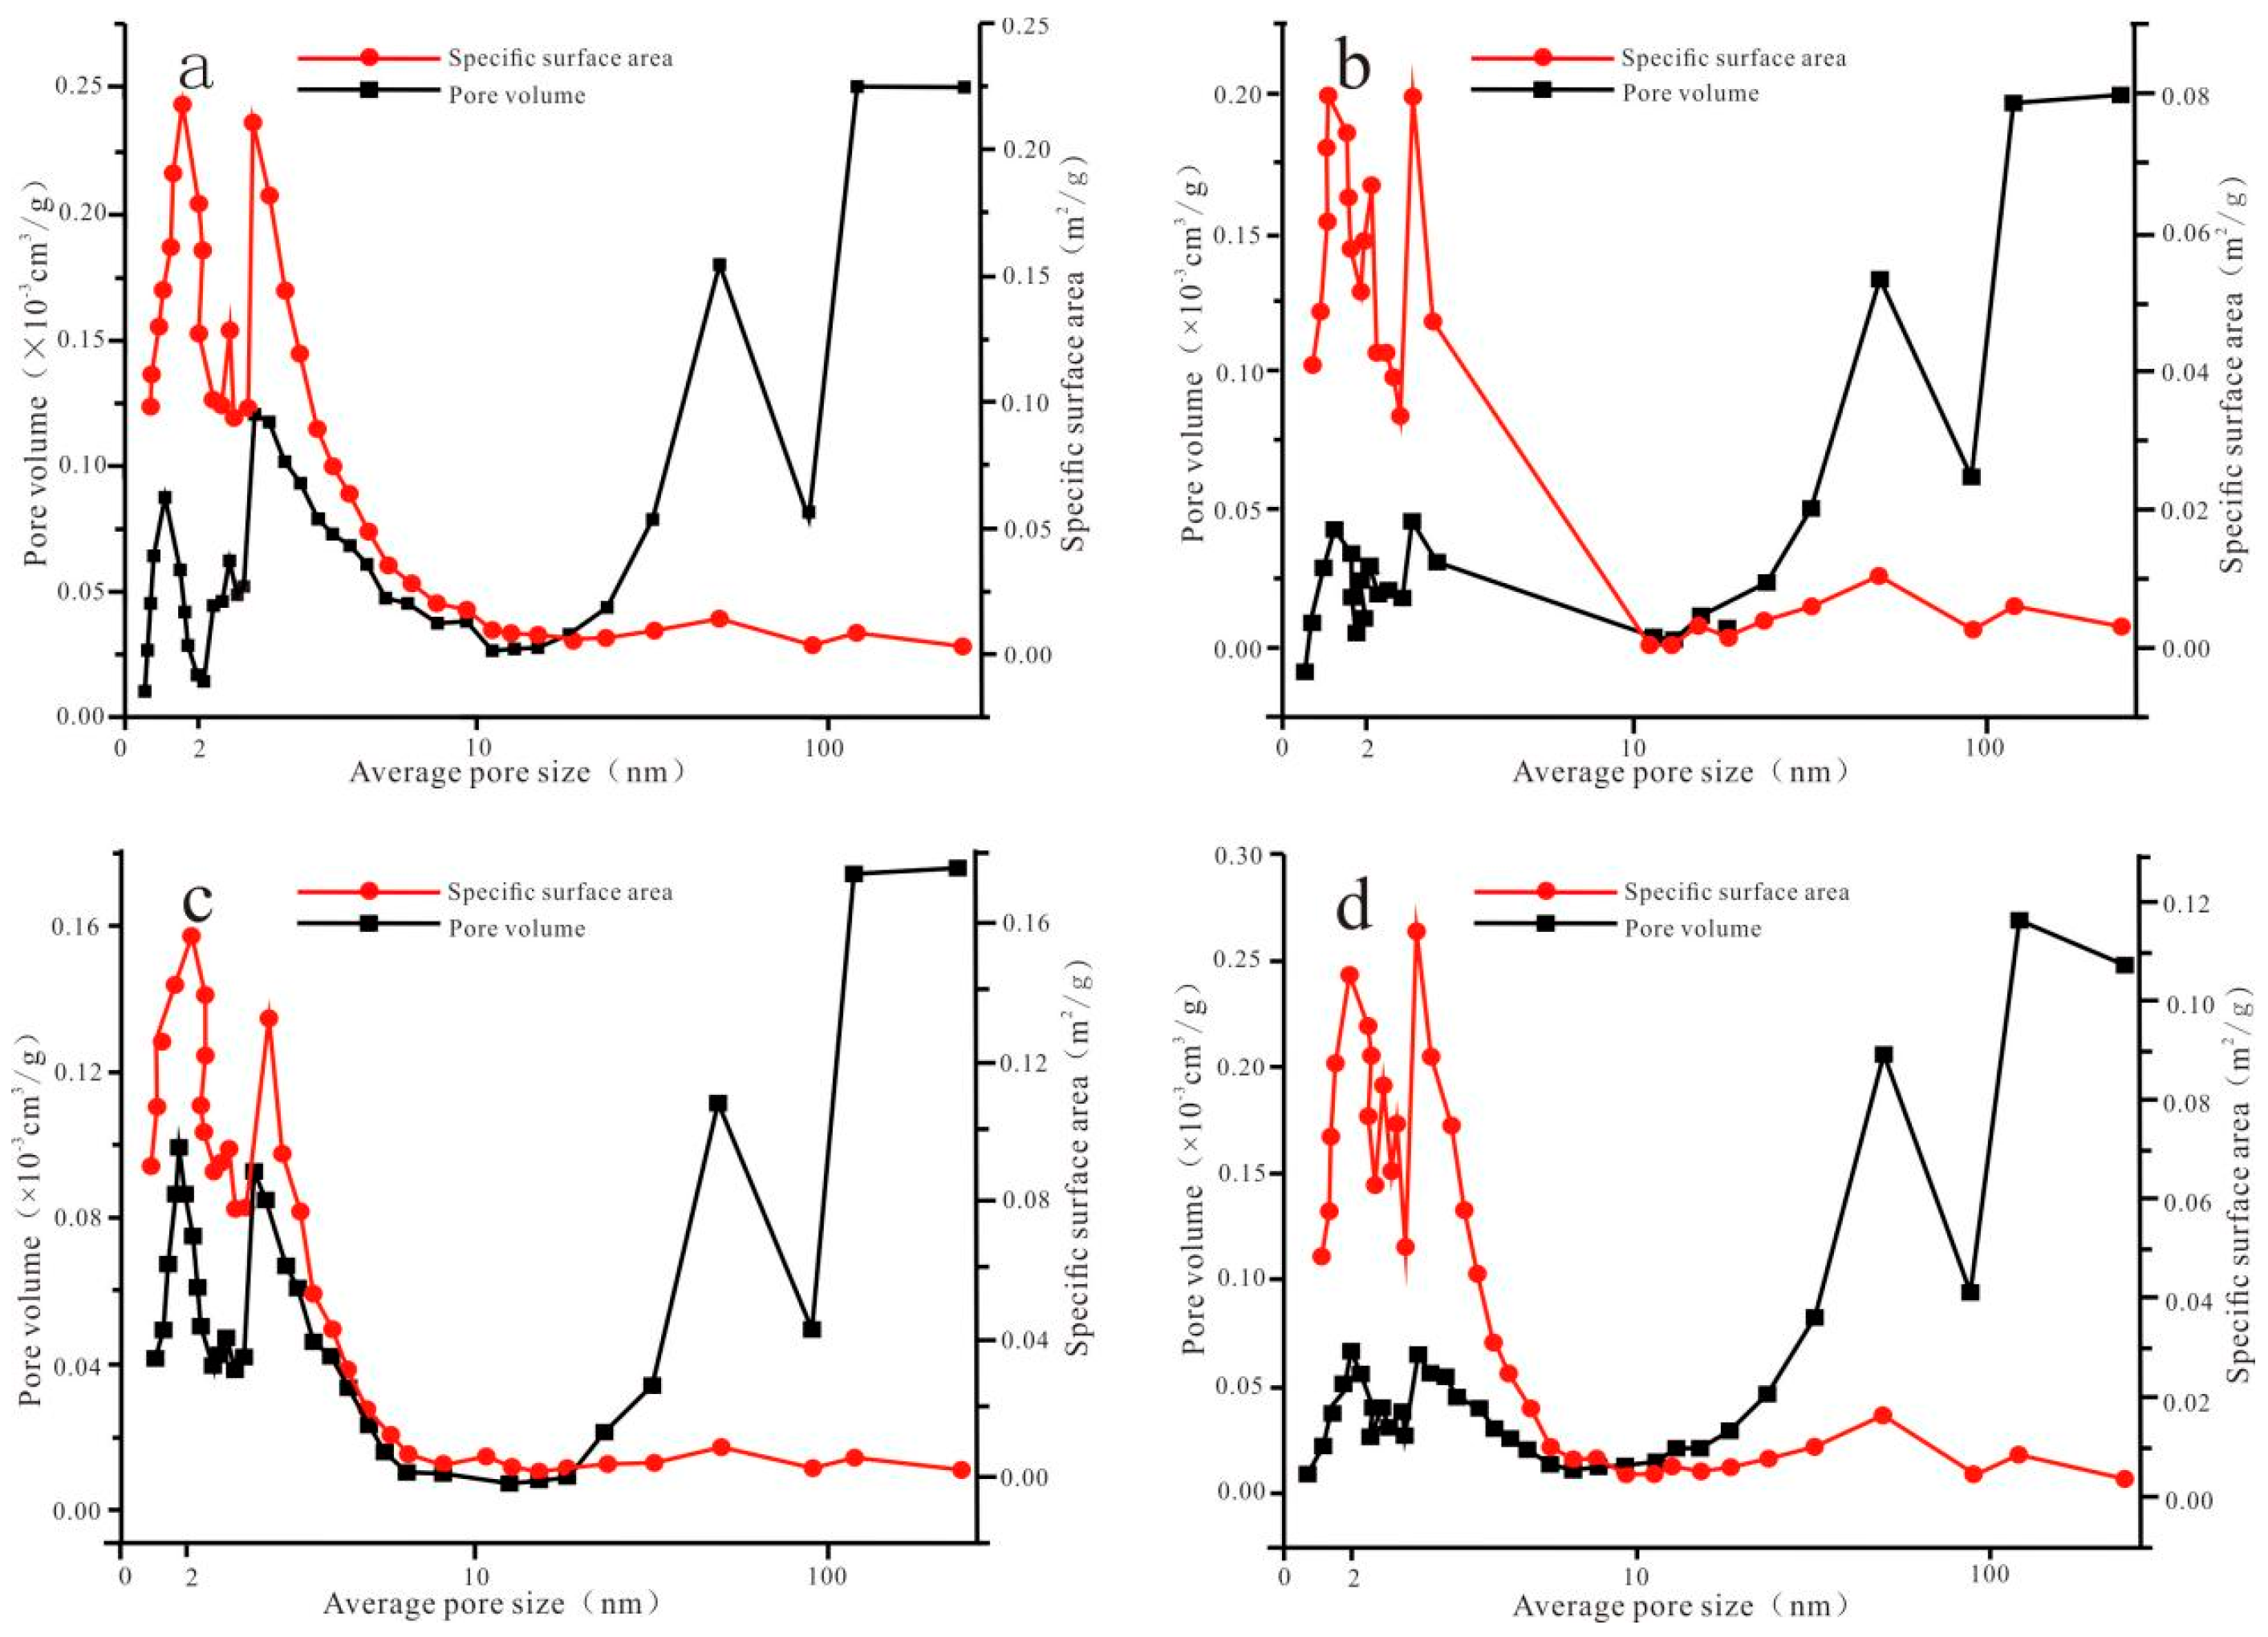
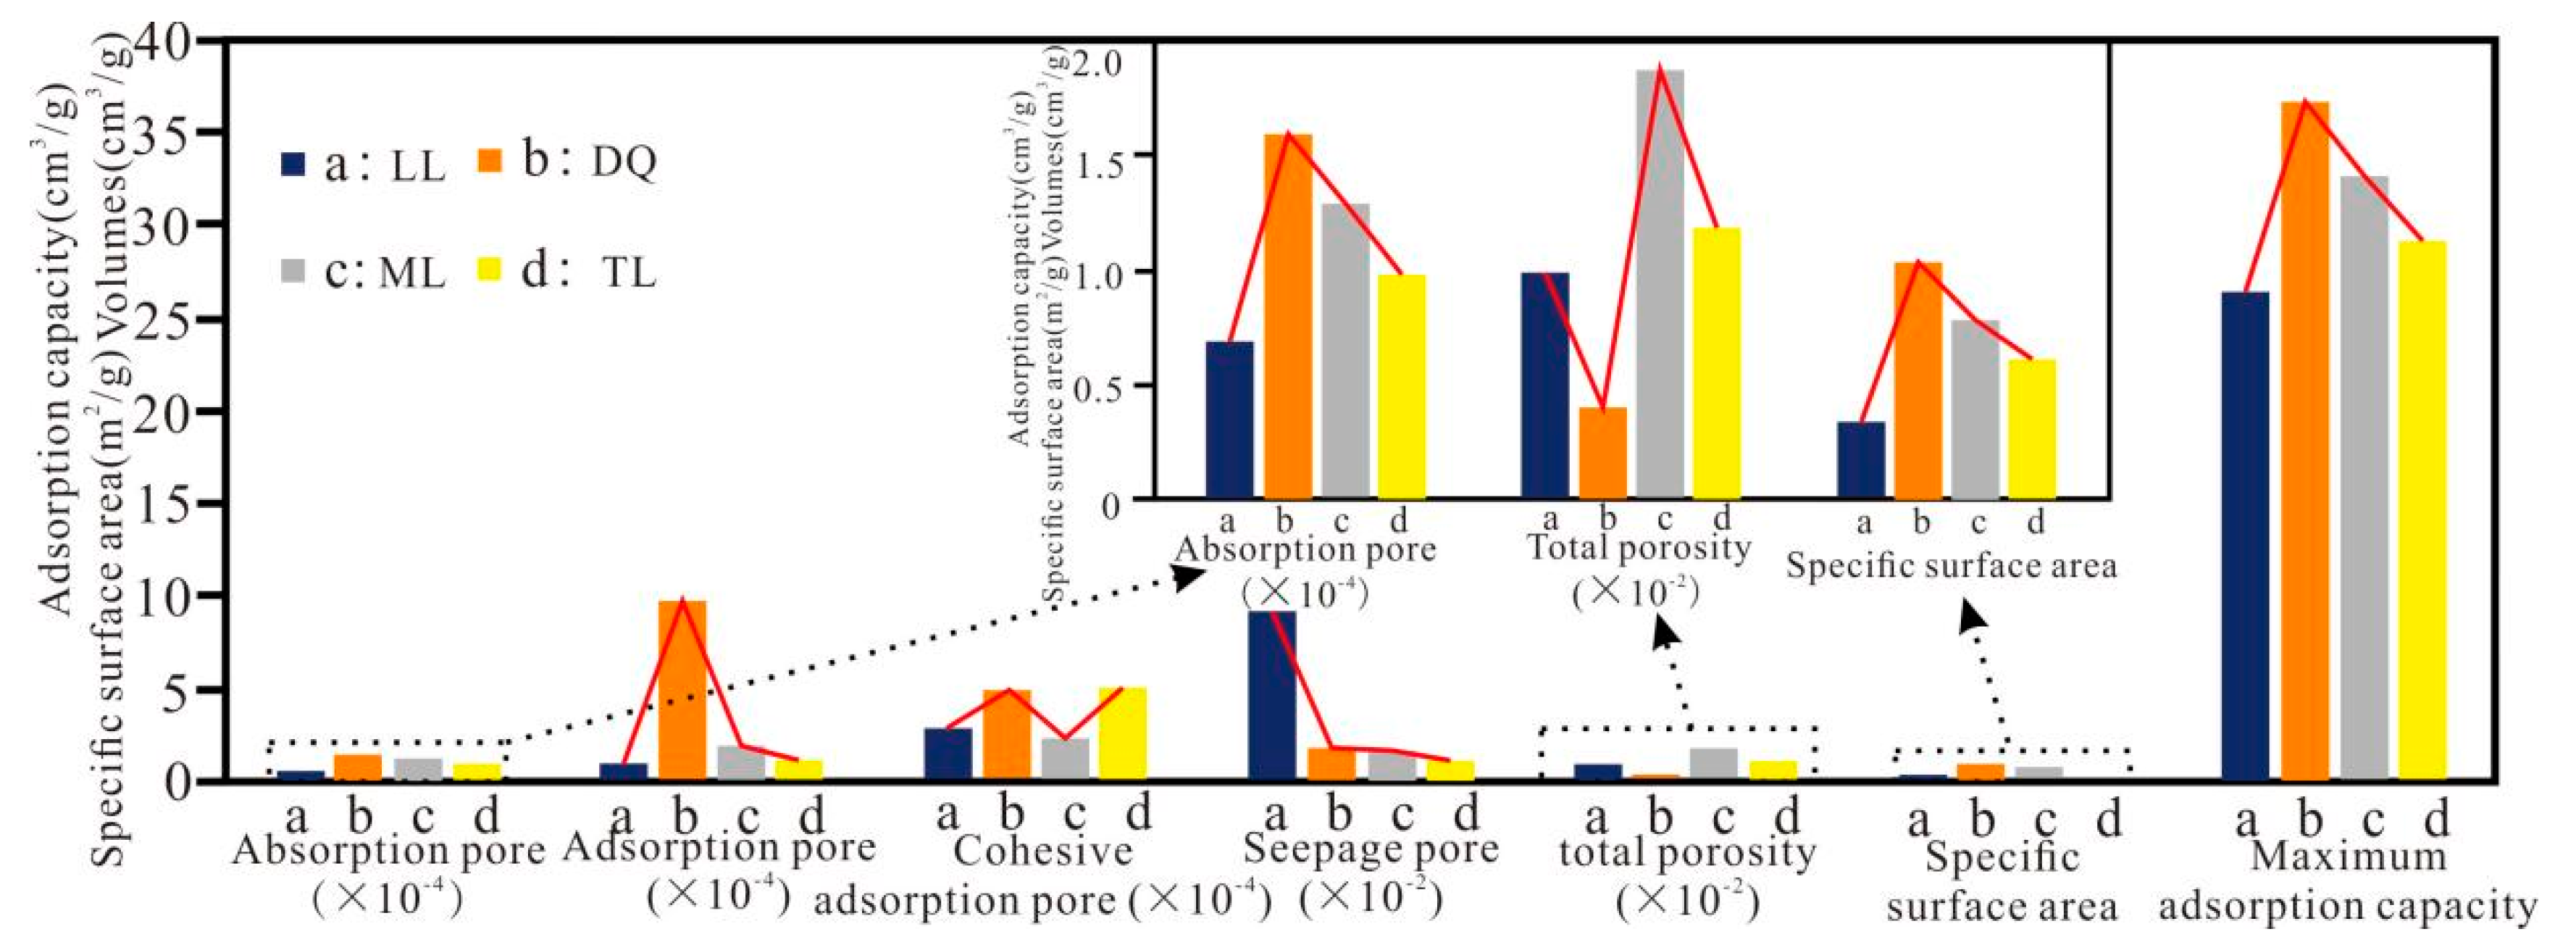
3.2. Pore Volume and Specific Surface Area
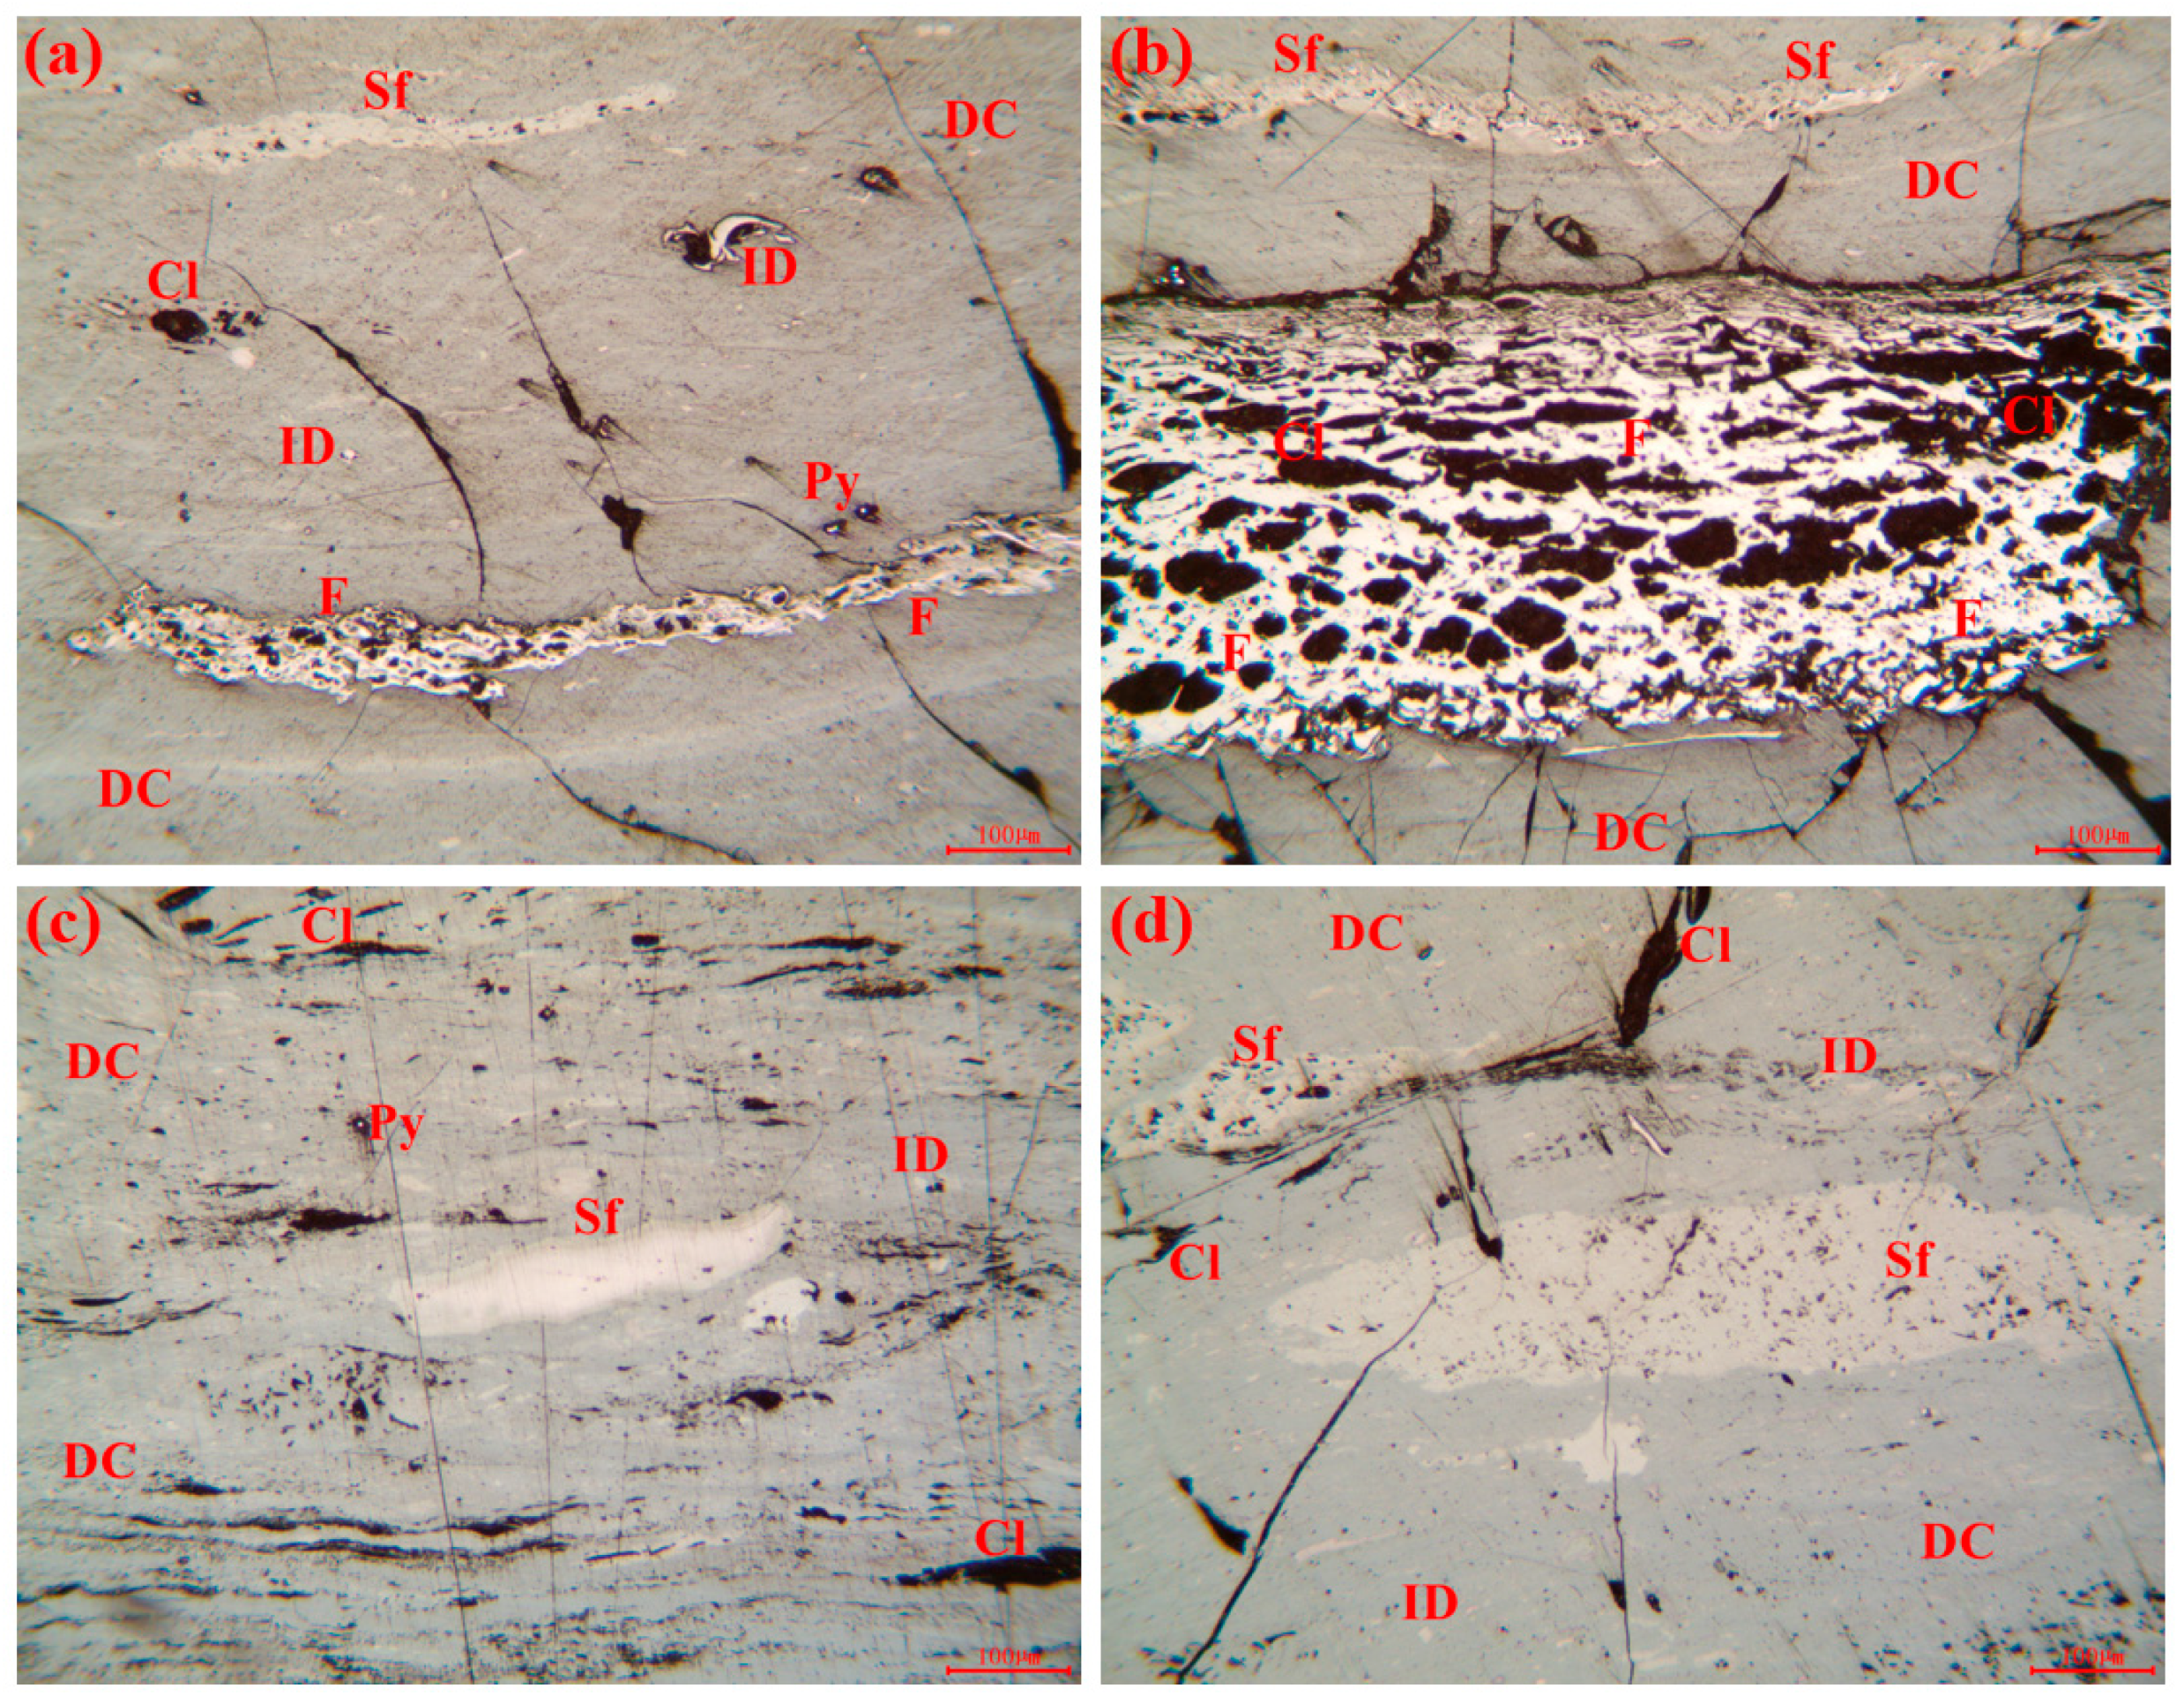
The distribution of the coal pore volume components measured by low-temperature carbon dioxide adsorption, low-temperature liquid nitrogen adsorption, and mercury intrusion experiments is shown in Figure 3 (sample DQ is taken as an example), and the range of pore diameters measured by different methods is different. The high-pressure mercury-pressing experiment will destroy the microscopic matrix structure of coal and deform it [34], resulting in the large pore volume of a pore size < 300 nm measured by the mercury-pressing method. Therefore, for a pore size < 2 nm, the carbon dioxide adsorption was used to characterize the pore size; for a pore size < 300 nm, the low-temperature liquid nitrogen adsorption method was used to characterize the pore size; and for a pore size > 300 nm, the mercuric pressure method was also used to characterize the pore size.

3.3. Pore Types

Based on specific research purposes and technical means, foreign scholars have put forward a variety of division schemes for coal reservoir aperture division [35,36]. The widely used classification method proposed by IUPAC is as follows: micropore (<2 nm), mesopore (2–50 nm), and macropore (>50 nm). The classification is mainly based on the adsorption characteristics of nitrogen molecules in pore structures of different sizes. The method fully considers the adsorption behavior between the pores and gas molecules and it can well explain the adsorption phenomena and mechanism of the porous materials, but the classification is only based on the pore size [37]. However, the classification method is only based on the pore size, ignoring the influence of the pore shape and connectivity on the performance of the porous materials, and there is inaccuracy in the pore classification for some special materials or special application scenarios, such as in shale oil reservoirs, where the mineral composition, diagenetic evolution, and maturity are significantly different from ordinary porous adsorbents, and the IUPAC pore classification method cannot well reflect the microscopic pore throat characteristics and the intrinsic distribution law [37,38]. Domestic scholars also put forward classification standards, such as Fu et al. [39] who proposed the three-dimensional fracture–pore system of coal reservoirs as micro-matrix pores (<75 nm), large matrix pores (>75 nm), and fractures. Sang et al. [24] proposed having an absorption pore (<2 nm), adsorption pore (2–10 nm), coalescence–adsorption pore (10–100 nm), and seepage pore (>100 nm). Cai et al. [40] proposed the following: ultramicropores (<2 nm), micropore (2–10 nm), pore (10–100 nm), mesopores (100–1000 nm), macropores (103–104 nm), ultramacropores (104–105 nm), and crack (>105 nm), and explored the effect of pore scales on CBM adsorption and seepage.
Considering the gas-fixing role of coal pores, the pore classification scheme proposed by Sang et al. was used in this study, i.e., absorbing pores (<2 nm), adsorbing pores (2–10 nm), cohesive-absorbing pores (10–100 nm), and percolating pores (>100 nm) [39]. Absorption pores are mainly organic macromolecular structural units and partly intermolecular pores; adsorption pores are mainly intermolecular pores; coalescence–adsorption pores are mainly intermolecular pores, partly deformation-modified primary pores and metamorphic pores; and percolation pores are mainly primary pores and metamorphic pores. The pore morphology in coal can be broadly categorized into three groups based on the ability to generate adsorption backlines [41]: Type I is an open permeable pore with an insignificant adsorption return line; Type II is an impermeable pore closed at one end, which does not produce an adsorption return line; and Type III is a thin-necked bottle-shaped pore, which produces an adsorption return line and there is an inflection point where the adsorption return line decreases sharply.
Sample LL has a small adsorption return line, as shown in Figure 4a. The adsorption and desorption lines coincide when the relative pressure is 0–0.5 MPa, and the adsorption return line is generated when the relative pressure is 0.5–1.0 MPa. The return line is small and does not have an inflection point, which belongs to class I open permeable pores. The pore types are mostly cylindrical pores with openings at both ends and parallel plate pores with openings on all sides. Sample ML and sample TL are shown in Figure 4b and Figure 4c, respectively, which do not have adsorption return lines, and the adsorption and desorption lines basically overlap, belonging to the class II type of closed air-permeable pores at one end. Sample DQ is shown in Figure 4d and is like sample LL, belonging to the same class, and has a small adsorption return line.

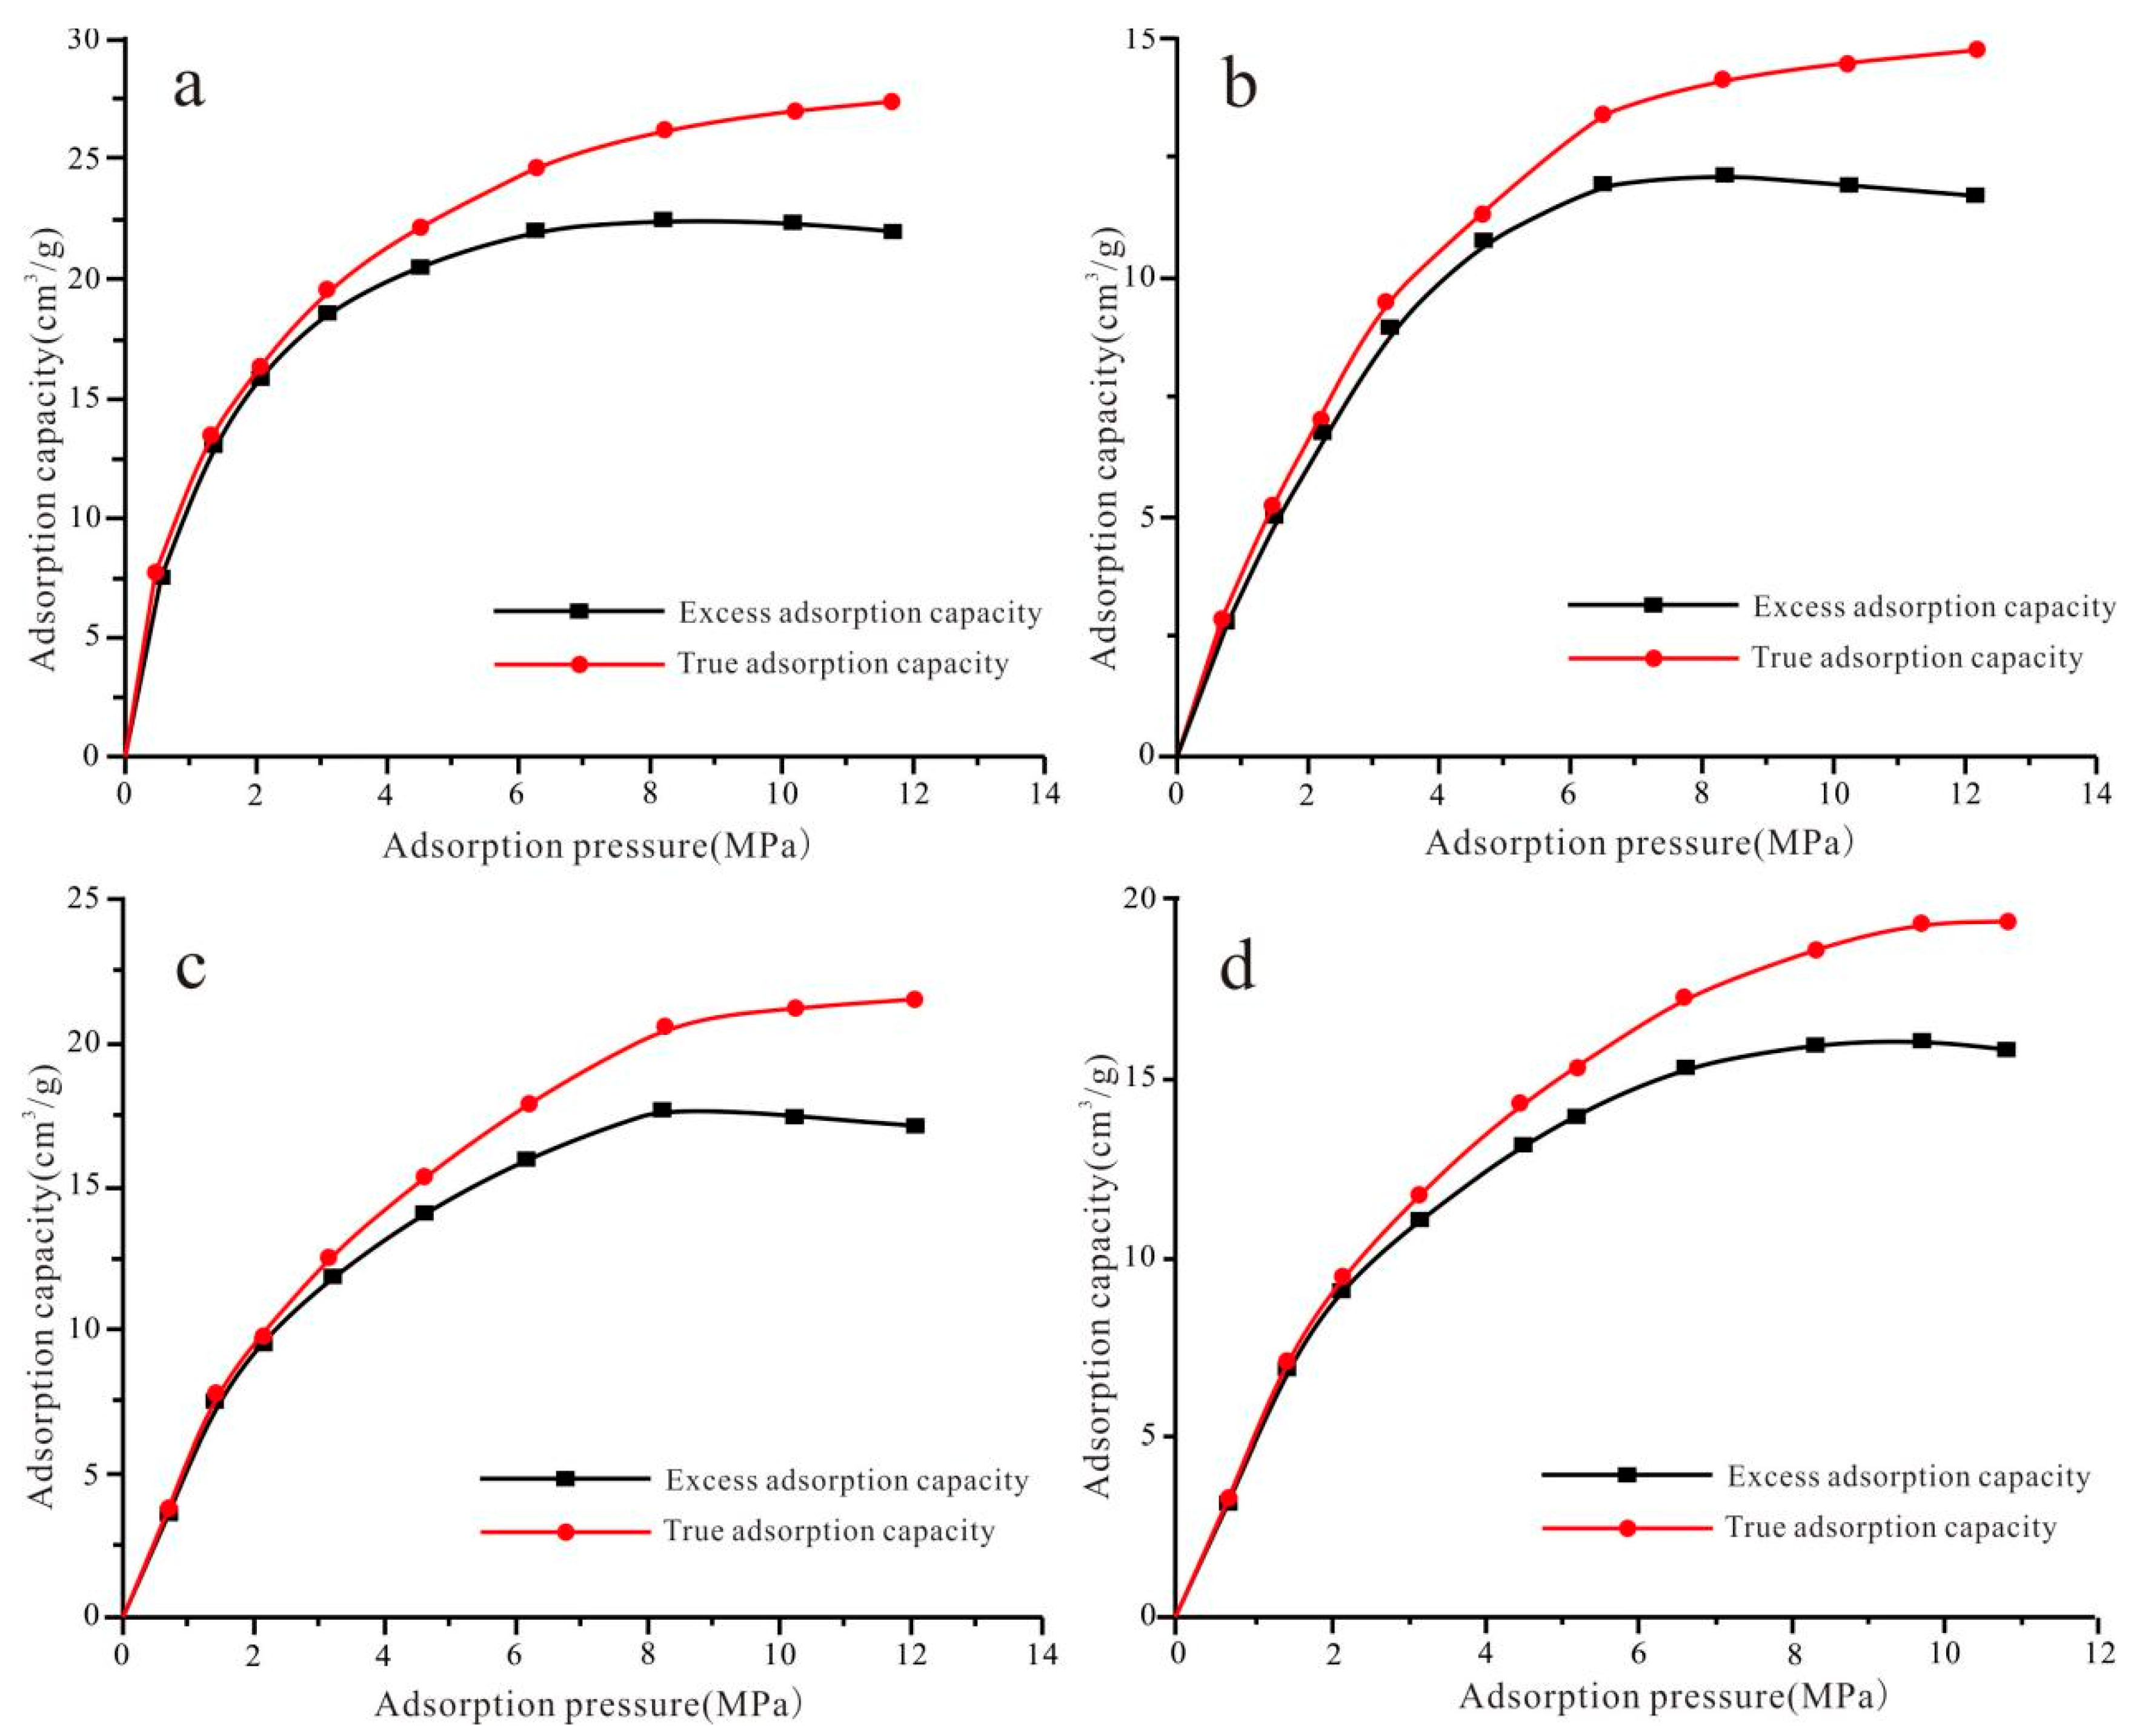
3.4. True Adsorption Versus Excess Adsorption

Excess adsorption (apparent adsorption) is the amount of gas adsorbed on the adsorbent (coal) calculated if the adsorbed phase does not occupy space. Neglecting the volume of the adsorbed phase, the calculated excess adsorption will be smaller than the true adsorption [42,43]. The higher the adsorption pressure, the greater the difference between the two [43,44].
The following relationship exists between the true adsorption capacity and the excess adsorption capacity [42]:
n a d = n e x c 1 ρ g / ρ a
In the formula, n ad is for the true adsorption amount, cm3/g; n exc is for the excess adsorption amount, cm3/g; ρ g is for a certain temperature and pressure, the free gas density, g/cm3; and ρ a is for the adsorption phase gas density, g/cm3. The density of adsorption phase gas cannot be directly obtained, so the quasi-boiling point of the density of liquid gas (0.4224 g/cm3) is commonly used.
Applying Equation (1) and the experimentally obtained excess adsorption amount, the true adsorption amount was obtained as shown in Figure 5. When the adsorption pressure is small, the excess adsorption amount and the true adsorption amount are approximately equal, and the excess adsorption amount can be used to approximately replace the true adsorption amount to study the relationship between the gas adsorption amount and pressure. However, the difference between the two increases with the increase in pressure and the excess adsorption amount need to be corrected when studying the gas adsorption characteristics under higher-pressure conditions.

4. Discussions

4.1. Pore Structures

Coal exhibits a heterogeneous pore structure spanning multiple scales, from molecular-scale absorption pores (<2 nm) to macro-scale seepage pores (>100 nm). Given that no single experimental technique can fully capture this broad pore size distribution, integrated multi-method characterization has become essential for accurate pore network analysis [45]. Huo et al. used low-temperature liquid nitrogen adsorption and scanning electron microscopy (SEM) to jointly observe the pore characteristics of tectonic and intact coals [46]. Wang et al. tested and calculated the pore size distribution and pore morphology of coal samples by the mercury intrusion method and nitrogen adsorption method, respectively [47]. Li et al. used a mercury injection, low-temperature liquid nitrogen adsorption, and nuclear magnetic resonance relaxation methods to test the pore structure of coal samples, respectively [48]. Wang et al. characterized the pore system of coal at different scales by low-temperature carbon dioxide and liquid nitrogen adsorption, high-pressure mercury intrusion, and low-field nuclear magnetic resonance (NMR) [47]. Li et al. tested the pore distribution characteristics of coal samples by the pressure mercury method, low-temperature N2 adsorption method, and CO2 adsorption method, respectively [49]. To comprehensively characterize the full-scale pore structure of coal, we employed a tri-method approach combining low-temperature carbon dioxide adsorption, low-temperature liquid nitrogen adsorption, and mercury intrusion.

4.1.1. Full-Scale Pore Structure Characterization

The mercury intrusion method is suitable for the characterization of pores with a pore size larger than 10 nm, and it can obtain the pore structure information of macropores and some mesopores in coal samples. Due to the matrix compressibility of coal, it makes pore destruction possible after a pressure > 10 MPa, which in turn causes errors [47,48,49]. The low-temperature liquid nitrogen adsorption method can measure pore sizes in the range of 1.7–250 nm, and is mainly used to characterize mesopores and micropores; when the pore size is larger than 100 nm, the measured pore volume increases significantly and the reliability of the data decreases [47,48,49]. The carbon dioxide adsorption method has a higher sensitivity and accuracy for the ultramicropores with a pore size of less than 2 nm [47,49]. This integrated approach overcomes individual method limitations by combining their respective optimal measurement ranges. By rationally dividing the pore size intervals, the data measured by the three methods are connected to realize the comprehensive characterization of the pore structure of coal in the whole pore size range.
Based on the above analysis, the full-scale pore structure characterization strategy is proposed: low-temperature carbon dioxide adsorption experiments are used to characterize the pores with pore diameters of less than 2 nm, low-temperature liquid nitrogen adsorption experiments are used to characterize the pores with pore diameters between 1.7 and 250 nm, and mercury intrusion is used to characterize the pores with pore diameters greater than 100 nm. By effectively connecting the data obtained from the three testing methods at the two interface points of 2 nm and 100 nm, the full-scale pore structure characterization of coal samples was realized. This synergistic approach maximizes each technique’s strengths while compensating for individual limitations, and provides an effective way to comprehensively and accurately characterize the pore structure of coal samples. Quantitative pore structure parameters, including pore volume distributions and surface area measurements, are summarized in Table 3 and Table 4. Mercury intrusion experiments, that determine the pore size, pore volume, and connectivity based on the curves, are less effective in characterizing the specific surface area.

4.1.2. Relationship Between Pore Volume, Specific Surface Area, and Pore Size

As shown in Figure 6, the relationship between the pore volume and specific surface area with pore size is consistent for the four coal samples. The absorption pore space (<2 nm) and adsorption pore space (2–10 nm) contributed more to the specific surface area. Adsorption pores (2–10 nm) showed the best correlation with the specific surface area, followed by absorption pores (<2 nm), and coalescence–adsorption pores (10–100 nm) showed the worst correlation with the specific surface area. The percolating pores (>100 nm) contributed the most to the total pore volume, while the adsorbing pores (2–10 nm) and coalescing–adsorbing pores (10–100 nm) contributed the second most to the total pore volume. The measurement range of the low-temperature liquid nitrogen adsorption method was 1.7 nm to 300 nm, and the relationship between the percolating pore volume, specific surface area, and pore size was not characterized.

4.1.3. Characterization of Full-Scale Pore Structure

Analysis of the pore volume distribution showed (Figure 6) that the pore volumes of the four coal samples generally exhibited a bimodal pattern, with an initial peak in the absorptive pores (<2 nm) and a main peak in the seepage pores (>100 nm). The pore volume share of the percolating pores was as high as 93.39% to 96.83% (Table 3). The specific surface area peaks in the absorbing pores (<2 nm) and then decreases monotonically with the increasing pore size (Figure 6). The specific surface areas of the absorbing pores (<2 nm) and adsorbing pores (2–10 nm) were the largest, and their percentage was between 99.93 and 99.99%, and for the absorbing pores (<2 nm) alone, their specific surface areas were all the largest, and their percentage was between 98.51 and 99.44%. Quantitative distributions of the pore volume and specific surface area across all pore size ranges are comprehensively presented in Figure 7.

4.2. Adsorption Curve Fitting Based on Improved D-R Adsorption Modeling

Considering the problems that occur when the adsorption pressure exceeds the critical pressure (the critical pressure of gas is 4.6 MPa), the saturated vapor pressure does not exist and expansion occurs after the adsorption of gases from coal. The present experiments used the D-R model with the improvement of the Dubinin–Radushkevich isothermal adsorption model by Sakurovs et al. and changed to the D-R model that uses the density of the gas as a free variable; the improved D-R model has a very good fit to the data of isothermal adsorption experiments in a large temperature range (0–60 °C) and pressure range (0–20 MPa), and it has a very good fitting effect on the isothermal adsorption experimental data [44]. The improved D-R model is as follows:
n e x c = n 0 1 ρ g ρ a e D l n ρ a / ρ g 2 + k ρ g 1 ρ g / ρ a
In the formula, n0 is the maximum adsorption volume, cm3/g; D is a constant reflecting the gas–coal interaction relationship; and k is the adsorption volume error correction factor.
The isothermal adsorption results were fitted, as shown in Figure 8, using a modified D-R model (Equation (2)) through Origin software (2021, OriginLab, Northampton, MA, USA) to obtain the parameters n0, D, and k and their correlation coefficients R2. The values of each parameter are shown in Table 5.
From Figure 8 and Table 5, the D-R model fits the adsorption data of gas in medium-rank coal sample conditions well, and the average fitting error is within 1%. The values of the fitted parameters are mainly affected by the volume determination error, coal sample density determination error, gas permeability difference, adsorption phase density error, and coal sample volume change, etc. [44]. Experiments using strain gauges in conjunction with optical methods to study the swelling of coals have shown that coals swell with the adsorption of carbon dioxide (CO2), gas (CH4), and other gases [50]. The swelling phenomenon is the result of the superposition of two opposing effects: the volume expansion of the coal matrix due to gas adsorption, and the compression of the matrix while the pore pressure rises [51]. The degree of expansion is mainly affected by the physical properties of the coal and the external temperature and pressure, and the physical properties of different coals are different. In the study of the gas adsorption characteristics, the volumetric expansion of the coal is more worthy of being emphasized than other factors. Pan et al. [52] believe that the coal will expand with the increase in pressure and the maximum value is achieved when the adsorption pressure is about 15 MPa. For sample LL, the k value is larger, which may be related to its physical properties. According to the above study, under certain pressure conditions, the coal swells and the pore structure changes, which affects its adsorption capacity. The introduction of the fitting parameter k can well correct this phenomenon. However, the causes of this phenomenon are more complicated, and a more in-depth study is needed to clarify the complete mechanism of its influence. Due to the limitation of the experimental conditions, this study will not be repeated.

4.3. Factors Affecting Gas Adsorption

4.3.1. Effect of Coal Composition on Gas Adsorption

Figure 9 shows a positive correlation between the maximum adsorption and the maximum vitrinite reflectance, the content of the vitrinite, and the fixed carbon content, as shown in Figure 9a, Figure 9b, and Figure 9g, respectively, and a negative correlation with the content of the inertinite, the content of the minerals, the content of the ash, and the content of the volatiles (Figure 9c–f). When Ro,max is 1.3–2.5, the coal is in between the second and third coaling leaps, affected by the coal metamorphism, almost all the oxygen-containing functional groups are shed, the coal’s aromatic rings are gradually enlarged, and the arrangement is gradually orderly. The coal has increased microporosity and a significantly increased specific surface area [53], and the coal adsorption capacity is enhanced. The four coal samples, as shown in Figure 10, mainly consisted of the vitrinite and the inertinite, containing some clay minerals and pyrite. The vitrinite mainly consisted of unstructured vitrinite and the inertinite, where the pores of unstructured vitrinite are more developed, which is favorable for adsorption; meanwhile, the inertinite mostly consists of detrital inertinite, where the pores of detrital inertinite are not developed, the adsorption capacity is weak, the existence of detrital inertinite is unfavorable to the adsorption, it contains a small amount of fusinoid, and the structure of the plant cell is developed in the fusinoid, which has a strong adsorption capacity, but the content is very small and is not influential for adsorption [54]. The reasons are as follows: Gas adsorption on mineral surfaces is limited, that gas adsorption in coals occurs mainly on organic matter surfaces, and the high mineral content reduces gas adsorption [55]. The presence of minerals blocks the seepage channels, fills some of the micropores, and reduces the pore volume and specific surface area [56]. This agrees with the present experimental data. The above studies show that the coal rank, maceral composition, mineral, ash, and volatile content all affect the maximum adsorption capacity, mainly by changing the pore characteristics. Therefore, the degree of coal pore development is the main controlling factor of the coal adsorption capacity, and the relationship between the degree of coal pore development and the adsorption capacity can be studied to better reveal the adsorption mechanism of coal.

4.3.2. Effect of Pore Characteristics on Gas Adsorption

The relationship between the maximum adsorption volume and each pore parameter, respectively, is shown in Figure 11. According to the data analyzed in Figure 11, the maximum adsorption volume is poorly correlated with the total pore volume and the seepage pore volume, the maximum adsorption volume has a certain correlation with the coalescence–adsorption pore volume, and the maximum adsorption volume correlates well with the absorption pore volume, adsorption pore volume, and the surface area, which are positively correlated. In order to investigate the effect of the specific surface area and pore volume of different pore diameters on the adsorption amount at different equilibrium pressure points, 1.6 MPa, 2.6 MPa, 3.6 MPa, 4.6 MPa, 5.6 MPa, 6.6 MPa, 7.6 MPa, 8.6 MPa, 9.6 MPa, and 10.6 MPa, respectively, were selected according to the highest pressure value in accordance with the equidistant selection method. In addition, 11.6 MPa, 11 pressure points, the correlation between the specific surface area of the samples, the pore volume of different pore diameters, and the adsorption capacity were investigated, as shown in Figure 12.
As shown in Figure 12, the correlation between the specific surface area and adsorption amount decreased and stabilized with the increasing pressure. The high correlation at a low pressure indicates that the adsorption mainly occured on the pore surface of the coal body, mostly in a single layer. For the absorption pore (<2 nm), the correlation between the volume and adsorption amount increased when the pressure increased. When the adsorption pressure was low, the correlation between the adsorption volume and absorption pore volume was poor, and monolayer adsorption mainly occurred on the surface of the coal pores; when the adsorption pressure increased, the correlation increased, indicating that the gas basically completes the monolayer adsorption, and the mode of adsorption is changed from monolayer adsorption on the surface to volume filling, which preferentially fills the absorption pore space. When the pressure is greater than 9.6 MPa, the correlation between the volume of absorbing pores and the adsorbed amount decreases again, and the filling of absorbing pores is basically completed at this time. For the adsorption pores (2–10 nm), the correlation between the volume and adsorption amount gradually becomes lower when the pressure increases, and then there is a tendency to gradually increase. In the low-pressure section, the correlation between the adsorption pore volume and the specific surface area of the coal is good, as shown in Figure 12, it is consistent with the correlation between the surface area and the adsorption amount, and the gas adsorption mainly occurs in a single layer in the pores of the coal. When the adsorption pressure increases, the correlation between the adsorption amount and the adsorption pore volume gradually decreases, the correlation with the absorption pore volume gradually increases, and the correlation between the adsorption amount and absorption pore volume is better than that with the adsorption pore volume, which indicates that gas has basically completed the adsorption of the monolayer on the surface of the coal, and the pore filling effect is enhanced as it preferentially fills up the absorption pore space. When the adsorption pressure is greater than 10.6 MPa, the correlation between the adsorption volume and absorption pore volume decreases, and the correlation between the adsorption volume and adsorption pore volume increases, which indicates that gas has basically completed the filling of the absorption pore, and the filling of the adsorption pore starts to play a dominant role.
The correlation between the adsorption volume, the coalescence–adsorption pore volume, and the percolation pore volume is insignificant, although there is some correlation. The reason may be two aspects: on the one hand, according to the theory of adsorption potential, the adsorption potential decreases with the increase of the distance from the pore surface, and the adsorption will no longer produce adsorption up to a certain degree, so for a given pore volume, the effective adsorption space of the large pores is small [57]; on the other hand, gas adsorption in coal is constrained by a maximum pore size, and the maximum pore size is primarily determined by the adsorption temperature, and beyond the pore size, the gas will not be able to adsorb in the coal [18].

5. Conclusions

This study investigates medium-rank coals from the Qinshui Basin, China’s most productive CBM development region. With the help of a series of methods such as gas isothermal adsorption experiments, industrial analyses, microcosmic component analyses, and the characterization of the pore structure of the multiscale pore structure of CO2–liquid nitrogen–mercury intrusion, and based on the improved D-R equations, the adsorption quantity, adsorption parameters, and influencing factors of the medium-rank coal samples from the Qinshui Basin were analyzed. This work may provide critical insights into CBM storage mechanisms in medium-rank coals. However, further research on the impact of different coal compositions and pore structures on gas adsorption under varying reservoir conditions is required. Additionally, the development of more accurate models or experimental methods to better understand and predict gas adsorption behavior in coal seams is also needed. The main conclusions can be made as follows:
(1)
The full-scale pore structure characterization of coal through CO2–liquid nitrogen–mercury intrusion series experiments yielded that the pore volume of coal was dominated by the composition of seepage pores, and the specific surface area was dominated by the provision of absorption pores. And, the adsorption data of gas in the medium-rank sample conditions were well fitted by the improved D-R isothermal adsorption model, and the fitting errors were all within 1%.
(2)
The maximum adsorption capacity of coal samples was positively correlated with Ro,max, a specular group, and a fixed carbon content, negatively correlated with the content of an inert group, minerals, ash, and volatile matter, and the macroscopic coal characteristics controlled the adsorption capacity of coals mainly by controlling the degree of pore development.
(3)
The mode of gas adsorption in coal pores varies with pressure. Under the influence of the adsorption potential and the interaction force between gas molecules, gas adsorption occurs mainly in a single layer on the pore surface under low-pressure conditions; under high-pressure conditions, multilayer adsorption is enhanced and pore filling is increased. Due to the control effect of the adsorption potential on the adsorption process, the filling order of gas in pores of different scales is different. With the increase in pressure, gas molecules preferentially filled in the absorption pores, followed by adsorption pore filling.

Author Contributions

Conceptualization, Y.C.; Methodology, Y.H., S.H. and F.Q.; Software, S.H. and F.Q.; Validation, H.W. and B.L.; Resources, S.H. and F.Q.; Writing—original draft, Y.H.; Writing—review & editing, Y.H., H.W. and B.L.; Project administration, Y.C.; Funding acquisition, Y.C. All authors have read and agreed to the published version of the manuscript.

Funding

This research was funded by the National Key R&D Program of China (2024YFC2909400), the National Natural Science Foundation of China (grant nos. 42372195), the Scientific Research Innovation Capability Support Project for Young Faculty (Grant no.: ZYGXQNJSKYCXNLZCXM-E14), the Fundamental Research Funds for the Central Universities (grant no. 2652023001), and Key Science and Technology R&D Projects of Inner Mongolia Geology and Mineral Resources Group Co. (Grant no. DKZDYF-202510).

Data Availability Statement

The original contributions presented in this study are included in the article. Further inquiries can be directed to the corresponding author.

Conflicts of Interest

Author Shan He was employed by the company CBM Branch Company, Huabei Oilfield of PetroChina. Author Haipeng Wei was employed by the company SINOPEC. Author Bin Li was employed by the company Inner Mongolia Coal Geological Exploration (Group) 153 Co., Ltd. The remaining authors declare that the research was conducted in the absence of any commercial or financial relationships that could be construed as a potential conflict of interest.

References

  1. Cheng, W.; Hu, X.; Xie, J.; Zhao, Y. An intelligent gel designed to control the spontaneous combustion of coal: Fire prevention and extinguishing properties. Fuel 2017, 210, 826–835. [Google Scholar] [CrossRef]
  2. Hu, Z.; Hu, X.; Cheng, W.; Lu, W. Influence of synthetic conditions on the performance of melamine–phenol–formaldehyde resin microcapsules. High Perform. Polym. 2019, 31, 197–210. [Google Scholar] [CrossRef]
  3. Fan, T.; Zhou, G.; Wang, J. Preparation and characterization of a wetting-agglomeration-based hybrid coal dust suppressant. Process Saf. Environ. Prot. 2018, 113, 282–291. [Google Scholar] [CrossRef]
  4. Wen, Z.; Wang, X.; Tan, Y.; Zhang, H.; Huang, W.; Li, Q. A Study of Rockburst Hazard Evaluation Method in Coal Mine. Shock Vib. 2016, 16, 8740868. [Google Scholar] [CrossRef]
  5. Ye, J. China’s CBM exploration and production and associated technological advancements: A review and reflections. Coal Geol. Explor. 2025, 53, 114–127, (In Chinese with an English abstract). [Google Scholar]
  6. Zhang, Y.; Zhu, G.; Zheng, Q.; Zhang, X.; Hu, Q. Distribution characteristics of coalbed methane resources in China and recommendations for exploration research. Unconv. Oil Gas 2022, 9, 1–8, 45, (In Chinese with an English abstract). [Google Scholar]
  7. Zhou, D.; Chen, G.; Zhao, S.; Shen, B.; Liu, Z.; Ye, J.; Chen, X.; Zhang, J. Distribution Characteristics and Exploration and Development Prospects of Coalbed Methane Resources in Sinopec. Coal Sci. Technol. 2025, 53, 19–30, (In Chinese with an English abstract). [Google Scholar]
  8. Xu, H.; Tang, D.; Tao, S.; Li, S.; Tang, S.; Chen, S.; Zong, P.; Dong, Y. Differences in geological conditions of deep and shallow coalbed methane andtheir formation mechanisms. Coal Geol. Explor. 2024, 52, 33–39, (In Chinese with an English abstract). [Google Scholar]
  9. Xu, T.; Li, Z.; Nino, R.; Louk, A.K.; Wang, Z.; Song, D. Temperature-dependent diffusion process of methane through dry crushed coal. J. Nat. Gas Sci. Eng. 2015, 22, 609–617. [Google Scholar]
  10. Wang, Z.; Xu, T.; Yue, G.; Kang, B.; Xie, C.; Li, X. Physical simulation of temperature influence on gas sorption and kinetics in coal: Benefits of temperature under 273.15 K. Fuel 2015, 158, 207–216. [Google Scholar] [CrossRef]
  11. Busch, A.; Gensterblum, Y. CBM and CO2-ECBM related sorption processes in coal: A review. Int. J. Coal Geol. 2011, 87, 49–71. [Google Scholar] [CrossRef]
  12. Zheng, Y.; Li, Q.; Yuan, C.; Tao, Q. Thermodynamic analysis of high-pressure gas adsorption on coal-based activated carbon. Fuel 2018, 230, 172–184. [Google Scholar] [CrossRef]
  13. Wang, Z.; Xu, T. New insights from supercritical methane adsorption in coal: Gas resource estimation, thermodynamics, and engineering application. Energy Fuels 2018, 32, 5001–5009. [Google Scholar] [CrossRef]
  14. Bae, J.S.; Bhatia, S.K. High-pressure adsorption of methane and carbon dioxide on coal. Energy Fuels 2006, 20, 2599–2607. [Google Scholar] [CrossRef]
  15. Okolo, G.N.; Everson, R.C.; Neomagus, H.W.; Sakurovs, R.; Grigore, M.; Bunt, J.R. The carbon dioxide, methane and nitrogen high-pressure sorption properties of South African bituminous coals. Int. J. Coal Geol. 2019, 209, 40–53. [Google Scholar] [CrossRef]
  16. Sang, S.; Zhu, Y.; Zhang, J.; Zhang, X.; Tang, J. Soild-Gas interaction mechanism of Coal-adsorbed Gas(II)—Physical process and theoretical model of Coal-adsored Gas. Nat. Gas Ind. 2005, 25, 16–18+21, (In Chinese with an English abstract). [Google Scholar]
  17. Crosdale, P.J.; Beamish, B.B.; Valix, M. Coalbed gas sorption related to coal composition. Int. J. Coal Geol. 1998, 35, 147–158. [Google Scholar] [CrossRef]
  18. Stuart, D.; Richard, S.; Steve, W. Supercritical gas sorption on moist coals. Int. J. Coal Geol. 2008, 74, 203–214. [Google Scholar]
  19. Han, S.; Sang, S.; Liang, J. High pressure gas adsorption of medium and high-rank coal in southern Qinshui basin. Coal Geol. Explor. 2018, 46, 13–25. [Google Scholar]
  20. Wang, C.; Li, S. Pore structure characteristics of low-rank coal and theirinfluence on gas adsorption. China Saf. Sci. J. 2015, 25, 133–138, (In Chinese with an English abstract). [Google Scholar]
  21. Monsalvo, M.A.; Shapiro, A.A. Study of high-pressure adsorption from supercritical fluids by the potential theory. Fluid Phase Equilibria 2009, 283, 56–64. [Google Scholar] [CrossRef]
  22. Monsalvo, M.A.; Shapiro, A.A. Modeling adsorption of binary and ternary mixtures on microporous media. Fluid Phase Equilibria 2007, 254, 91–100. [Google Scholar] [CrossRef]
  23. Dundar, E.; Zacharia, R.; Chhine, R.; Benard, P. Modified potential theory for modeling supercritical gas adsorption. Int. J. Hydrogen Energy 2012, 37, 9137–9147. [Google Scholar] [CrossRef]
  24. Sang, S.; Zhu, Y.; Zhang, S.; Zhang, J.; Tang, J. Soild-Gas interaction mechanism of Coal-adsorbed Gas(I)―Coal pore structure and Solid-Gas interaction. Nat. Gas Ind. 2005, 1, 13–15, (In Chinese with an English abstract). [Google Scholar]
  25. Tunio, S.Q.; Ismail, M.S. Effect of coal rank and porosity on the optimization of ECBM recovery. Asian J. Appl. Sci. 2014, 7, 158–168. [Google Scholar] [CrossRef]
  26. Keshavarz, A.; Sakurovs, R.; Grigore, M.; Sayyafzadeh, M. Effect of maceral composition and coal rank on gas diffusion in Australian coals. Int. J. Coal Geol. 2017, 173, 65–75. [Google Scholar] [CrossRef]
  27. Xu, F.; Xiao, Z.; Chen, D.; Yan, X.; Wu, N.; Li, X.; Miao, Y. Current status and development direction of coalbed methane exploration technology in China. Coal Sci. Technol. 2019, 47, 205–215, (In Chinese with an English abstract). [Google Scholar]
  28. GB/T 6948-2008; Method of Determining Microscopically the Reflectance of Vitrinite in Coal. Standards Press of China: Beijing, China, 2008.
  29. GB/T8899-2013; Determination of Maceral Group Composition and Minerals in Coal. Standards Press of China: Beijing, China, 2013.
  30. GB/T212-2008; Proximate Analysis of Coal. Standards Press of China: Beijing, China, 2008.
  31. GB/T19560-2008; Experimental Method of High-Pressure Isothermal Adsorption to Coal. Standards Press of China: Beijing, China, 2008.
  32. Stephen, B.; Emmett, P.H.; Teller, E. Adsorption of gases in multimolecular layers. J. Am. Chem. Soc. 1938, 60, 309–319. [Google Scholar]
  33. Barrett, E.P.; Joyner, L.G.; Halenda, P.P. The determination of pore volume and area distributions in porous substances. I. Computations from nitrogen isotherms. J. Am. Chem. Soc. 1951, 73, 373–380. [Google Scholar] [CrossRef]
  34. Clarkson, C.R.; Wood, J.M.; Burgis, S.E.; Aquino, S.D.; Freeman, M. Nanopore-Structure Analysis and Permeability Predictions for a Tight Gas Siltstone Reservoir by Use of Low-Pressure Adsorption and Mercury-Intrusion Techniques. SPE Reserv. Eval. Eng. 2012, 15, 648–661. [Google Scholar] [CrossRef]
  35. Gan, H.; Nandi, S.P.; Walker, P.L., Jr. Nature of the porosity in American coals. Fuel 1972, 5, 272–277. [Google Scholar] [CrossRef]
  36. Walker, P.L., Jr.; Verma, S.K.; Rivera-Utrilla, J.; Davis, A. Densities, porosities and surface areas of coal macerals as measured by their interaction with gases, vapours and liquids. Fuel 1988, 67, 1615–1623. [Google Scholar] [CrossRef]
  37. Sing, K.S.W.; Everett, D.H.; Haul, R.A.W.; Moscou, L.; Pierotti, R.A.; Rouquerol, J.; Siemieniewska, T. Reporting physisorption data for gas/solid systems with special reference to the determination of surface area and porosity. Pure Appl. Chem. 1985, 57, 603–619. [Google Scholar] [CrossRef]
  38. Thommes, M.; Kaneko, K.; Neimark, A.V.; Olivier, J.P.; Rodriguez-Reinoso, F.; Rouquerol, J.; Sing, K.S.W. Physisorption of gases, with special reference to the evaluation of surface area and pore size distribution (IUPAC Technical Report). Pure Appl. Chem. 2015, 87, 1051–1069. [Google Scholar] [CrossRef]
  39. Fu, X.; Qin, Y.; Zhang, W.; Wei, C.; Zhou, R. Study on fractal classification and natural classification of coal pores based on coalbed methane transportation. Sci. Bull. 2005, 50, 51–55. [Google Scholar] [CrossRef]
  40. Cai, Y.; Liu, D.; Pan, Z.; Yao, Y.; Li, J.; Qiu, Y. Pore structure and its impact on CH4 adsorption capacity and flow capability of bituminous and subbituminous coals from Northeast China. Fuel 2013, 103, 258–268. [Google Scholar] [CrossRef]
  41. Chen, P.; Tang, X. The research on the adsorption of nitrogen in low temperature and micro-pore properties in coal. J. China Coal Soc. 2001, 26, 552–556. [Google Scholar]
  42. Yang, Z.; Qin, Y.; Gao, D.; Chen, R. Differences between apparent and true adsorption quantity of coalbed methane under supercritical conditions and their geological significance. Nat. Gas Ind. 2011, 31, 13–16. [Google Scholar]
  43. Sircar, S. Gibbsian Surface excess for gas adsorption revisited. Ind. Eng. Chem. Res. 1999, 38, 3670–3682. [Google Scholar] [CrossRef]
  44. Sakurovs, R.; Day, S.; Weir, S.; Duffy, G. Application of a modified Dubinin-Radushkevich equation to adsorption of gases by coals under supercritical conditions. Energy Fuels 2007, 21, 992–997. [Google Scholar] [CrossRef]
  45. Wang, K.; Qiao, P.; Wang, Z.; Liu, X.; Li, Y. Multiple scale pore size characterization of coal based on carbon dioxide and liquid nitrogen adsorption, high-pressure mercury intrusion and low field nuclear magnetic resonance. China Min. Mag. 2017, 26, 146–152. [Google Scholar]
  46. Huo, Z.; Xi, Z.; Guo, J.; Wang, D. Pore characteristics of tectonic coal based on nitrogen adsorption and SEM. Coal Eng. 2024, 56, 149–156, (In Chinese with an English abstract). [Google Scholar]
  47. Wang, R.; Feng, H. Applicability of mercury intrusion method and nitrogen adsorption method in characterizingpore structure of high-rank coal. Oil Drill. Prod. Technol. 2024, 46, 112–118, (In Chinese with an English abstract). [Google Scholar]
  48. Li, N.; Liu, H.; Sang, S. Comparative study on pore size distribution in coal based on mercury intrusion-low temperature liquid nitrogen combined pore and nuclear magnetic resonance analysis. Saf. Coal Mines 2024, 55, 1–9, (In Chinese with an English abstract). [Google Scholar]
  49. Li, Y.; Zhang, Y.; Zhang, L.; Hou, J. Characterization on pore structure of tectonic coals based on the method of mercury intrusion, carbon dioxide adsorption and nitrogen adsorption. J. China Coal Soc. 2019, 44, 1188–1196, (In Chinese with an English abstract). [Google Scholar]
  50. Levine, J.R. Model Study of the Influence of Matrix Shrinkage on Absolute Permeability of Coal Bed Reservoirs; Geological Society Special Publication: London, UK, 1996; Volume 109, pp. 197–212. [Google Scholar]
  51. Robertson, E.P.; Christiansen, R.L. Modeling laboratory permeability in coal using sorption-induced-strain. SPE Reserv. Eval. Eng. 2007, 10, 260–269. [Google Scholar] [CrossRef]
  52. Pan, Z.; Connell, L.D. A theoretical model for gas adsorption-induced coal swelling. Int. J. Coal Geol. 2007, 69, 243–252. [Google Scholar] [CrossRef]
  53. Su, X.; Zhang, L.; Lin, X. Influence of Coal rank on Coal adsorption capacity. Nat. Gas Ind. 2005, 25, 19–21. [Google Scholar]
  54. Li, Z.; Yao, Y.; Zhou, H.; Bai, X. Study on Coal and Rock Maceral Composition Affected to Methane Adsorption Capacity. Coal Sci. Technol. 2012, 40, 125–128, (In Chinese with an English abstract). [Google Scholar]
  55. Perera, M.S.A.; Ranjith, P.G.; Choi, S.K.; Airey, D.; Weniger, P. Estimation of gas adsorption capacity in coal: A Review and an analytical study. Int. J. Coal Prep. Util. 2012, 32, 25–55. [Google Scholar] [CrossRef]
  56. Yao, Y.; Liu, D. Adsorption Characteristics of Coal Reservoirs in North China and lts Influencing Factors. J. China Univ. Min. Technol. 2007, 36, 308–314, (In Chinese with an English abstract). [Google Scholar]
  57. Polanyi, M. The Potential Theory of Adsorption: Authority in science has its uses and its dangers. Science 1963, 141, 1010–1013. [Google Scholar] [CrossRef] [PubMed]
Figure 1. Schematic of experimental coal sample, instrument and equipment, and isothermal adsorption experiment. ((a) Experimental coal sample diagram; (b) Diagram of experimental instruments and equipment; (c) Experimental setup for CH4 adsorption and diffusion).
Processes 13 01862 g001
Figure 2. Isothermal adsorption curves of gas from different coal samples.
Processes 13 01862 g002
Figure 3. Comparison of pore volume fractions of coal samples from the combined CO2–liquid nitrogen–mercury pressure experiment for sample DQ.
Processes 13 01862 g003
Figure 4. Characteristics of low-temperature liquid nitrogen adsorption–desorption curve of low-rank coal samples. ((a). Sample LL; (b). Sample ML; (c). Sample TL; (d). Sample DQ).
Processes 13 01862 g004
Figure 5. Relationship between excess gas adsorption capacity and true gas adsorption capacity. ((a): Sample LL; (b): Sample ML; (c): Sample TL; (d): Sample DQ).
Processes 13 01862 g005
Figure 6. Variation curve of pore specific surface area and volume with average pore diameter of medium-rank coal samples. ((a): Sample LL; (b): Sample ML; (c): Sample TL; (d): Sample DQ).
Processes 13 01862 g006
Figure 7. Pore volume, specific surface area, and relative proportions at different scales of experimental coal. (a) Pore volumes and relative proportions at different scales of experimental coal. (b) Pore specific surface area and relative proportions at different scales of experimental coal.
Processes 13 01862 g007
Figure 8. Fitting curve of gas excess adsorption capacity based on improved D-R model.
Processes 13 01862 g008
Figure 9. Relationships between the vitrinite reflectance, maceral composition and mineral, and the maximum adsorption of coals.
Processes 13 01862 g009
Figure 10. Microscopic characteristics of coal macerals. ((a): Sample LL; (b): sample TL; (c): sample ML; (d): sample DQ). Note: DC: desmocolinite; F: fusinite; ID: detrital inertinite; Cl: clay minerals; Sf: semifusinite; Py: pyrite.
Processes 13 01862 g010
Figure 11. Relationship between maximum adsorption capacity and pore parameters, where volume (cm3/g) is the vertical coordinate of absorption pore, adsorption pore, cohesion adsorption pore, percolation pore, and total pore, specific surface area (m2/g) is the vertical coordinate of specific surface area, and adsorption volume (cm3/g) is the maximum adsorption volume starved vertical coordinate.
Processes 13 01862 g011
Figure 12. Correlation results of adsorption capacity, year-on-year surface area, and pore volume with different pore diameters under different equilibrium pressures, where the volume correlation between gas adsorption in coal at different adsorption pressures and the volume of coalescence–adsorption pores and seepage pores is not obvious at 0–12 MPa; R2 is derived from Excel fitting curves to characterize the relationship between factors such as specific surface area and adsorption amount.
Processes 13 01862 g012
Table 1. Coal sample collection information.
SampleSample LocationBurial DepthCoal Seam
LLLiulin Mine, Liulin600–800 mmainly mining
No.4 coal seams
TLTunlan Mine, Gujiaoabout 400–500 mmainly mining
No.2/3 coal seams
MLMalan Mine, Gujiaoabout 700–800 mmining
No.2/8 coal seams
DQDongqu Mine, Gujiaomore than 800 mmainly mining
No.8 coal seams
Table 2. Maceral and mineral composition and proximate analysis of coal.
SampleRo,max (%)Maceral and Mineral (%)Proximate Analysis (%)
VitriniteInertiniteExiniteMineralMadAdVdafFCad
LL1.40 76.1412.0911.776.210.31 21.42 16.85 61.42
TL1.93 74.548.92 16.5416.540.23 29.76 12.57 56.44
ML1.28 84.666.209.147.360.40 22.04 14.22 63.34
DQ1.89 91.833.854.325.130.33 18.65 7.30 73.72
Note: Mad is the moisture content on air-dried basis, Ad is the ash content on air-dried basis, Vdaf is the volatile matter content on air-dried basis and FCad is the fixed carbon on air-dried basis.
Table 3. Pore volume of coals from CO2, liquid nitrogen, and mercury intrusion.
LCLNLN and MIFull-Scale Pore Structure
SampleAbsorption pore (10−3 cm3/g)Adsorption pore (10−3 cm3/g)Coalescence–adsorption pore (10−3 cm3/g)Seepage pore (10−3 cm3/g)Total pore volume (10−3 cm3/g)
LL0.070.120.309.439.92
DQ0.160.990.502.043.69
ML0.130.220.2618.6919.30
TL0.100.130.5310.7511.51
Note: LC: Low-temperature carbon dioxide experiments; LN: Liquid nitrogen experiments; MI: Mercury intrusion experiments. The pore sizes measured by low-temperature liquid nitrogen adsorption range from 1.7 to 300 nm, and the percolating pore volumes were calculated by combining low-temperature liquid nitrogen adsorption data and experimental data of mercury pressure.
Table 4. Pore specific surface area distribution of coals in CO2, liquid nitrogen, and mercury intrusion experiment.
LCLNFull-Scale Pore Structure
SampleAbsorption pore surface area (m2/g)Adsorption Pore specific surface area
(m2/g)
Coalescence–adsorption specific surface area (m2/g)Liquid nitrogen specific surface area (m2/g)Pore total specific surface Area (m2/g)
LL53.970.310.040.3554.32
DQ69.320.990.061.0570.37
ML79.910.760.020.7880.69
TL110.620.610.010.62111.24
Note: LC: Low-temperature carbon dioxide experiments; LN: Liquid nitrogen experiments. Mercury intrusion experiments cannot be more accurate characterization of the specific surface area, the specific surface area of seepage holes is not analyzed, the table of liquid nitrogen specific surface area = absorption pore specific surface area + coalescence–adsorption specific surface area, and the total specific surface area = absorption pore specific surface area + adsorption pore specific surface area + cohesion—adsorption pore specific surface area.
Table 5. Fitting results of improved D-R model parameters.
Sample Numbern0 (cm3/g)DkR2
TL29.195 0.094 0.032 0.997
DQ36.435 0.085 0.030 0.999
LL26.461 0.100 0.053 0.996
ML32.622 0.099 0.032 0.995
Note: n0 is the maximum adsorption volume, D is a constant reflecting the gas–coal interaction relationship, K is the adsorption volume error correction factor, and R2 is the coefficient of correlation between the other three.
Disclaimer/Publisher’s Note: The statements, opinions and data contained in all publications are solely those of the individual author(s) and contributor(s) and not of MDPI and/or the editor(s). MDPI and/or the editor(s) disclaim responsibility for any injury to people or property resulting from any ideas, methods, instructions or products referred to in the content.

