Article

Research on a Sand-Carrying Model of Horizontal Sections of Deep Coalbed Methane Wells

1
Linfen Branch of PetroChina Coalbed Methane Co., Ltd., Linfen 041000, China
2
Research Institute of Production Engineering and Technology, Tuha Oilfield Branch Company, Hami 701165, China
*
Author to whom correspondence should be addressed.
Processes 2025, 13(6), 1810; https://doi.org/10.3390/pr13061810
Submission received: 5 May 2025 / Revised: 4 June 2025 / Accepted: 5 June 2025 / Published: 6 June 2025
(This article belongs to the Section Energy Systems)

Abstract

Deep coalbed methane wells often encounter challenges such as inefficient sand transport and sand accumulation in the horizontal sections during drainage, which significantly impact the stability of gas production and the efficiency of the gas lift system. To investigate the sand-carrying mechanisms in the horizontal sections of deep coalbed methane wells, this study develops a theoretical model for critical sand-carrying velocity based on gravitational, buoyant, drag, and pressure gradient forces. Additionally, a visualized experimental system was constructed using a multiphase pipe flow platform. By varying parameters such as liquid flow rate, gas–liquid ratio, gravel particle size, and pipe inclination, the critical conditions for sand transport were examined, and the dominant factors influencing sand transport in horizontal wellbore sections were identified. The experimental results indicate that water flow rate and particle size are inversely correlated with the gas volume required for sand transport, whereas inclination angle is positively correlated. The proposed model was validated against experimental data, showing a prediction error within 15%, thereby confirming its accuracy and engineering applicability. These findings offer theoretical guidance and technical references for efficient drainage and stable gas production in horizontal wellbore sections of deep coalbed methane wells.

1. Introduction

Coalbed methane (CBM) is a major unconventional natural gas resource characterized by its cleanliness, efficiency, and non-renewability [1]. As conventional energy resources decline and “dual carbon” goals advance, CBM has attracted increasing attention due to its high efficiency and low environmental impact [2,3]. The exploitation of deep CBM reservoirs often results in complex gas–liquid–solid three-phase flows within the wellbore. These consist of flowback fluids and formation water in the liquid phase, CBM in the gas phase, and coal fines in the solid phase. The coal fines are primarily generated by coal rock fragmentation due to fracturing, flowback, or gas-drive processes [4]. Deep CBM formations differ from shallow wells by exhibiting higher reservoir pressures, more rigid coal matrices, and more complex in situ stress environments. These factors intensify coal fragmentation and substantially increase coal fines generation during production. The generated fines are transported by gas–liquid two-phase flow into the wellbore, where they accumulate in tubing, pumps, nozzles, and other components, resulting in flow path blockages. Such deposition causes serious engineering issues, including wellbore collapse, bottom-hole sand buildup, and irregular production fluctuations. These consequences can reduce productivity, shorten operational lifespan, or even lead to well abandonment [5,6,7]. Therefore, understanding the transport mechanisms of coal fines in deep CBM wellbores is essential. This knowledge is vital for developing effective prevention and mitigation strategies.
To address these challenges, numerous domestic and international researchers have conducted both theoretical and experimental studies on gas–liquid sand transport mechanisms in wellbores. Among these, theoretical research—serving as the foundation—emerged earlier. Based on Duggan’s critical velocity concept, Turner introduced the droplet model in 1969, which aimed to predict liquid loading in gas wells. Turner assumed that entrained droplets were spherical and, by analyzing the acting forces, derived a critical velocity equation for liquid lifting in gas wells [8]. Liu Zhongliang et al. systematically analyzed the motion of single solid particles in upward laminar and turbulent flows, including cases involving phase-changing liquids, and developed corresponding predictive equations [9]. Subsequently, Li et al. conducted static settling experiments with sand particles in water and kerosene, selecting the most suitable formula for terminal settling velocity under realistic wellbore sand production conditions. They also introduced correction factors for particle shape irregularities and measured terminal settling velocities in dynamic flow conditions using sand-transport experiments. Based on wellbore flow simulations, a statistical correlation was established between particle settling velocity and average fluid velocity, which was then used to determine the critical velocity required to lift particles [10,11]. Additionally, Wang et al. conducted lab-scale simulation experiments and showed that fluid velocity is directly proportional to the diameter of entrained sand particles [12].
Wen et al. adopted a quasi-homogeneous approach by treating the solid phase as a pseudo-liquid. They modified a gas–liquid two-fluid model for gas–liquid–solid three-phase flow by introducing effective property parameters to represent the influence of the solid phase. However, the model exhibits inherent limitations, as it does not adequately capture the interphase coupling interactions during multiphase flow [13]. Mitra-Majumdar et al. proposed a three-fluid model in which solid particles were treated as a separate fluid phase with distinct flow characteristics. This approach modeled gas, liquid, and solid as interpenetrating continua. While this model better captures the intrinsic phase coupling than two-fluid models, it depends on empirical estimations of solid-phase viscosity. This leads to substantial fitting errors and overlooks the inherently dispersed nature of solid particles, limiting both the model’s accuracy and physical realism [14].
Wen et al. developed a two-fluid model to characterize the interactions between gas and liquid phases based on their flow behavior. They also analyzed the motion trajectories of solid particles in a Lagrangian framework, incorporating their influence on the gas and liquid phases within the two-fluid model. This led to the development of an Eulerian–Eulerian–Lagrangian (EEL) hybrid model. The model considers multiple influencing factors, offers a structured computational framework, and significantly enhances simulation accuracy and efficiency. As a result, it has been widely applied in oil and gas production and transport systems [15]. Zhou et al. investigated the critical sand production rate in gas wells by applying rock and fracture mechanics to analyze stress distributions within reservoir formations. Through mathematical derivation, they established a relationship between pore pressure and bottom-hole flowing pressure under rock failure conditions. By incorporating well-testing productivity formulas and characteristic curves, they derived critical sand production equations for both Darcy and non-Darcy flow regimes [16]. Li Gang et al. examined sand particle settling and lifting in gas flows by analyzing the forces acting on particles in vertical wellbores. They investigated factors influencing critical velocity and production rate, and derived predictive equations for critical sand-carrying velocity, which were validated against field production data [17]. Xue systematically studied the mechanical model, key influencing factors, and critical sand transport rate in gas wells, focusing on gas–sand two-phase seepage during reservoir development. The study emphasized that fluid-induced resistance is the dominant factor governing sand particle transport across varying Reynolds number regimes [18]. Lin et al. investigated critical parameters for sand entrapment in gas wells and calibrated their theoretical model using field production data, thereby establishing a predictive method for sand production in operating gas wells [19].
As theoretical frameworks have matured, researchers worldwide have increasingly validated and refined gas–liquid–sand transport theories in wellbores through both laboratory and field-scale experiments. Zhang et al. conducted sand-transport experiments using clean water and established correlations between settling velocity and fluid velocity for large particles in vertical wells [20]. Liu performed experiments using low-viscosity fluids to examine empirical correlations for settling velocity, suspension velocity, and critical sand-carrying velocity under both static and dynamic water conditions [21,22]. Wang et al. investigated the critical gas velocity and flow rate for sand transport in gas wells, refining the drag coefficient applied in critical velocity models. Their findings indicated that particle size, gas density, and particle shape have a significant effect on critical velocity [23]. Dong et al. conducted experimental simulations of gas–liquid–solid multiphase flow under varying water–gas ratios (WGRs) and sand concentrations to investigate flow behavior and sand-transport capacity. They observed that sand removal becomes increasingly difficult once water production begins, with gas flow rate and WGR serving as the dominant factors influencing flow behavior [24].
Dong et al. investigated the influence of wellbore inclination on sand transport capacity by conducting experiments at selected inclination angles. Their results showed that sand transport capacity was significantly higher in vertical wellbore sections than in inclined ones [25]. Zeng et al. performed a comprehensive investigation across the full range of wellbore inclinations—from horizontal to vertical—using a custom-designed sand transport simulation device. Comparative experiments under varying conditions revealed a quantitative relationship between sand-carrying velocity and wellbore inclination [26]. Deng et al. proposed a novel method for calculating the minimum sand-carrying velocity in geothermal wells based on laboratory experiments. Unlike conventional single-factor resistance correction methods, their dual-correction-factor approach accounted for both temperature–viscosity effects and sand concentration–mixture density relationships. This method achieved an average relative error below 5%, significantly enhancing prediction accuracy [27].
To investigate sand transport mechanisms and influencing factors in wellbores, researchers have conducted studies from various perspectives. Han et al. developed a sand transport model incorporating proppant collision, wall friction-induced plugging, fracturing fluid loss, and branching angles. The model provides a theoretical foundation for optimizing high-efficiency fracturing fluid parameters in coalbed methane (CBM) reservoir stimulation [28]. Li et al. performed molecular dynamics simulations to investigate sand transport behavior and mechanisms of water-based fracturing fluids in shale fractures. They clarified the thickening mechanism of modified cross-linkers and the sand-carrying behavior of the fluids at the molecular level [29]. Liu et al. developed a coupled simulation method combining computational fluid dynamics (CFD) and the discrete element method (DEM) and proposed a novel prediction approach for critical sand concentration based on stationary bed theory [30]. Wang et al. conducted laboratory experiments on transport characteristics, flow regime transitions, and critical flow rates for sand-laden fluids to enhance sand transport efficiency in the wellbore. Their work provides a scientific foundation for desanding process optimization and offers systematic insights and experimental support for future studies on complex wellbore transport mechanisms [31]. Han et al. also investigated the impact of viscous slickwater on sand transport capacity and found that the sand settling rate decreases as the elastic modulus of the fluid increases [32].
Numerous international researchers have extensively investigated sand transport and multiphase flow mechanisms in unconventional gas wells, especially in horizontal and deviated wellbore environments. Danielson, T. J. developed empirical correlations for liquid–solid transport using data from the SINTEF STRONG JIP, achieving strong agreement with observed sand bed heights and pressure drop measurements [33]. Galindo, T. conducted an in-depth analysis of high-viscosity friction reducers (HVFRs) in relation to sand transport and emphasized the need for standardized testing criteria that extend beyond viscosity alone. Continued testing and screening of HVFRs are expected to enhance understanding of key factors influencing sand transport [34]. Abou-Kassem, A. J. et al. integrated wellbore–reservoir simulations to design sand retention tests under flowback conditions in SAGD injection wells, providing a theoretical foundation for sand control strategies in gas production [35]. Varkas, M. et al. performed experimental studies on volumetric sanding under gas flow and found that sand heave delayed gas breakthrough. Specimens with greater capillary cohesion at water–oil or water–gas interfaces exhibited enhanced post-sanding stability, lower sand production rates, and retained larger rock fragments in the borehole. These fragments contributed to structural support due to higher intergranular cohesion. This phenomenon was found to prevent rapid specimen collapse, even under increasing applied stress [36]. Despite ongoing research efforts, the sand transport mechanisms in air–water–sand three-phase systems remain underexplored, and a unified theoretical framework for sand-carrying prediction is still lacking.
Therefore, a three-phase coupled mechanical model was developed to predict critical sand transport in the horizontal section of deep CBM wellbores, incorporating gravity, buoyancy, drag, and pressure differential forces. The gas–liquid–solid three-phase flow behavior in horizontal wellbore sections was examined using a large-scale, angle-adjustable visualization experimental platform. The effects of key parameters, including sand particle size, gas–liquid ratio, liquid flow rate, and pipe inclination, on critical sand transport conditions were systematically analyzed, and the model was validated against experimental data. The model demonstrated improved accuracy compared to traditional sand transport models and offers a theoretical foundation for optimizing sand transport in deep coalbed methane wells.

2. Theoretical Analysis

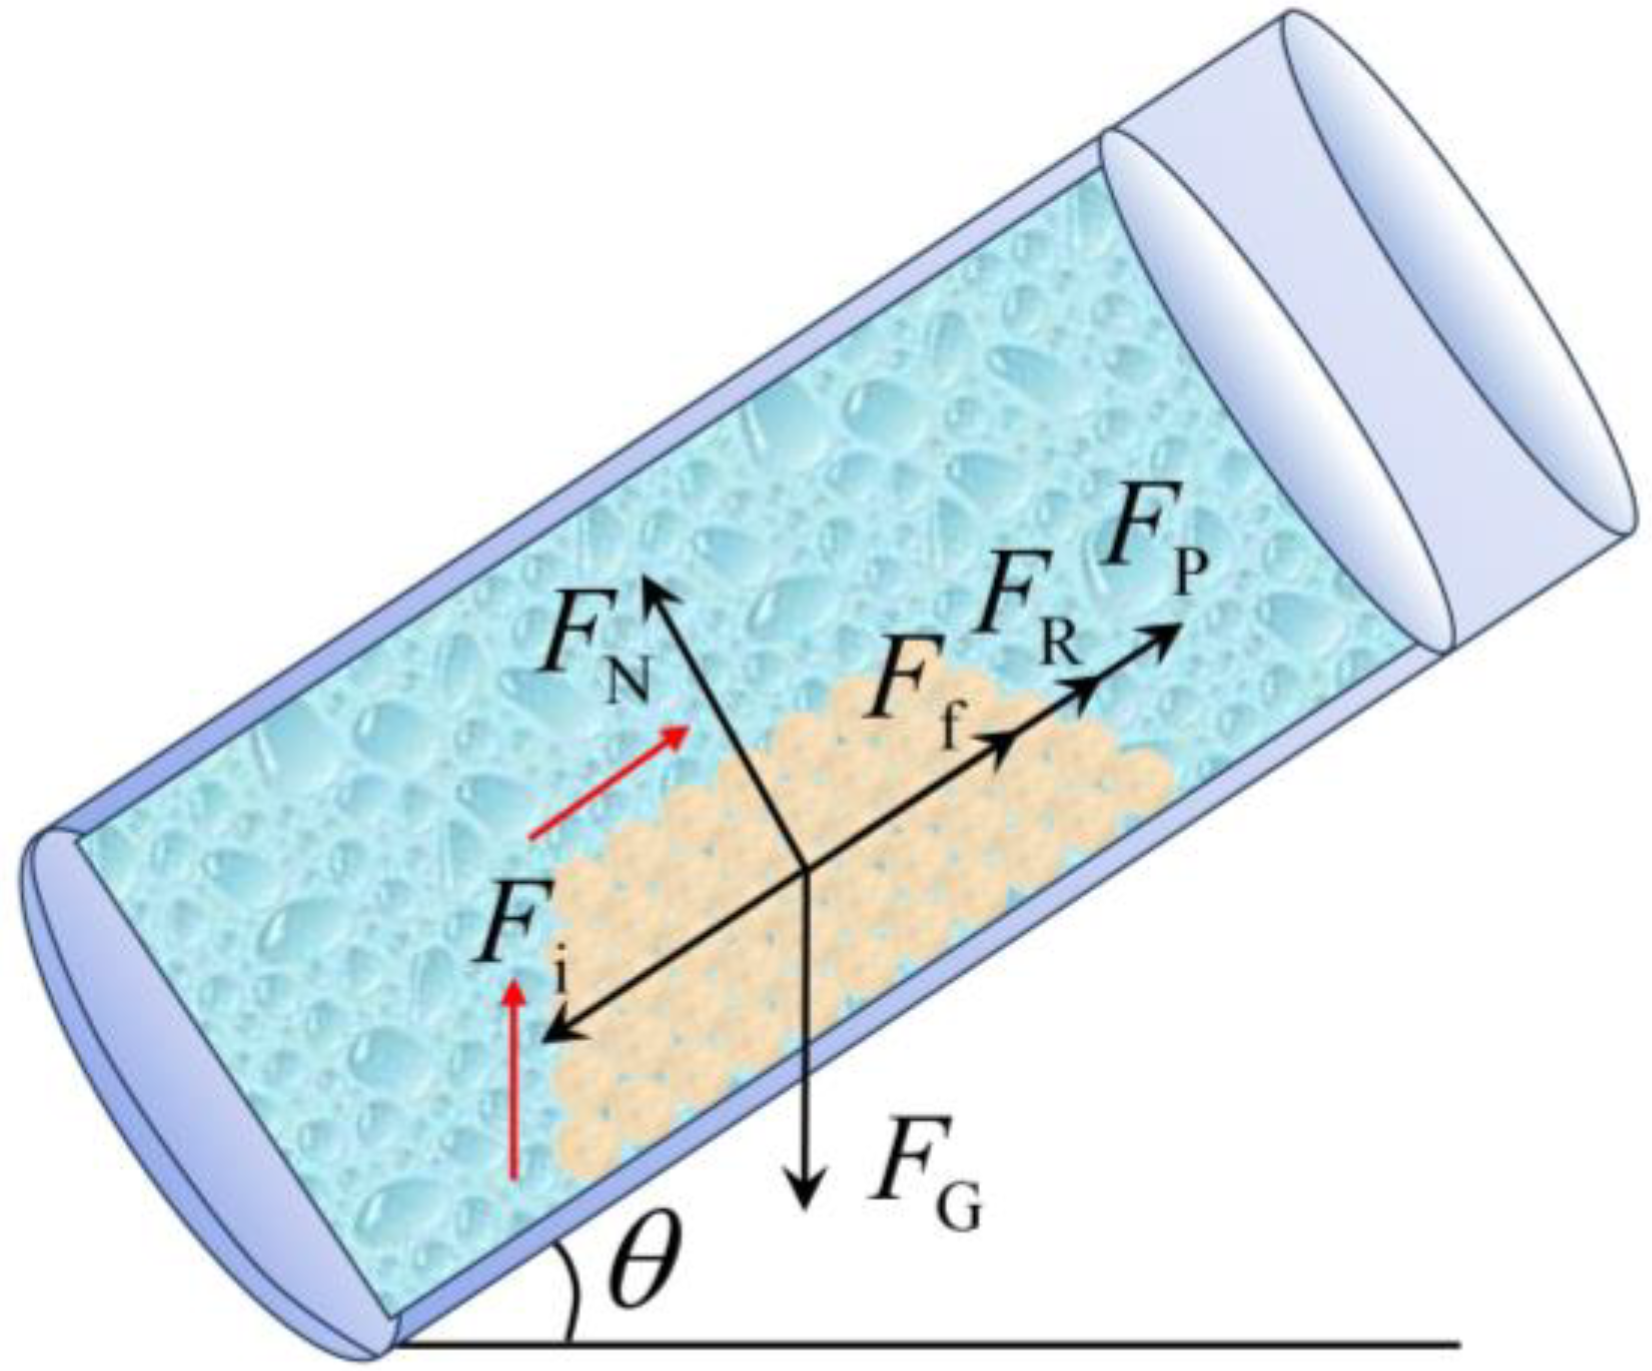
2.1. Sand Force Analysis

Conventional models typically neglect the effect of wellbore inclination and often fail to address gas–liquid–sand three-phase coupling scenarios, resulting in significant prediction errors and limited engineering applicability. In contrast, the model proposed herein is founded on the dynamic equilibrium principle of particle deposition and interfacial shear within an inclined wellbore. It incorporates a coupling correction factor suitable for predicting wellbore flow under multiphase, multifield coupling conditions. Sand is employed as a surrogate for coal fines to investigate the forces acting on individual particles. This choice is justified because coal dust particles are very small, have a lower density than sand, and are soluble in water, which causes liquid turbidity during experiments, thereby hindering observation of solid particle movement. Sand, having a higher density and being insoluble in water, was selected with a particle size of 0.25 mm to simulate the dispersion of coal fines. The primary forces acting on sand particles include added mass force, Basset force, buoyancy, gravity, surface force, Magnus force, Saffman lift force, and pressure gradient force [37]. In gas–liquid–sand three-phase flow studies, sand particles have diameters significantly smaller than that of the test pipe, and the volume of sand production is minimal. Therefore, the effects of the Basset, Magnus, and Saffman forces on particle motion are considered negligible, particularly since these forces are significant only under steady laminar gas flow conditions, which are absent in this study. Moreover, at the critical sand-carrying condition, the added mass force is assumed to be zero [38]. Consequently, the theoretical analysis of sand production in CBM wells primarily considers the following forces: body forces (gravity, inertia, and buoyancy); pressure differential forces resulting from pressure gradients within the wellbore; and surface forces, mainly drag force caused by fluid flow over the particle surface. A schematic illustrating the force analysis on a sand particle within the test pipe is presented in Figure 1.
The inclination angle of the test pipe is θ, with the upward direction considered positive and the downward direction negative. The sand particles are regarded as regular spheres. The calculation formula for gravity force is as follows:
F G = 1 6 π d 3 ρ s g
where d denotes the diameter of the sand particle, m; ρs denotes the density of the sand, kg/m3; g denotes the acceleration due to gravity, g = 9.8 kg/m2.
When the sand particle accelerates upward along the pipe, the inertial force acts downward along the pipe wall. When the sand particle is in a critical state, the forces on the sand particle are in equilibrium, and the inertial force is zero. The calculation formula for the inertial force Fi is as follows:
F i = 1 6 π d 3 ρ s d v s d p
where vs is the velocity of the sand particle, m/s; p is the inlet pressure, MPa.
The buoyancy force Ff acting on the sand particle in the pipe due to the gas–liquid two-phase flow can be calculated using the following formula:
F f = 1 6 π d 3 ρ f g
where ρ f represents the density of the gas–liquid mixture, kg/m3.
The differential pressure force arises due to pressure variations along the flow direction within the pipe. The expression for calculating the differential pressure force F p is given as follows:
F p = 1 6 π d 3 d p d x
where d p d x is the pressure gradient in the pipe, MPa/m.
The total pressure gradient comprises acceleration, gravity, and frictional differential pressure:
d p d x = d p d x a + d p d x G + d p d x F
Under critical conditions, the acceleration pressure drop is 0, its expression is shown as follows:
d p d x a = d d x ρ f v f 2
The gravity-induced differential pressure:
d p d x G = ρ f g
The frictional differential pressure:
d p d x F = 1 2 f ρ f v f 2 D
where f is the frictional resistance coefficient, dimensionless, which depends on the Reynolds number; D is the inner diameter of the pipe, m.
The drag force exerted on the sand particle surface by the flowing fluid is
F R = 1 8 π d 2 ρ f C D v f v s v f v s
where CD is the drag coefficient, which is dimensionless and depends on the Reynolds number of the flow field; vf is the velocity of the gas–liquid mixture, m/s.
In the study of gas–liquid–sand three-phase flow, sand particles are lifted out of the wellbore by the gas–liquid mixture. Under critical flow conditions, both the particle velocity and the inlet pressure remain stable, indicating that the inertial force is negligible, d v s d p = 0 . Moreover, compared to other forces, the effect of inertia on sand particle transport is minimal and can thus be reasonably ignored. Therefore, the net force acting on the particle along the direction of the pipe wall is expressed as
F = F f + F R + F P F G sin θ
According to Equation (6), during the production process of deep coalbed methane wells with water output, when F 0 , coal fines can be transported out of the wellbore, and the liquid phase is simultaneously carried along with it. When F = 0 , the sand particles are in a state of force equilibrium, the corresponding gas flow rate reaches the minimum threshold required to initiate sand-carrying, which is referred to as the critical sand-carrying capacity.

2.2. Establishment of the Critical Sand-Carrying Theoretical Model

During gas production, sand particles experience the combined action of multiple forces. Among these, hydrodynamic force, pressure differential force, buoyancy, and drag force exerted by the fluid on the particle surface act along the direction of fluid flow within the pipe, whereas the gravitational force acts vertically downward. When the net downward force along the pipe exceeds the upward force, the sand particle moves downward and cannot be transported upward. Conversely, if the upward force dominates, the sand particle accelerates and moves upward. Under critical conditions, the particle reaches force equilibrium, where the net force equals zero, causing the particle to remain suspended.
The gravitational force, buoyancy, pressure differential force, and drag force acting on the sand particles within the wellbore of a water-producing gas well predominantly determine their settling velocity. The motion equation governing the settling behavior of sand particles is given by
F f + F G sin θ + F R + F p = m s d v s d t
where m s is the mass of the sand particle, kg; t is time, s.
Substituting Equations (1), (3), (4) and (9) into Equation (11), we can obtain:
d v s d t = ρ f ρ s 1 g sin θ + 3 4 ρ f ρ s C D d v f v s v f v s + 1 ρ s d p d x
When the sand particle is in a critical state, its instantaneous acceleration is 0. At this time, the expression for the velocity of the mixed fluid v f is as follows:
v f = 4 d ρ s ρ f g sin θ d p d x 3 ρ f C D
Since the shape of sand particles in actual experiments is not a regular sphere, it is necessary to correct the drag coefficient in Equation (13) with a shape factor for irregular solid particles, introducing a correction factor ς . When calculating, the equivalent diameter of the sand particle d ave is used as the diameter of a regular spherical sand particle to calculate the terminal settling velocity of the sand particle, and then the actual free settling terminal velocity of sand particles of any shape under actual conditions is obtained through the correction factor:
v a = ς v ave
For sand particles of the same size, in a pipe with a diameter of D, the motion of the sand particles is restricted due to the wall effect, resulting in a settling terminal velocity that is lower than the free settling terminal velocity in an infinite medium. Therefore, an empirical correction factor ξ is proposed to correct the settling velocity of sand particles in the pipe. Multiplying this factor by the free settling velocity gives the actual settling terminal velocity of the sand particles in the confined space.
ξ = 1 d s D

3. Experimental System and Operating Conditions

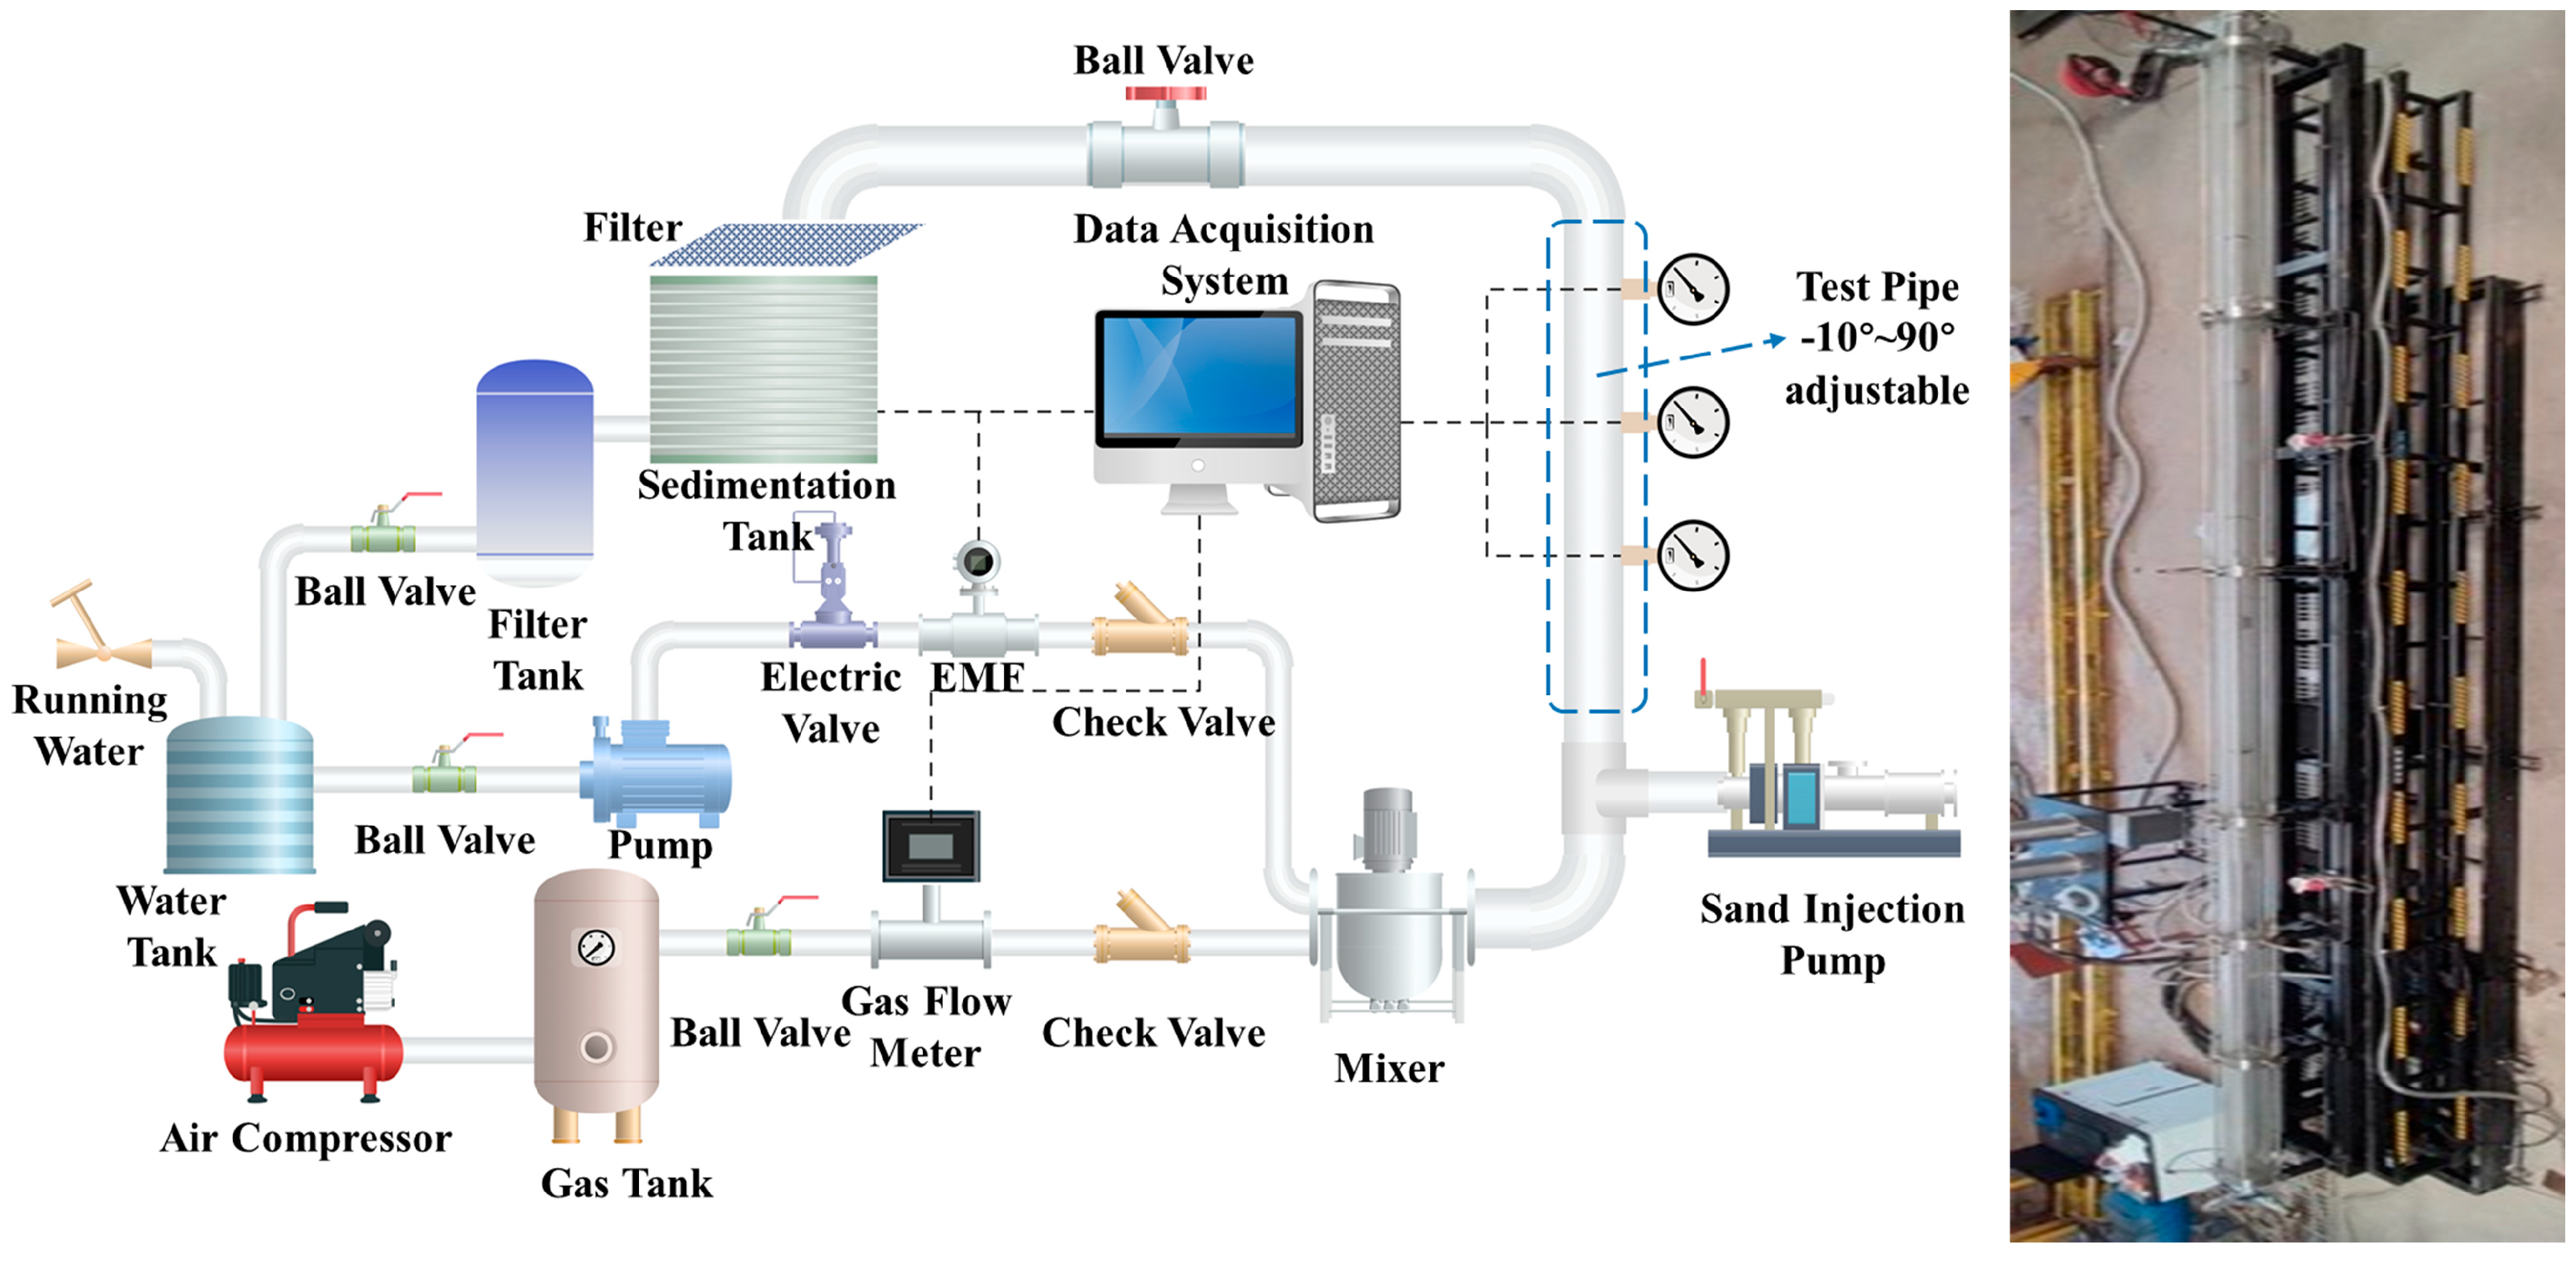
3.1. Experimental Loop

A large-scale multiphase pipe flow experimental platform was utilized to conduct gas–liquid–sand three-phase flow experiments. The experimental system is illustrated in Figure 2. The test bench measures 15,500 × 1300 × 1050 mm. The platform comprises four main components: a power supply unit, metering equipment, measurement instruments, and a data acquisition system. The power system includes a single-screw air compressor, a centrifugal water pump, and a sand injection pump. The air compressor provides compressed air to drive the experimental loop, simulating gas production in coalbed methane wells. The centrifugal pump draws water from a storage tank to simulate water production within the wellbore. The sand injection pump introduces sand into the test pipe through a sand inlet connector, simulating the generation and transport of coal fines within the wellbore. The metering system primarily consists of a gas flowmeter, electromagnetic flowmeter, differential pressure sensors, pressure sensors, and a high-speed camera. The upper and lower interfaces of the differential pressure sensors are positioned at 10.5 m and 3.8 m above the bottom of the experimental pipe, respectively. This arrangement effectively prevents frequent ingress and egress of gas–liquid phases in the test section caused by pressure fluctuations, thereby reducing measurement errors. The wellbore is simulated using a 13-m-long transparent acrylic pipe, facilitating direct observation of internal flow behavior and sand accumulation phenomena. Two test pipes with inner diameters of 40 mm and 120 mm were utilized. The inclination angle of the test pipe is adjustable from −10° to 90°. A high-speed camera is installed 7.5 m above the bottom of the test pipe to capture real-time changes in sand behavior. A PC-based data acquisition system continuously monitors and records gas–liquid flow rates and pressure variations, while capturing high-resolution images. The operating pressure range for the gas–liquid system is 0 to 0.8 MPa. The air compressor has a maximum discharge capacity of 1920 m3/d, and the maximum water flow rate is 144 m3/d.
During the experiments, the primary recorded parameters included sand-carrying flow states, sand-carrying capacity, pressure, and the various states of sand within the test pipe during gas–liquid–sand three-phase flow. The state of sand in the test pipe was rapidly captured using a combination of high-speed camera imaging and visual observation. Differential pressure sensors and pressure sensors were employed to monitor and record real-time pressure and pressure drop data. Additionally, the filter element at the top of the sedimentation tank was connected to the data acquisition system to collect sand mass data. This enabled quantitative assessment of sand-carrying capacity, simulating sand transport behavior in coalbed methane wellbores. The basic parameters of the instrumentation used in the experimental platform are summarized in Table 1.

3.2. Determination of the Experimental Scheme

Three types of quartz sand with a density of 2600 kg/m3 were used in the experiments. To investigate sand deposition at the wellbore bottom, a Malvern MS3000 Panalytical laser particle size analyzer was employed to measure the particle size distribution of the settled sand. After multiple test runs, the results are presented in Table 2. The measurements indicate that the sand particles fall into three mesh ranges: 10–20 mesh, 20–40 mesh, and 40–80 mesh, corresponding to particle diameters of approximately 1 mm, 0.5 mm, and 0.25 mm, respectively. Sand samples are shown in Figure 3.
Two test pipes with inner diameters of 40 mm and 120 mm were employed in this study. Since sand transport in the wellbore primarily depends on fluid velocity, and flow rate is linearly proportional to the pipe’s cross-sectional area, the sand-carrying flow behavior can be considered analogous between the two pipe sizes by applying a proportional conversion based on the square of the inner diameter. During experiments with the 120 mm pipe, water replenishment was necessary 5 to 10 min after the start of each run. Each replenishment lasted over 20 min and occurred frequently, significantly reducing experimental efficiency. Therefore, the 40 mm diameter pipe was selected for subsequent experiments.
To ensure the reliability of the experimental results, the proportional relationship between pipe diameters was verified before conducting the full-scale wellbore sand-carrying simulation experiments. Experiments were carried out with a test pipe inclination angle of 90°, using pipes with inner diameters of 40 mm and 120 mm, respectively. During the sand-carrying process, when vertical particle transport dominated and sand particles were effectively lifted and discharged, the system was considered to have reached the critical sand-carrying state. The critical flow patterns for both pipe diameters were observed and compared, as shown in Figure 4.
The results obtained from the 40 mm pipe were scaled proportionally to correspond to those of the 120 mm pipe and compared with the actual measurements from the 120 mm pipe experiments. As shown in Figure 5, the comparison demonstrates that the relative error between the scaled and measured results is less than 0.5%, validating the scaling approach. Consequently, all subsequent experiments were conducted using the 40 mm inner diameter test pipe.
The simulation object of this experiment is a deep coal gas well at the eastern edge of the Ordos Basin, which is endowed with multilayered low-permeability and high-gas coal strata, rich in coalbed methane (CBM) resources, and a typical dry-heat-type of gas reservoir. Typical well depth is 1800–2300 m. The coal beds have large burial depth and high stress, accompanied by the problems of water production and solid particles (coal debris/sand) transportation back. Core samples were obtained from two typical coal wells, and the mineral composition of the particles was tested by XRD before the experiment, which confirmed that quartz + immonium mixed layer + coal chip particles were dominant, with a density of about 2.25 g/cm3, and the distribution of particle sizes was dominated by 0.3–1.2 mm.
In this experiment, sand particle diameters were set to 0.25 mm, 0.5 mm, and 1 mm, with sand masses ranging from 200 g to 1000 g for each test. The pipe inclination angle varied between 0° and 60°, and the liquid flow rate was controlled within the range of 6 to 14 m3/d. For each combination of sand mass and pipe inclination, the water flow rate was first adjusted to a level at which the sand remained stationary. Subsequently, the gas injection rate was gradually increased to observe the initiation of sand-carrying. The critical gas flow rate was recorded when sand particles began to move.

3.3. Experimental Operation Conditions

The experimental procedure for investigating the sand-carrying behavior in gas–liquid–solid three-phase flow was conducted as follows: (1) Start the central control system of the multiphase flow experimental platform, verify that all instruments are reset to zero, ensure proper operation of all subsystems, and confirm sufficient supply of experimental media. Activate the air compressor and inject gas into the pipeline loop to purge the system, ensuring the sealing integrity of the test loop. (2) Adjust the pipeline inclination angle to 0°. Weigh a predetermined mass of quartz sand with a particle diameter of 0.25 mm according to the experimental setup. Inject the sand into the pipeline using the sand injection pump, and close the valve once all the sand has been loaded. (3) Open the liquid inlet valve and inject a specified amount of liquid based on experimental requirements. After the liquid flow stabilizes, gradually open the gas inlet valve according to the test plan. The critical gas flow rate at which the sand begins to move is recorded through a combination of high-speed camera footage and visual observation by the operator. (4) Record the flow pattern, pressure, pressure drop, and outlet sand mass within 60 s of the onset of sand-carrying. Export all experimental data via the central control console. (5) Repeat steps (3) and (4) for different liquid flow rates. (6) Adjust the pipe inclination angle and repeat the above procedure for each setting. (7) After completing tests for sand with the same particle size, increase the liquid and gas injection volumes to flush out residual materials in the pipeline, preparing for the next set of tests using a different sand particle size. (8) All experiments were conducted over multiple days, using the same equipment, operators, and procedures. Each working condition was repeated five times, and the results were averaged to ensure the accuracy and reliability of the experimental data.

4. Experimental Results and Discussion

4.1. Standard Deviation Analysis of Experimental Data

In order to ensure the accuracy of the experimental data for the subsequent analysis of the experimental results against the experimental data, it is mentioned in Section 3.3 that five repetitions of the same experiments were conducted at different times and the average value of the experimental results was calculated to ensure the accuracy of the results. The standard deviation (SD) and standard uncertainty (SE) were also calculated for each group of experimental data to analyze the uncertainty of the experimental data. The statistical calculation method was used for the calculation, and the calculation equation is shown as follows [39,40]:
S D = λ = 1 n Δ Q λ Δ Q ¯ 2 n 1
S E = S D n
where n is the number of repetitions of each set of experiments, Δ Q λ is the data obtained from the kth experiment, and Δ Q ¯ is the measurement mean.
The uncertainty of the experimental data for the measurement of the critical sand-carrying gas volume was analyzed by injecting different liquid flow rates into the pipe with an inclination angle of 20°, grain sizes of the three types of gravel of 0.25 mm, 0.5 mm, and 1 mm, and a mass of 500 g (the experimental data obtained by the other measurement protocols were analyzed in the same way). The results of the uncertainty analysis of the critical sand-carrying gas volume data are given in Table 3.
As can be seen from Table 3, keeping the inclination angle of the pipeline at 20°, the standard deviation and standard uncertainty of the critical sand-carrying gas volume collection values at different grain sizes and different liquid volumes are within 3%, and the experimental data obtained from other experiments using the same method are verified, and their SD and SE values are in the statistically permissible ranges, so the experimental data are true and reliable.

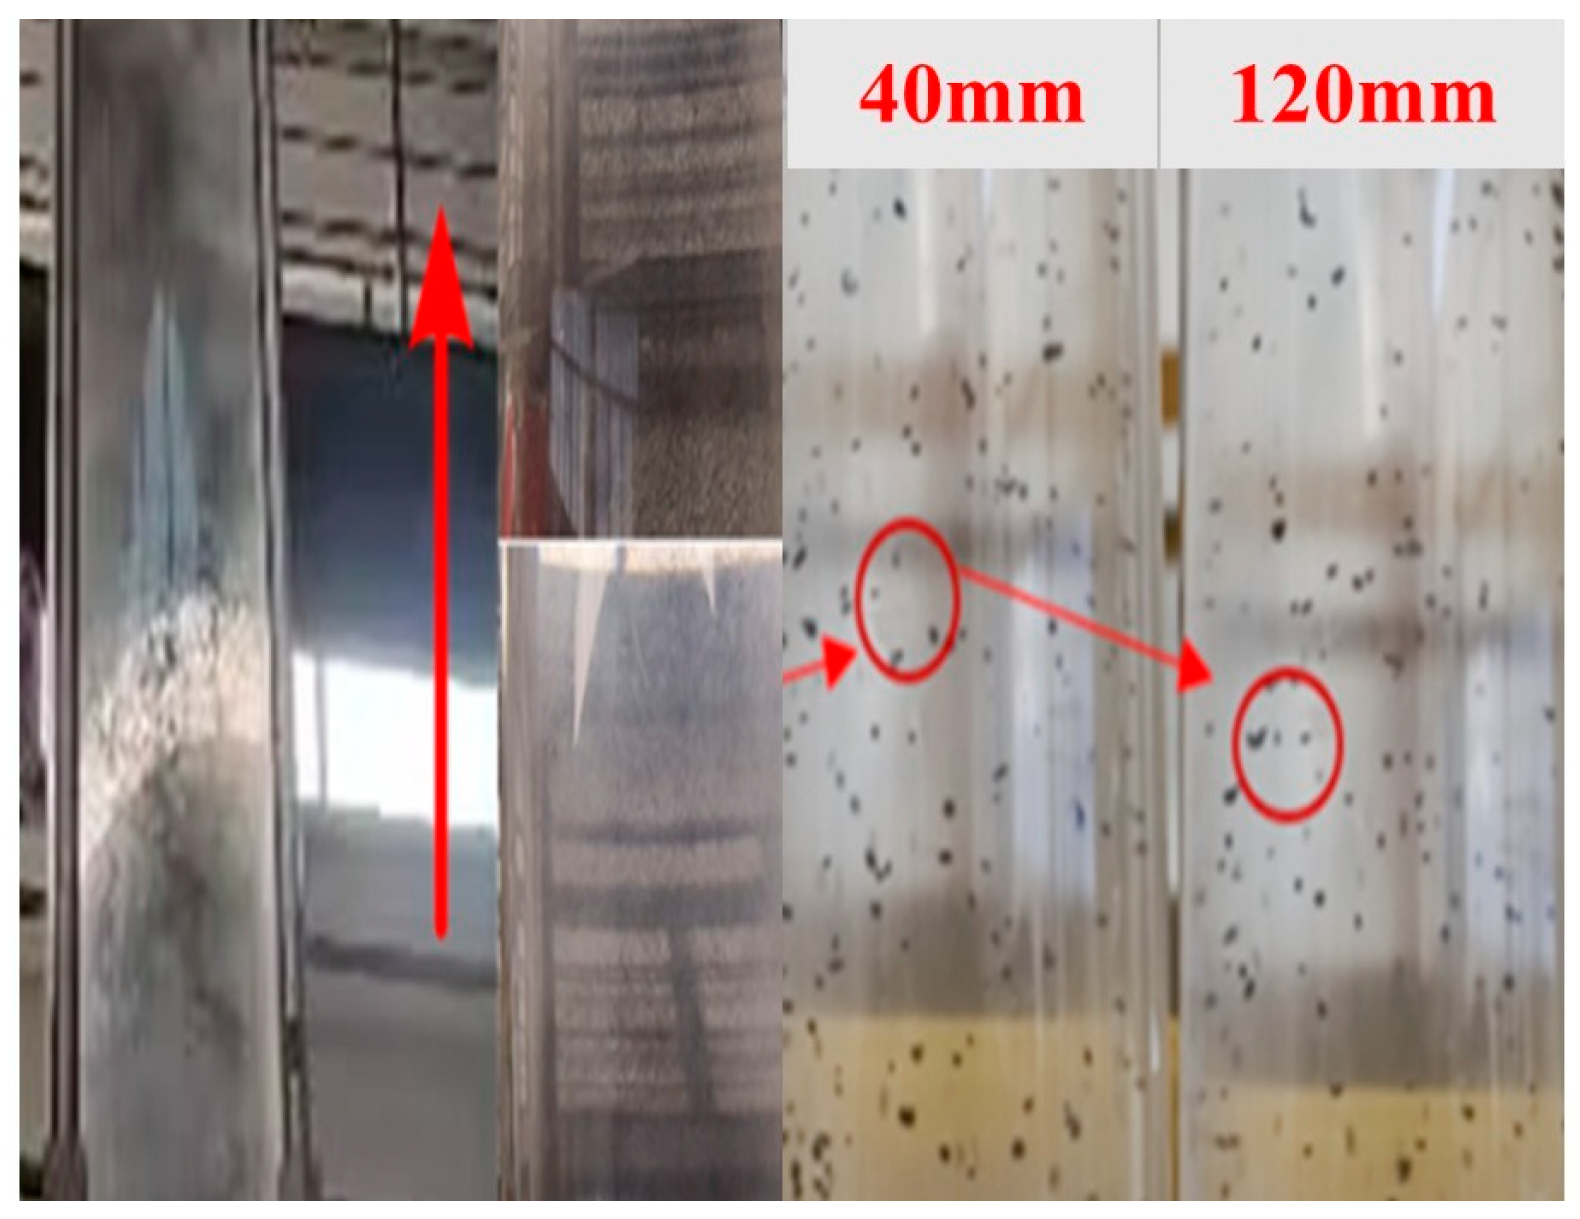
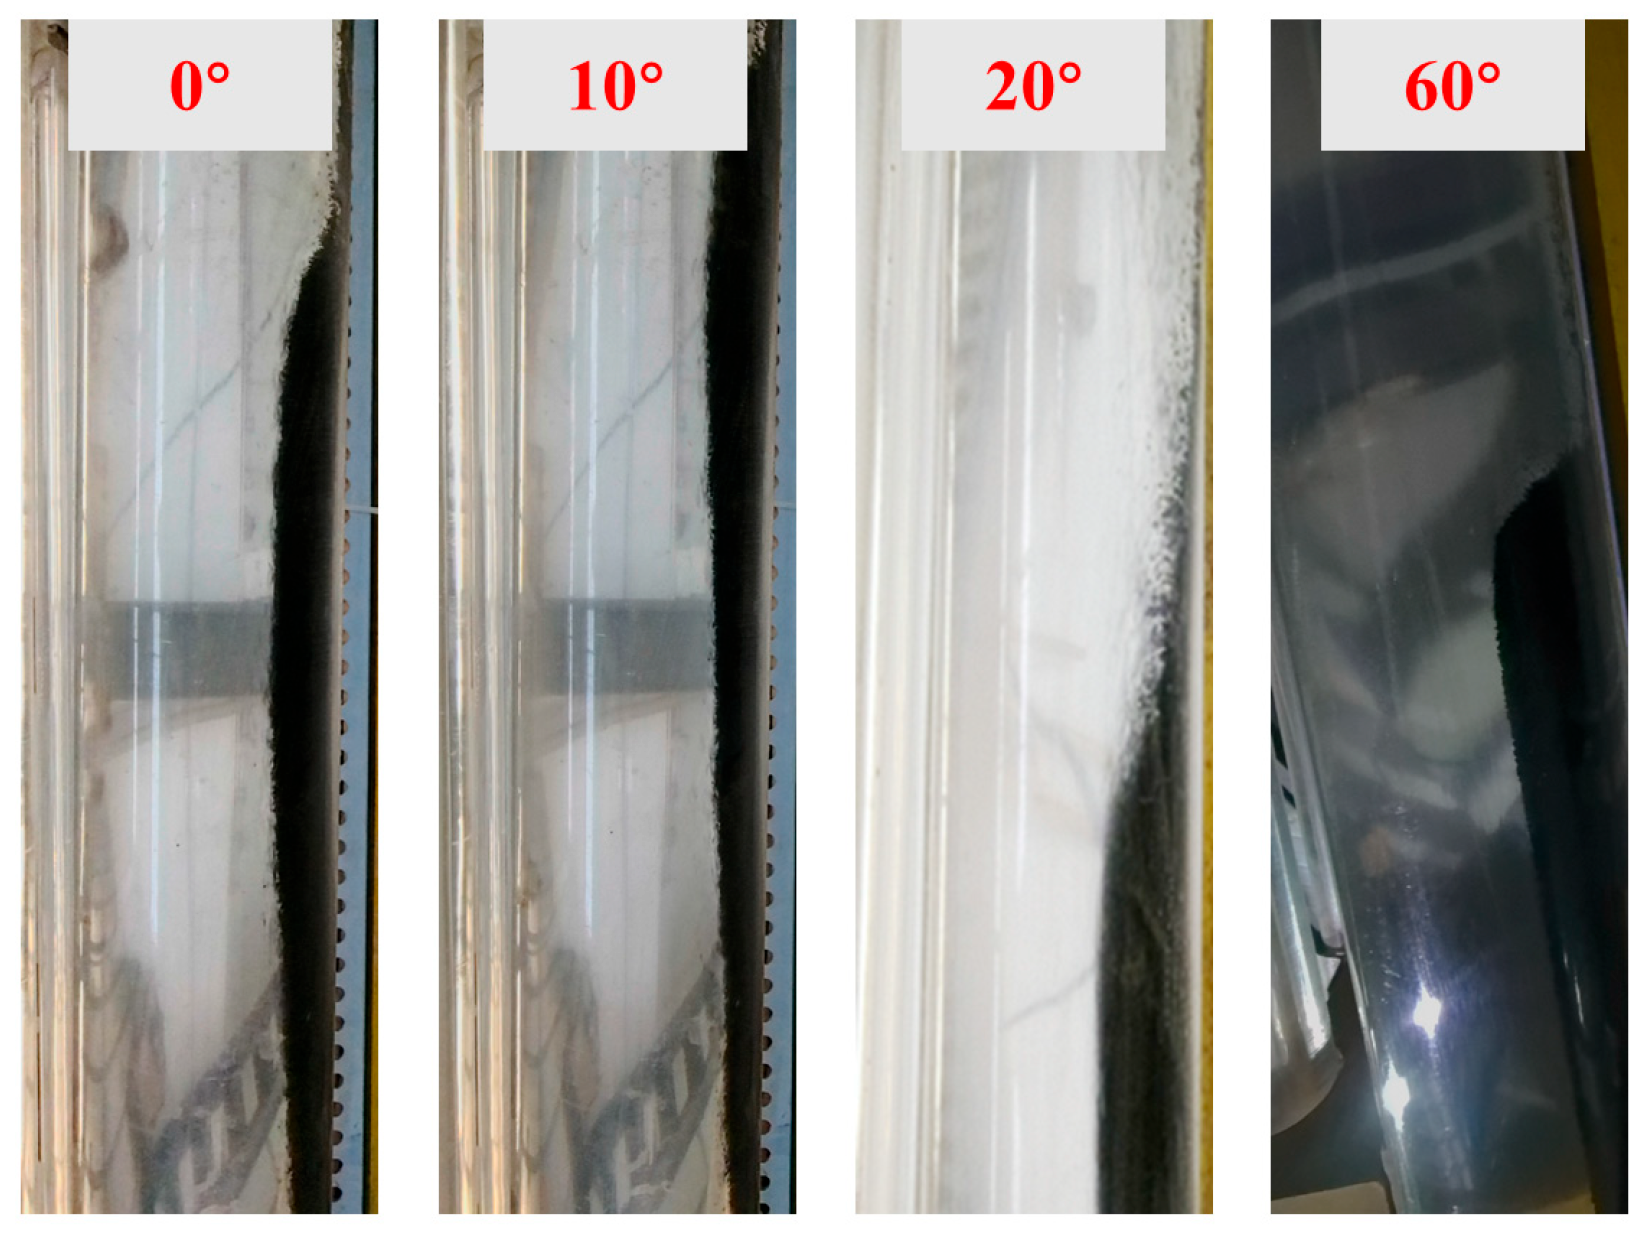
4.2. Analysis of Critical Flow State

In studies of sand transport by gas–liquid flow, the critical carrying capacity is primarily influenced by factors such as pipe inclination angle, sand particle diameter, and gas–liquid ratio. Under identical flow rates and pipe inclinations, sand particle size significantly impacts sand-carrying efficiency. Specifically, larger sand particles correspond to a lower sand-carrying capacity. This is mainly because larger particles have greater individual mass, thus requiring a higher gas flow rate to be lifted from the wellbore. Moreover, larger particles exhibit greater inertial forces, making it more difficult to alter their motion. For tests conducted with the same sand particle size, an increase in pipe inclination angle increases the difficulty for the fluid to lift sand particles upward, as shown in Figure 6. This occurs because the fluid must overcome the full gravitational component acting along the slope of the sand bed. However, the liquid phase primarily acts on the outermost layer of the sand bed, and the shear force is only partially transmitted to inner particles via inter-particle stress. As the volume of the sand pile increases, the shear stress distributed to individual particles decreases, whereas the gravitational effect remains unchanged. Consequently, larger sand piles slide down more rapidly and are more difficult to transport. As the gas–liquid ratio increases, the kinetic energy of both gas and liquid phases rises, intensifying their interaction. This enhanced interaction enables more sand particles to be carried out of the wellbore, thereby reducing the sand-holding capacity within it.

4.3. Effect of Different Water Flow Rates on Sand-Carrying

In deep coalbed methane wells, liquid loading failures in the wellbore are occasionally observed. A test was conducted using a pipeline inclination of 10° within a 40 mm inner diameter test section to investigate the relationship between the critical gas flow rate and sand particle diameter, as shown in Figure 7. The results indicate a generally positive correlation between particle diameter and critical gas capacity. This trend arises because larger particles require higher gas flow rates to remain suspended or to maintain specific flow states. In narrow-diameter pipelines, wall effects become more pronounced, making particle-wall interactions more likely. For large-diameter particles, the frictional resistance is further increased due to the confined space, which in turn demands a higher critical gas capacity to overcome this additional resistance and sustain particle transport.
When liquid is produced in a gas wellbore, the liquid production rate remains relatively stable, while the gas production rate is often influenced by solid particles. Therefore, it is essential to investigate the effect of the gas–liquid ratio on sand-carrying capacity in the study of critical sand-carrying behavior. An experimental study was conducted to examine the critical gas–liquid ratio for sand-carrying under constant liquid flow conditions. A total of 500 g of sand particles was introduced into the test section, and a stable liquid flow rate was maintained. Three liquid flow rates were tested: 6 m3/d, 10 m3/d, and 14 m3/d. Gas was incrementally introduced until sand movement was initiated. By adjusting the pipeline inclination to 0°, 10°, 20°, and 60°, the relationship between the critical gas–liquid ratio and liquid flow rate in a 40 mm inner diameter pipe was established, as shown in Figure 8.
Figure 8 illustrates the relationship between the gas–liquid ratio required for critical sand-carrying and the liquid flow rate for different sand diameters. Overall, when the well inclination angle is fixed, the gas–liquid ratio decreases gradually with the increase in water flow rate, which is due to the enhanced shear force caused by the elevated liquid-phase flow rate and the increase in the water-phase’s ability to coil and resuspend the sand particles, which in turn reduces the dependence on the gas-phase’s carrying action, which is reflected in the decrease in the required gas–liquid ratio. From a hydrodynamic point of view, as the liquid Reynolds number rises, the boundary layer thickness decreases, and the sand particles are more likely to leave the depositional state and be swept into the mainstream zone. On the contrary, when the water volume is unchanged and the well inclination angle is increased, the sand particles are more likely to be deposited along the bottom to form a stable sand bed under the action of the gravity component, and the liquid phase shear is insufficient, and more atmospheric disturbances are needed to generate bubble vortexes to break through the sand particle deposition, and thus the critical gas–liquid ratio is increased. In addition, an increase in sand particle size increases the settling velocity (according to Stokes’ law) and reduces the sensitivity of the response to perturbation, resulting in an increase in the overall difficulty of carrying sand, which further increases the required gas–liquid ratio.

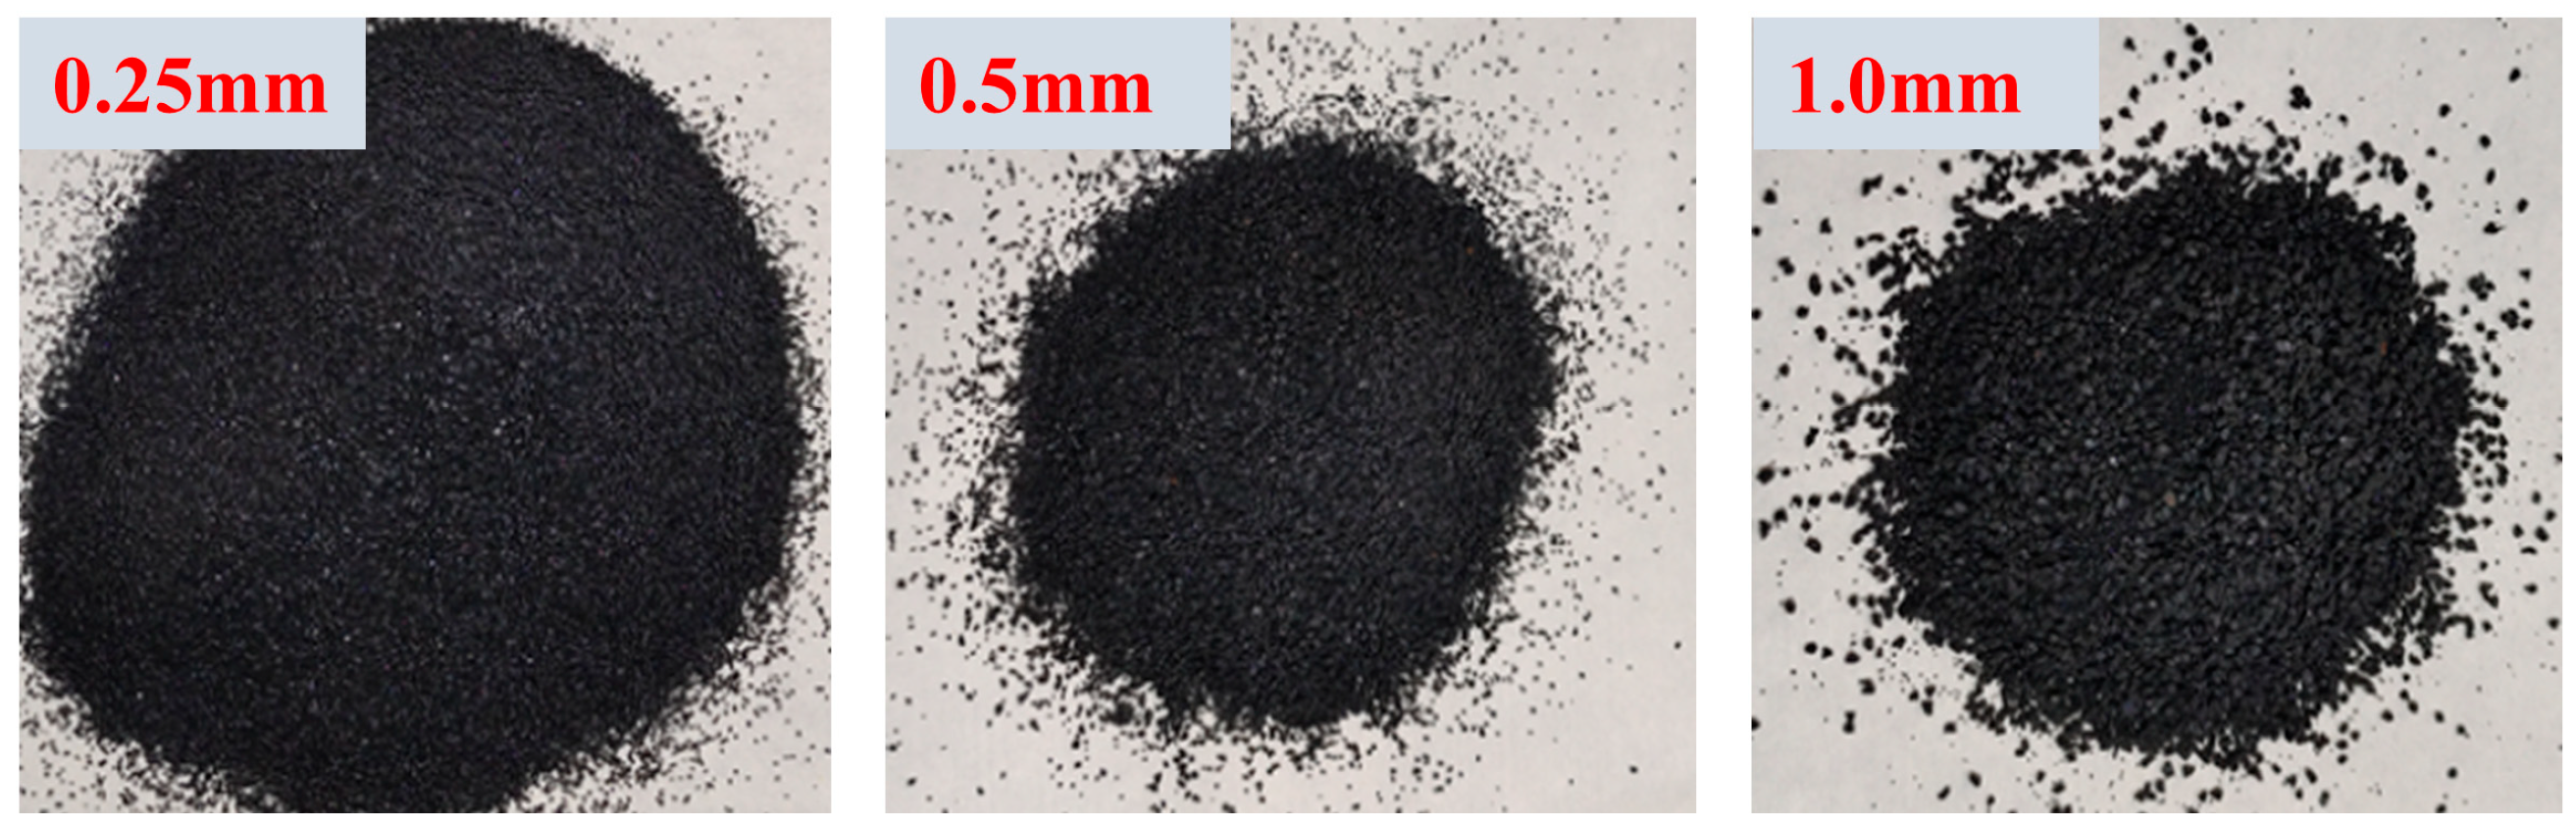
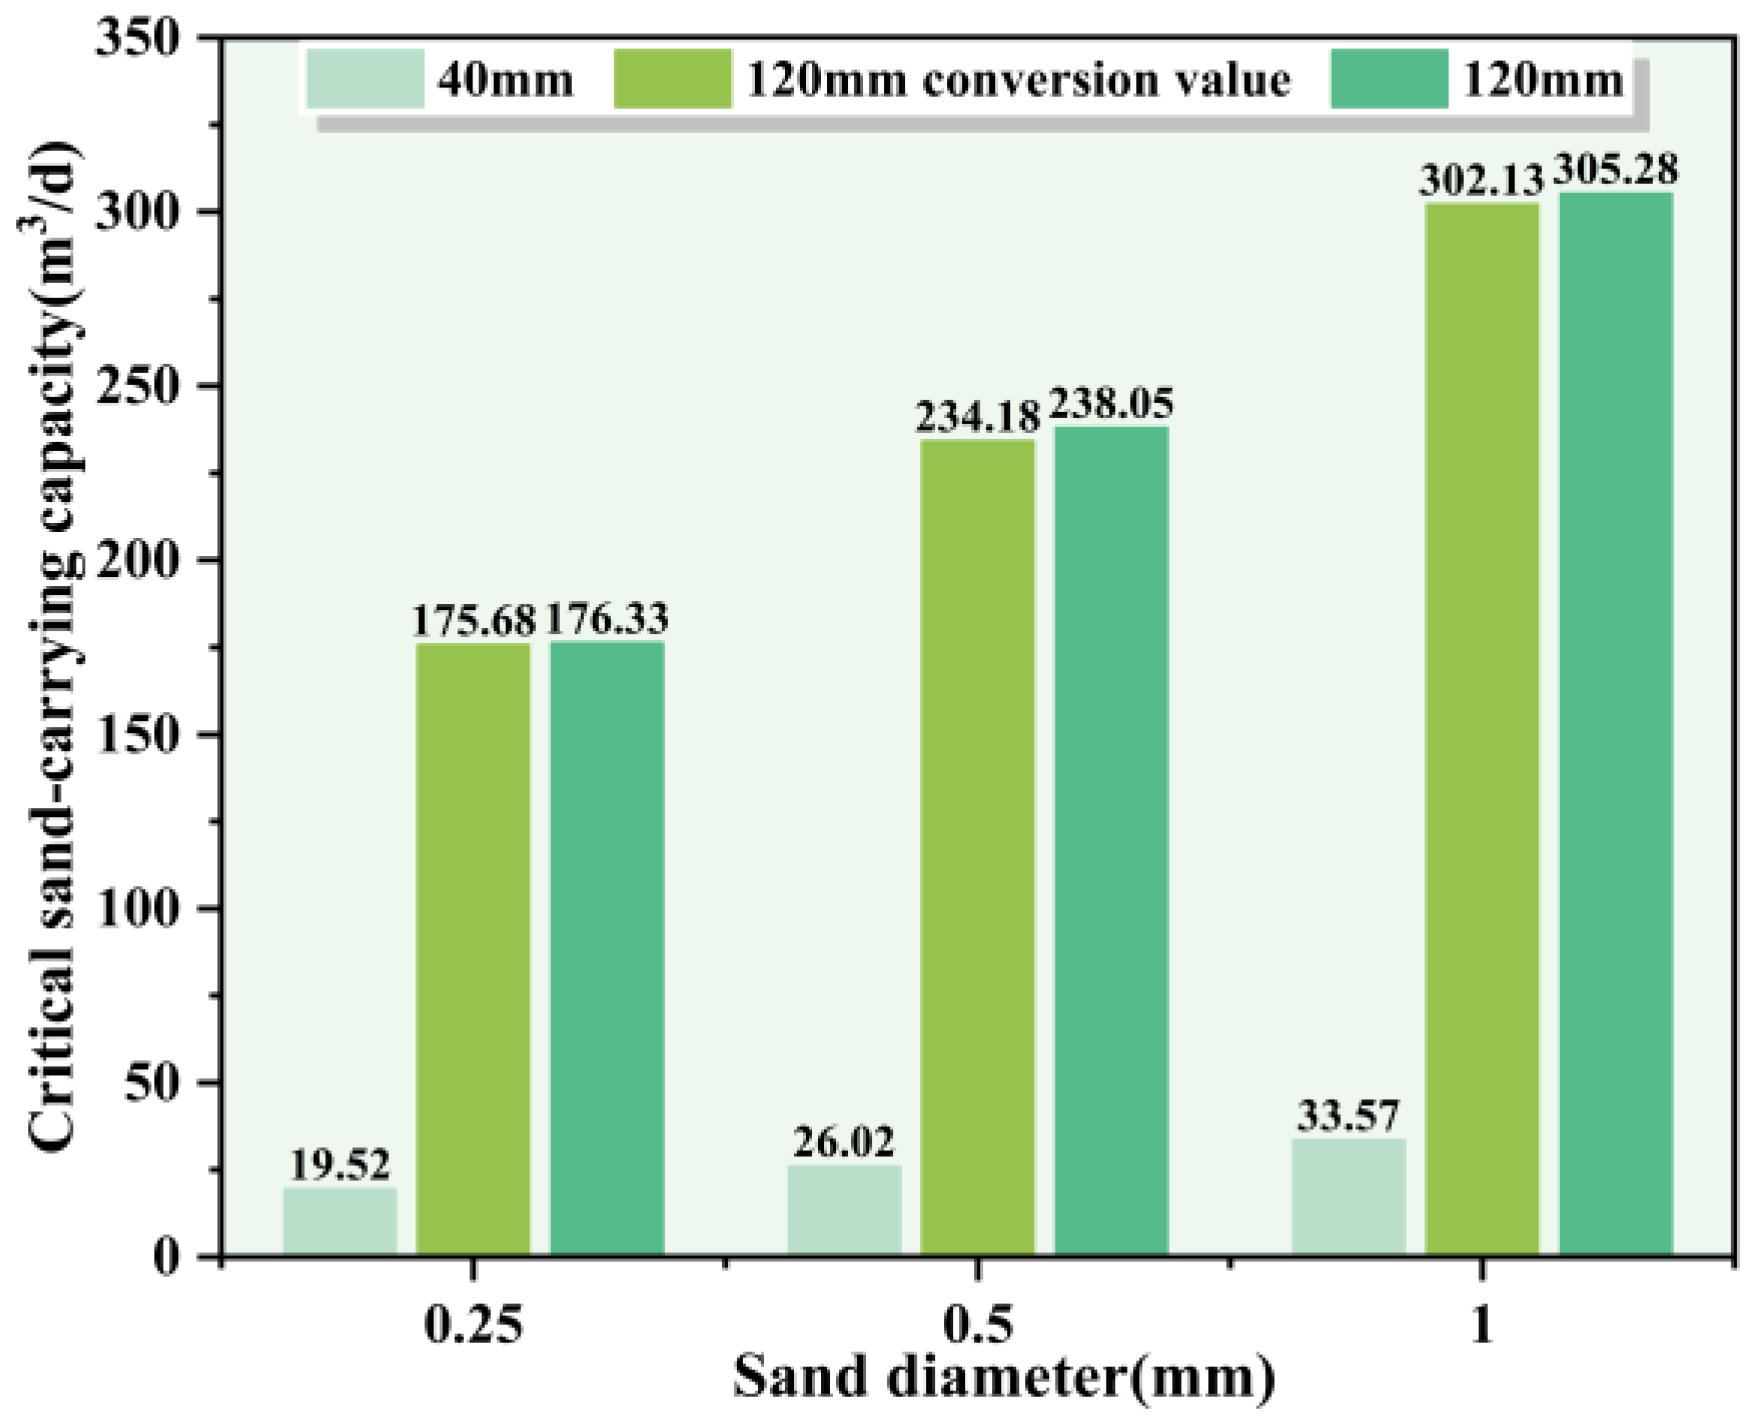
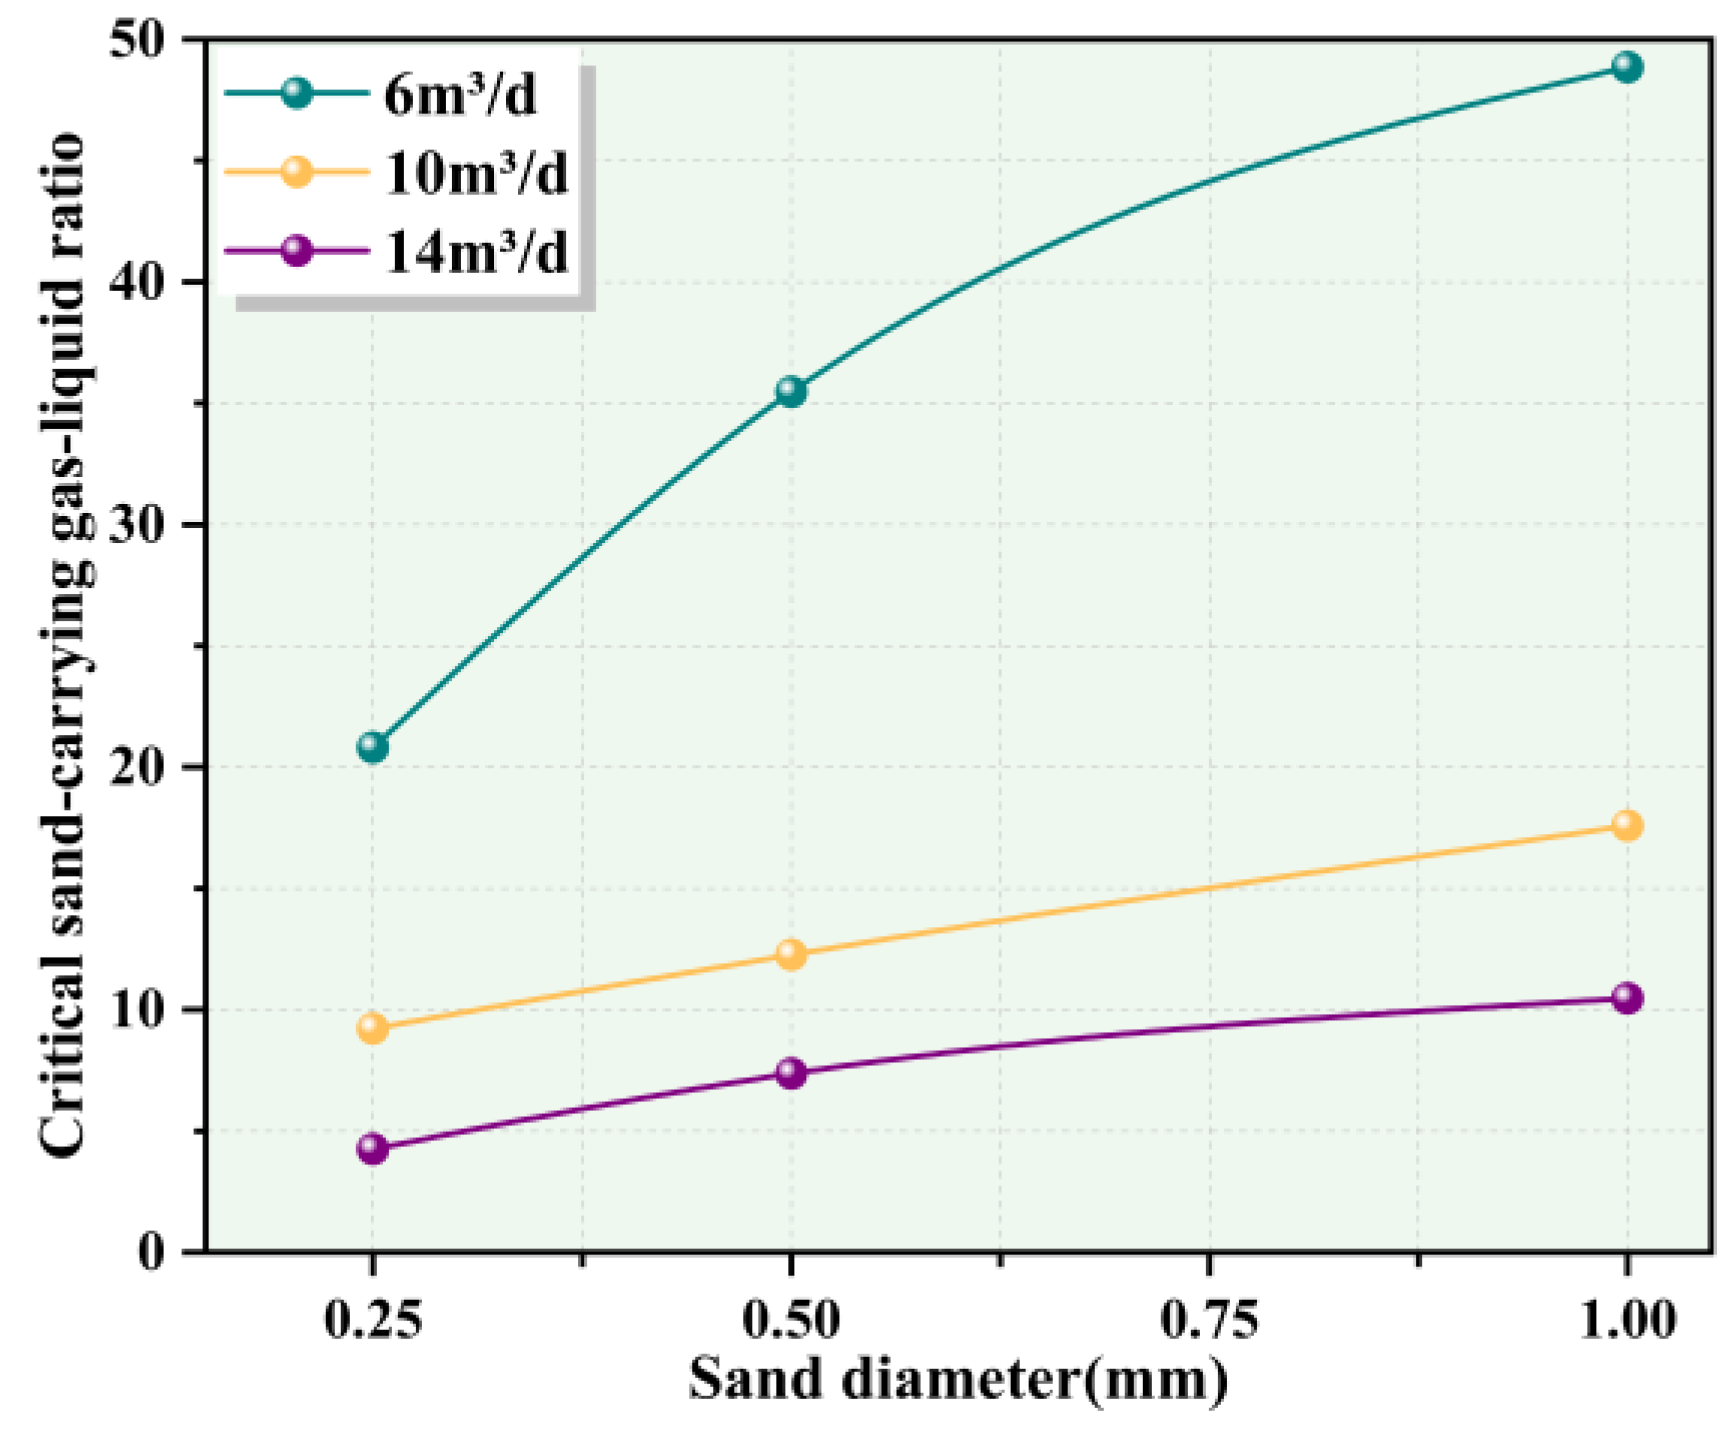
4.4. Effect of Different Sand Diameters on Sand-Carrying

In the study of critical sand-carrying in deep coalbed methane gas wells, the size of the sand diameter determines the magnitude of the critical gas volume for sand-carrying. In this experiment, the pipe inclination angle was set at 20°, and three sand sizes were specified as 0.25 mm, 0.5 mm, and 1 mm, with a mass of 500 g for each. These were injected at different liquid flow rates. Based on the data measured in the experiments, the relationship between sand diameter and the critical gas–liquid ratio for sand-carrying was analyzed, as shown in Figure 9.
Figure 9 intuitively shows the variation of the critical sand-carrying gas–liquid ratio with gravel diameter and water flow rate. Under the condition of a fixed water flow rate, the increase in gravel diameter leads to a significant increase in the required critical gas–liquid ratio, and this trend can be explained by the dynamics of sand force and sedimentation. According to fluid dynamics, larger-particle-size grit particles have greater mass and higher settling velocities, making it more difficult for them to be shear-driven initiated in liquids. Larger sand particles also imply higher inertia, which is less likely to respond to the swirling action of turbulent or vortex structures in low-speed disturbed flow, and thus higher gas-phase perturbations are required to introduce additional shear and perturbation fields in order to break the depositional equilibrium and complete the sand initiation, which is manifested as a larger critical gas–liquid ratio. When the sand particle size is kept constant and the water flow rate is gradually increased, the critical sand-carrying gas–liquid ratio tends to decrease. This is due to the fact that the increase in water flow rate brings about an increase in the average liquid-phase flow rate, which significantly enhances the viscous shear effect of the liquid phase on the sand particles and the traction along the bottom of the pipe, thus reducing the dependence on the gas-phase suction perturbation. Under these conditions, the liquid itself can maintain the sand-carrying state at flow rates close to or at the sand suspension threshold, thus requiring less gas flow and a consequent decrease in the critical gas–liquid ratio.

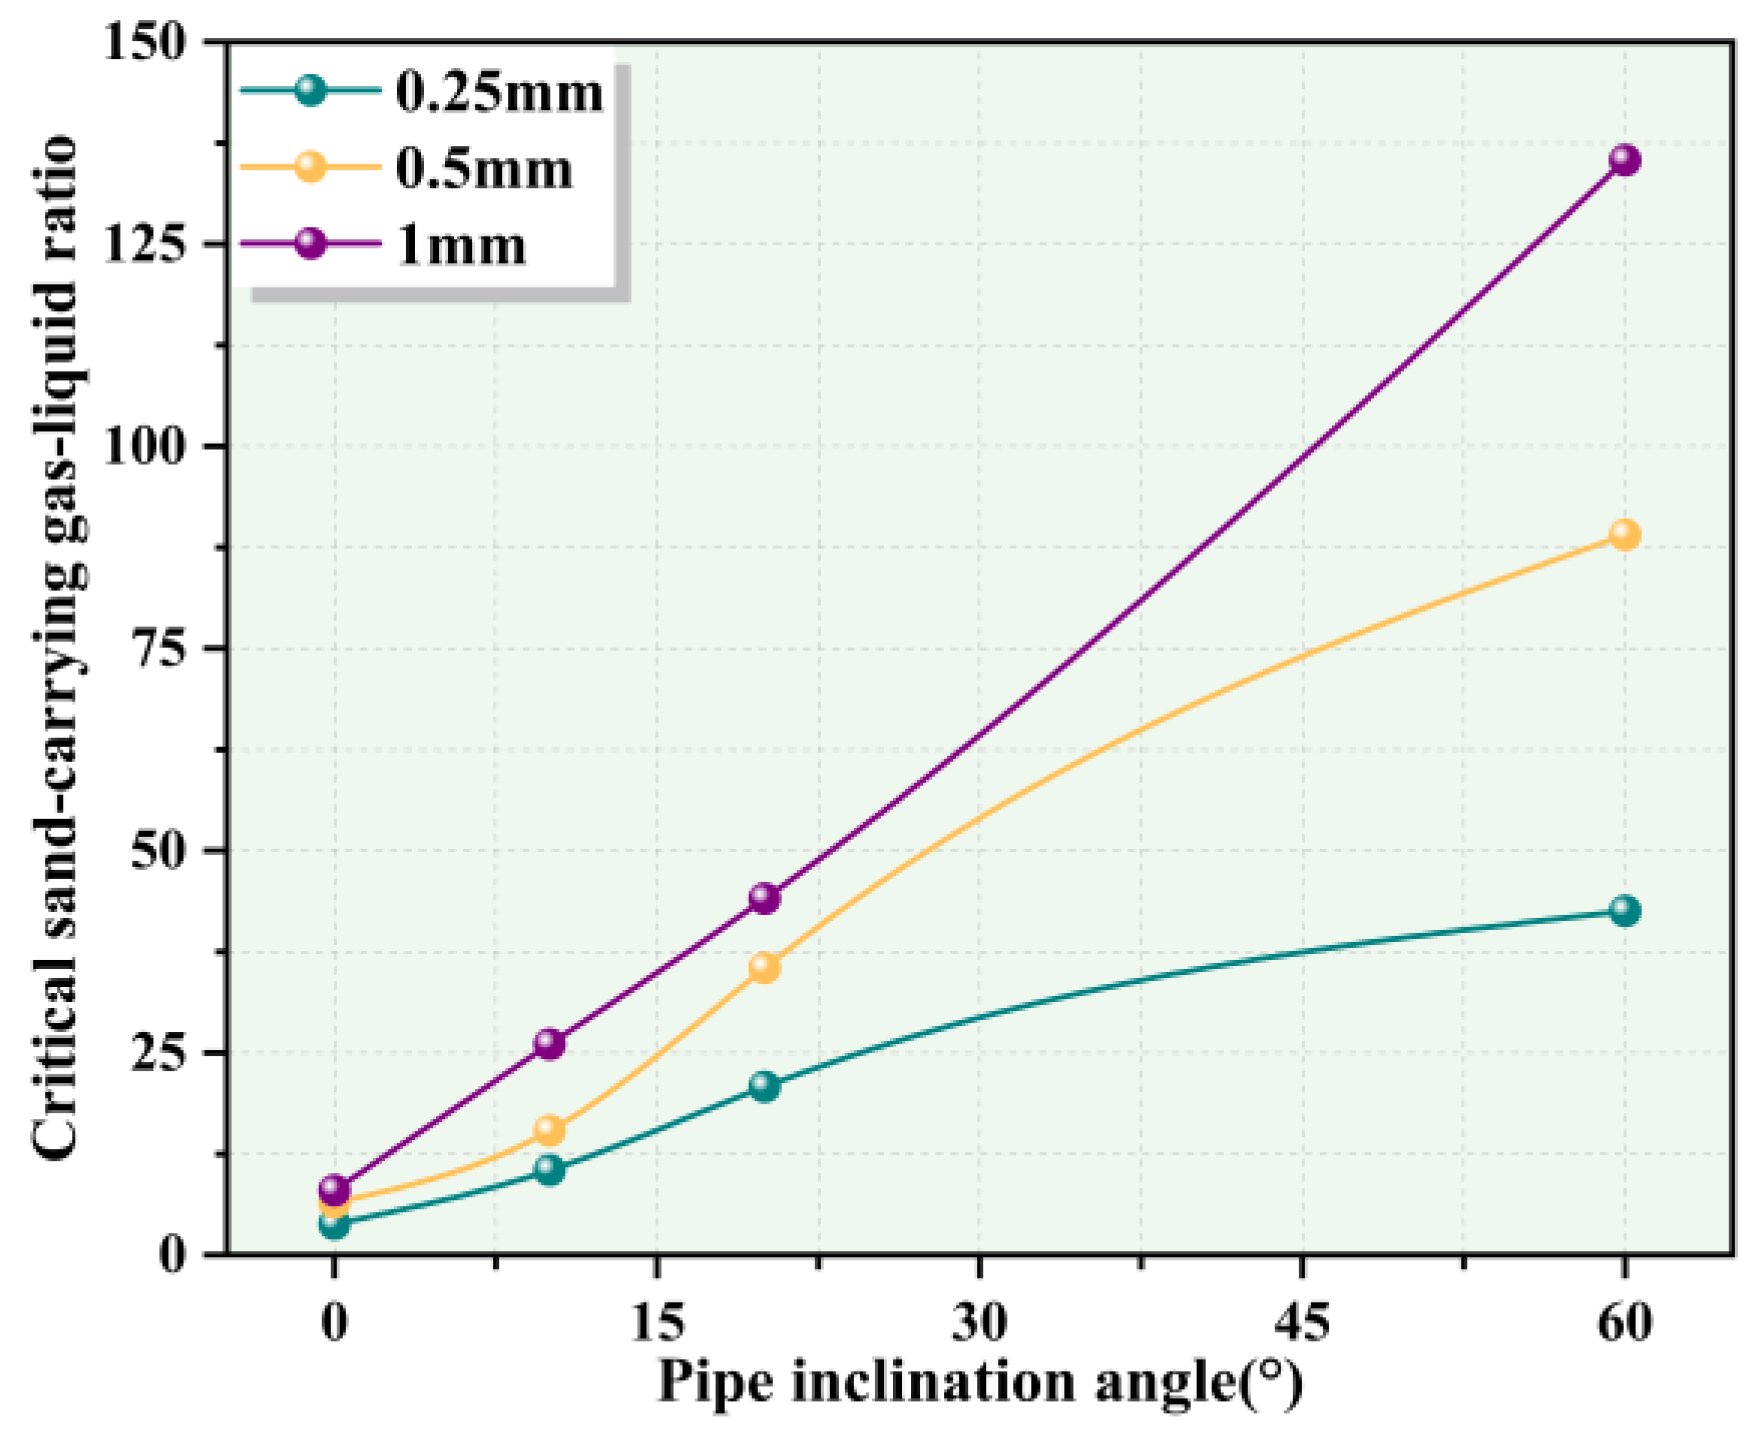
4.5. Effect of Different Inclination Angles on Sand-Carrying

The inclination angle of the wellbore in deep coalbed methane (CBM) gas wells plays a critical role in the study of critical sand-carrying behavior. As the inclination angle increases, sand-carrying becomes more challenging. In non-sanding gas wells, it has been shown that the most difficult range for liquid carrying occurs at inclination angles between 30° and 90° [41]. In this study, the focus is on critical sand-carrying behavior in horizontal and deviated wells. Taking a wellbore water production rate of 6 m3/d as an example, four pipe inclination angles were tested: 0°, 10°, 20°, and 60°. A sand mass of 500 g was introduced into the system, and the critical gas–liquid ratio required for sand-carrying was analyzed for sands of three different diameters: 0.25 mm, 0.5 mm, and 1 mm. The relationship between the inclination angle and the critical gas–liquid ratio is shown in Figure 10.
Figure 10 reveals the nonlinear trend of critical sand-carrying velocity with gas–liquid ratio at different well inclination angles. At the stage of low gas–liquid ratio, the perturbation ability of gas is limited, and the critical velocity mainly relies on the shear force provided by the liquid; as the gas–liquid ratio rises, the interfacial perturbation and flow field fluctuation induced by the gas phase are enhanced, the sand grains are easier to initiate, and the critical velocity rises. However, when the gas–liquid ratio is further increased, although the overall flow rate increases, due to gas–liquid phase separation, the liquid forms a fracture film, the sand particles’ coiled suction channel is limited, and some sand particles deviate from the mainstream into the retention area or deposition area, resulting in an increase in the critical sand-carrying velocity being slowed down or even a slight decline. From the mechanical point of view, the influence of gas–liquid ratio on the critical velocity reflects the transition from “shear enhancement” to “flow perturbation and phase separation dominated”, and its trend is a reflection of the combined effect of multiphase interfacial dynamics and inertial response of sand particles.

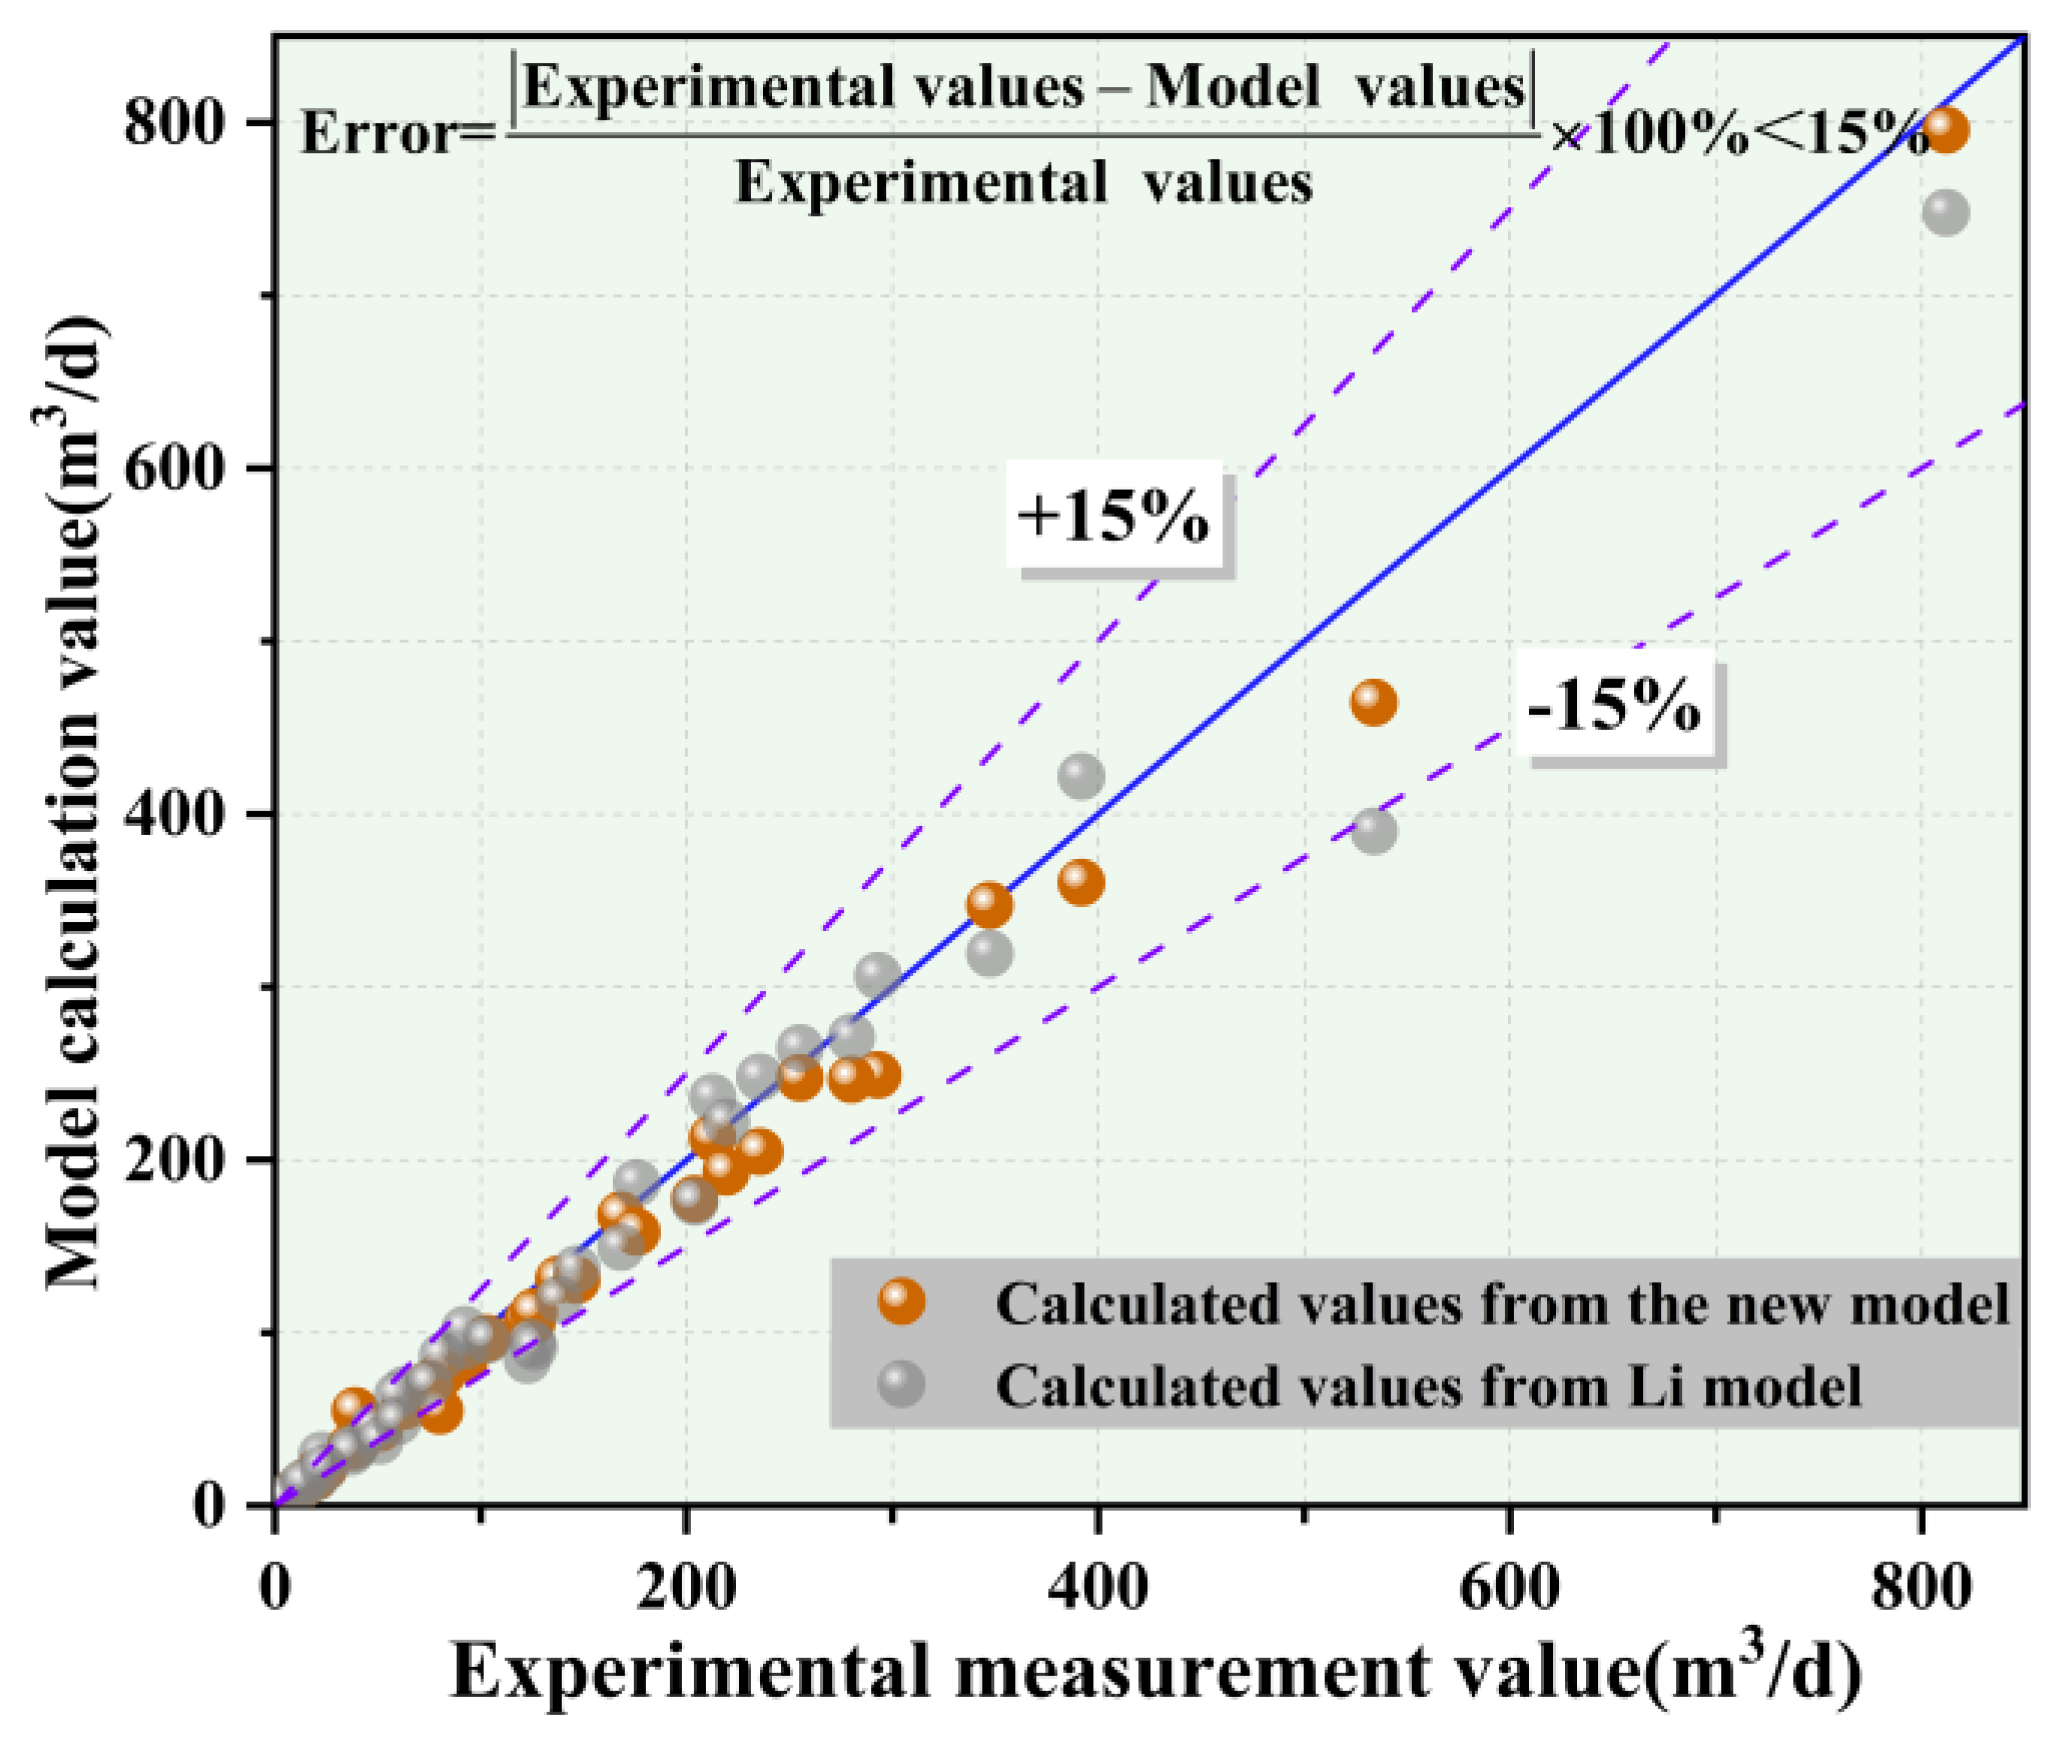
4.6. Error Analysis of the Critical Sand-Carrying Theoretical Model

The accuracy of the critical sand-carrying gas volume model is verified using the absolute value of the relative error, which is calculated as follows:
δ = x m x c x m × 100 %
where δ represents the absolute value of the relative error; x m represents the actual measurement value from the laboratory experiment; x c represents the calculated value from the constructed model.
The experimental data from gas–liquid–sand three-phase sand-carrying tests were validated, as shown in Figure 11. The data indicate that the measured values of critical sand-carrying capacity are within 15% error of the predicted values calculated by the proposed model. Meanwhile, Figure 11 uses the model constructed by Li [10] to compare with the new model, and the results show that the average deviations of the new model are all smaller than those of Li’s model, which demonstrates the good adaptability of the model. Therefore, the newly developed model can accurately predict the critical sand-carrying capacity in deep coalbed methane wells with water production.
However, some of the data in Figure 11 have large errors, which are due to the fluctuation of shear force caused by the change of interfacial tension in the three-phase coupling; at the same time, the transient deposition caused by local reflux or particle aggregation in the tubing; there is a certain range of particle size distribution in the experiments and the model adopts the equivalent particle size processing, so in order to further improve the model accuracy, the introduction of the dynamic flow pattern recognition module, the statistical term of particle size distribution, or the CFD auxiliary correction term can be considered to more accurately reflect the complex sand-carrying mechanism in the wellbore. In order to further improve the accuracy of the model, we can consider introducing a dynamic flow pattern identification module, a statistical term for particle size distribution, or an auxiliary correction term for CFD to more accurately reflect the sand-carrying mechanism in complex wellbores.

5. Conclusions

This paper established a critical sand-carrying model for the horizontal section of a deep coalbed methane well through theoretical analysis and conducted an experimental study on the critical sand-carrying capacity of gas–liquid–solid three-phase flow in the horizontal section of the wellbore based on a large-scale multiphase pipe flow platform experimental analysis. The sand-carrying law under critical conditions was analyzed, and the main conclusions are as follows:
(1)
Through the analysis of the stress on sand particles, a critical sand-carrying model of the horizontal section of deep coalbed methane wellbore based on gravity, buoyancy, resistance, and pressure difference was established.
(2)
Based on a large multiphase flow experimental platform, a sand-carrying experiment was conducted in the horizontal section of the wellbore, and the critical flow pattern in the test pipe was analyzed. As the pipe inclination angle increases, larger sand piles slide down more easily. The fluid shear force is not enough to lift all the sand particles, resulting in a stronger critical sand-carrying capacity.
(3)
In the experiments without water, the critical gas capacity exhibited a positive correlation with particle diameter. In tests involving water injection, when the pipe inclination remained constant, increasing the liquid flow rate led to a decrease in the required gas flow rate. Conversely, when the liquid flow rate was fixed, increasing the inclination angle resulted in a higher required gas flow rate. Both sand particle diameter and pipe inclination have a positive correlation with the critical sand-carrying capacity. As either parameter increases, the gas flow rate required for sand-carrying also increases, leading to a higher critical gas–liquid ratio.
(4)
The constructed model was verified using indoor test data. The results show that the deviation between the calculated values and the actual test results is within 15%, and the model has high accuracy, which provides a theoretical basis for the sand production in the horizontal section of deep coalbed methane wells.
Although this paper investigates the three-phase sand transport mechanism of gas–liquid–sand in the horizontal section of CBM wells, there are still some limitations in this study, for example, the experimental conditions cannot fully simulate the field environment of high temperature and high pressure and extreme well depth, the theoretical model adopts the equivalent treatment for some parameters, and the distribution and interaction of the particle size have not yet been considered, and the validation of the model is still limited to the experimental data, which is lack of support for the monitoring of the sand production in the field. The future work will be devoted to introducing the discharge data of coalbed methane wells for the dynamic calibration of the model, combining CFD numerical simulation and visualization experiments to further analyze the transient sand-carrying mechanism, and at the same time, expanding the applicability of the model in shale gas, tight gas, and other complex reservoirs to enhance the value of its engineering popularization.

Author Contributions

L.S. and W.Q. (Weilin Qi): writing—original draft, writing—review and editing, methodology, conceptualization, and formal analysis. W.Q. (Wei Qi), L.H. and A.T.: supervision. L.Y., K.Z. and Y.Z.: visualization, validation, and resources. All authors have read and agreed to the published version of the manuscript.

Funding

This research received no funding.

Data Availability Statement

The data presented in this study are available on request from the corresponding author.

Acknowledgments

The authors acknowledge the reviewers for providing valuable comments and helpful suggestions to improve the manuscript.

Conflicts of Interest

Authors Longfei Sun, Wei Qi, Li Hao, Lin Yang, Kang Zhang and Yun Zhang were employed by the company Linfen Branch of PetroChina Coalbed Methane Co., Ltd. Author Weilin Qi and Anda Tang were employed by thecompany Research institute of Production Engineering and Technology, Tuha Oilfield Branch Company. The remaining authors declare that the research was conducted in the absence of any commercial or financial relationships that could be construed as a potential conflict of interest.

References

  1. Xu, F.; Hou, W.; Xiong, X.; Xu, B.; Wu, P.; Wang, H.; Mao, D. The status and development strategy of coalbed methane industry in China. Pet. Explor. Dev. 2023, 50, 765–783. [Google Scholar] [CrossRef]
  2. Qin, Y.; Moore, T.A.; Shen, J.; Yang, Z.; Shen, Y.; Wang, G. Resources and geology of coalbed methane in China: A review. In Coal Geology of China; Routledge: Abingdon, UK, 2020; pp. 247–282. [Google Scholar]
  3. Li, H.; Wei, N.; Hu, H.; Ge, Z.; Jiang, L.; Liu, F.; Kvamme, B. The law of liquid-solid carrying in the wellbore of natural gas hydrate gas well under the condition of foam drainage gas recovery. Energies 2023, 16, 2414. [Google Scholar] [CrossRef]
  4. Ma, T.; Liu, J.; Fu, J.; Wu, B. Drilling and completion technologies of coalbed methane exploitation: An overview. Int. J. Coal Sci. Technol. 2022, 9, 68. [Google Scholar] [CrossRef]
  5. Moore, T.A. Coalbed methane: A review. Int. J. Coal Geol. 2012, 101, 36–81. [Google Scholar] [CrossRef]
  6. Huang, Q.; Li, M.; Huang, Y.; Zhang, A.; Lian, X.; Yan, Y.; Feng, X. Effect of inorganic salts in coal seams on the sand-carrying capacity of hydroxypropyl guar foam-fracturing fluid: An experimental study. Phys. Fluids 2023, 35, 093118. [Google Scholar] [CrossRef]
  7. Wei, G.; Wen, H.; Deng, J.; Ma, L.; Li, Z.; Lei, C.; Liu, Y. Liquid CO2 injection to enhance coalbed methane recovery: An experiment and in-situ application test. Fuel 2021, 284, 119043. [Google Scholar] [CrossRef]
  8. Turner, R.G.; Hubbard, M.G.; Dukler, A.E. Analysis and prediction of minimum flow rate for the continuous removal of liquids from gas wells. J. Pet. Technol. 1969, 21, 1475–1482. [Google Scholar] [CrossRef]
  9. Liu, Z.; Shi, M.; Dai, G. Motion of Solid Particles in a Vertically Upward Flow Field. J. China Univ. Pet. (Ed. Nat. Sci.) 1998, 22, 79. [Google Scholar]
  10. Li, M.-Z.; Wang, W.-Y.; He, Y.-F.; Yuan, M. Study on Sand-carrying in Vertical Wellbores. J. China Univ. Pet. (Ed. Nat. Sci.) 2000, 24, 33–35. [Google Scholar]
  11. Li, M.-Z.; Wang, W.-Y.; Zhao, G.-J. Research on Sand-carrying in Vertical Wellbores and Its Application in Oil Well Production. J. Exp. Mech. 2002, 17, 385–392. [Google Scholar] [CrossRef]
  12. Wang, Z.; Deng, J.; Sun, F.; Zhou, J.; Liu, A. Experimental study on sand grain migration in wellbore. Acta Pet. Sin. 2006, 27, 130. [Google Scholar]
  13. Wen, J.; Xu, S. Local hydrodynamics in a gas-liquid-solid three-phase bubble column reactor. Chem. Eng. J. 1998, 70, 81–84. [Google Scholar]
  14. Mitra-Majumdar, D.; Farouk, B.; Shah, Y.T. Hydrodynamic modeling of three-phase flows through a vertical column. Chem. Eng. Sci. 1997, 52, 4485–4497. [Google Scholar] [CrossRef]
  15. Wen, J.P.; Huang, L.; Zhou, H.; Yu, B.T.; Hu, Z.D. The E/E/L Model and Simulation of Gas–Liquid–Solid Three-Phase Turbulent Flow. J. Chem. Ind. Eng. 2001, 52, 343. [Google Scholar]
  16. Zhou, G.M.; Feng, Y.R.; Xu, Z.H.; Li, X.F. Research on the Critical Sand Production Model for Gas Wells. Xinjiang Oil Gas 2003, 15, 57–59. [Google Scholar]
  17. Li, G.; Wang, X.; Xiao, X.Q.; Chen, J. Application of two-phase flow theory in gas well with sands. Fault-Block Oil Gas Field 2008, 15, 65–67. [Google Scholar]
  18. Xue, Z.Z. Theoretical and Experimental Research on Gas-Sand Two-Phase Flow in Natural Gas Production. Petrochem. Ind. Technol. 2016, 23, 201. [Google Scholar]
  19. Lin, L.; Lou, W.; Xie, J.; Li, L. Application Research on Critical Sand-carrying Parameters and Sand Production Prediction Models for Gas Wells. J. Chongqing Univ. Sci. Technol. (Nat. Sci. Ed.) 2015, 17, 65–68. [Google Scholar]
  20. Zhang, G.; Huang, X.; Yan, J.; Yi, L.; Wang, W.; Qu, X.; Sun, X. Research on the Minimum Sand-carrying Capability of Oil Wells in the Gu Dong Oilfield. J. Oil Gas Technol. 2001, 23, 33. [Google Scholar]
  21. Liu, A.P.; Deng, J.G. Research on the Minimum Sand-carrying Velocity of Low-Viscosity Liquid Flow in Vertical Wellbores. Oil Drill. Prod. Technol. 2007, 29, 31–33. [Google Scholar]
  22. Jiao, Y.H.; Deng, J.G.; Mou, S.B. Calculation of the Minimum Sand-carrying Velocity for Sand Production in Vertical Wellbores. West-China Explor. Eng. 2010, 22, 101–103. [Google Scholar]
  23. Wang, X.W.; Wang, J.; Wang, X. Laboratory Research on Gas Flow Sand-carrying Models in Vertical Gas Wells. China Pet. Chem. Stand. Qual. 2011, 31, 187–188. [Google Scholar]
  24. Dong, C.; Li, Y.; Zhang, Q.; Feng, S.; Zhang, L. Experimental study on sand-carrying mechanism and capacity evaluation in water-producing gas wells and its application in artificial lift optimization. In SPE Middle East Artificial Lift Conference and Exhibition; SPE: Richardson, TX, USA, 2014; p. SPE-173700. [Google Scholar]
  25. Dong, C.; Gao, K.; Wang PZhang, Q.; Cui, M.; Yao, F. Sand-carrying flow in low-viscosity wellbore fluid and characteristic flow velocities. Acta Pet. Sin. 2016, 37, 1280–1286. [Google Scholar]
  26. Zeng, S.R.; Dong, C.Y.; Wei, R.; Su, Y.; Wang, J.; Yan, Q.H. Comparing experiments and their matching application of the borehole critical sand-carrying velocity in the horizontal well with different pitching angles. Pet. Geol. Oilfield Dev. Daqing 2018, 37, 54–59. [Google Scholar]
  27. Deng, S.; Zhang, D.; Zhao, H.; Peng, H.; Wang, J.; Yan, X. A new method for calculating the minimum sand-carrying velocity in geothermal well production. Geothermics 2023, 114, 102811. [Google Scholar] [CrossRef]
  28. Han, H.; Shi, Z.; Zuo, W.; Wu, S.; Liu, Y.; Xie, K.; Long, L.; Mitri, H. Sand-Carrying Law and Influencing Factors in Complex Fractures of Nano-Clean Fracturing Fluid. Energies 2023, 16, 6056. [Google Scholar] [CrossRef]
  29. Li, Q.; Li, Q.; Wang, F.; Wu, J.; Wang, Y. The Carrying Behavior of Water-Based Fracturing Fluid in Shale Reservoir Fractures and Molecular Dynamics of Sand-Carrying Mechanism. Processes 2024, 12, 2051. [Google Scholar] [CrossRef]
  30. Liu, S. Prediction of critical sand production concentration in reservoirs based on stationary bed theory in wellbore. Comp. Part. Mech. 2025, 1–17. [Google Scholar] [CrossRef]
  31. Wang, Z.; Wu, Z.; Wang, Z.; Zhang, M.; Liao, R. Study of sand particle transport characteristics and different critical velocities in sand-producing wells via indoor experiments. Sci. Rep. 2025, 15, 9707. [Google Scholar]
  32. Han, X.; Wu, J.; Ji, Y.; Liu, J.; Liu, Y.; Xie, B.; Chen, X.; Yin, H.; Liang, T. Impact of Viscoelasticity on Sand-Carrying Ability of Viscous Slickwater and Its Sand-Carrying Threshold in Hydraulic Fractures. Energies 2024, 17, 428. [Google Scholar] [CrossRef]
  33. Danielson, T.J. Sand transport modeling in multiphase pipelines. In Offshore Technology Conference; OTC: Houston, TX, USA, 2007; p. OTC-18691. [Google Scholar]
  34. Galindo, T. Sand Transport, Does Viscosity Matter? In SPE Liquids-Rich Basins Conference-North America; SPE: Richardson, TX, USA, 2019; p. D022S010R010. [Google Scholar]
  35. Abou-Kassem, A.J.; Sidahmed, A.; Kotb, O.; Haftani, M.; Nouri, A. Integrated wellbore-reservoir simulations to design sand retention tests for flowback scenarios in SAGD injection wells. J. Pet. Sci. Eng. 2022, 208, 109307. [Google Scholar] [CrossRef]
  36. Varkas, M.; Papamichos, E.; Berntsen, A.N. Experimental study of volumetric sand production with gas flow. Geoenergy Sci. Eng. 2024, 234, 212610. [Google Scholar] [CrossRef]
  37. Rowe, P.N.; Nienow, A.W. Minimum fluidisation velocity of multi-component particle mixtures. Chem. Eng. Sci. 1975, 30, 1365–1369. [Google Scholar] [CrossRef]
  38. Wang, X.; Wang, X.W.; Wang, J.; Zhou, B.; Yan, Q.H. Theoretical Model Analysis of Gas Flow Sand-carrying in Vertical Wellbores. J. Oil Gas Technol. 2011, 5, 274–276. [Google Scholar]
  39. JCGM 100:2008; JCGM, Evaluation of Measurement Data-Guide to the Expression of Uncertainty in Measurement. Guides in Metrology Committee: Paris, France, 2008.
  40. Gudala, M.; Naiya, T.K.; Govindarajan, S.K. Heavy oil-water dispersed flows in horizontal pipelines using bio-additives with energy analysis: Experimental and numerical investigations. J. Pet. Sci. Eng. 2022, 211, 110142. [Google Scholar] [CrossRef]
  41. Wang, G.; Liao, R.; Huang, L.; Xia, Q.; Zhang, M.; Lei, Y.; Wang, W. Study of the flow pattern and pressure drop law of the air-water-foam three-phase flow. Exp. Therm. Fluid Sci. 2024, 155, 111207. [Google Scholar] [CrossRef]
Figure 1. Sand force analysis diagram.
Processes 13 01810 g001
Figure 2. Experimental platform.
Processes 13 01810 g002
Figure 3. Sand samples of different diameters.
Processes 13 01810 g003
Figure 4. Comparison of critical flow state at an inclination angle of 90°.
Processes 13 01810 g004
Figure 5. Critical sand-carrying capacity under different diameter pipes.
Processes 13 01810 g005
Figure 6. Critical sand-carrying flow state under different pipe inclination angles.
Processes 13 01810 g006
Figure 7. Critical sand-carrying capacity without liquid discharge.
Processes 13 01810 g007
Figure 8. Relationship between critical sand-carrying gas–liquid ratio and liquid flow rate.
Processes 13 01810 g008
Figure 9. Relationship between critical sand-carrying gas–liquid ratio and sand diameter.
Processes 13 01810 g009
Figure 10. Relationship between critical sand-carrying gas–liquid ratio and pipe inclination.
Processes 13 01810 g010
Figure 11. Error analysis of the model for critical sand-carrying capacity.
Processes 13 01810 g011
Table 1. Experimental platform equipment and basic parameters.
SystemEquipment NameWorking ConditionsAccuracy
Power
systems
Single screw-rod air
compressor
(FHOGD-250)
Maximum displacement: 0.5787 m3/s; Working pressure range: 0~8 × 10⁵ Pa.
Centrifugal pumps
(D620-35X10)
Maximum displacement: 0.0019 m3/s;
Working pressure range: 0~8 × 10⁵ Pa.
Sand Injection Pump
(G/GH 6/4D)
Maximum displacement: 0.07 m3/s; Power range: 4~60 kW
Measurement
systems
Gas phase flow meter
(Proline mass 65)
Scale: 0~0.5787 m3/s±0.1% (FS)
Liquid flow meter
(YK-LDF-DN10-B)
Scale: 0~0.002 m3/s±0.5% (FS)
Differential pressure
gauge (TCT-1206)
Scale: 0~2.5864 × 10⁵ Pa±0.05% (FS)
Manometer
(Rosemount 3051S)
Scale: 0~1.2 × 10⁷ Pa±0.1% (FS)
High-speed camera (NEO 25M/C)Maximum frame rate: 25,000 fps; Resolution: 1280 × 1024.
Table 2. Sand particle size test data.
NumberNumber of Sand Particles (Mesh)Particle Size Range (mm)Representative Particle Size (mm)Material
S110~200.6~1.21Quartz sand
S220~400.4~0.60.5Quartz sand
S340~800.2~0.40.25Quartz sand
Table 3. Standard deviation analysis of experimental data.
Particle Size (mm)Liquid Flow (m3/d)Critical Sand-Carrying Capacity (m3/d)Ave.SDSE
Exp. 1Exp. 2Exp. 3Exp. 4Exp. 5
0.256124.35124.88124.88124.92124.95124.800.250.11
1092.1592.3892.1792.3292.4392.290.130.06
1459.6859.8359.7459.6259.7359.720.080.03
0.56212.83212.83212.76212.78212.78212.800.030.01
10122.56122.55122.68122.74122.88122.690.140.06
14102.95103.15103.15103.26103.26103.150.130.06
16293.18293.18293.15293.15293.09293.150.040.02
10175.93175.93175.89175.86175.86175.890.040.02
14146.33146.58146.58146.64146.73146.570.150.07
Disclaimer/Publisher’s Note: The statements, opinions and data contained in all publications are solely those of the individual author(s) and contributor(s) and not of MDPI and/or the editor(s). MDPI and/or the editor(s) disclaim responsibility for any injury to people or property resulting from any ideas, methods, instructions or products referred to in the content.

