
Numerical Simulation of Acid Leakoff in Fracture Walls Based on an Improved Dual-Scale Continuous Model

 ,
,
Abstract
1. Introduction
2. Numerical Simulation Algorithms and Mathematical Models for Acid-Etched Fracturing
2.1. Numerical Simulation Algorithms or Acid-Etched Fracturing
2.2. Mathematical Models for Acid-Etched Fracturing
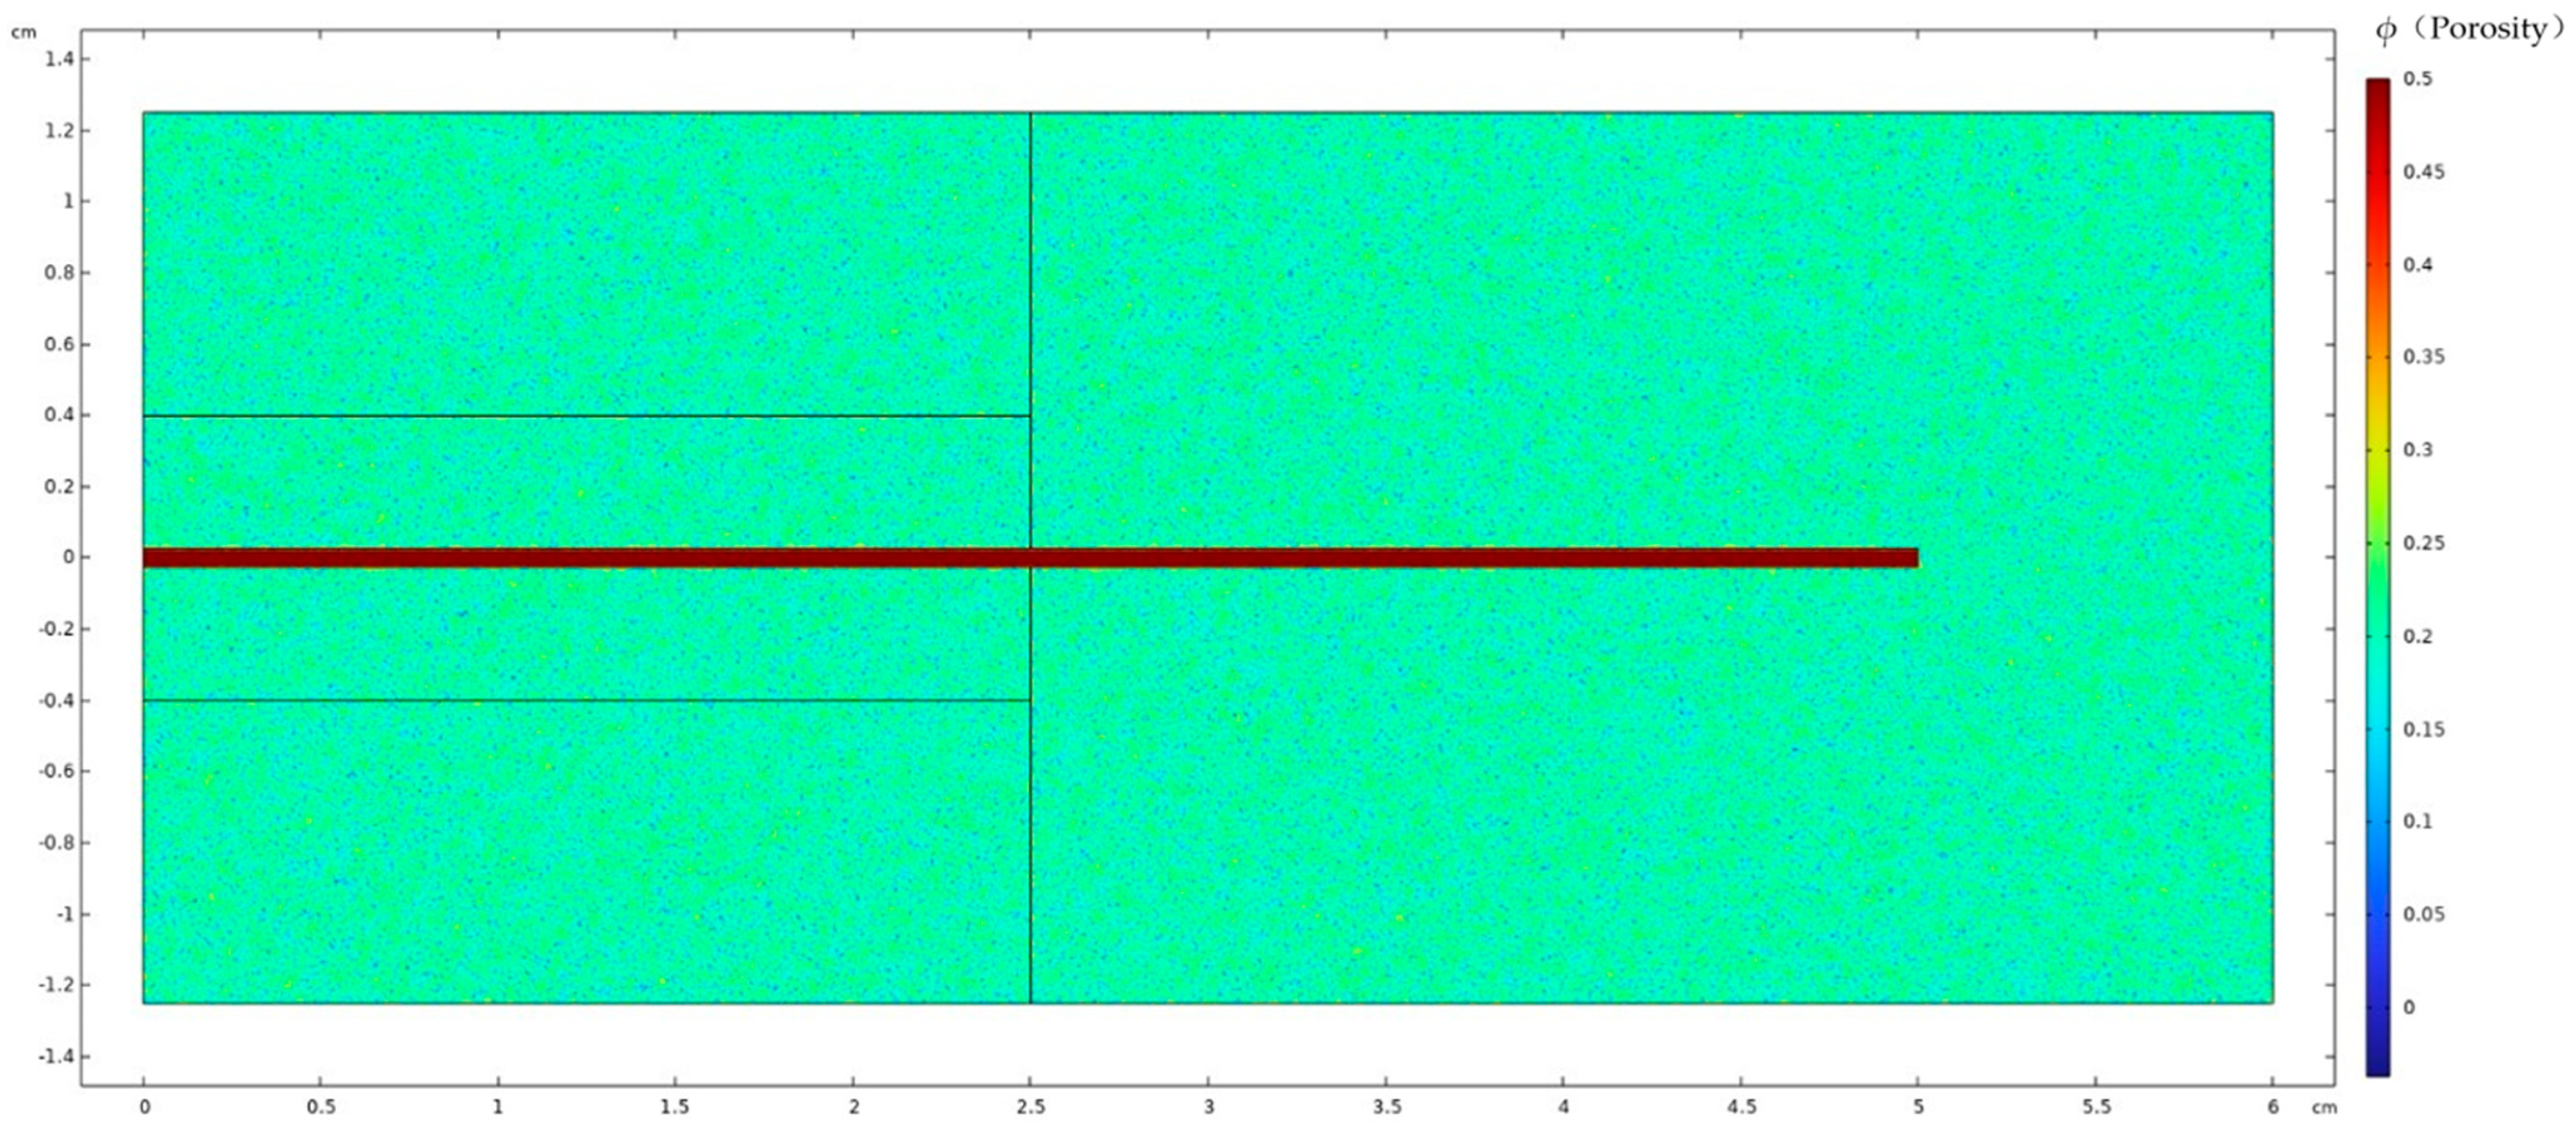
2.3. Parameter Assignment
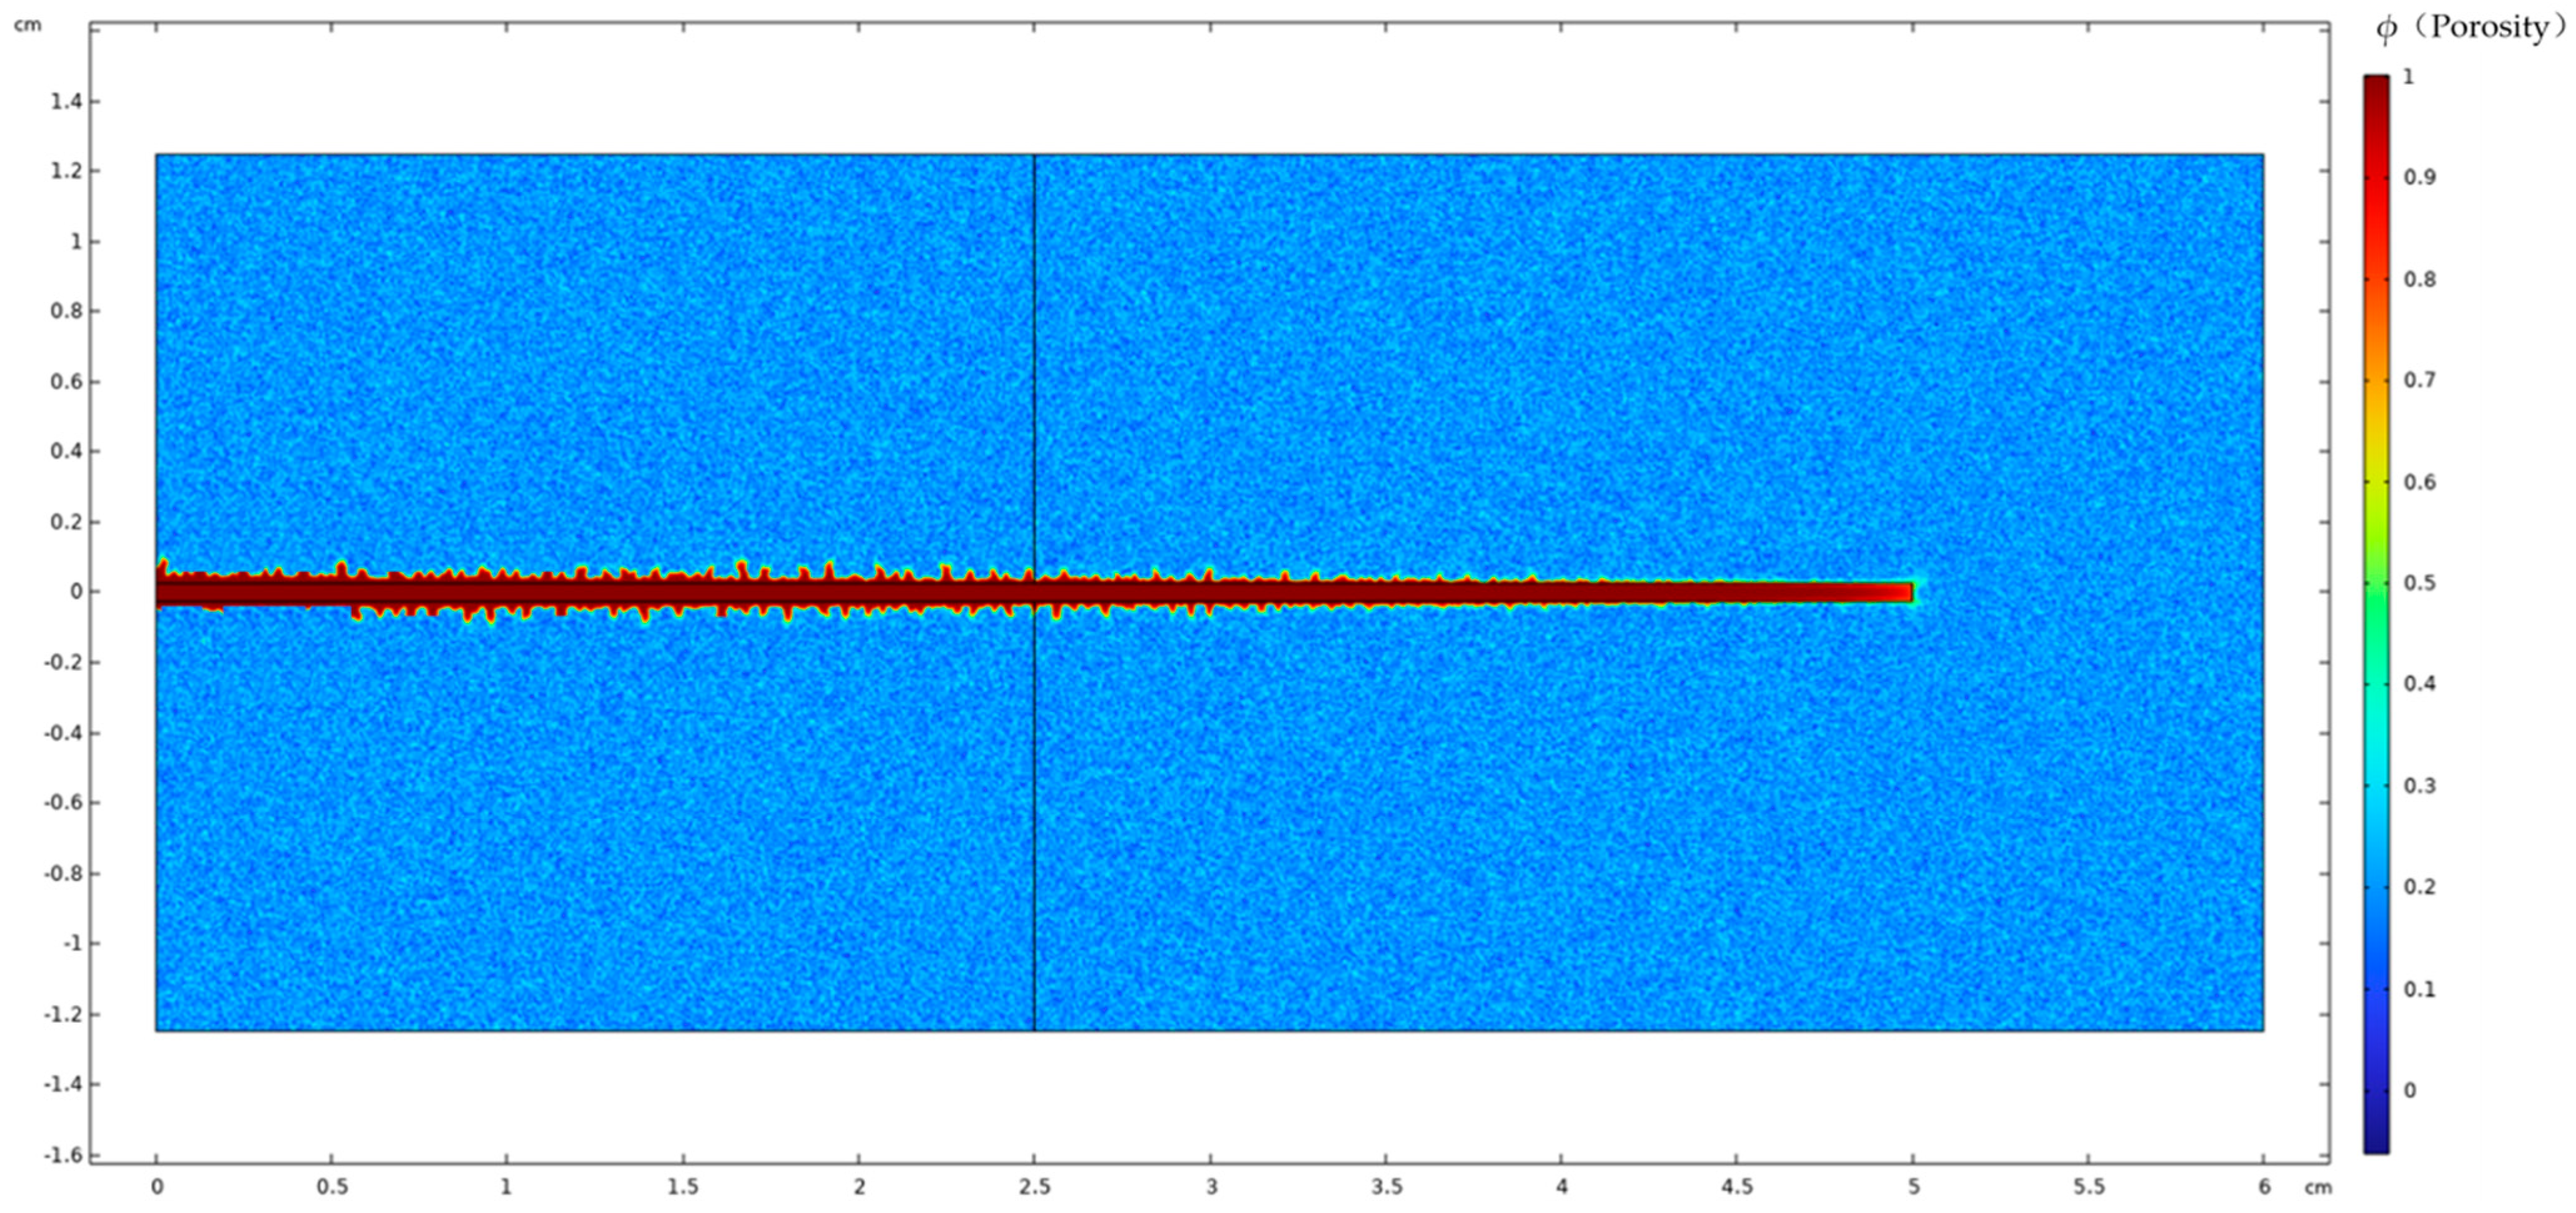
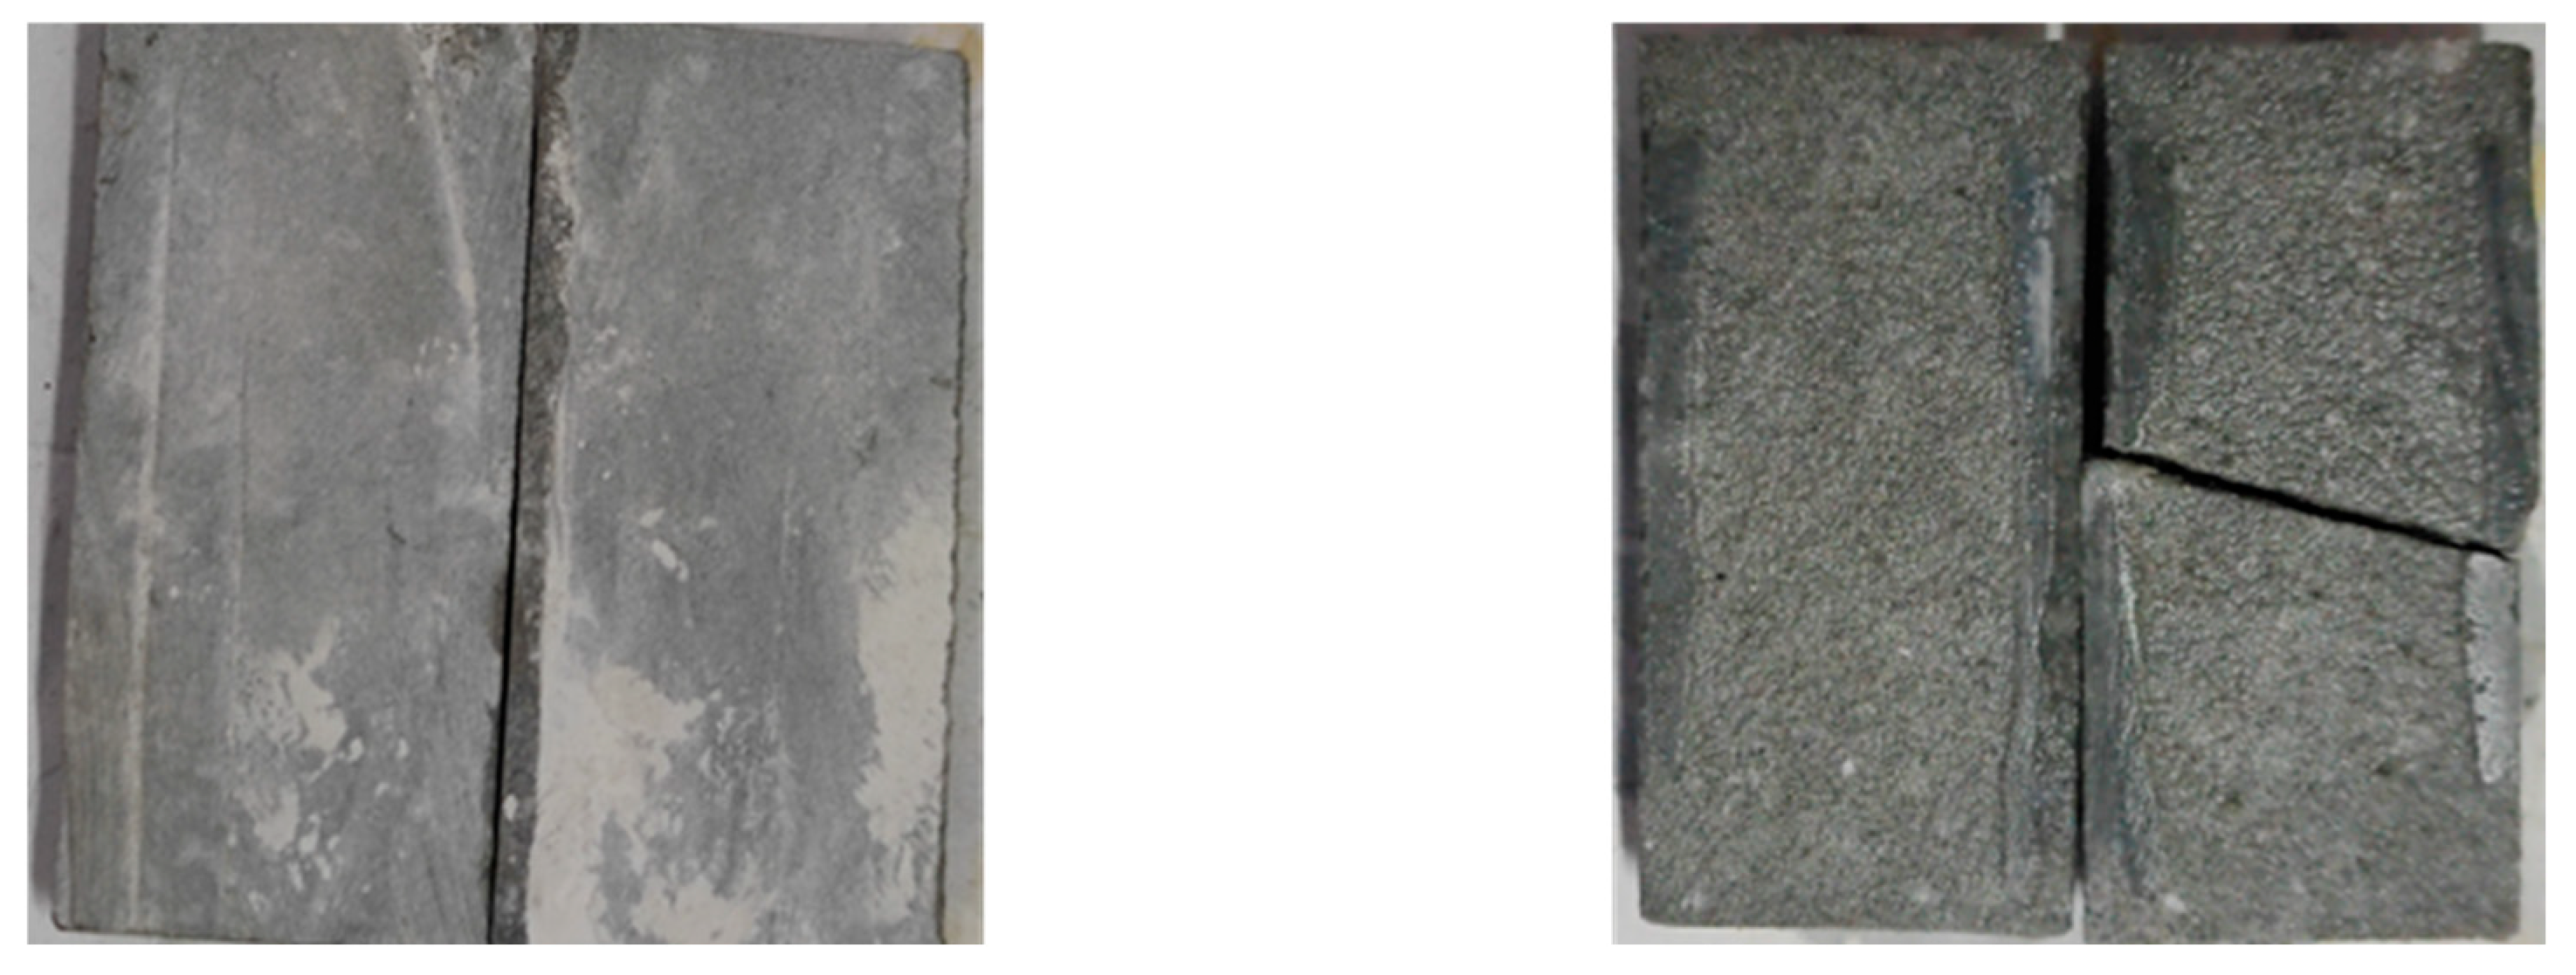
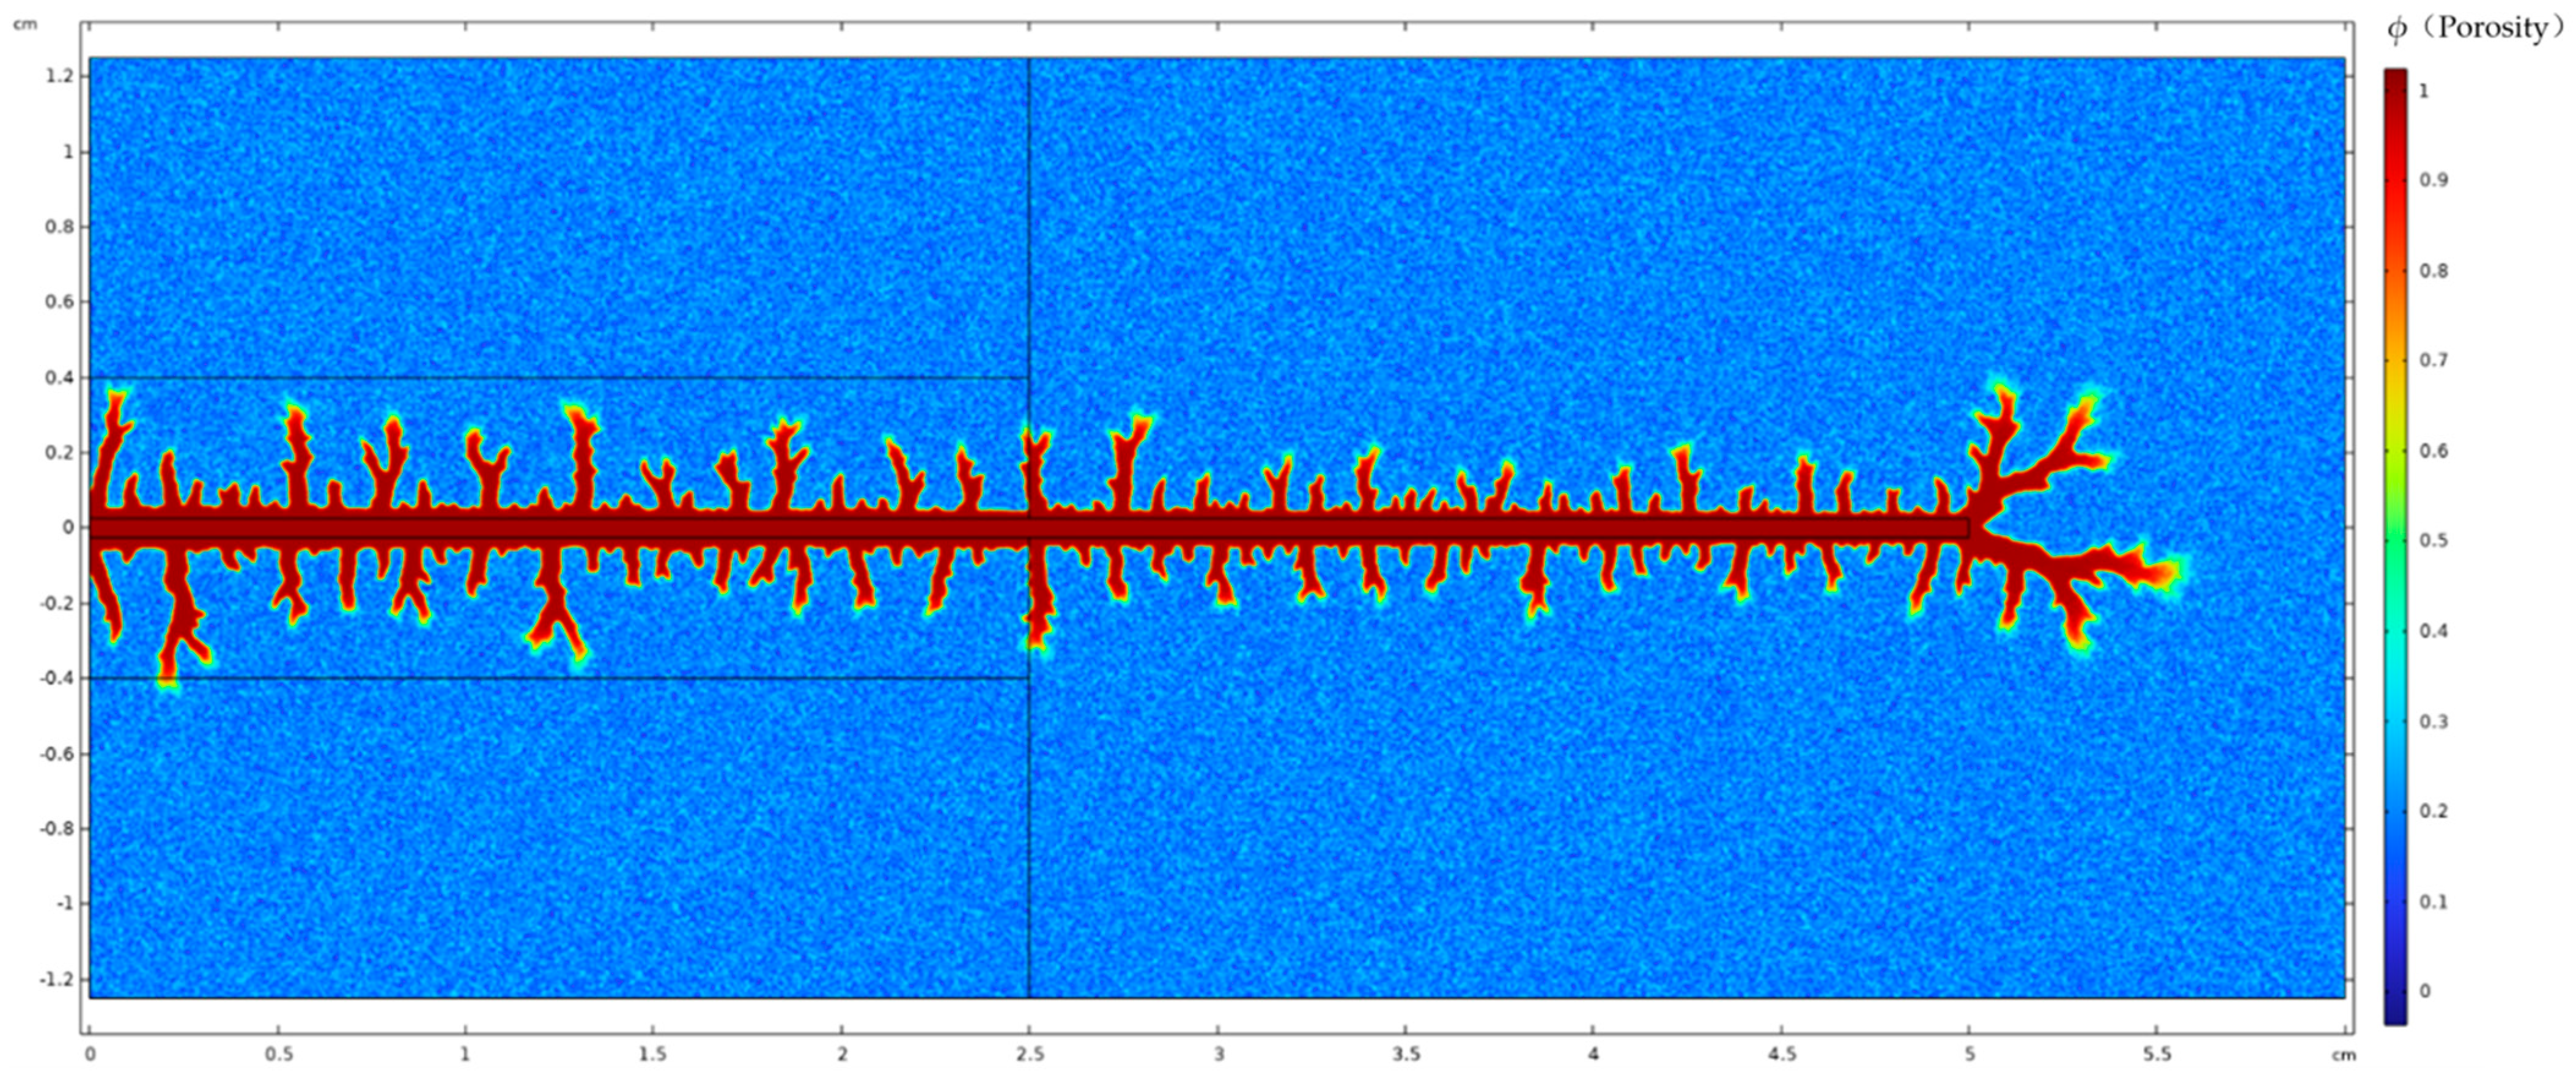
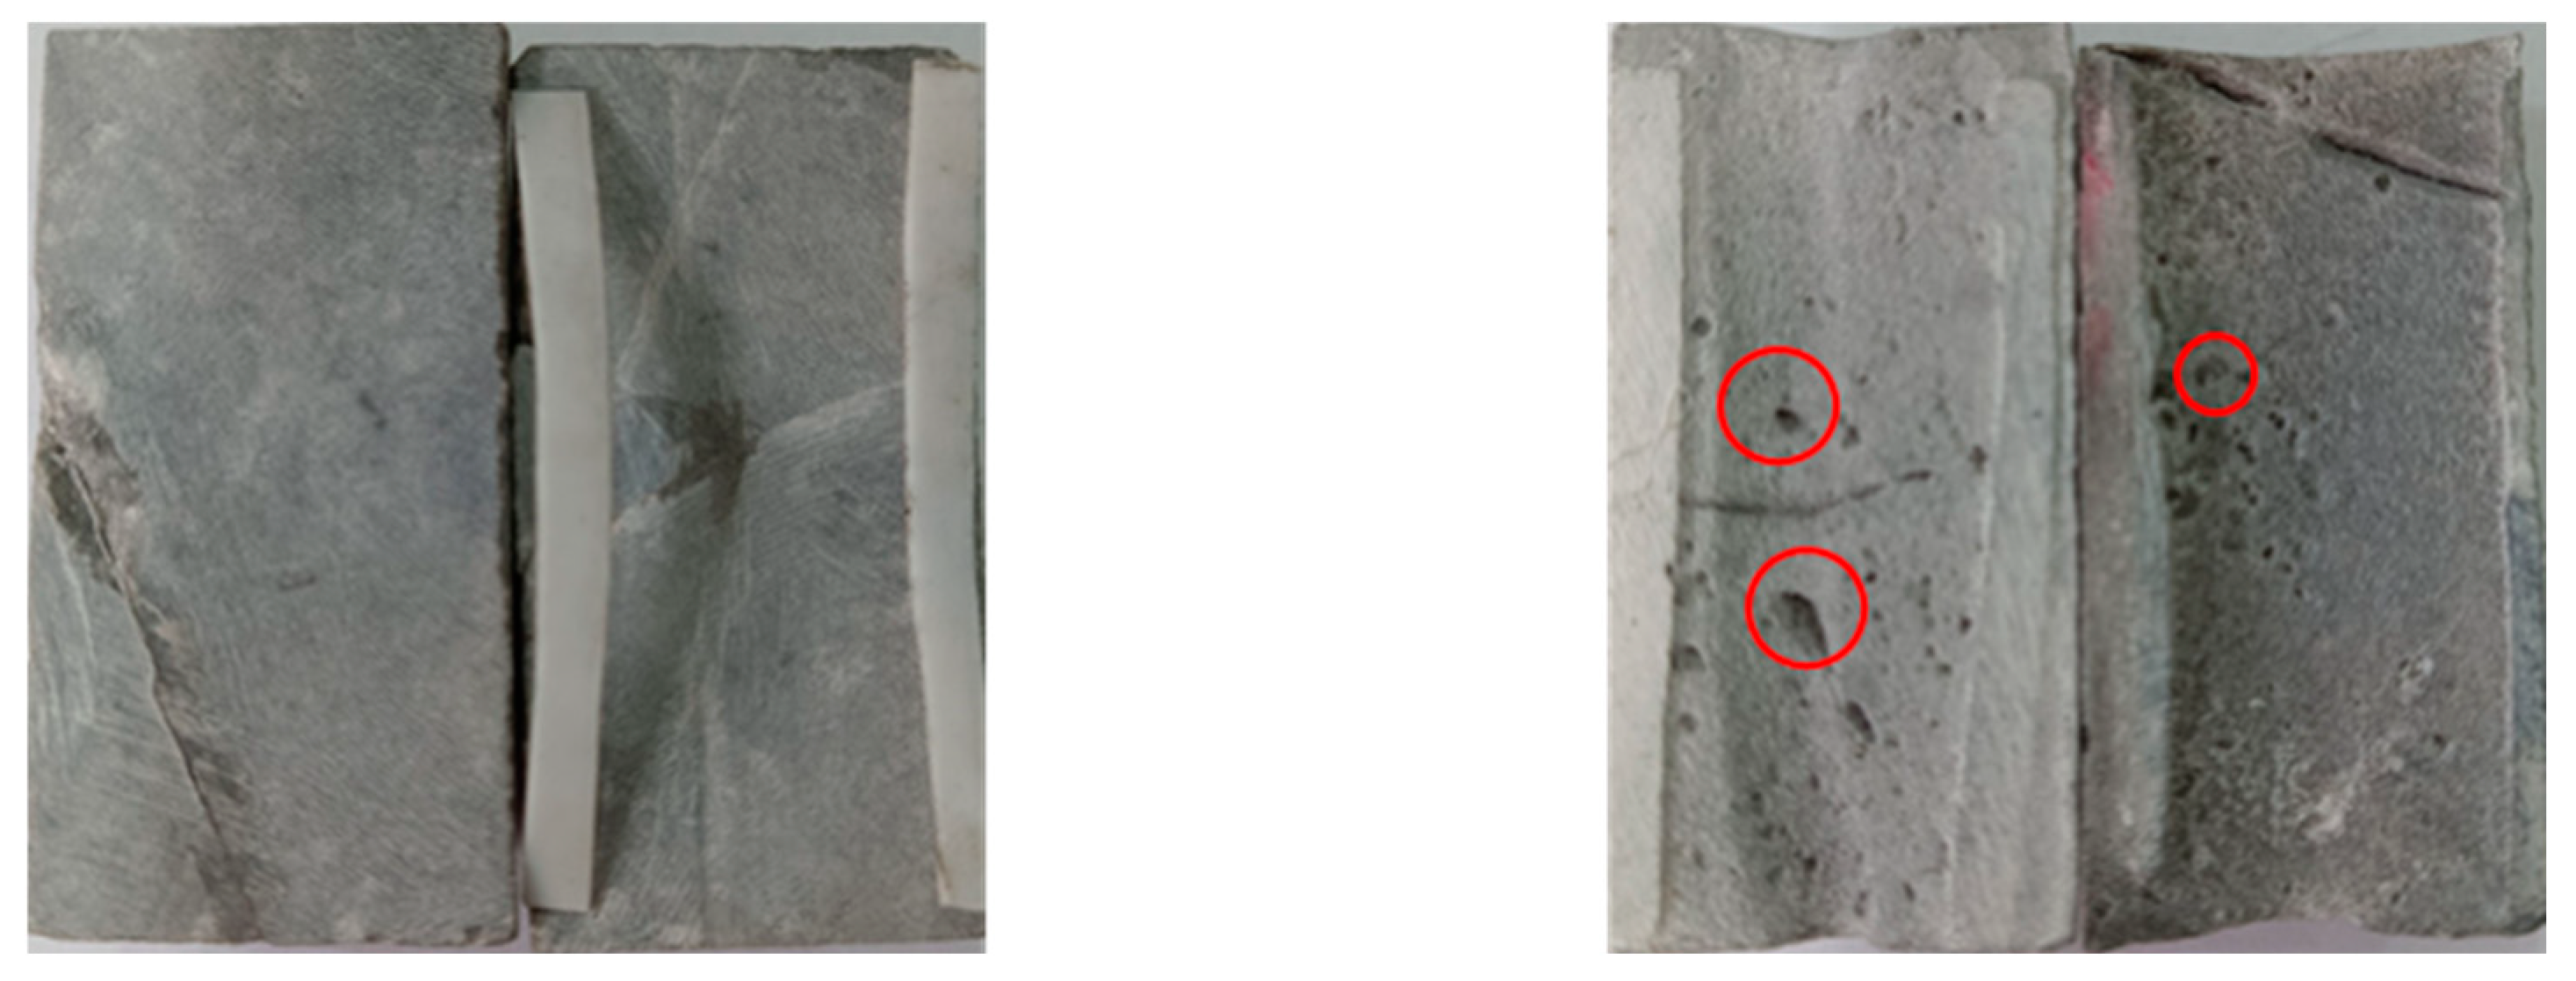
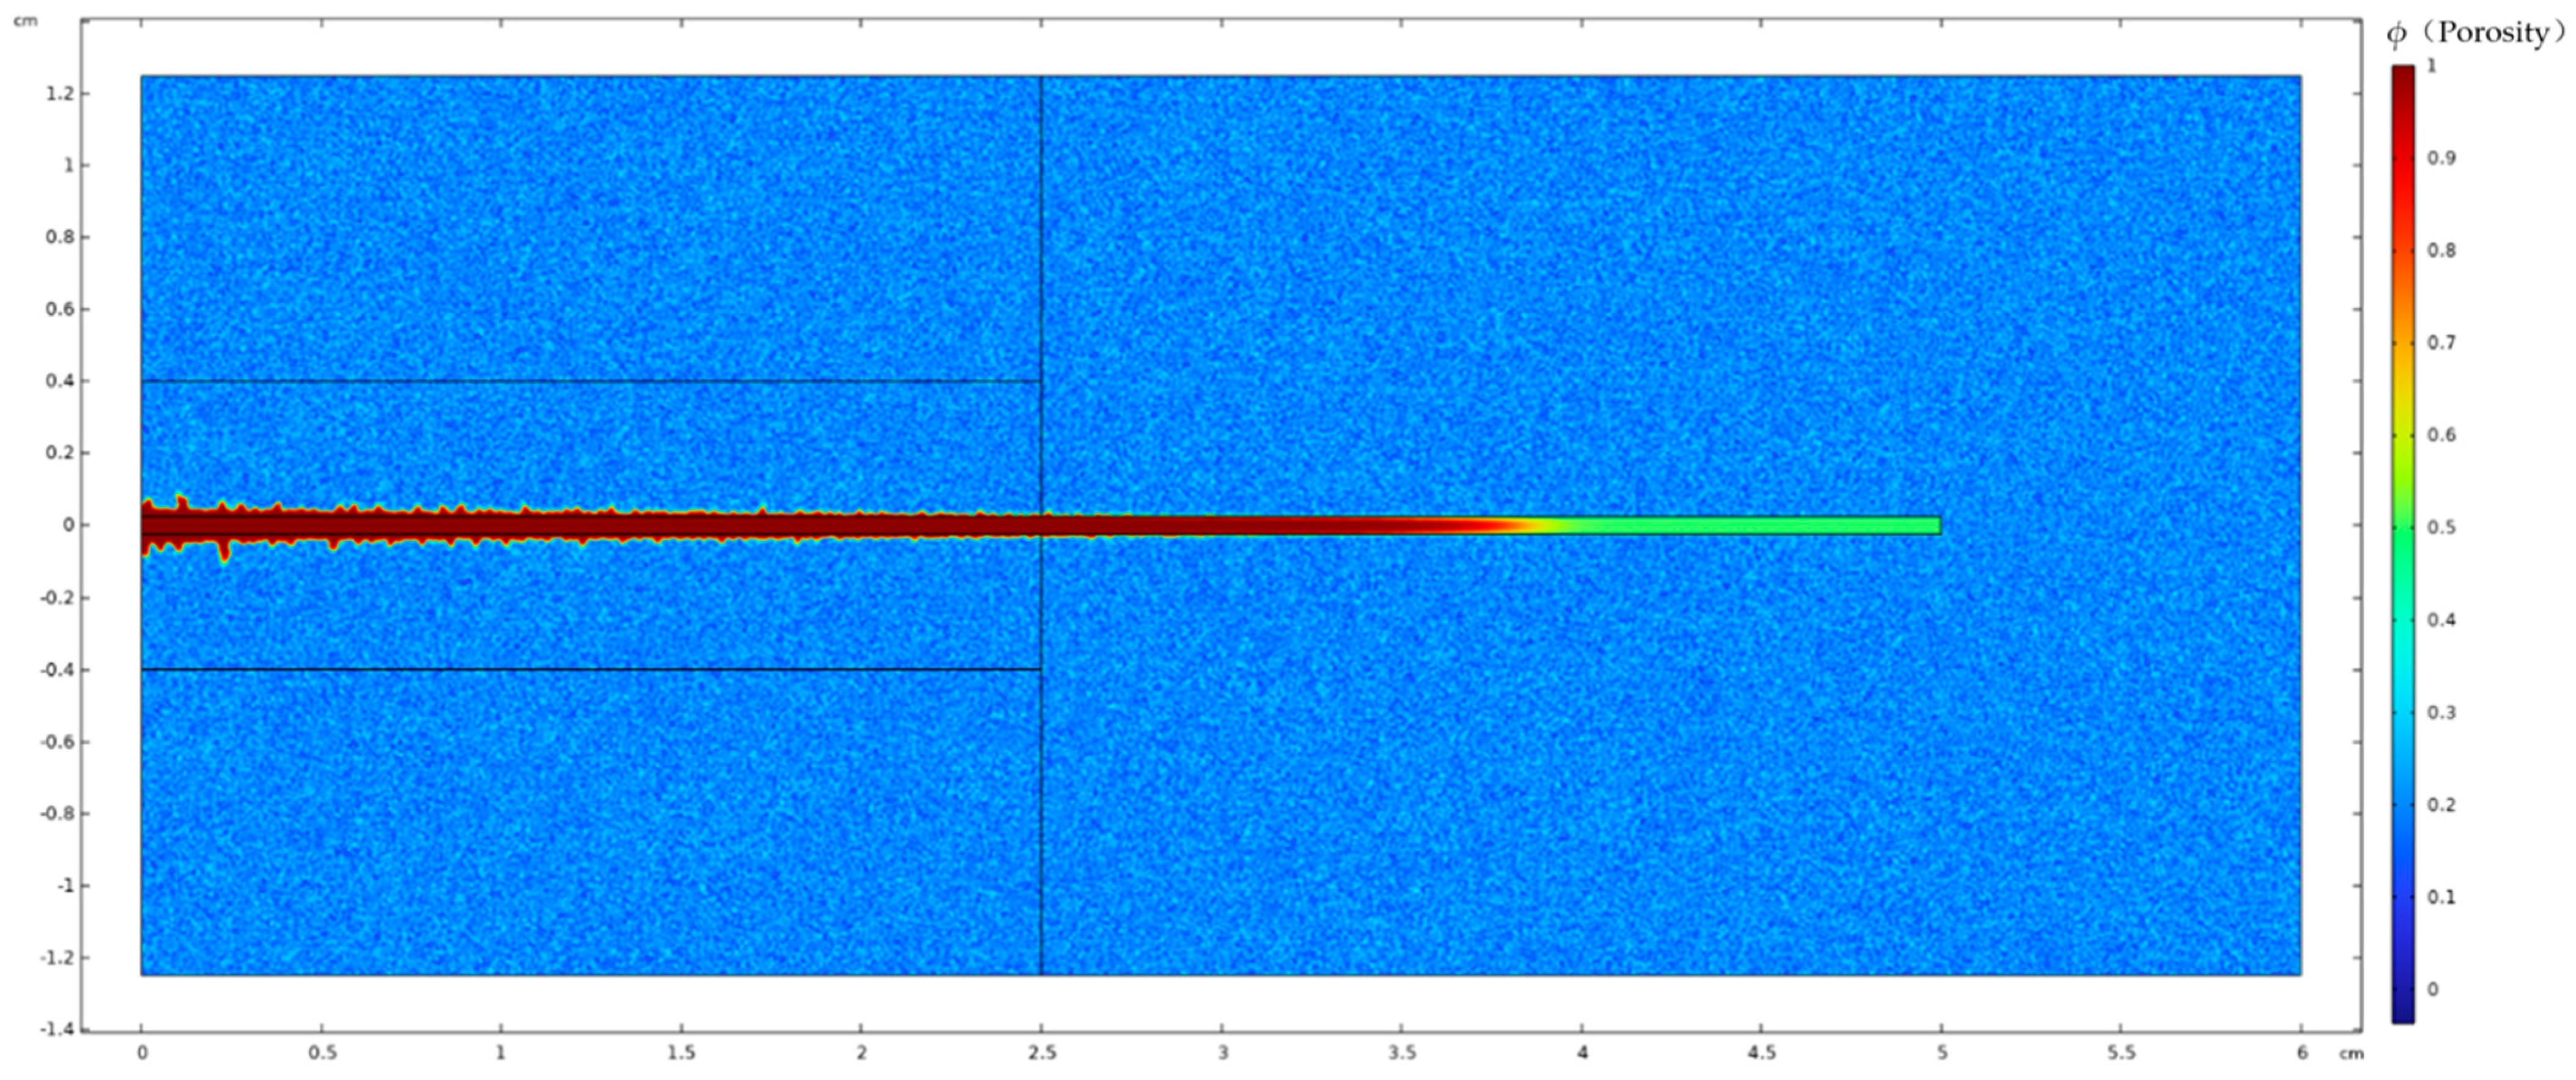
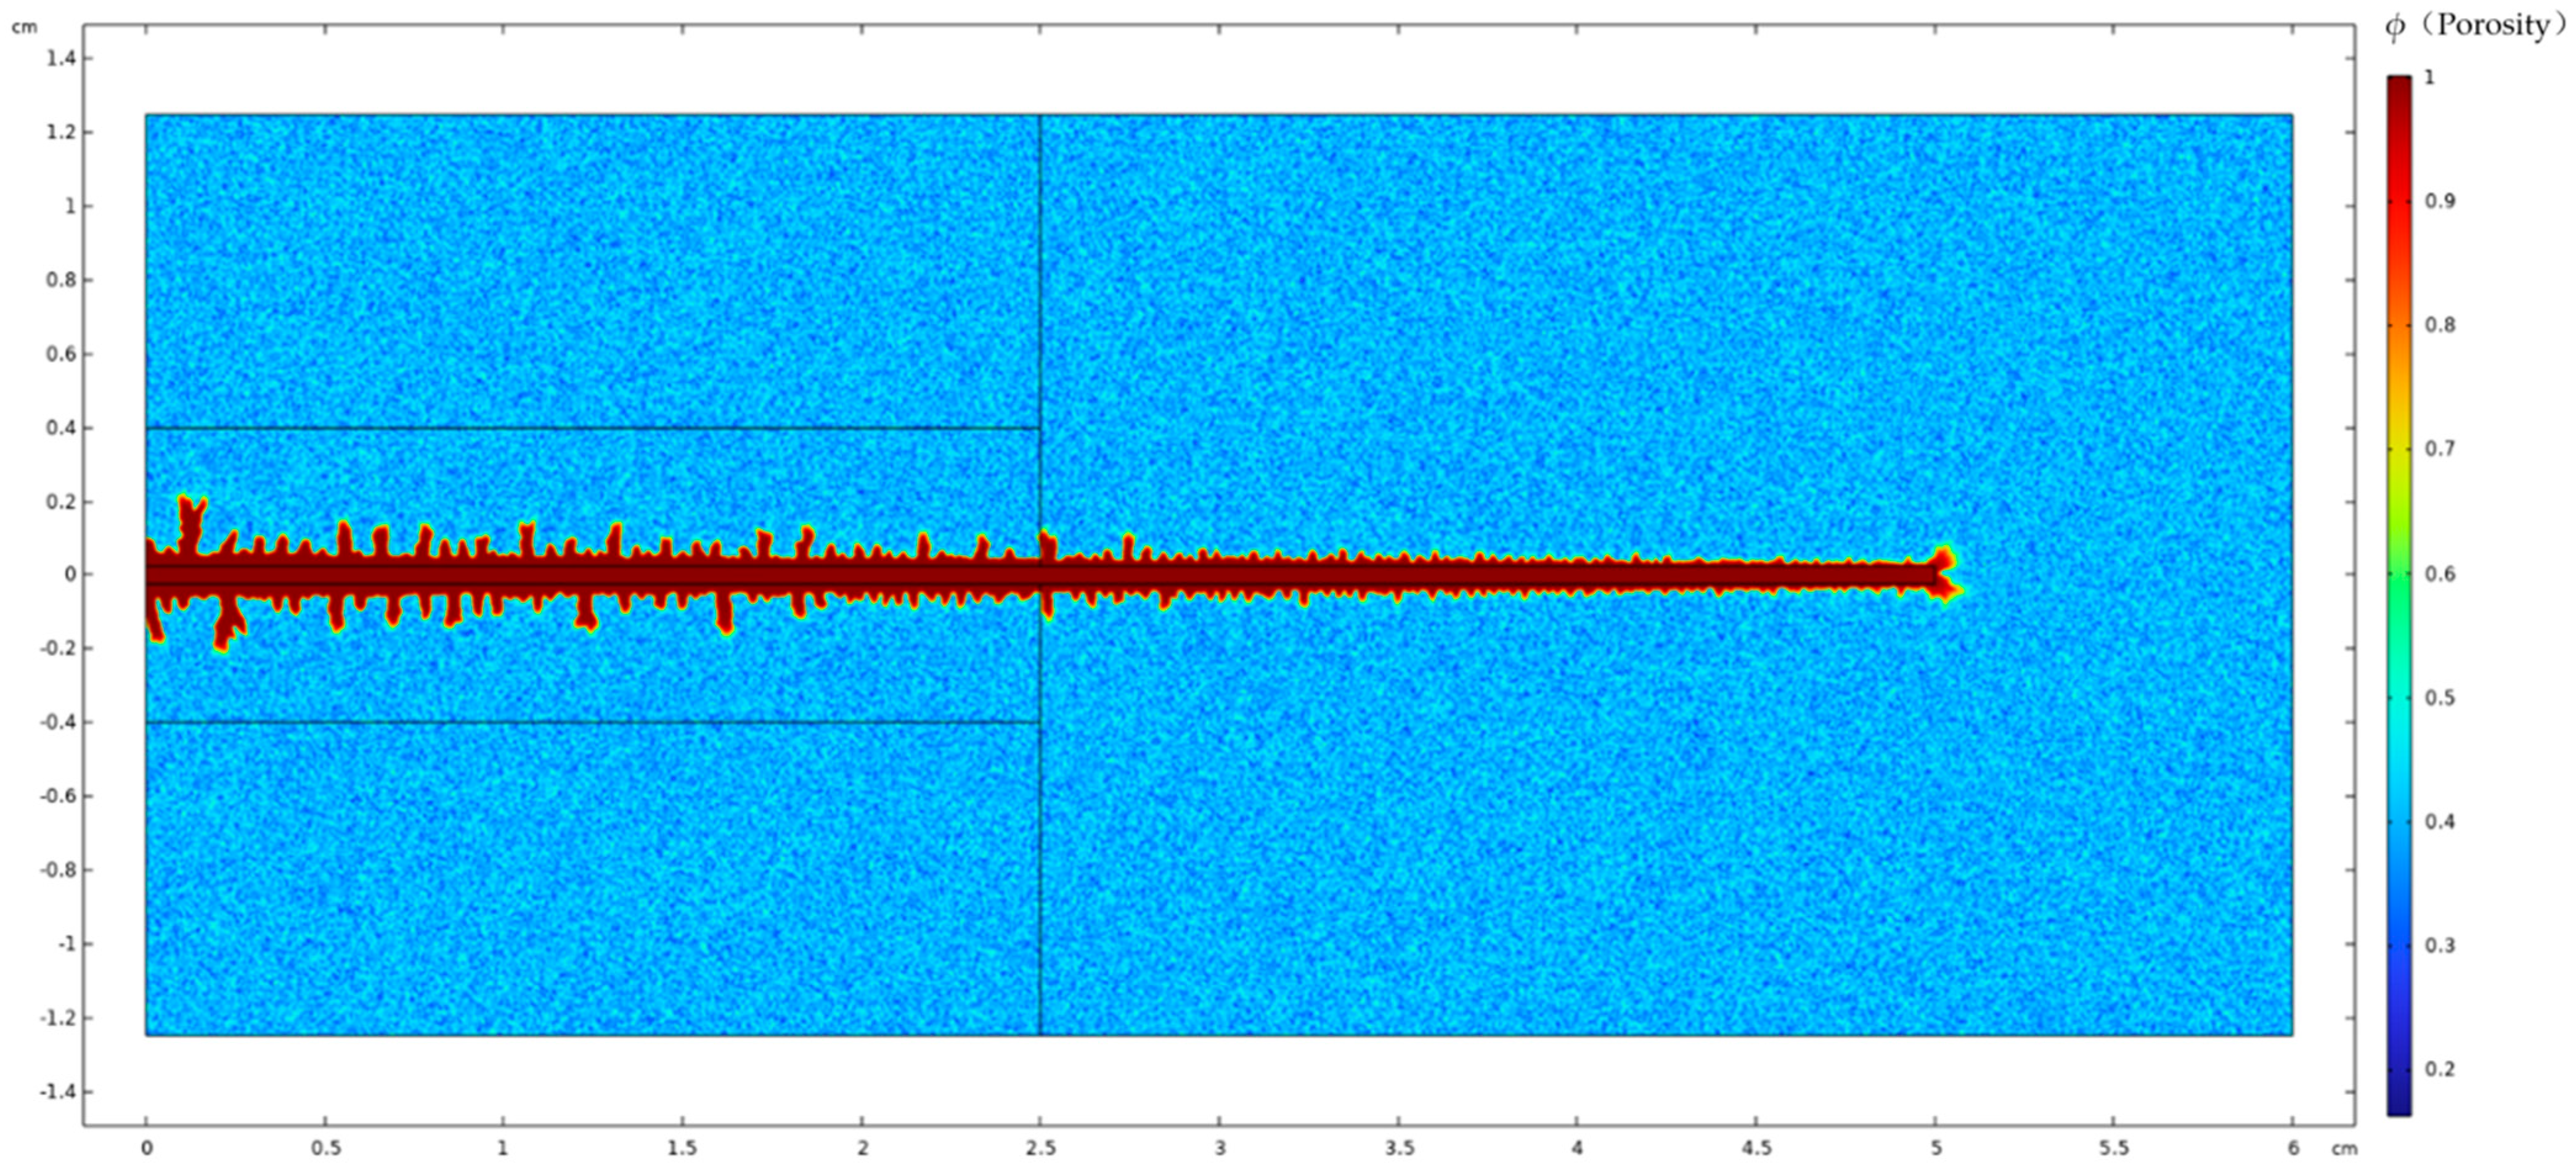
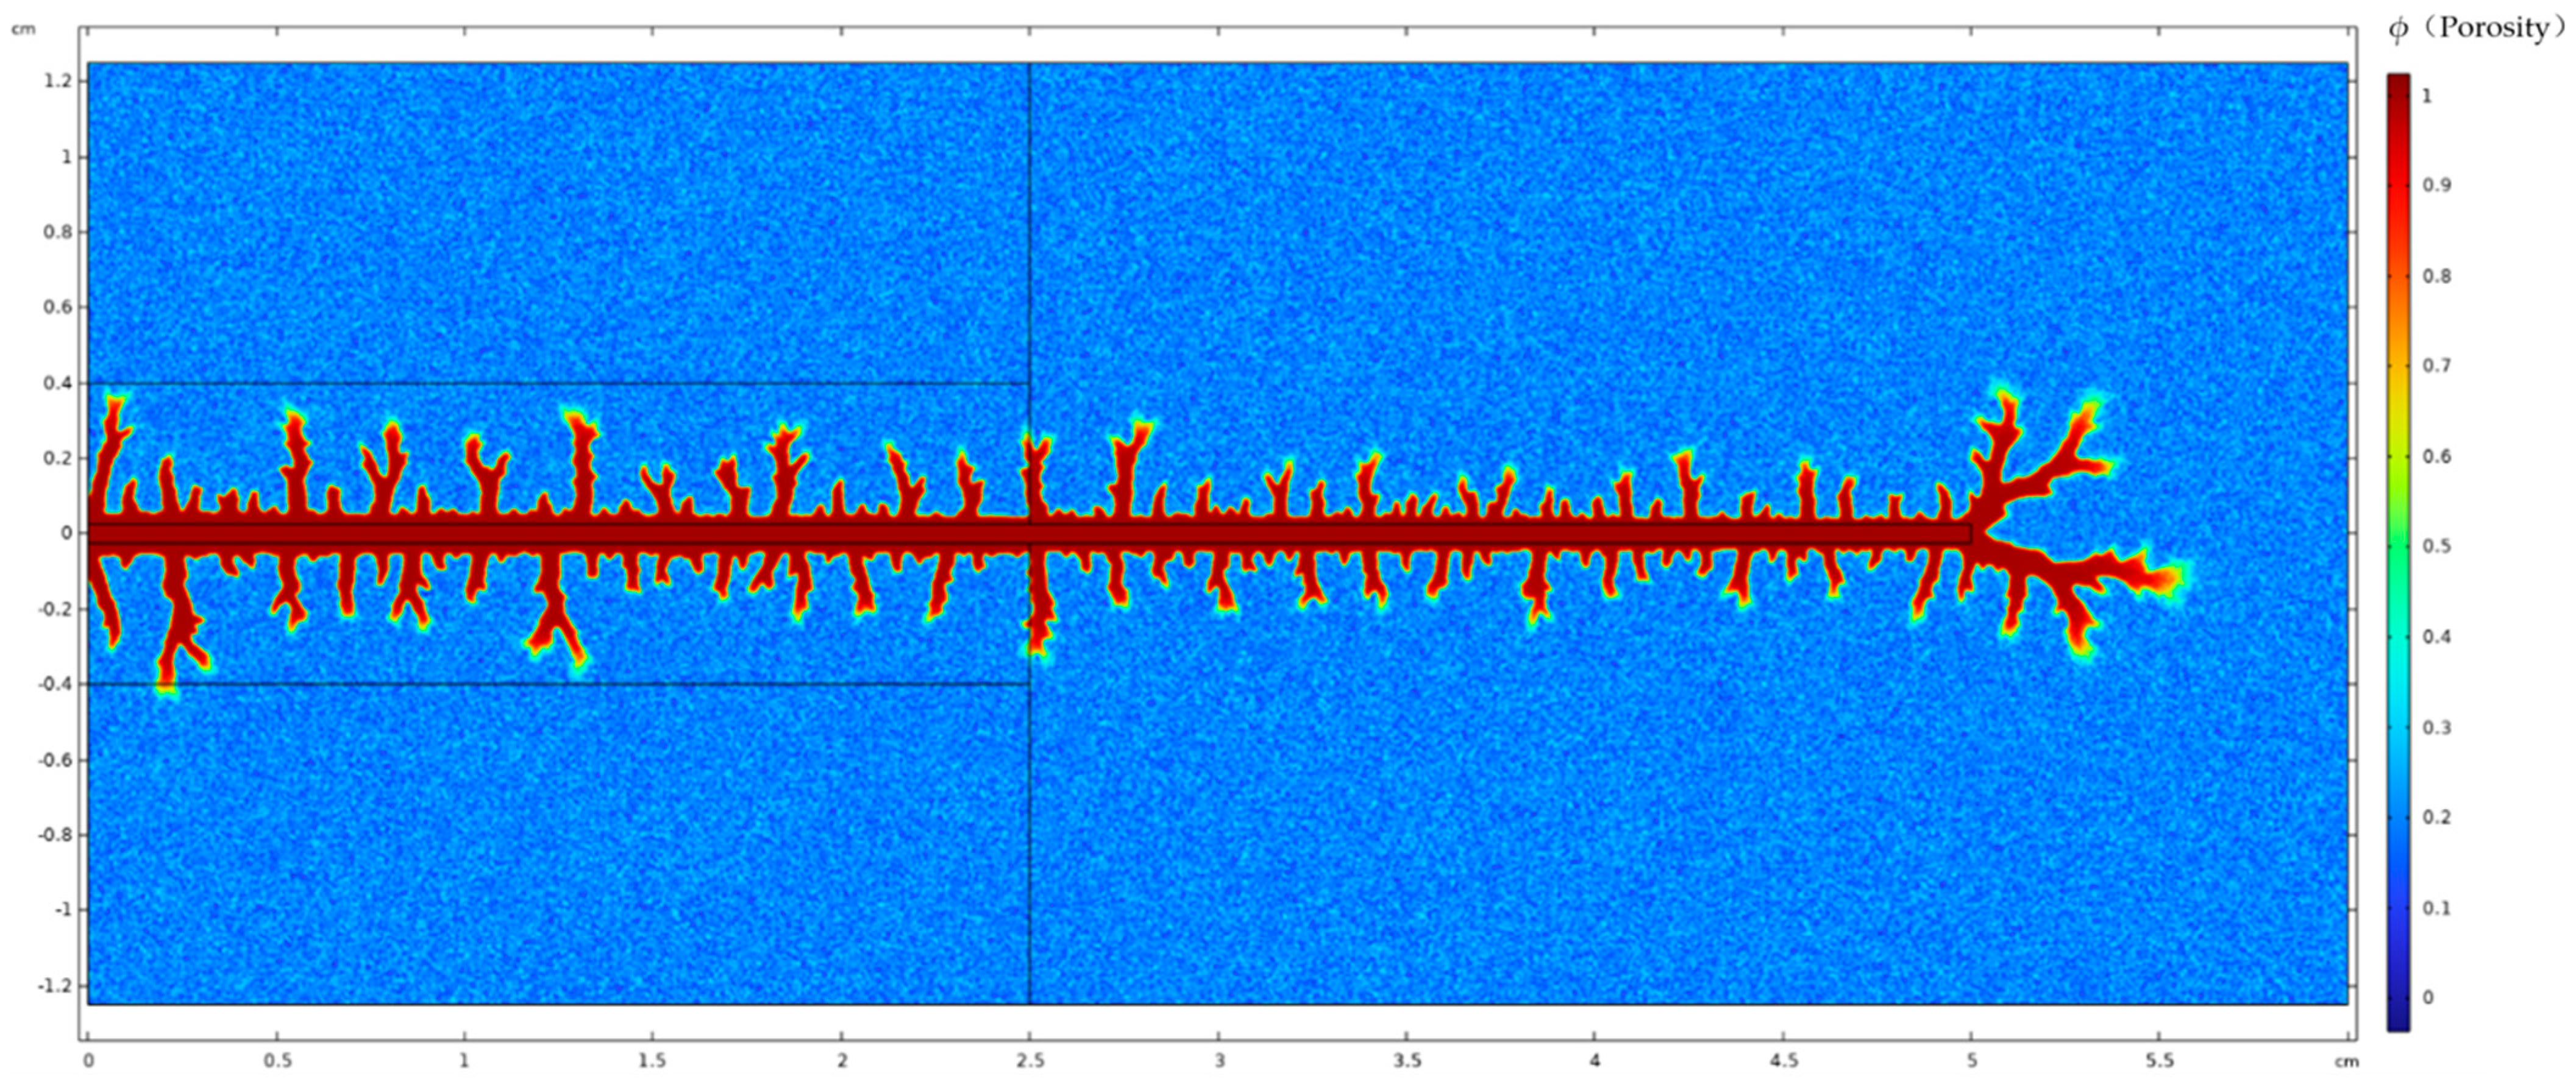
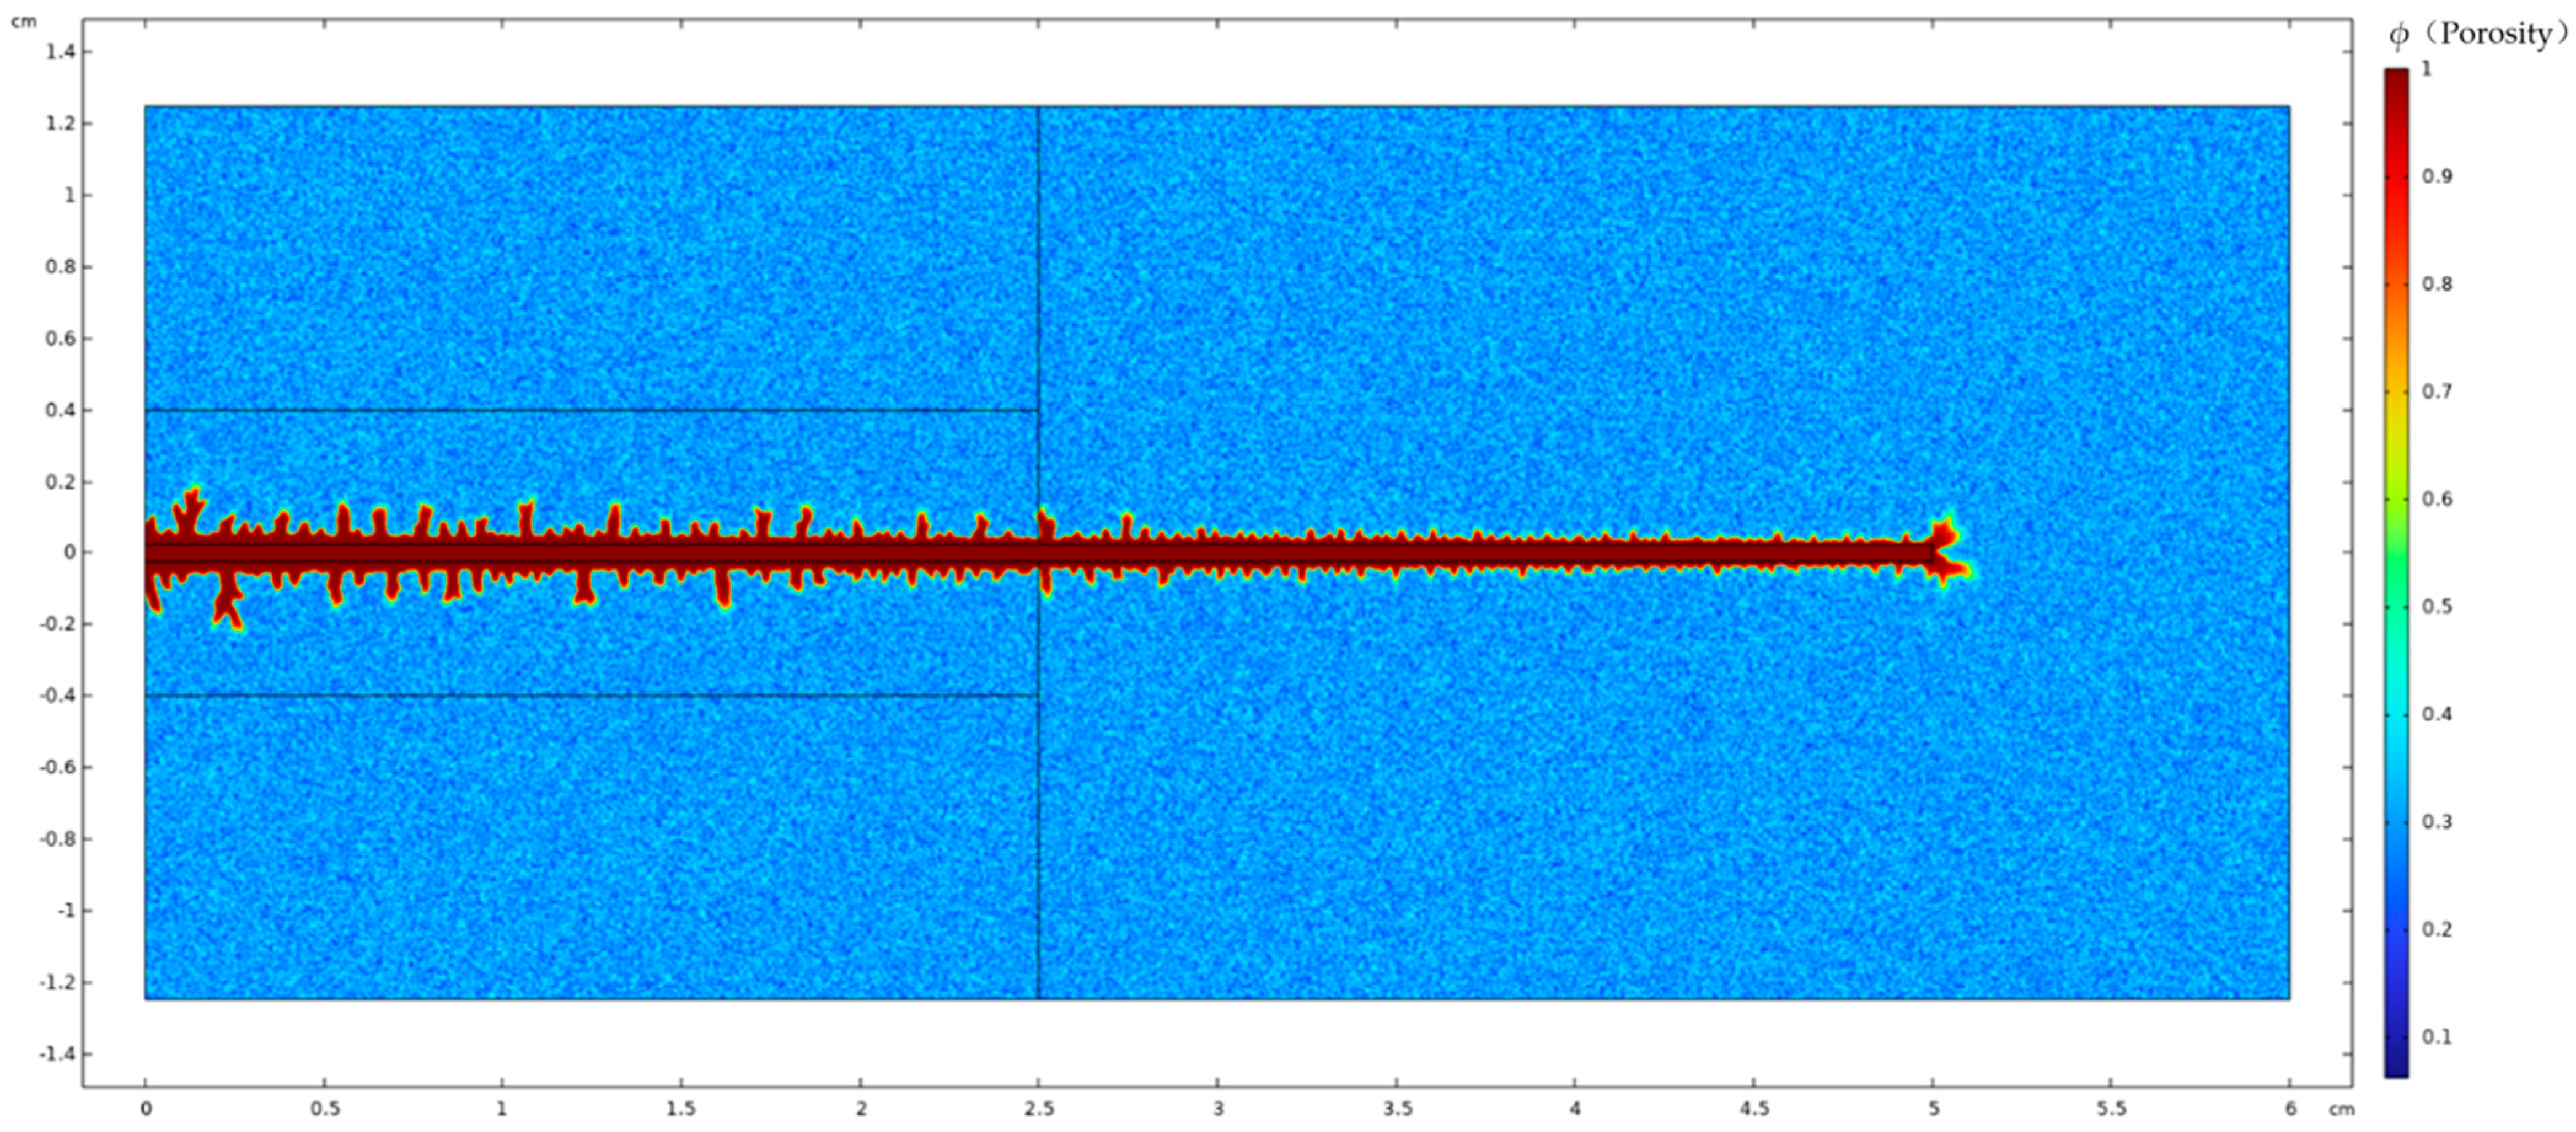
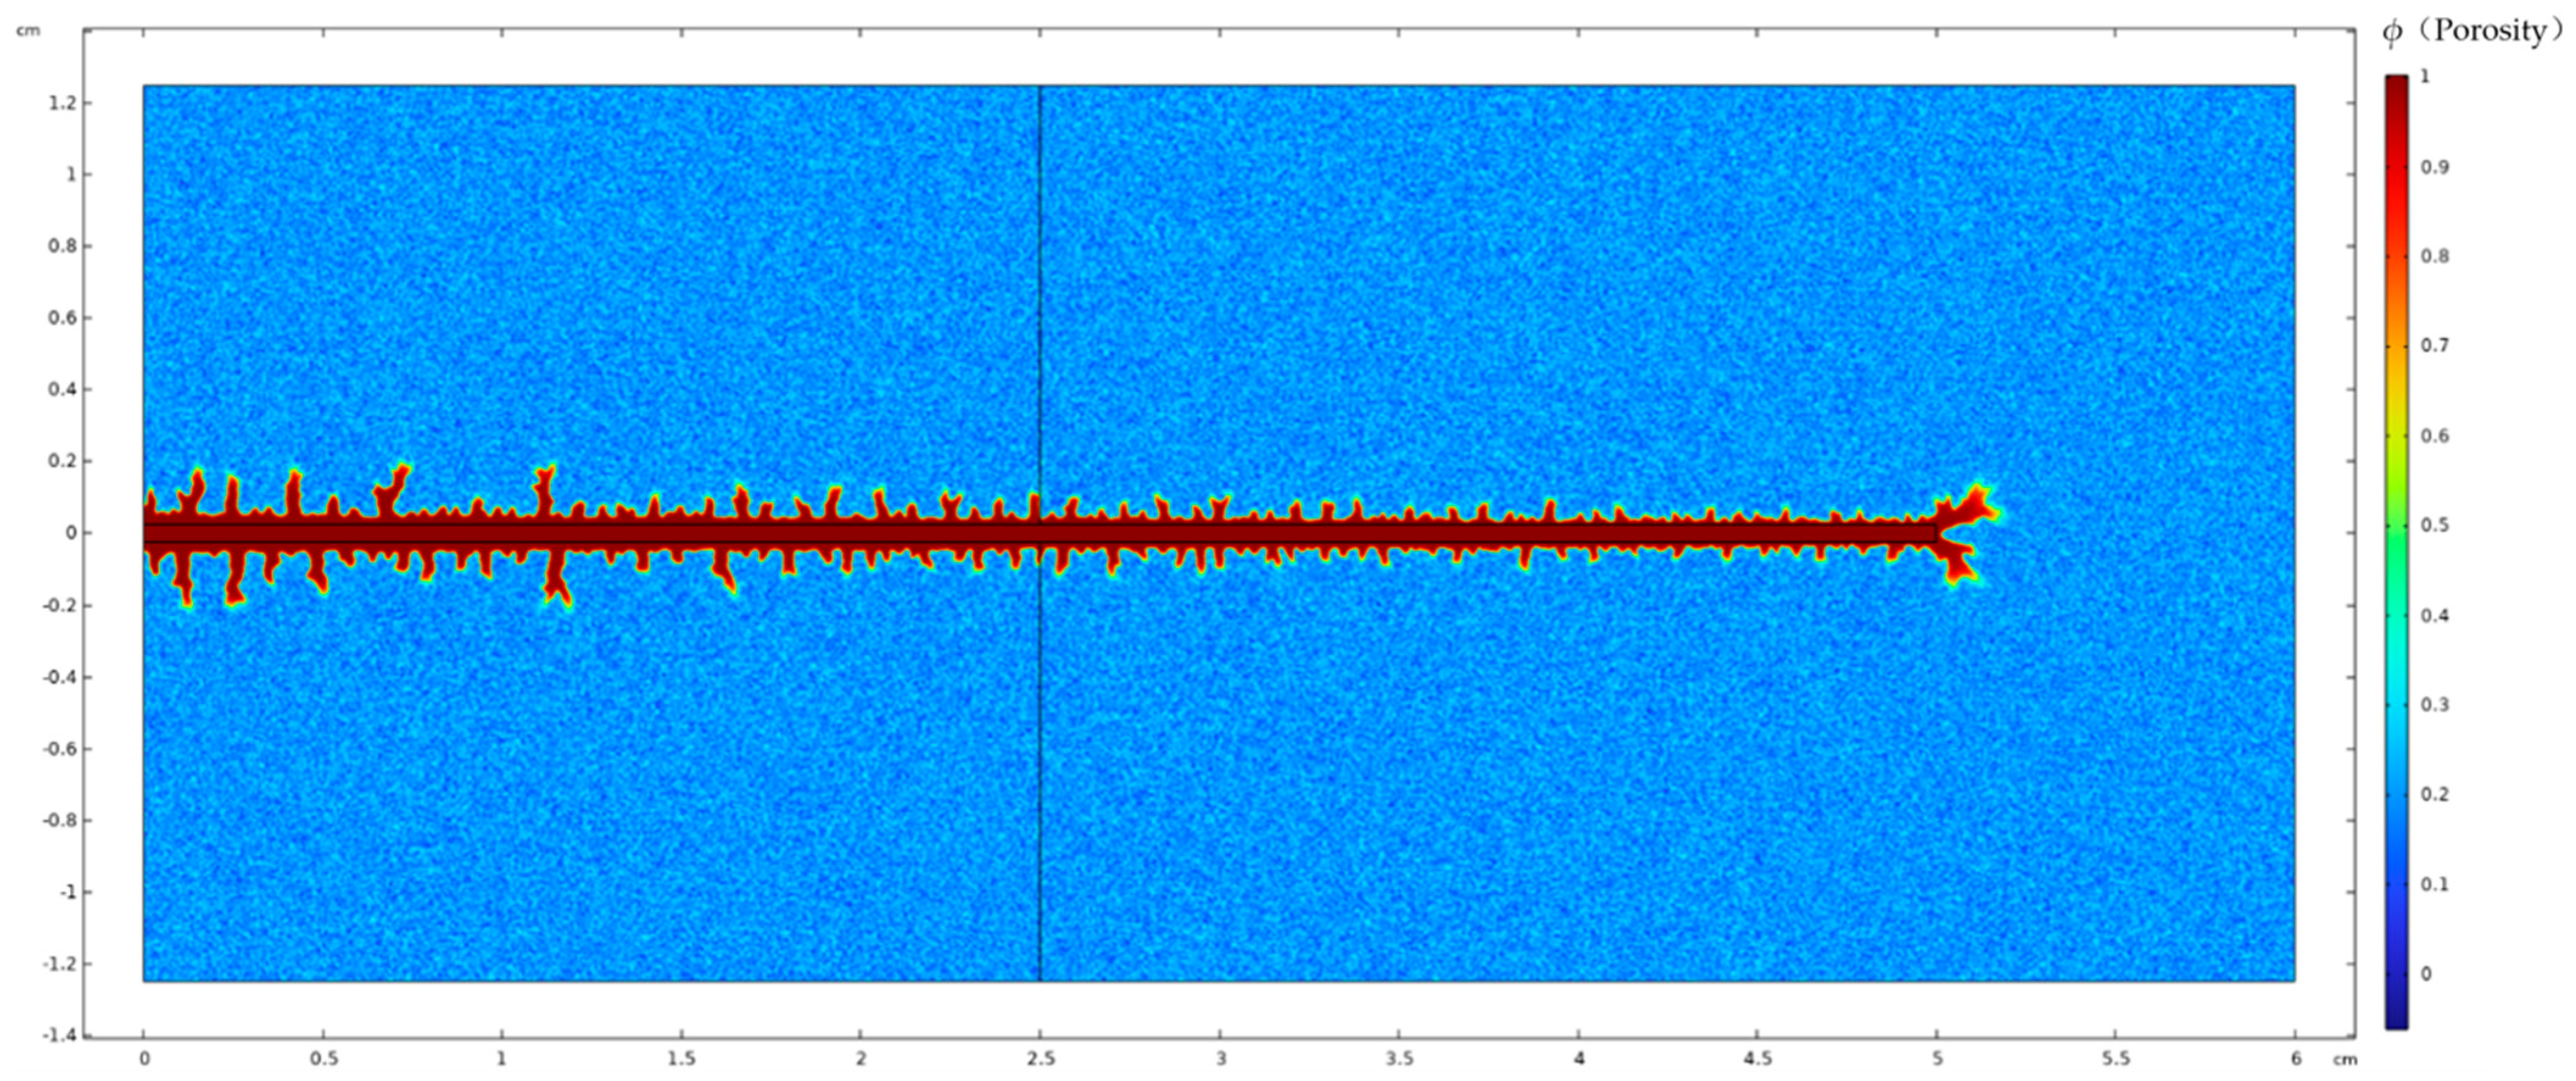
3. Model Validation Based on Physical Experiments
4. Analysis of Influencing Factors on Acid Fluid Filtration Loss at Fracture Walls
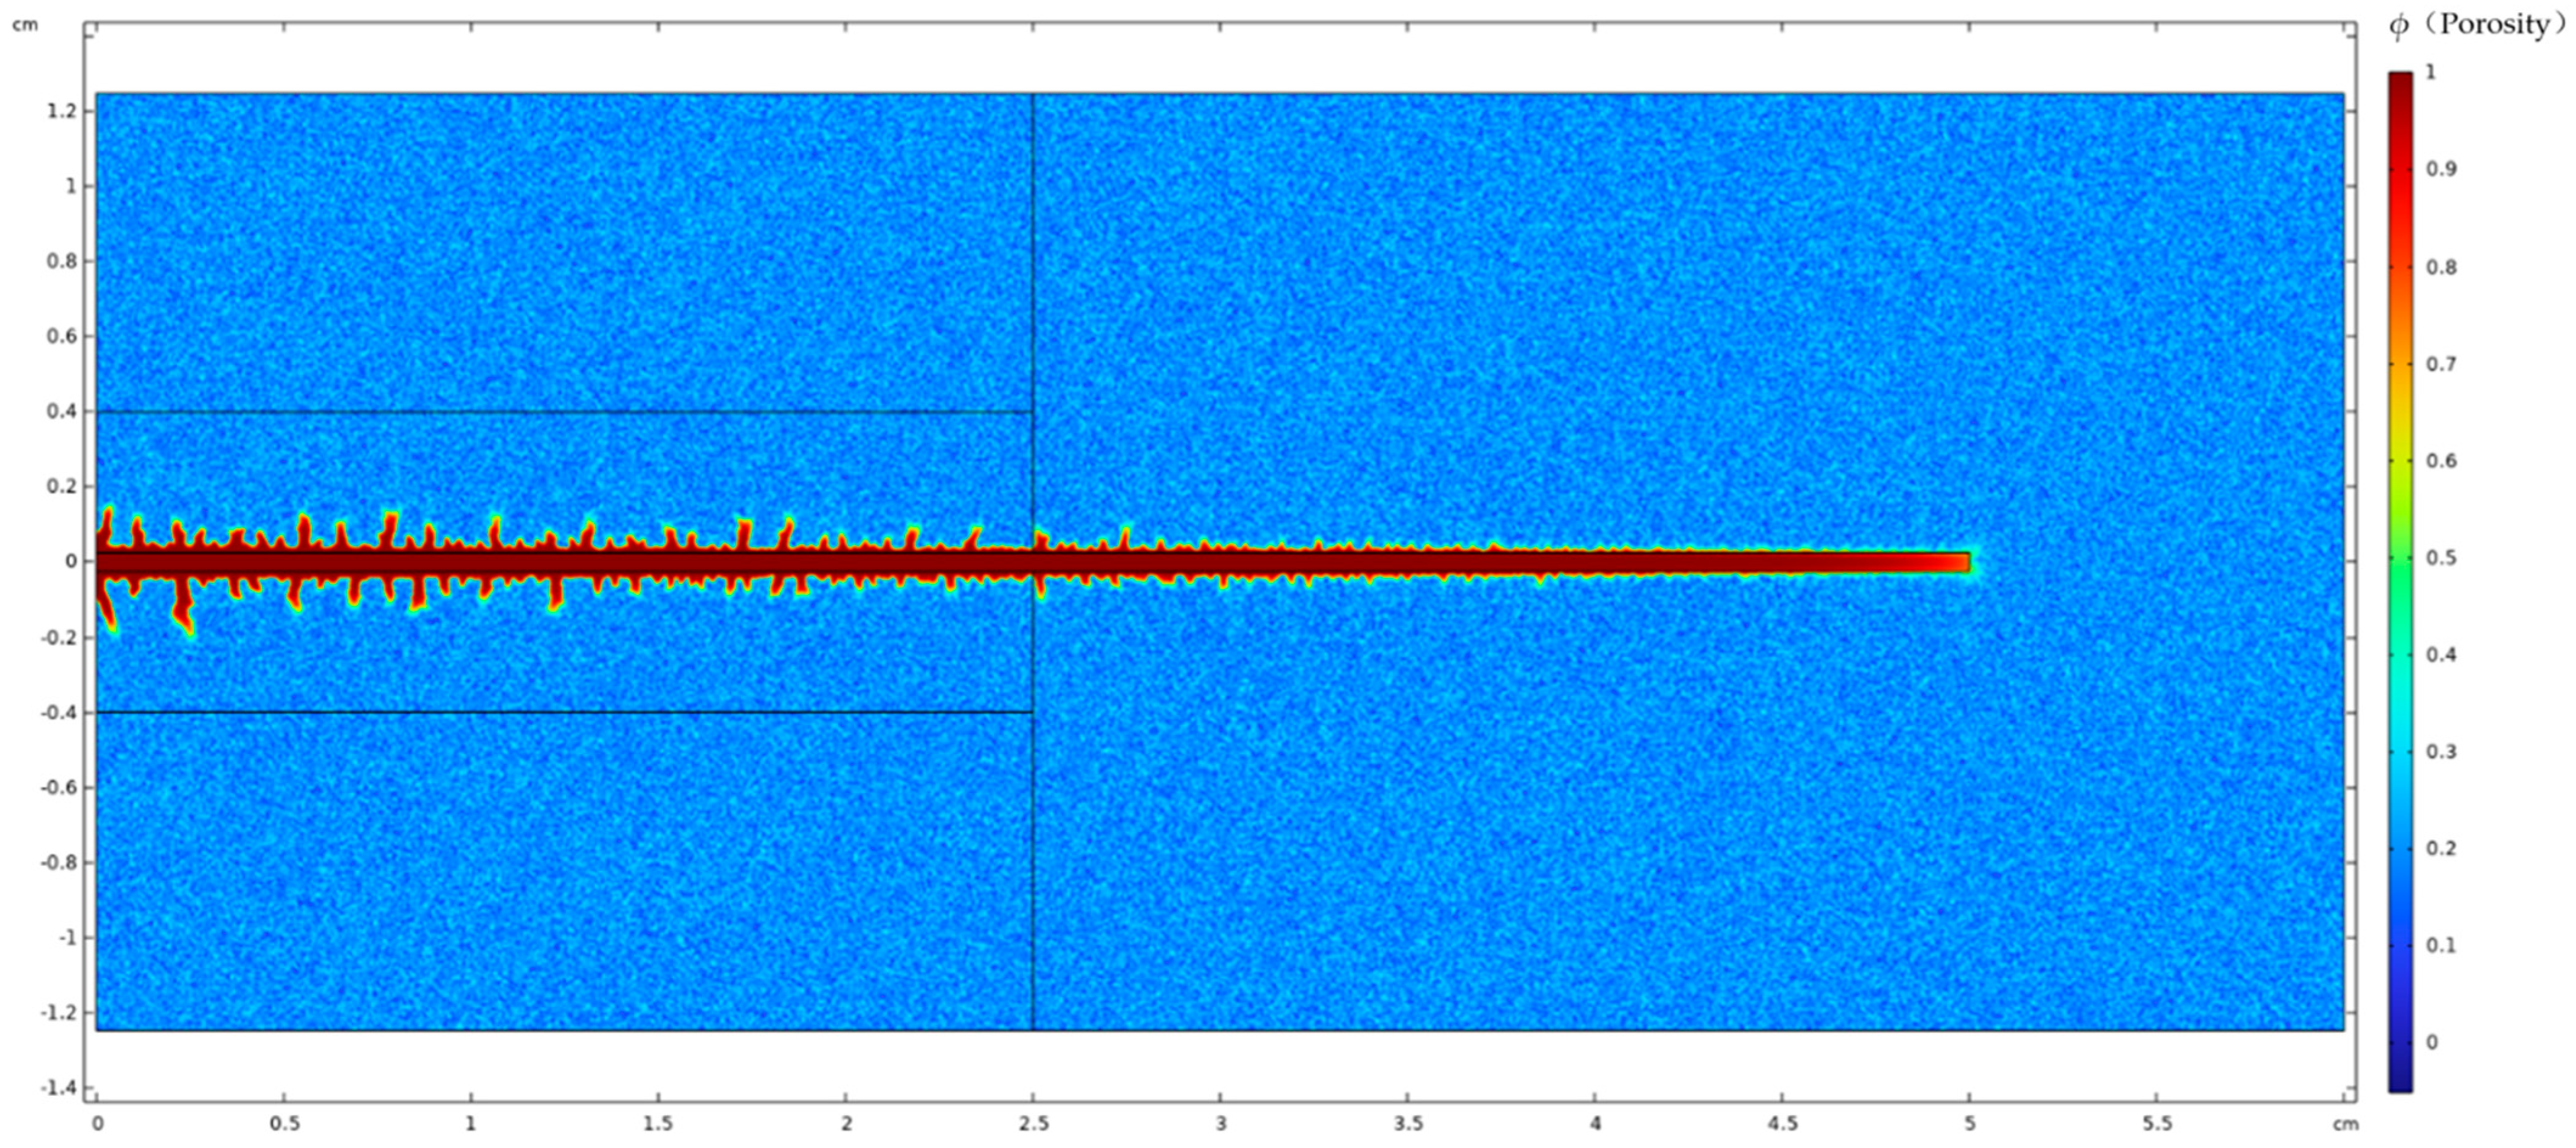
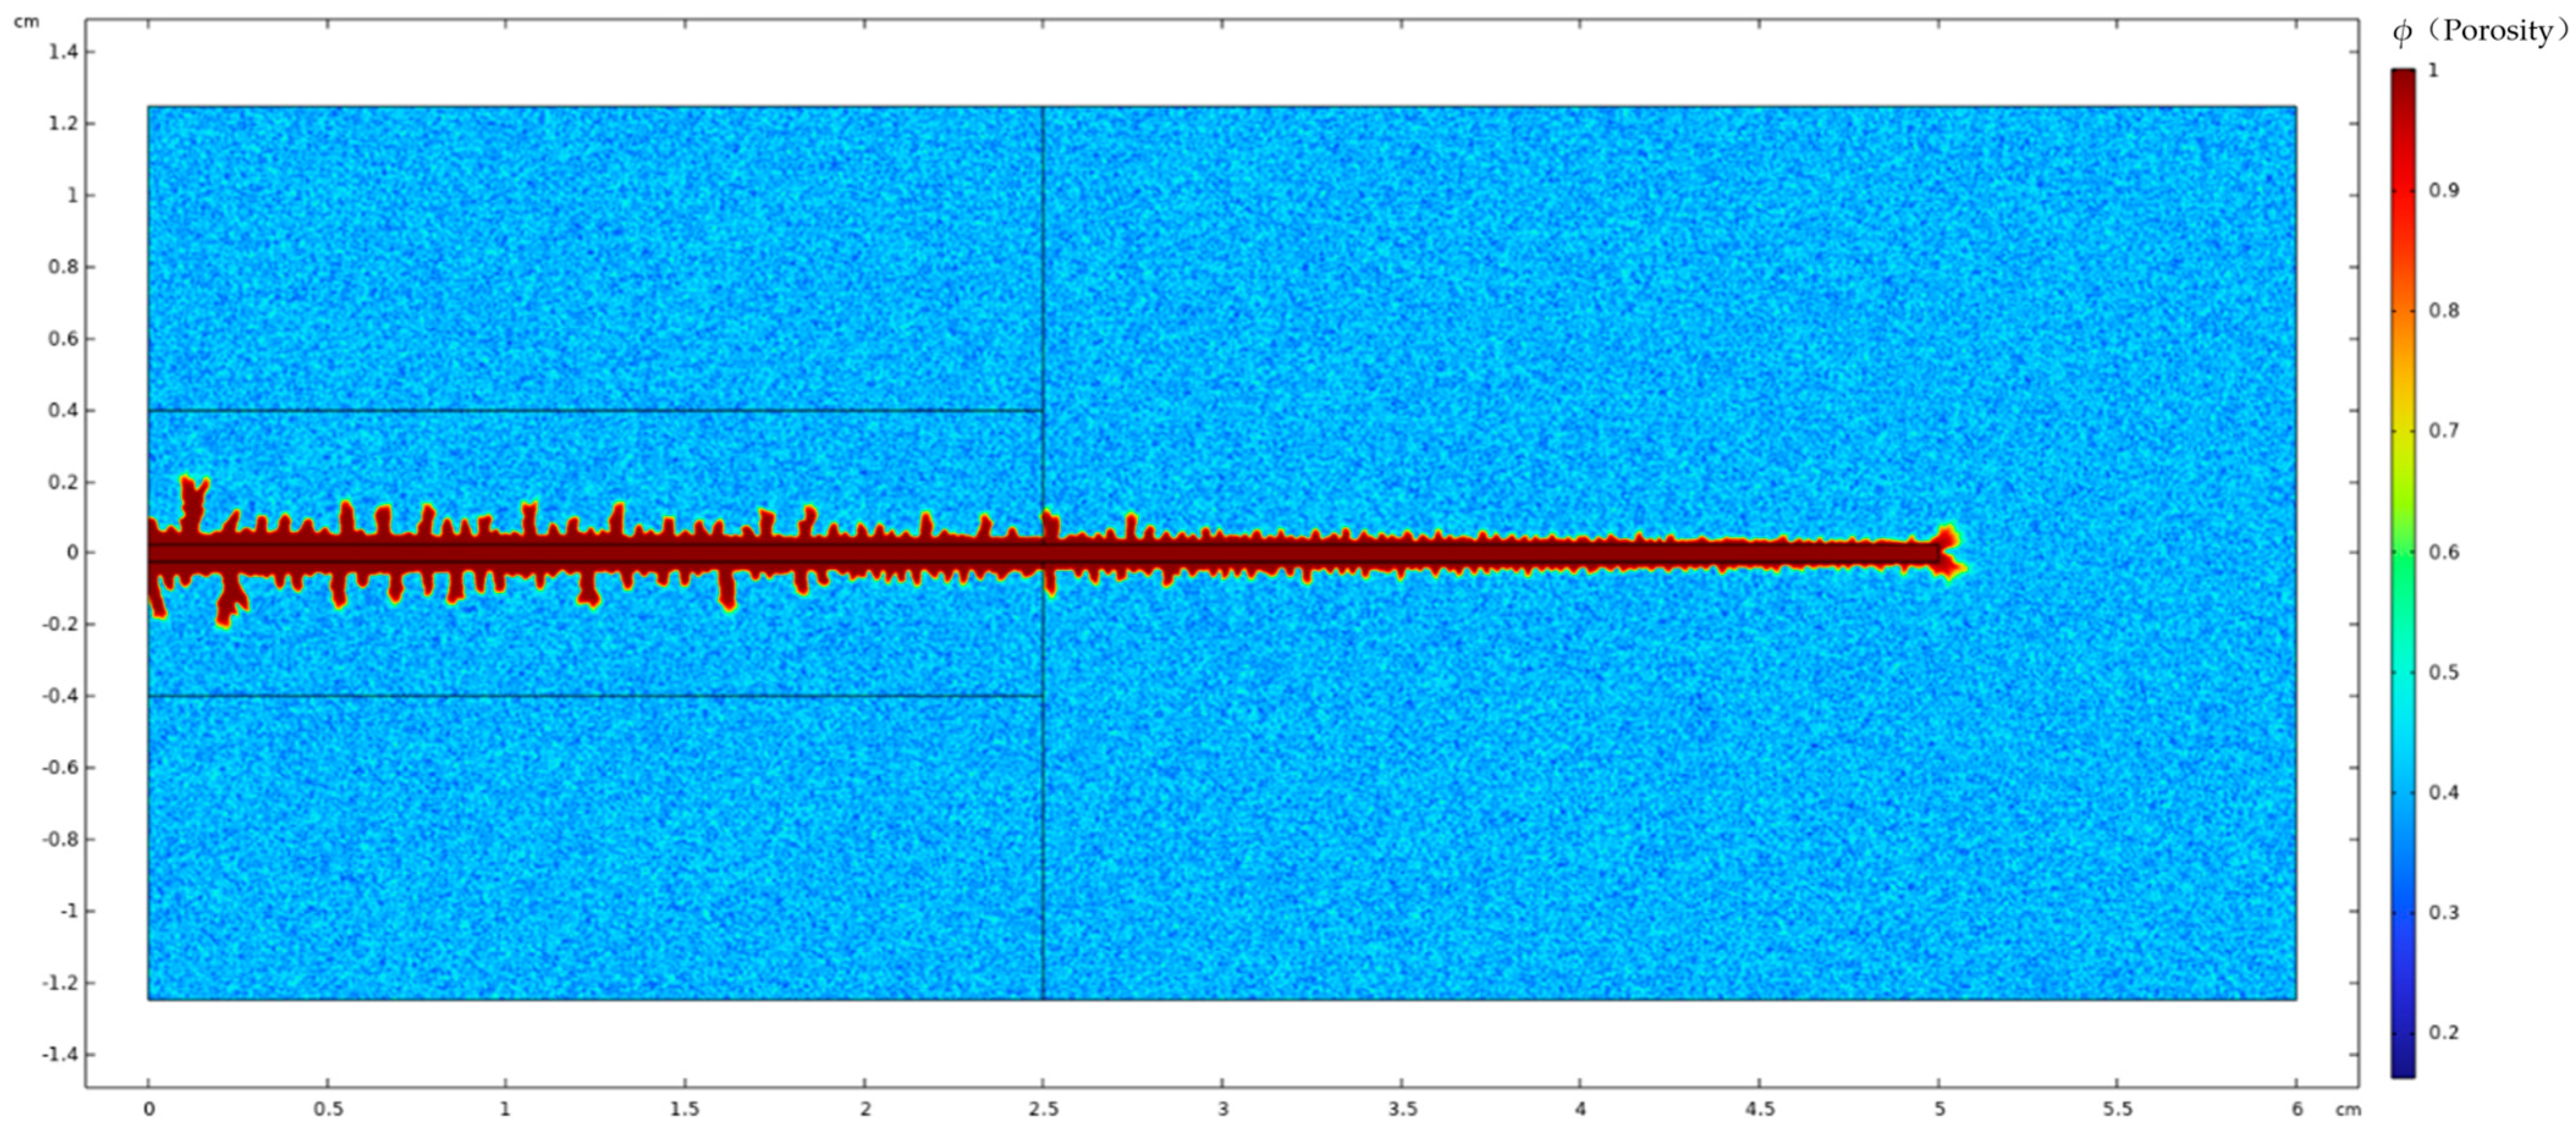
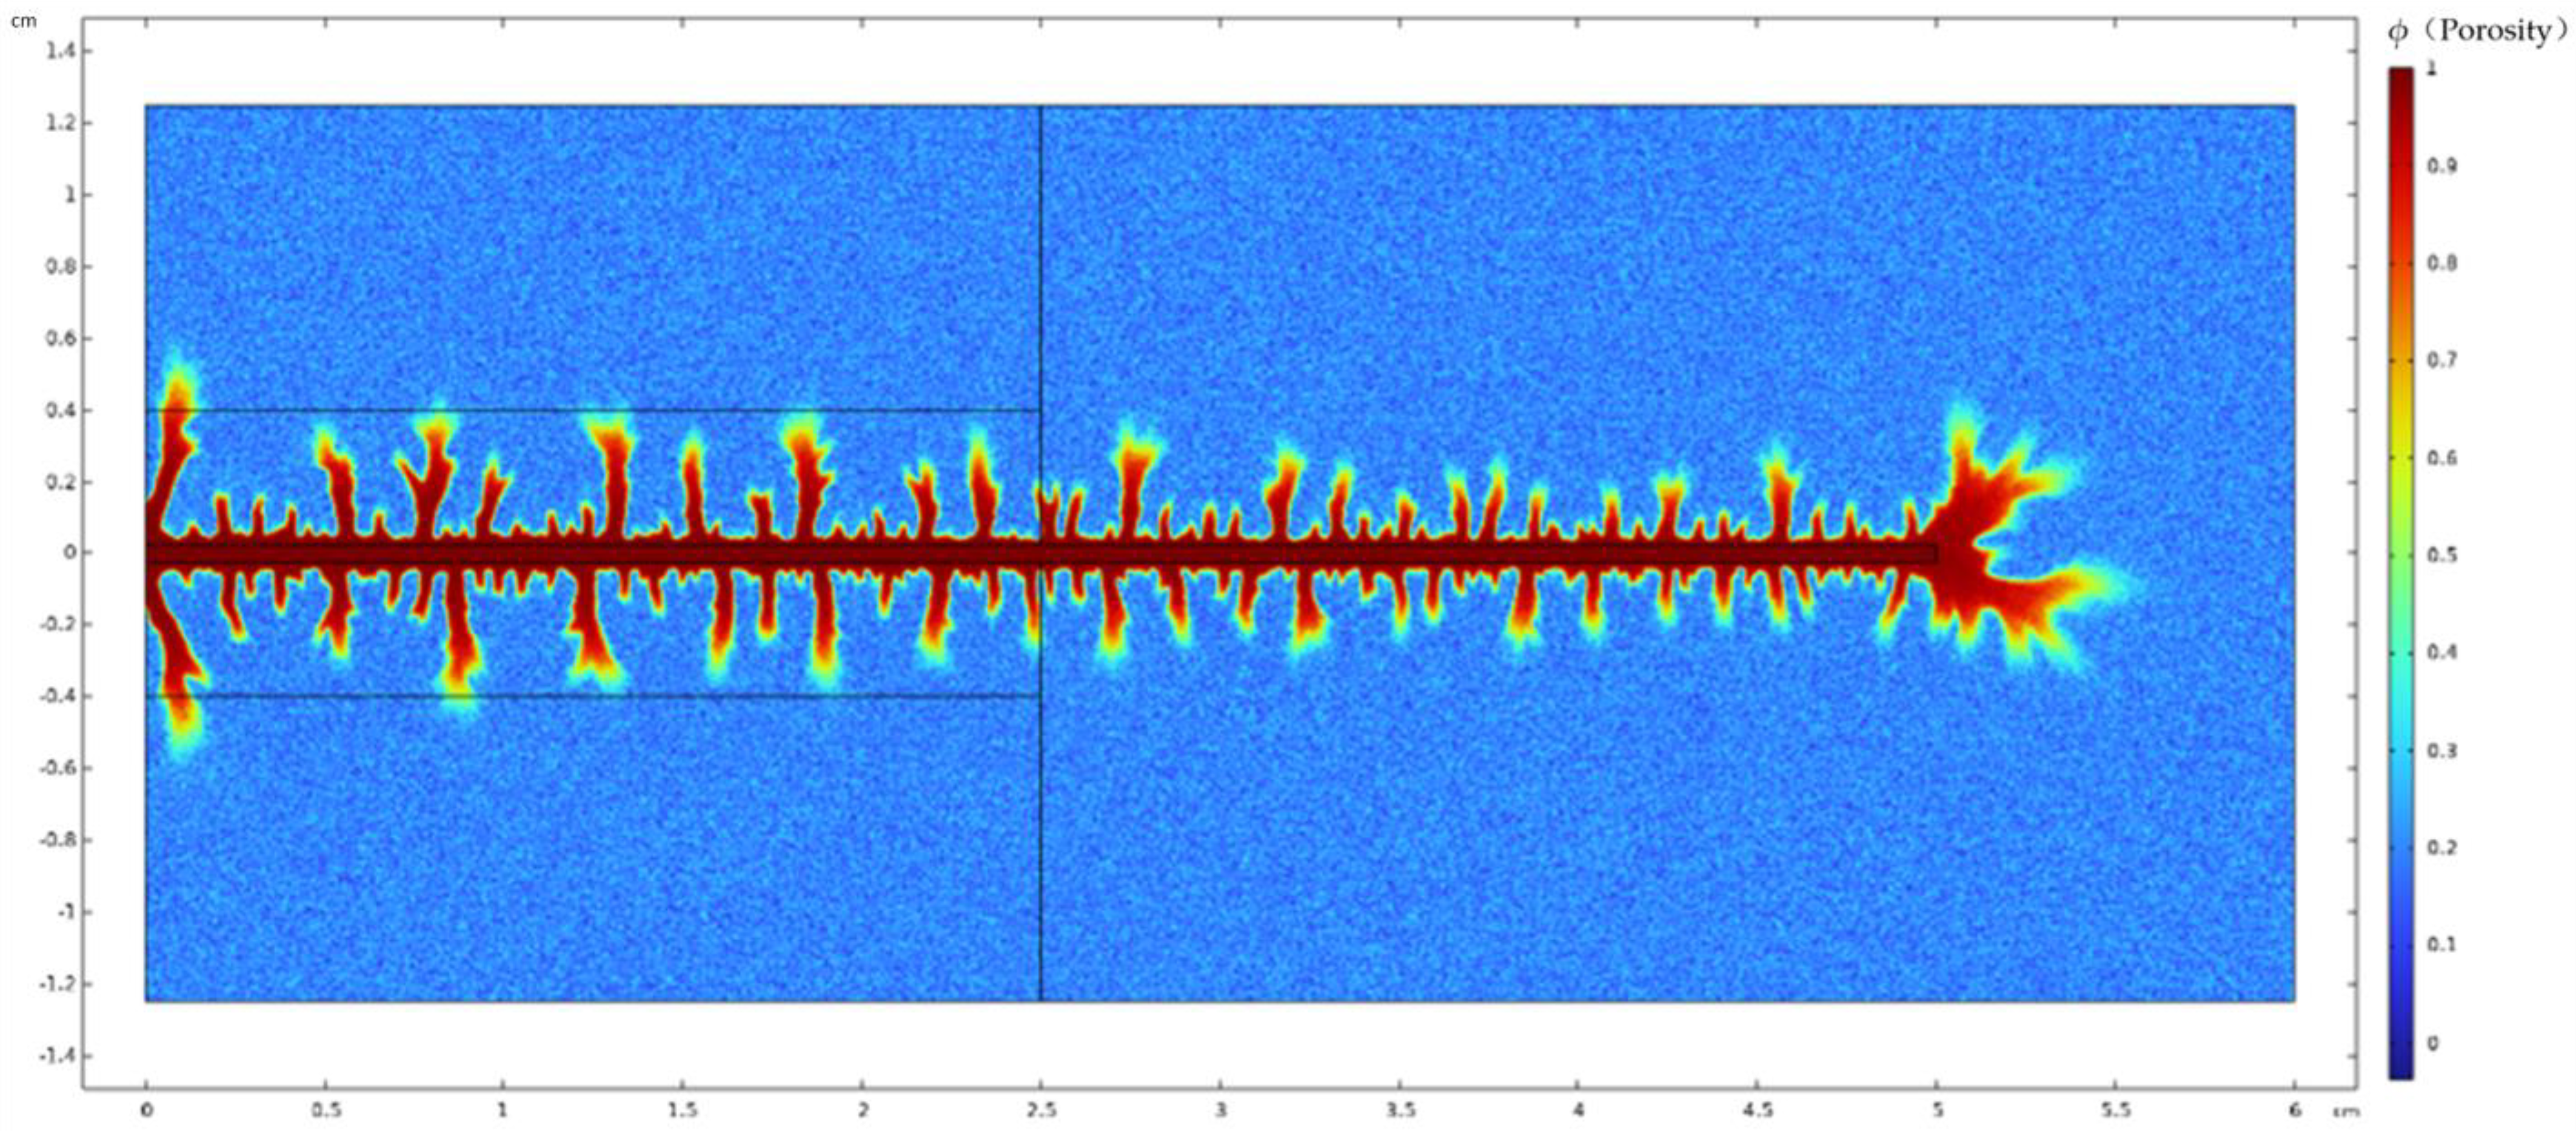
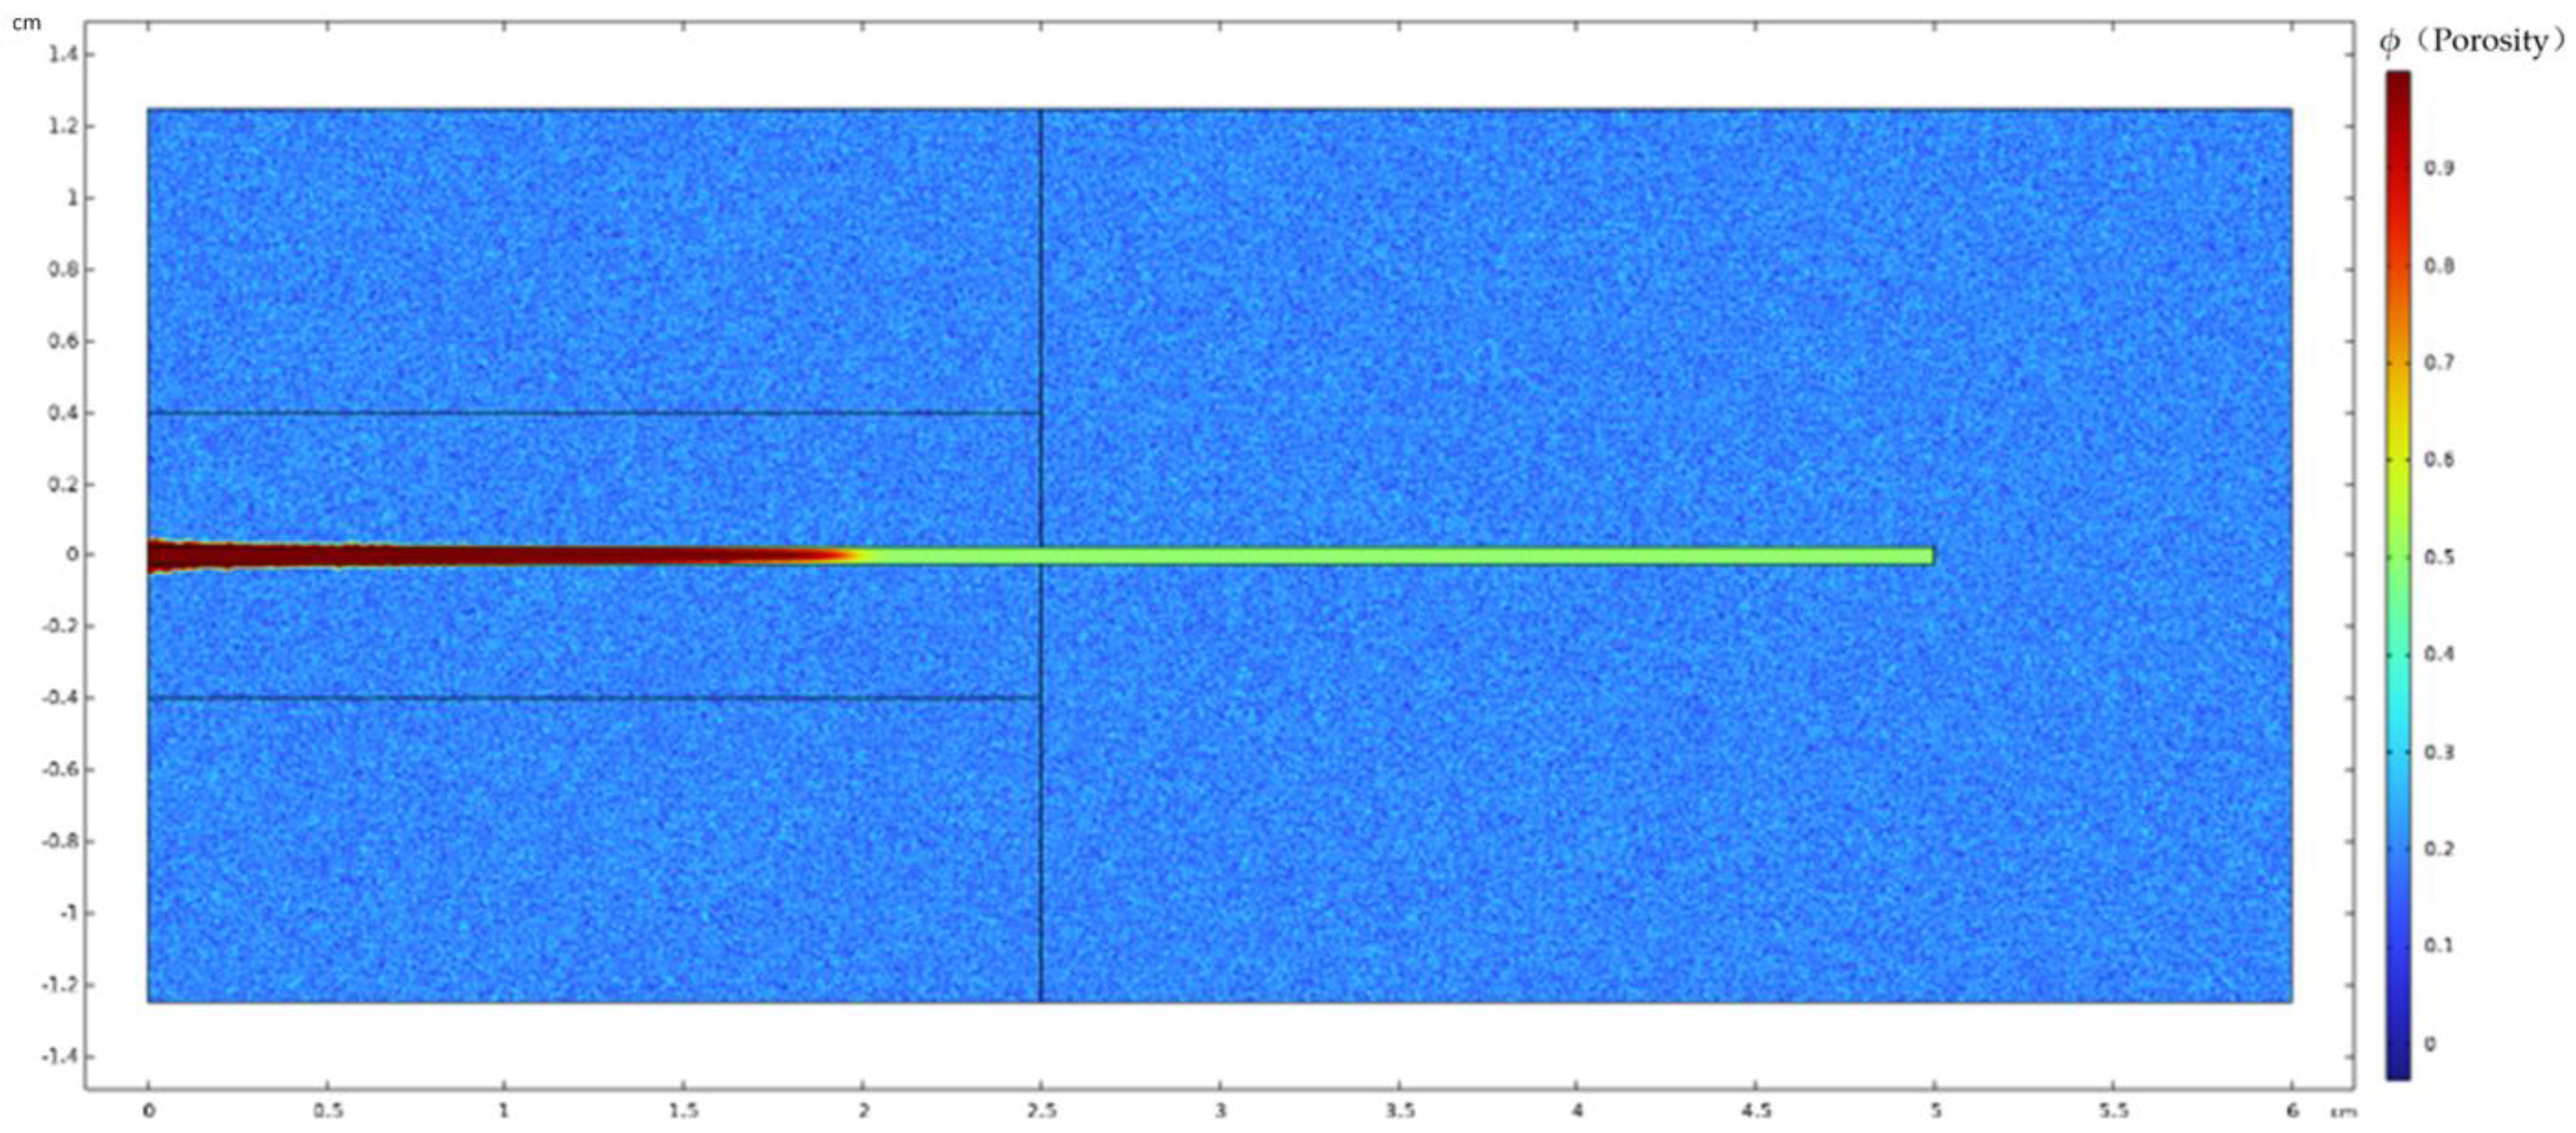
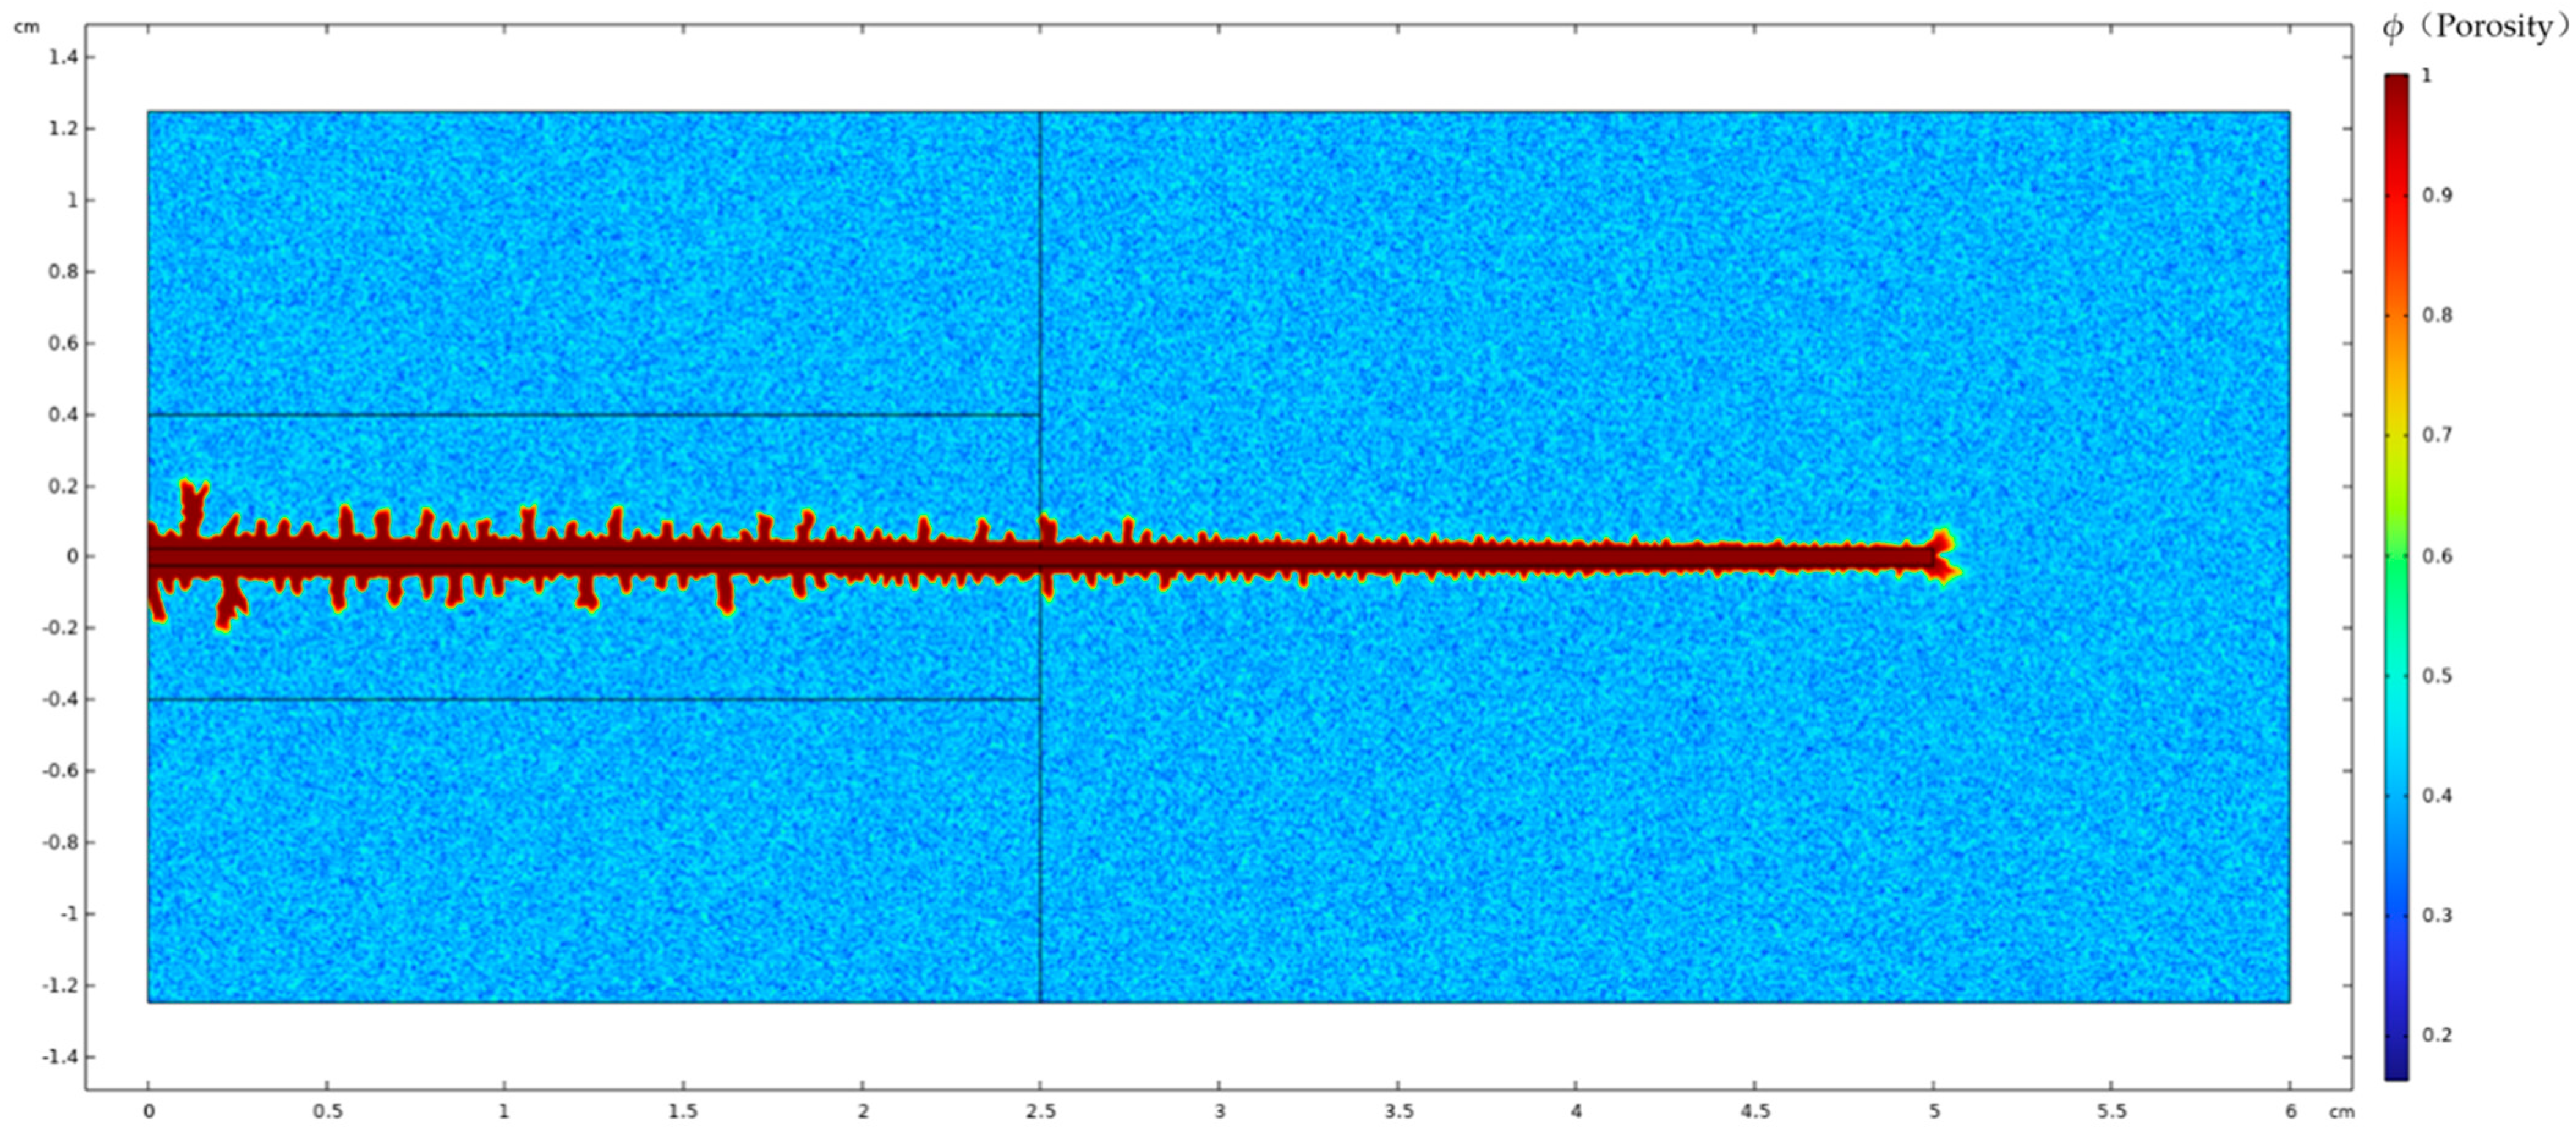
4.1. Injection Rate
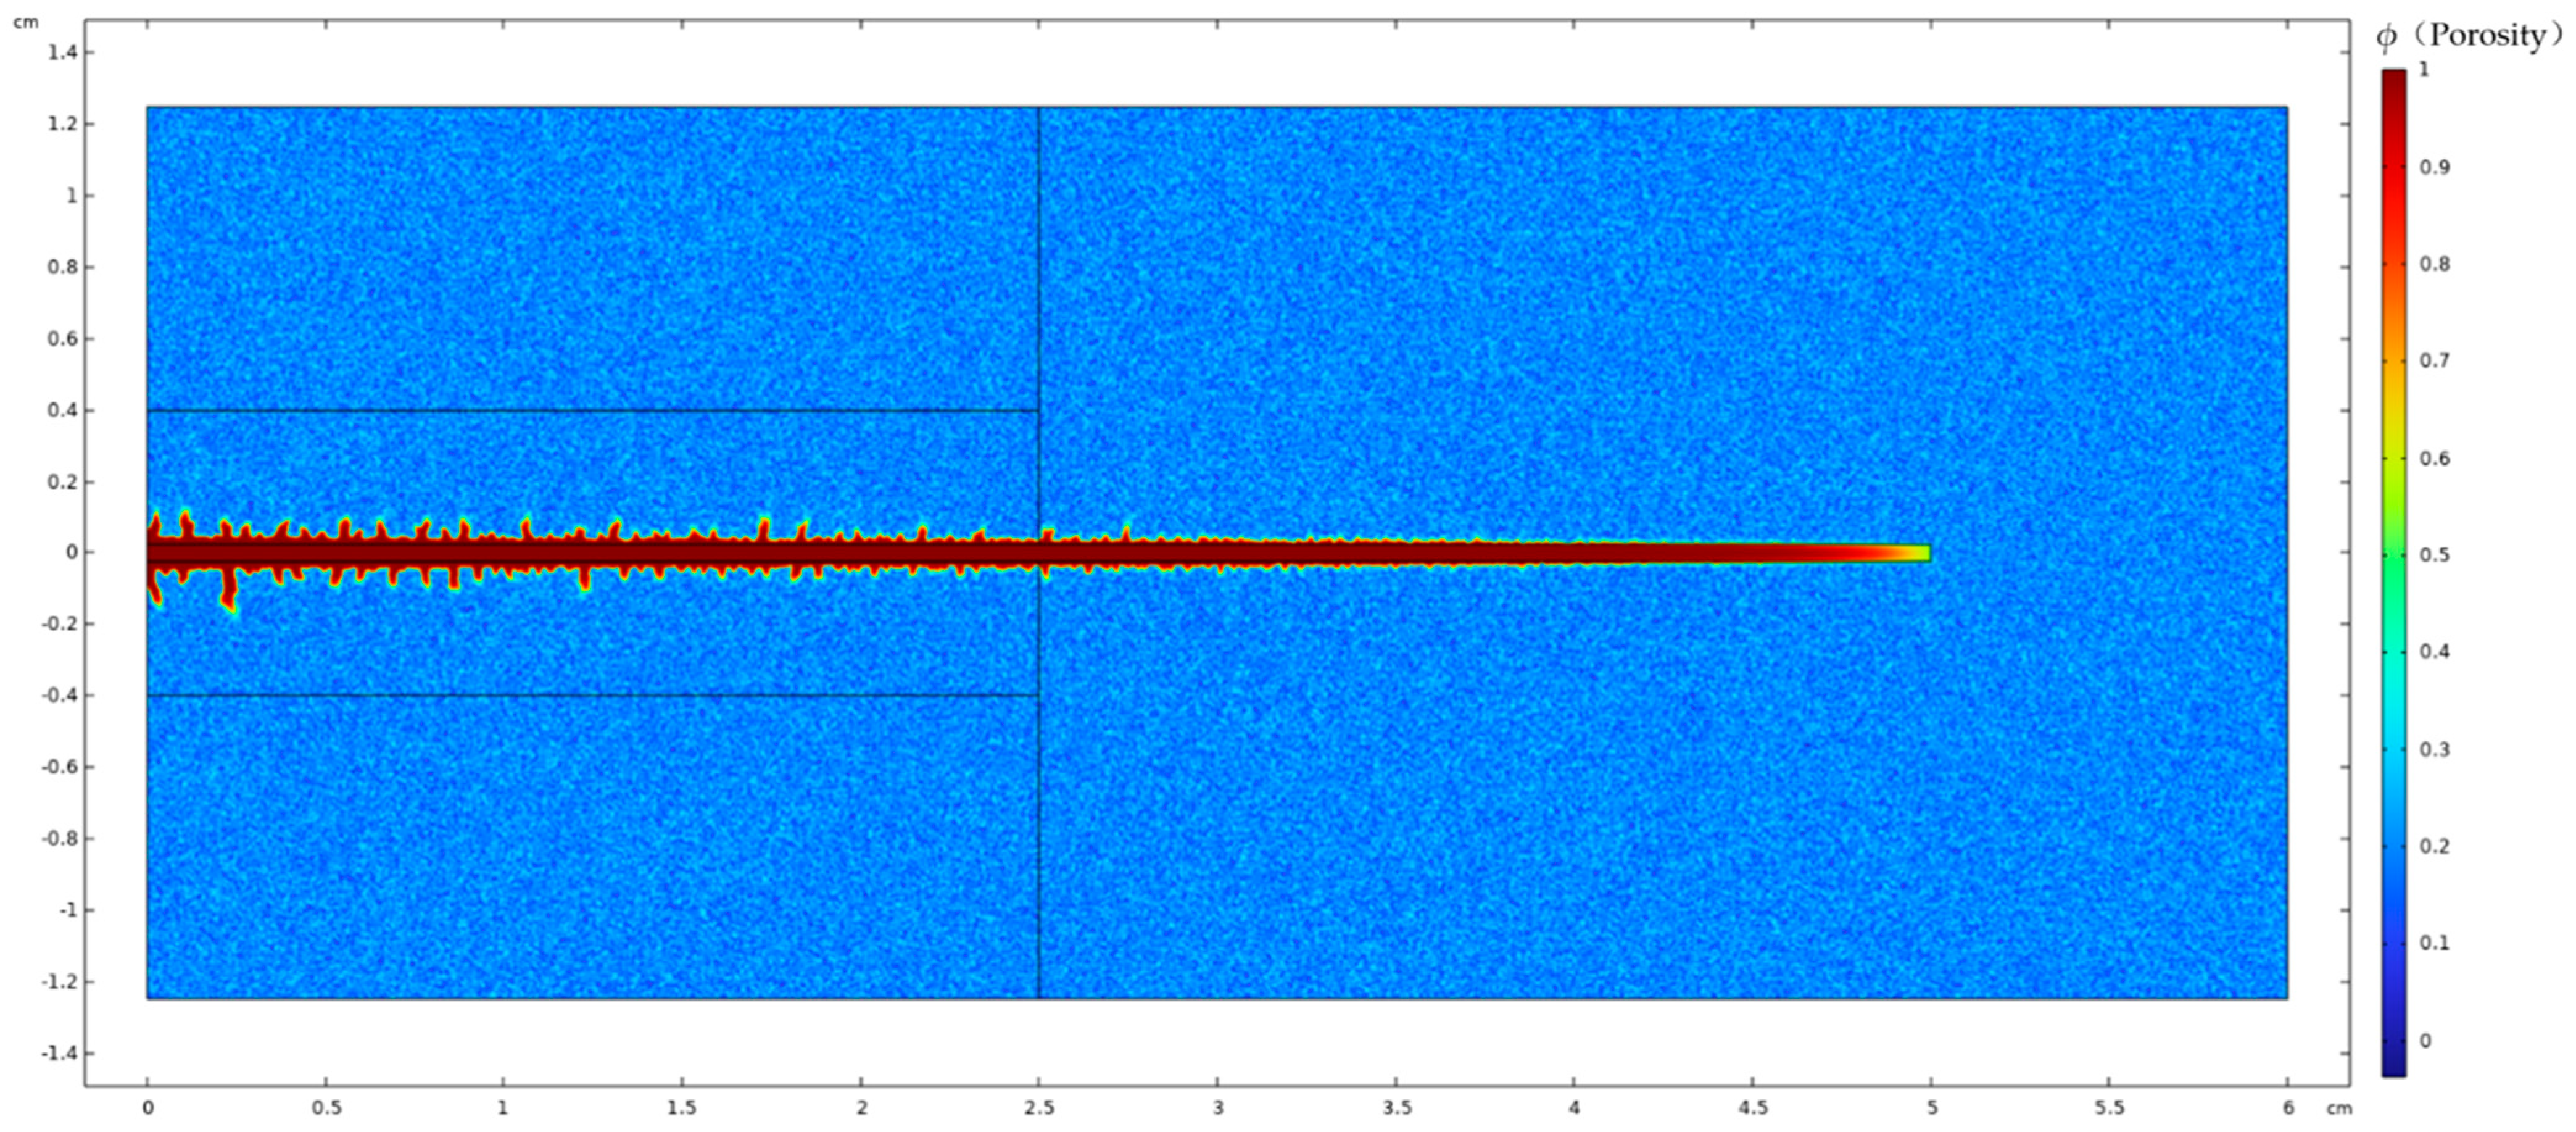
4.2. Acid Viscosity
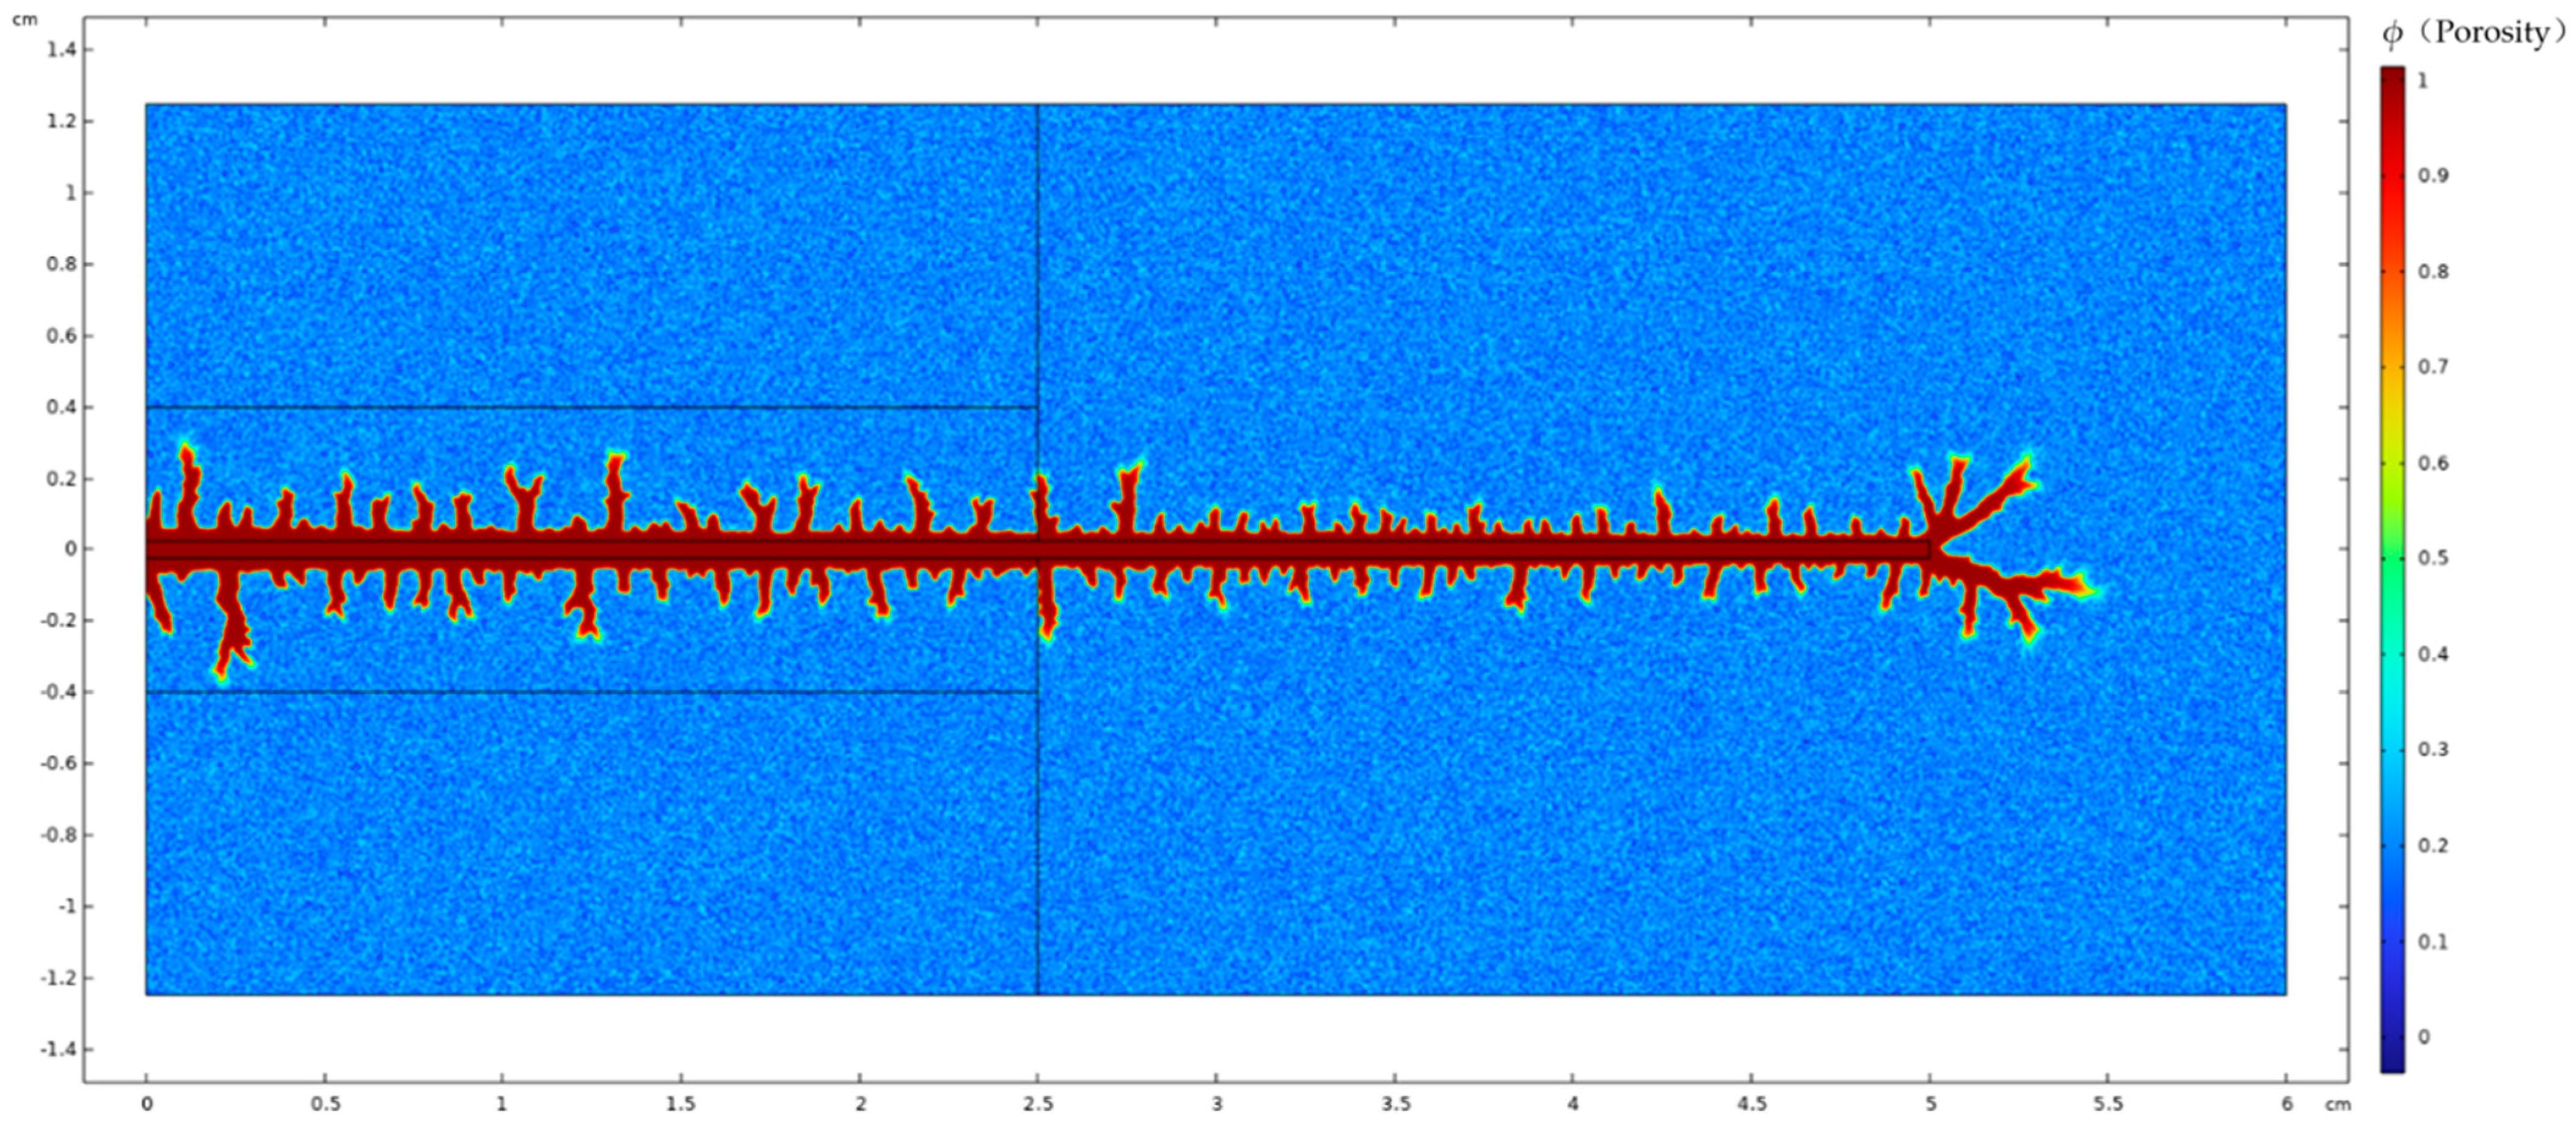
4.3. Acid Concentration
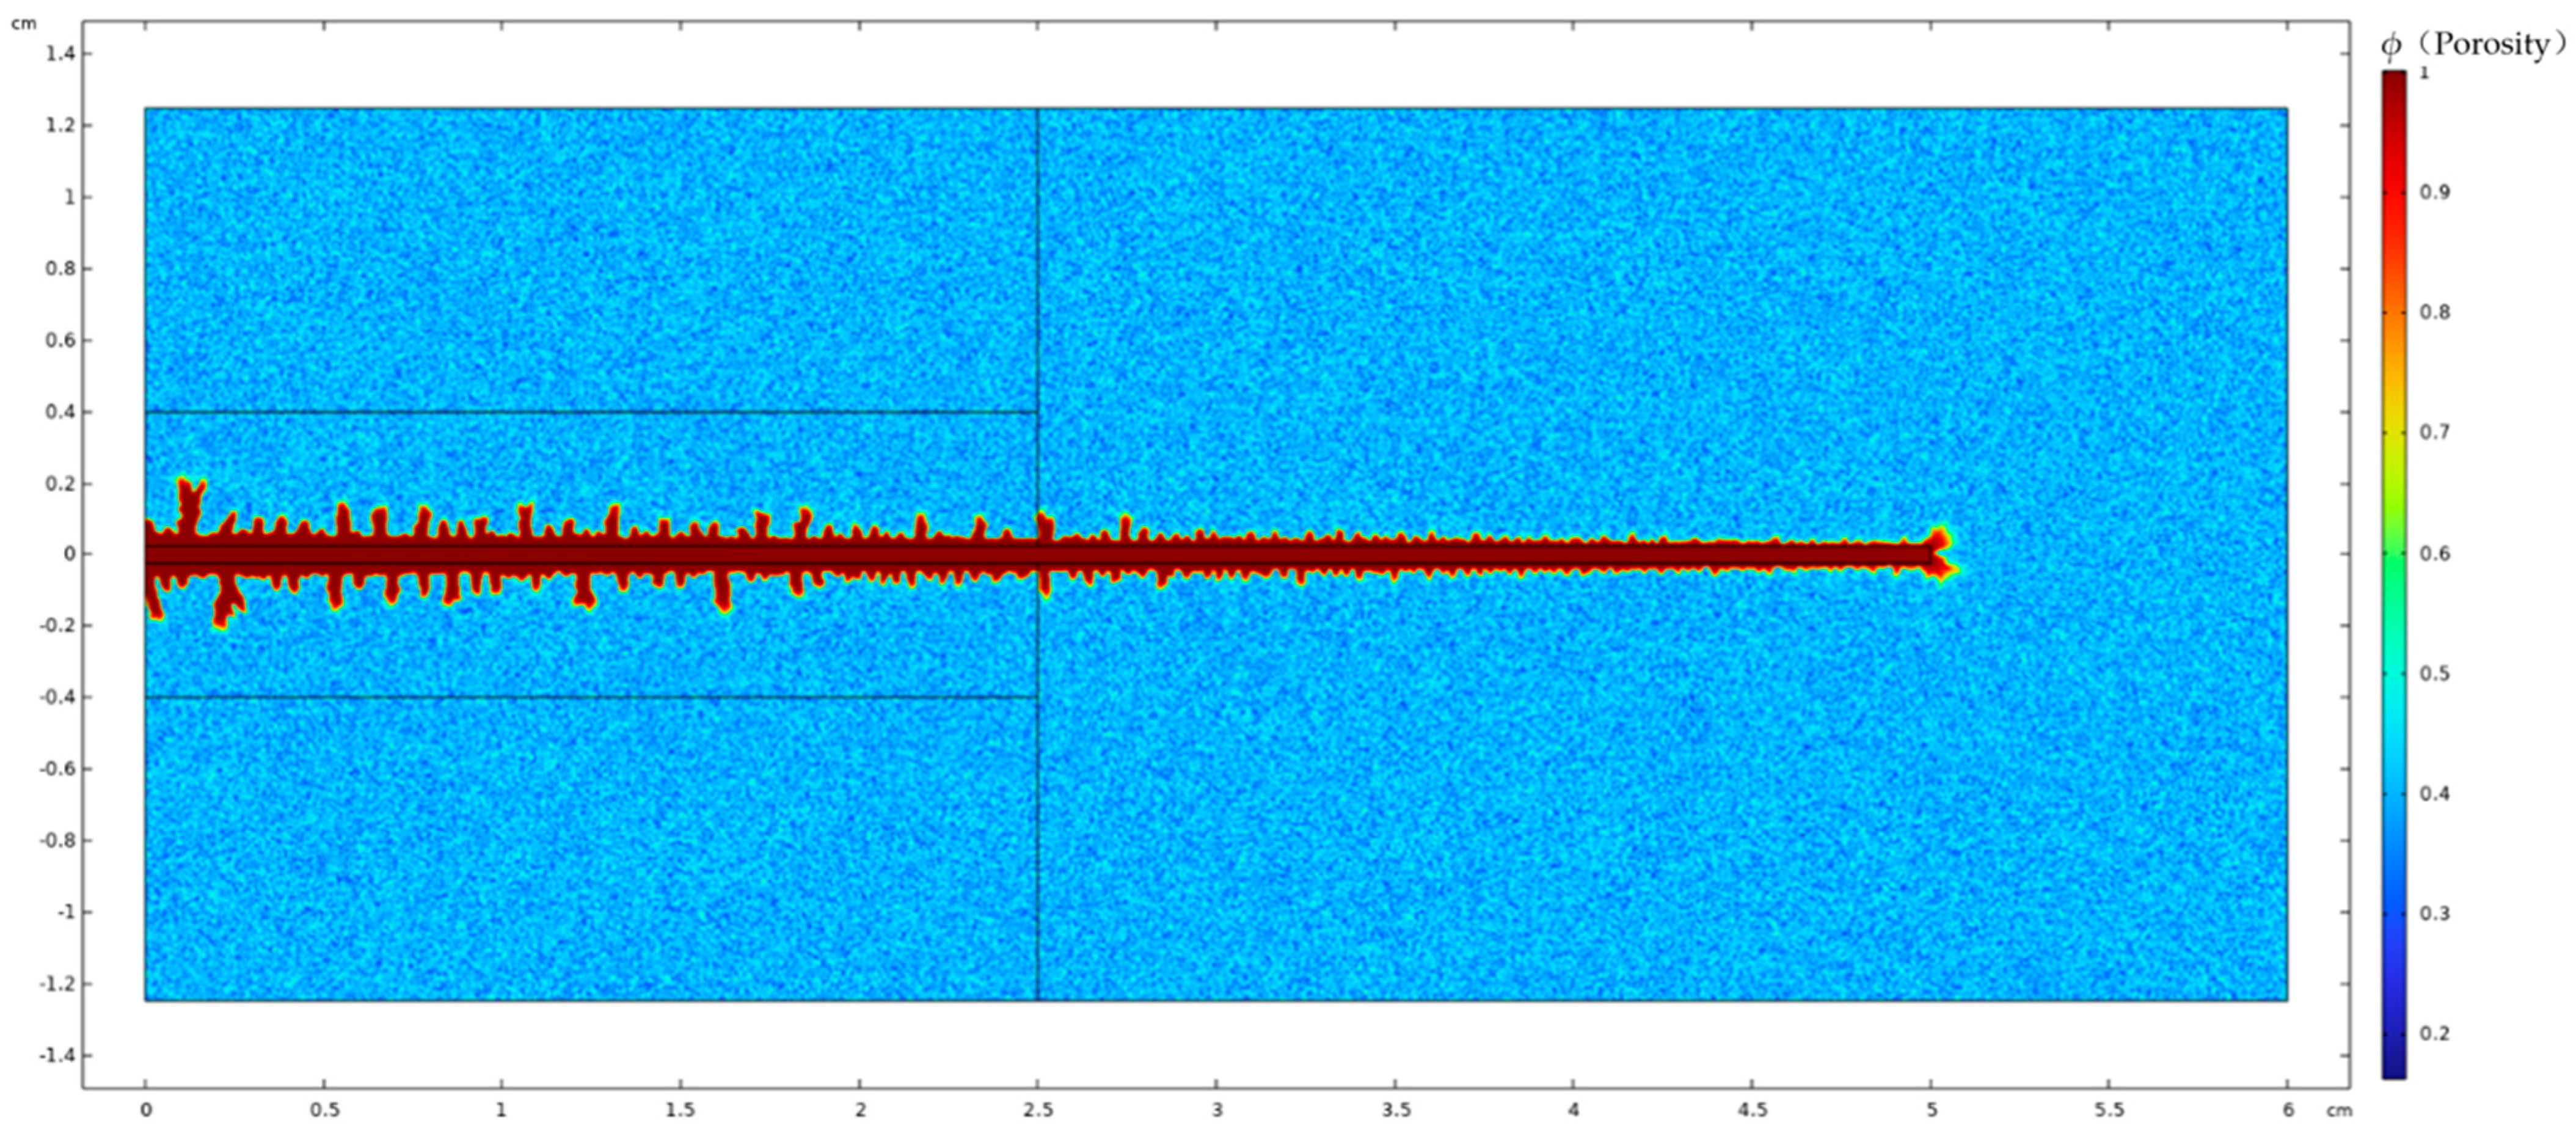
4.4. Porosity
5. Conclusions
Author Contributions
Funding
Data Availability Statement
Conflicts of Interest
References
- Sun, Z.M.; Sun, W.; Lin, J.H.; Ma, Q. Hydrocarbon accumulation conditions and controlling factors of Middle-Upper Cambrian Xixiangchi Group in eastern Sichuan Basin. Pet. Geol. Exp. 2021, 43, 933–940. [Google Scholar]
- Liu, J.; Liang, Z.R.; Zhang, Y.Y.; He, H.B. Study on source-reservoir docking-type natural gas accumulation model in Cambrian strata of eastern Sichuan Basin. Nat. Gas Technol. Econ. 2022, 16, 27–33. [Google Scholar]
- Mou, C.G.; Kuang, D.; He, P.; Wang, L.L. Acid fracturing mechanism and deep acid fracturing optimization for Ordovician deep carbonate rocks. Pet. Geol. Recovery Effic. 2021, 28, 113–119. [Google Scholar] [CrossRef]
- Xie, J.; Guo, G.A.; Tang, Q.S.; Peng, X.; Deng, H.; Xu, W. Key technologies for efficient development of ultra-deep ancient dolomite karst gas reservoirs: A case study of Sinian Dengying Formation gas reservoirs in Anyue Gas Field, Sichuan Basin. Nat. Gas Ind. 2021, 41, 52–59. [Google Scholar] [CrossRef]
- Xue, H.; Huang, Z.X.; Zhao, L.Q.; Jiang, W.D.; Liu, P.L.; Liang, C. Simulation study of prepad acid fracturing considering mineralogical heterogeneity. Nat. Gas Ind. 2018, 38, 59–66. [Google Scholar]
- Ai, K. Research on Optimization of Composite Acid Fracturing Fracture Geometry and Operational Parameters for Carbonate Reservoirs. Ph.D. Thesis, China University of Geosciences, Wuhan, China, 2019. [Google Scholar] [CrossRef]
- Li, S.; Ye, J.X.; Guo, F.F.; He, T.T.; Hu, Q.J. Influencing factors and control strategies of acid fracturing fracture height in bottom-water gas reservoirs of Member 2 of Dengying Formation, Anyue Gas Field, Sichuan Basin. Nat. Gas Geosci. 2022, 33, 1344–1353. [Google Scholar]
- Liu, P.L.; Huang, J.; Xing, X.S.; Zhang, M.; Liu, J.M.; Luo, Z.F.; Zhao, L.Q.; Chen, X. Network acid fracturing stimulation technology for ultra-high-temperature fractured metamorphic gneiss condensate gas reservoirs: A case study of Archean buried hill reservoirs in offshore A Gas Field. Nat. Gas Ind. 2021, 41, 73–80. [Google Scholar]
- Li, X.Y.; Li, X.; Zhao, B.; Wang, K.; Gou, B. Key technologies for large-scale acid fracturing in ultra-deep and ultra-high-temperature carbonate fault-karst reservoirs of Well S, Shunbei Oilfield. Pet. Drill. Tech. 2022, 50, 92–98. [Google Scholar]
- Liu, W. Composite acid fracturing technology for argillaceous limestone in Maokou Formation, southeastern Sichuan Basin. Drill. Fluid Complet. Fluid 2022, 39, 253–258. [Google Scholar]
- Qi, D.; Zou, H.L.; Ding, Y.H.; Zhang, H.W. Calculation model of acid-etched wormholes in carbonate rocks based on Hausdorff fractal dimension. Sci. Technol. Eng. 2019, 19, 105–109. [Google Scholar]
- Zhao, L.Q.; Wang, R.Y.; Liu, P.L.; Liang, C.; Zou, H.L.; Luo, Z.F. Numerical simulation of acid-etched wormhole propagation considering natural micro-fractures. Reserv. Eval. Dev. 2020, 10, 76–82. [Google Scholar] [CrossRef]
- Ren, J.C.; Guo, J.C.; Gou, B.; Wang, S.B.; Liu, Z. Numerical simulation of 3D acid fracturing in deep fractured carbonate reservoirs. Nat. Gas Ind. 2021, 41, 61–71. [Google Scholar]
- Li, Q.; Li, Q.; Wu, J.; Li, X.; Li, H.; Cheng, Y. Wellhead Stability During Development Process of Hydrate Reservoir in the Northern South China Sea: Evolution and Mechanism. Processes 2025, 13, 40. [Google Scholar] [CrossRef]
- Li, Q.; Li, Q.; Cao, H.; Wu, J.; Wang, F.; Wang, Y. The Crack Propagation Behaviour of CO2 Fracturing Fluid in Unconventional Low Permeability Reservoirs: Factor Analysis and Mechanism Revelation. Processes 2025, 13, 159. [Google Scholar] [CrossRef]
- Li, X.G.; Chen, Y.S.; Deng, Z.; Wang, Y.T.; Wei, Z. Review and prospects of acid-etched wormhole simulation in carbonate matrix acidizing. Xinjiang Pet. Geol. 2017, 38, 492–497. [Google Scholar]
- Joodi, A.S.; Sizaret, S.; Binet, S.; Bruand, A.; Alberic, P.; Lepiller, M. Development of a Darcy-Brinkman model to simulate water flow and tracer transport in a heterogeneous karstic aquifer (Val d’Orléans, France). Hydrogeol. J. 2010, 18, 295–309. [Google Scholar] [CrossRef]
- Ng, C.O.; Wang, C.Y. Darcy-Brinkman flow through a Corrugated Channel. Transp. Porous Media 2010, 85, 605–618. [Google Scholar] [CrossRef]
- Prasianakis, N.I.; Curti, E.; Kosakowski, G.; Poonoosamy, J.; Churakov, S.V. Deciphering pore-level precipitation mechanisms. Sci. Rep. 2017, 7, 13765. [Google Scholar] [CrossRef]
- Tartakovsky, A.M.; Meakin, P.; Scheibe, T.D.; West, R.M.E. Simulations of reactive transport and precipitation with smoothed particle hydrodynamics. J. Comp. Phys. 2007, 222, 654–672. [Google Scholar] [CrossRef]
- Molins, S.; Soulaine, C.; Prasianakis, N.I.; Abbasi, A.; Poncet, P.; Ladd, A.J.C.; Starchenko, V.; Roman, S.; Trebotich, D.; Tchelepi, H.A.; et al. Simulation of mineral dissolution at the pore scale with evolving fluid–solid interfaces: Review of approaches and benchmark problem set. Comput. Geosci. 2021, 25, 1285–1318. [Google Scholar] [CrossRef]
- Seigneur, N.; Mayer, K.U.; Steefel, C.I. Reactive transport in evolving porous media. Rev. Miner. Geochem. 2019, 85, 197–238. [Google Scholar] [CrossRef]
- Huang, H.; Li, X. Pore-scale simulation of coupled reactive transport and dissolution in fractures and porous media using the level set interface tracking method. J. Nanjing Univ. (Nat. Sci.) 2011, 47, 235–251. (In Chinese) [Google Scholar]
- Trebotich, D.; Adams, M.F.; Molins, S.; Steefel, C.I.; Shen, C.P. High resolution simulation of pore-scale reactive transport processeassociated with carbon sequestration. Comput. Sci. Eng. 2014, 16, 22–31. [Google Scholar] [CrossRef]
- Steefel, C.I.; Appelo, C.A.J.; Arora, B.; Jacques, D.; Kalbacher, T.; Kolditz, O.; Lagneau, V.; Lichtner, P.C.; Mayer, K.U.; Meeussen, J.C.L.; et al. Reactive transport codes for subsurface environmental simulation. Comput. Geosci. 2015, 19, 445–478. [Google Scholar] [CrossRef]
- Qi, N.; Chen, G.; Liang, C.; Guo, T.; Liu, G.; Zhang, K. Numerical simulation and analysis of the influence of fracture geometry on wormhole propagation in carbonate reservoirs. Chem. Eng. Sci. 2019, 198, 124–143. [Google Scholar] [CrossRef]


| Parameter | Value | Unit | Physical Meaning |
|---|---|---|---|
| L | 0.06 | m | Core length |
| W | 0.025 | m | Core width |
| Lf | 0.05 | m | Fracture length |
| Wf | 0.0005 | m | Fracture width |
| 2% | Initial porosity | ||
| 0.15 | mD | Initial permeability | |
| 5000 | m2/m3 | Initial specific surface area | |
| 1.0 × 10⁻⁶ | m | Initial pore-throat radius | |
| 2710 | kg/m3 | Rock density | |
| 1080 | kg/m3 | Fluid density | |
| 3.6 × 10⁻⁵ | m2/s | Molecular effective diffusion coefficient | |
| 1 | kg/mol | Dissolution capacity coefficient |
| Injection Displacement (mL/min) | Acid Concentration | Acid Viscosity (mPa·s) | Acid Dosage (mL) | |
|---|---|---|---|---|
| Scheme 1 | 12.54 | 20% | 5 | 120 |
| Scheme 2 | 12.54 | 20% | 5 | 240 |
| Injection Rate (mL/min) | Acid Viscosity (mPa·s) | Acid Concentration (mol/L) | Porosity | |
|---|---|---|---|---|
| Experiment 1 | 6.27 | 5 | 4.412 | 2% |
| Experiment 2 | 9.41 | 5 | 4.412 | 2% |
| Experiment 3 | 12.54 | 5 | 4.412 | 2% |
| Experiment 4 | 9.41 | 1 | 4.412 | 2% |
| Experiment 5 | 9.41 | 20 | 4.412 | 2% |
| Experiment 6 | 9.41 | 5 | 2.872 | 2% |
| Experiment 7 | 9.41 | 5 | 6.022 | 2% |
| Experiment 8 | 9.41 | 5 | 4.412 | 5% |
| Experiment 9 | 9.41 | 5 | 4.412 | 10% |
| Injection Rate (mL/min) | Acid Viscosity (mPa·s) | Acid Concentration (mol/L) | Porosity | ||
|---|---|---|---|---|---|
| Experiment 1 | 6.27 | 5 | 4.412 | 2% | 0.03853 |
| Experiment 2 | 9.41 | 5 | 4.412 | 2% | 0.08949 |
| Experiment 3 | 12.54 | 5 | 4.412 | 2% | 0.19086 |
| Injection Rate (mL/min) | Acid Viscosity (mPa·s) | Acid Concentration (mol/L) | Porosity | ||
|---|---|---|---|---|---|
| Experiment 2 | 6 | 5 | 4.412 | 2% | 0.08949 |
| Experiment 4 | 6 | 1 | 4.412 | 2% | 0.20672 |
| Experiment 5 | 6 | 20 | 4.412 | 2% | 0.00766 |
| Injection Rate (mL/min) | Acid Viscosity (mPa·s) | Acid Concentration (mol/L) | Porosity | ||
|---|---|---|---|---|---|
| Experiment 2 | 6 | 5 | 4.412 | 2% | 0.08949 |
| Experiment 6 | 6 | 5 | 2.872 | 2% | 0.06479 |
| Experiment 7 | 6 | 5 | 6.022 | 2% | 0.16243 |
| Injection Rate (mL/min) | Acid Viscosity (mPa·s) | Acid Concentration (mol/L) | Porosity | ||
|---|---|---|---|---|---|
| Experiment 2 | 6 | 5 | 4.412 | 2% | 0.08949 |
| Experiment 8 | 6 | 5 | 4.412 | 5% | 0.09476 |
| Experiment 9 | 6 | 5 | 4.412 | 10% | 0.10401 |
Disclaimer/Publisher’s Note: The statements, opinions and data contained in all publications are solely those of the individual author(s) and contributor(s) and not of MDPI and/or the editor(s). MDPI and/or the editor(s) disclaim responsibility for any injury to people or property resulting from any ideas, methods, instructions or products referred to in the content. |
© 2025 by the authors. Licensee MDPI, Basel, Switzerland. This article is an open access article distributed under the terms and conditions of the Creative Commons Attribution (CC BY) license (https://creativecommons.org/licenses/by/4.0/).
Share and Cite
Yang, R.; Wang, Z.; Hua, W.; He, D.; Pan, G.; Yang, Z. Numerical Simulation of Acid Leakoff in Fracture Walls Based on an Improved Dual-Scale Continuous Model. Processes 2025, 13, 1771. https://doi.org/10.3390/pr13061771
Yang R, Wang Z, Hua W, He D, Pan G, Yang Z. Numerical Simulation of Acid Leakoff in Fracture Walls Based on an Improved Dual-Scale Continuous Model. Processes. 2025; 13(6):1771. https://doi.org/10.3390/pr13061771
Chicago/Turabian StyleYang, Rongxiang, Zhiheng Wang, Weixing Hua, Donghai He, Guoying Pan, and Zhaozhong Yang. 2025. "Numerical Simulation of Acid Leakoff in Fracture Walls Based on an Improved Dual-Scale Continuous Model" Processes 13, no. 6: 1771. https://doi.org/10.3390/pr13061771
APA StyleYang, R., Wang, Z., Hua, W., He, D., Pan, G., & Yang, Z. (2025). Numerical Simulation of Acid Leakoff in Fracture Walls Based on an Improved Dual-Scale Continuous Model. Processes, 13(6), 1771. https://doi.org/10.3390/pr13061771