Article

Estimation of Properties of Petrodiesel—Biodiesel Mixtures Using an Artificial Neural Network

1
Faculty of Mechanical and Electrical Engineering, Petroleum-Gas University of Ploiesti, 39 Bucharest Blvd., 100680 Ploiesti, Romania
2
Faculty of Petroleum Refining and Petrochemistry, Petroleum-Gas University of Ploiesti, 39 Bucharest Blvd., 100680 Ploiesti, Romania
3
National Institute for Research Development for Chemistry and Petrochemistry-ICECHIM-București, 202 Spl. Independenței, 060021 Bucharest, Romania
*
Authors to whom correspondence should be addressed.
Processes 2025, 13(6), 1769; https://doi.org/10.3390/pr13061769
Submission received: 4 May 2025 / Revised: 28 May 2025 / Accepted: 29 May 2025 / Published: 3 June 2025
(This article belongs to the Section Energy Systems)

Abstract

This study investigates the synthesis of biodiesel from three vegetable oils with significantly different chemical compositions. Based on the properties of these biodiesel samples, a method was proposed to estimate the density of petrodiesel–biodiesel blends using an artificial neural network (ANN). The ANN employed in this research consisted of 10 neurons. The experimental data showed a high correlation, indicating effective training and precise estimations in relation to the provided training data. The accuracy of the estimations was evaluated by comparing the blending densities determined through the method presented in this study with the mean of three estimations generated by the neural network. The deviation between the determined and estimated values ranged from 4.1 to 25.2 kg/m3, which is attributable to the limited size of the training database. Most errors fell between −7.1% and 3.8%, with the lowest error being observed for petrodiesel–Brassica carinata biodiesel blends. Excellent correlations for both training and validation data were obtained (R = 0.99 and R = 0.98) for blends incorporating palm and Brassica carinata biodiesel. The estimation method using neural networks proposed in this paper can be effectively adapted for other mixtures and to estimate additional blending properties, accommodating each user’s needs.

1. Introduction

The growing demand for automotive fuels, coupled with an increasing focus on environmental preservation, necessitates the exploration of alternative fuel options. Fuels such as bioethanol, biodiesel, and hydrogenated vegetable oil are produced from renewable raw materials, and their characteristics are significantly influenced by the chemical composition of the feedstock used in their synthesis. Biodiesel consists of mono-alkyl esters derived from long-chain fatty acids and can be sourced from various raw materials, including vegetable oils, animal fats, and waste cooking oil [1]. Utilizing waste cooking oil as a feedstock for biodiesel production presents a viable and economically advantageous solution, both in terms of resource utilization and in mitigating environmental pollution. This approach not only enhances the sustainability of biodiesel production by repurposing waste materials but also contributes to the reduction of the harmful emissions associated with traditional fossil fuels. However, the challenge of achieving a consistent chemical composition in large volumes of waste cooking oil poses some obstacles in the production of high-quality biodiesel. The quality and properties of biodiesel are determined by the chemical nature of the raw materials employed in its synthesis, the methods of preparation, and the operational conditions—such as the catalysts used, as well as the washing and the purification processes. Ultimately, the biodiesel produced must meet current regulatory standards: DIN EN 14214 under European specifications for biodiesel fuels, or ASTM D6751, which represents the U.S. specifications [2].
To accurately predict the properties of petrodiesel–biodiesel blends, it is essential to understand how the composition of vegetable oils influences biodiesel characteristics. A valuable tool for correlating the raw material composition with the properties of the resulting products is the artificial neural network (ANN). These data processing systems are employed to address various challenges in engineering and science, particularly in areas where traditional modeling methods fall short [3,4]. Consequently, experimental measurement of blend properties may become unnecessary. Numerous studies have been conducted to establish a qualitative relationship between biodiesel derived from B100 and the properties of biodiesel–petrodiesel blends, based on the chemical composition of the feedstock used in their synthesis. The techniques employed for estimating these results include mathematical correlations, response surface methodology (RSM), and artificial neural networks (ANN). Furthermore, these tools have also been applied to the mathematical modeling of biodiesel production from various oleaginous raw materials. The characteristics of biodiesel samples obtained under conditions modeled with ANN conform to the specifications for biodiesel outlined in ASTM D6751 and DIN EN 14214 [5,6].
The literature discusses studies exploring the interdependence between the density of petrodiesel blended with 5% to 55% biodiesel and the types of raw materials utilized in biodiesel synthesis, such as sunflower oil, palm oil, animal fat, and waste cooking oil [7]. For several of the mixtures analyzed, linear equations with high correlation coefficients, ranging from 0.90 to 0.96, were derived. Perdomo investigated the relationship between chemical structure and the physical properties of biodiesel through group contribution methods [8]. Additionally, other researchers examined the application of artificial neural networks (ANNs) to estimate the viscosity and oxidation stability of various biodiesel samples derived from different raw materials [9]. The findings demonstrate that this proposed model effectively and accurately predicts these two properties. Furthermore, the model developed by Rocabruno-Valdés for estimating density, viscosity, and cetane number considers the composition of the biodiesel sample [10]. The results obtained using the ANN model are applicable within the temperature range of 288.15 to 373.15 K, and the correlation coefficients between the estimated and actual data are notably high—0.91946–0.99401.
In a study investigating blends of petrodiesel and biodiesel produced through the transesterification of soybean oil with methanol, Kumar and Bansal utilized several artificial neural networks (ANNs) to estimate the properties of these mixtures under basic catalysis. Their findings indicated that the most favorable results were achieved with a neural network trained using the Levenberg–Marquardt algorithm [11,12]. Comparative analyses of various mathematical tools, including artificial neural networks (ANN), multiple linear regression (MLR), principal component regression (PCR), and partial least squares regression (PLS), as well as polynomial and spline-PLS methods, were conducted to predict the properties of biodiesel [13]. Among the methods evaluated, artificial neural networks demonstrated superior performance, with the lowest root mean squared error of prediction recorded being 0.42 kg/m3 for biodiesel density. Notably, ANNs also produced highly accurate estimates for viscosity, density, flash point, and freezing point of biodiesel [14], achieving a correlation coefficient of 0.994 for density.
The study of mixtures derived from petrodiesel and biodiesel sourced from palm oil, a primary raw material utilized in this research, reveals several pertinent properties that merit investigation [15]. A second-order mathematical correlation was established between the composition of the blends and their respective viscosities, cloud points, and flashpoints. Notably, the correlation demonstrated superior alignment between experimental data and calculated outcomes, particularly regarding the viscosity and cloud point of palm oil biodiesel–petrodiesel blends. Furthermore, a substantial body of literature examines the properties of biodiesel produced from vegetable oils with a high degree of saturation, highlighting the significance of chemical composition in the analysis [16,17,18,19].
To accurately assess the properties of these biodiesel blends, it is important to employ experimental methods that conform to established standard testing protocols for each property under consideration. While these experimental results are characterized by high accuracy, the associated costs of conducting such tests can be substantial; they are often both technically demanding and time intensive. Compounding these challenges is the limited availability of well-equipped laboratories capable of facilitating such analyses. To mitigate these constraints, the integration of mathematical and statistical models, alongside artificial neural networks (ANNs), has been increasingly adopted to estimate the properties of fuel blends [14].
Artificial intelligence (AI) encompasses a broad range of applications across various fields, with artificial neural networks representing a specialized branch utilized to address complex and nonlinear challenges. ANNs function by mimicking the dynamics of the animal central nervous system, particularly the brain, enabling the networks to learn from empirical examples. Their inherent fault tolerance and capacity to process noisy, intricate data sets render them invaluable. Following an adequate training phase, ANNs are capable of delivering rapid predictions [20]. The density of fuel plays a critical role in ensuring optimal engine performance by influencing the volume of the fuel injected into combustion chambers, thereby facilitating complete and efficient combustion with appropriately sized fuel particles. This relationship is further linked to the levels of emissions generated during fuel combustion, including particulate matter and nitrogen oxides [21,22,23,24,25,26]. Additionally, the density of alternative fuels significantly impacts the degree of biodiesel separation when storing reformulated diesel fuels [20].
Biodiesel density is a critical property, alongside viscosity, due to its significant impact on engine performance. Analyzing the effect of temperature reveals a linear decrease in density with rising temperatures. At lower temperatures, the density of saturated alkyl esters primarily depends on their molecular weight.
An important factor to consider is the composition of vegetable oils, particularly the structure of the fatty acids found within their triglycerides. These structural elements remain consistent throughout the transesterification process and are foundational for defining the standardized characteristics necessary for biodiesel. Longer molecular chain lengths correspond to larger molecular weights, resulting in greater distances between molecules and lower densities of saturated structures [18,27]. Conversely, the number of double bonds in alkyl esters positively influences density, meaning that as the degree of unsaturation increases, density decreases. Palm oil is notably high in saturated fatty acids, specifically C14–C18, containing up to 55% by weight [28]. In contrast, Brassica carinata oil and camelina oil exhibit higher levels of unsaturation. Brassica carinata oil possesses a unique fatty acid profile with high concentrations of erucic and linolenic acids, reaching up to 90% by weight [29,30,31] while camelina oil is rich in oleic, linoleic, and linolenic acids, which account for up to 65% by weight, and it exhibits a higher iodine value [21,22,23,24,25,26,27,28,29,30,31,32,33].
The number of carbon atoms in the chains of saturated fatty alkyl esters affects density in opposing ways at different temperatures. As temperature rises, the molecular forces increase—more significantly in longer saturated chains. Consequently, with higher temperatures, density increases and the disparity in density between long and short-chain structures diminishes [34].
The specialized literature discusses various studies on diesel–biodiesel blends, focusing primarily on their combustion properties and pollutant emissions [8,18,35,36]. While there are methods which have been proposed to estimate the densities of these blends under different conditions, these methods typically do not utilize specifically trained ANNs. Additionally, the existing research often overlooks the chemical structure of the triglycerides present in vegetable oil.
Building on these considerations, this study examines the synthesis of biodiesel from three vegetable oils with significantly different chemical compositions. Unlike other studies [8,37], this work presents a comprehensive approach to property modeling using neural networks. We provide a comparative analysis of the modeling results for three types of biodiesel: one derived from palm oil, another from Brassica carinata oil, and the last from camelina oil. Given the future potential of using second-generation raw materials, our study stands out by focusing on the comparative results of modeling the physical properties of blends of first-generation biofuels with those of blends combining diesel and second-generation biofuels. Additionally, we emphasize the methodology for biodiesel synthesis. Starting with the oil for which we determined the main physical properties, we produced three types of biodiesel under similar reaction conditions. This approach minimizes the errors that could arise from variations in manufacturing methods.
This research introduces a valuable tool for estimating the density of petrodiesel–biodiesel blends through the use of an artificial neural network specifically trained for this task. Given the significance of fuel blend density in determining the size and distribution of particles injected into the combustion chamber, this approach takes into account both the chemical structure of triglycerides and the influence of temperature.
There is substantial interest in bringing Brassica carinata and camelina oils to market in the context of the production of alternative fuels such as biodiesel or hydrogenated vegetable oil, which is why these oils were selected for the study as vegetable oils with different degrees of unsaturation.
The primary advantage of estimating blending density using the artificial neural network lies in its speed and accuracy compared to traditional methods. Furthermore, current estimations of certain physical properties of alternative fuels often rely on mathematical relationships established for petroleum products, which have a significantly different chemical compositions from that of biodiesel, in terms of hydrocarbons classes and functional groups. Therefore, it is essential to accurately correlate chemical composition with the variations in the properties of alternative fuels.
This methodology stands apart from prior studies by providing a rapid and adaptable mechanism for predicting the densities of biodiesel. When addressing a limited number of properties, this approach demonstrates efficiency due to its tailored nature. Moreover, as research advances and the need for additional data arises, the methodology can be further refined and expanded, thereby enhancing its capability to yield the most accurate estimations.

2. Materials and Methods

2.1. Materials and Reagents

In preparing the biodiesel samples, three distinct vegetable oils with varying degrees of unsaturation were selected: palm oil, representing saturated oils; Brassica carinata oil, classified as partially saturated; and camelina oil, characterized as unsaturated. For the formulation of diesel blends, we utilized a diesel cut obtained from atmospheric distillation, supplied by a Romanian refinery. The methyl alcohol (99.8% anhydrous) and potassium hydroxides employed in the biodiesel synthesis were of analytical grade and sourced from Sigma–Aldrich (Darmstadt, Germany).

2.2. Methods

The vegetable oils and petrodiesel were characterized using several parameters, including density, viscosity at 40 °C, flash point, cloud point, saponification index, unsaturation index, and total acid number, following ASTM and EN standards. The physical and chemical properties of these substances are detailed in Table 1 and Table 2.
The biodiesel synthesis was conducted at a temperature of 65 °C through the catalytic transesterification of triglycerides derived from vegetable oil with methanol. The reaction utilized an oil-to-alcohol molar ratio of 1:4 and was carried out over a period of 3 h, employing potassium hydroxide as the catalyst. The separation of the resulting biodiesel and glycerol phases was achieved via decantation in a vertical separation funnel. Excess methanol, residual catalyst, and soap were eliminated through several hot water washes. The biodiesel yield varied significantly, exhibiting a range extending from 48% for Brassica carinata oil to 82% for palm oil. This variability underscores the influence of feedstock type on biodiesel production efficiency. Following purification, the biodiesel samples were analyzed, and the experimental data obtained is presented in Table 3.

3. Results and Discussion

The differences in the chemical compositions of the three vegetable oils are quantitatively assessed through key parameters including iodine values, kinematic viscosity, saponification index, and freezing point. The iodine value (IV) serves as an indicator of the degree of unsaturation of fatty acids, and is derived from the reactivity of unsaturated fatty acids with halogens. For instance, the iodine value of palm oil is recorded at 59.12 g I2/100 g, which can be attributed to its substantial content of saturated fatty acids, particularly palmitic and stearic acids, comprising nearly 50% of its total composition.
In contrast, camelina oil exhibits the highest iodine value among the oils analyzed, measured at 146.70 g I2/100 g. This elevated value results from a significant presence of unsaturated fatty acids characterized by multiple double bonds within the triglyceride structure, and is specifically comprised of 16.1% monounsaturated and 65% polyunsaturated fatty acids. The structural integrity of the aliphatic chains of fatty acids in vegetable oils remains intact following the transesterification process, preserving the number, position, and configuration of double bonds. Consequently, biodiesel derived from unsaturated oils retains an iodine value comparable to that of the original vegetable oil and biodiesel samples analyzed.
The presence of double bonds within the aliphatic chains renders biodiesel susceptible to oxidative degradation when exposed to atmospheric oxygen, leading to the formation of peroxides. This process can initiate cross-linking and irreversible oligomerization, increasing the risk of oxidation. Contrary to early expectations that the iodine value would decrease with the progression of oxidative degradation, experimental findings reveal that this assumption is not accurate. The iodine value fails to consider the nature of the double bonds—specifically, whether they are conjugated or non-conjugated, as well as their cis versus trans orientations [38]. The most pertinent indicator of oxidative degradation remains the induction period (IP). While the iodine value provides insight into the behavior of biodiesel under heat in relation to the concentration of unsaturated fatty acids, elevated temperatures can promote glyceride polymerization, which may lead to deposit formation and consequently impair the lubrication properties of the fuel [39,40,41]. In the biodiesel samples produced in our study, the first two samples complied with European specifications, exhibiting iodine values below 120 g I2/100 g.
The structural characteristics of the aliphatic chain in fatty acids have a significant impact on kinematic viscosity, which measures flow resistance. One critical factor of the transesterification process, which converts vegetable oils or fats into biodiesel, is the inherently lower viscosity of mono-alkyl esters compared to their parent oils. Kinematic viscosity demonstrates a nonlinear increase with the elongation of the carbon chain, while it decreases with a higher degree of unsaturation. Notably, the viscosity of saturated alkyl esters exceeds that of their unsaturated counterparts. Additionally, an increased level of unsaturation correlates with the formation of oxidation products that exhibit a higher viscosity than the corresponding esters [42,43,44]. Moreover, high viscosity results in decreased injection flow and atomization, leading to incomplete combustion and the accumulation of deposits within the combustion chamber [45,46,47].
A noteworthy observation is that as the number of double bonds in the fatty acid chain increases, the kinematic viscosity of the oil decreases. This phenomenon can be attributed to the configuration of the double bonds. Specifically, cis-configured double bonds create a bend in the otherwise straight chain, leading to lower viscosity compared to trans-configured double bonds, which exhibit viscosity values nearly identical to those of their saturated counterparts [45]. Consequently, the presence of cis double bonds prevents fatty acid molecules from packing closely together. Thus, fatty acids that contain two or more double bonds exhibit a more fluid-like behavior [39]. The experimental results from our study corroborate the previously discussed claims. Among the oils evaluated, palm oil, which contains the highest concentration of saturated fatty acids, displayed the greatest viscosity, quantified at 39.47 mm2/s at 40 °C. In contrast, camelina oil exhibited the lowest viscosity, registering at 25.32 mm2/s. This variance can be attributed to its composition, which includes 65% polyunsaturated fatty acids, reflecting a higher content of double bonds. With regard to the biodiesel samples, the viscosity values reveal a similar trend, although the differences are less pronounced than those noted between the oils themselves. Specifically, palm oil biodiesel recorded a viscosity of 4.49 mm2/s at 40 °C, while camelina oil biodiesel presented a viscosity of 4.02 mm2/s.
The saponification index measures the total fatty acids, both bonded and free, present in vegetable oils or biodiesel. The findings of this research underscore the influence of the molecular characteristics of triglycerides found in these substances on their saponification index. This index reflects the contribution of carboxyl groups within fatty acid chains, indicating a more significant impact from short-chain fatty acids, as demonstrated by the higher values observed in the saponification index.
Research indicates that camelina oil is particularly rich in triglycerides featuring fatty acids with more than 18 carbon atoms per molecule, whether they are monounsaturated or polyunsaturated [31]. Additionally, the proportion of methyl esters containing 18 carbon atoms in camelina biodiesel remains elevated, approximately 70% [45]. In the case of palm oil and palm biodiesel, the proportions of triglycerides containing fatty acids with 18 carbon atoms, as well as the methyl esters with 18 carbon atoms, are approximately 30% lower. This observation clarifies the saponification values: 172.71 mg KOH/g for palm oil and 171.41 mg KOH/g for palm biodiesel, both of which have a reduced proportion of long-chain fatty acids. In contrast, camelina oil and camelina biodiesel, which are richer in long-chain fatty acids, exhibit saponification values of 182.14 mg KOH/g and 181.76 mg KOH/g, respectively. The slightly elevated saponification values for Brassica carinata oil and Brassica carinata biodiesel—174.51 mg KOH/g for the oil and 173.82 mg KOH/g for the biodiesel—can be attributed to the presence of small amounts of free fatty acids.
The cetane number of a biodiesel is influenced by the type and proportion of vegetable oils from which it is derived. These oils primarily consist of eight types of fatty acids: capric acid, lauric acid, myristic acid, palmitic acid, stearic acid, palmitoleic acid, oleic acid, and linoleic acid. An increase in the carbon number of fatty acid methyl esters (FAMEs) generally leads to a higher cetane number (CN). Conversely, a higher degree of unsaturation tends to lower the cetane number. Studies indicate that elevated cetane numbers can reduce the formation of rich fuel mixtures, thereby decreasing the emissions of carbon monoxide (CO) and nitrogen oxides (NOx) [48]. The cetane number for our biodiesel samples was determined using the following equation [49]:
C N = 46.3 + 5458 S V 0.221 × I V
where:
CN = cetane number;
SV = saponification value, mg KOH/g;
IV = iodine value, g I2/100 g.
The results of the calculations indicate a decrease in cetane number with an increase in the degree of unsaturation. This finding aligns with the existing literature [50], in which camelina biodiesel, identified as the most unsaturated in our study, exhibited the lowest cetane number, at 44.39 units.
The experimental findings presented in this study affirm that significant differences exist in the properties of various vegetable oils and the biodiesel derived from them, which is attributable to differences in chemical composition and structure.
The degree of unsaturation in the oils used to produce biodiesel positively influences the pour points of petrodiesel–biocomponent blends. To illustrate this, three vegetable oils with significantly different levels of unsaturation were selected. Palm oil, being saturated, tends to contribute to higher pour-point values, which adversely affects the mixture’s cloud temperature. In contrast, the deeply unsaturated camelina oil does not significantly alter the pour point of the base component. Biodiesel derived from Brassica carinata oil exhibits intermediate properties due to its moderate degree of unsaturation. By utilizing these two types of biocomponents, the need for additional pour-point-depressant additives can be eliminated. Furthermore, both of the selected raw materials with high unsaturation are sourced from crops that can thrive in various climatic conditions and soil types, thereby not competing with agricultural land dedicated to food crops.
Several blends were prepared, consisting of petrodiesel mixed with biodiesel in varying proportions: 5% v/v (blend 1), 10% v/v (blend 2), and 15% v/v (blend 3). Additionally, densities were calculated for each blend, as well as for 100% biodiesel and 100% petrodiesel, at temperatures of 15 °C, 20 °C, 25 °C, 30 °C, 35 °C, and 40 °C. The pycnometer method was employed to determine the density of all the prepared blends, following the formula outlined in Equation (2):
ρ = a b c b × 0.99821 + 0.0012
where:
ρ = density g c m 3 ;
a = the mass of the pycnometer filled with the studied blending (g);
b = mass of the empty pycnometer (g);
c = mass of the pycnometer filled with water (g).
In this experiment, factors b and c from Equation (2) are constant: b = 19.7735 g and c = 44.7528 g. The values pertaining to the mass of the pycnometer when completely filled with the blending material (as indicated by the factor from Equation (2)) are detailed in Table 4, Table 5 and Table 6.
The scale used to determine the pycnometer masses had the following characteristics:
  • Readability (g): 0.001;
  • Repeatability (std. dev) (g): 0.001;
  • Linearity (g): ±0.002.
The obtained results for blending densities are presented in Table 7, Table 8 and Table 9.
These data will be used to train and evaluate an artificial neural network to describe the dependence of biodiesel density on the vegetable oil composition, at temperatures between 15 and 40 °C.
The results obtained from the experimental studies are generally calculated from measured physical quantities. Because the measurement tools and systems induce uncertainties in calculations, the obtained results have uncertainties as well [48]. From among the many methods of calculating the uncertainties, the Kline–McClintock method was used.
According to this method, if the result R is a function of the independent variables x 1 , x 2 , ,   x n , with w 1 , w 2 , ,   w n being the uncertainty of each of the independent variables, the uncertainty of the result is determined according to the following equation [49]:
w R = R x 1 × w 1 2 + R x 2 × w 2 2 + R x 3 × w 3 2 + + R x n × w n 2
Because the blending density depends on three factors, the above formula used to determine the uncertainty of the result can be written as
w R = R x 1 × w 1 2 + R x 2 × w 2 2 + R x 3 × w 3 2
Equation (4) keeps the same notations as Equation (3) does.
From Equation (2), it can be seen that the density of the blending depends on the three aforementioned factors, but the equation also has the constant 0.0012 on the right side. Because constants do not affect the final result, Equation (2) will be written, for uncertainty determination, as follows:
ρ = a b c b × 0.99821  
With the notations kept constant from Equations (3)–(5), the expression will be written as follows:
R = x 1 x 2 x 3 x 2 × 0.99821  
Equation (4) requires the partial derivatives of R to be calculated. These derivatives are presented in Equations (7)–(9):
R x 1 = 0.99821 x 3 x 2  
R x 2 = x 1 x 3 x 3 x 2 2 × 0.99821  
R x 3 = 0.99821 × x 1 x 2 x 3 x 2 2
The results of the calculations of uncertainty for the determined blendings are presented in Table 10, Table 11 and Table 12.
According to Table 10, Table 11 and Table 12, the highest uncertainty for the measured was 6.33 × 10⁻⁶%, which means that the results are highly reliable.

4. Correlation of the Densities of the Studied Blends with Their Properties by Using an Artificial Neural Network

4.1. Artificial Neural Network

For the proposed correlation, the ANN is trained to learn the complex relationships between two or more variables and data sets. The ANN is trained so that a particular input leads to the specific target output. To achieve this result, many input–target pairs are needed. These pairs will later form a training database. There is not an upper limit to the number of such pairs, but “the more, the merrier”. The ANN’s inner characteristics determine the given result for a particular input [14,23]. A correct selection of the appropriate parameters for an ANN can provide insights into the optimal values or value ranges. In this instance, the key characteristics of the situation were as follows:
  • The training data set consists of 30 samples, which suggests that employing two or more hidden layers would be excessive. A single hidden layer can yield similar results while requiring less computational power. Additionally, utilizing only one hidden layer reduces the likelihood of overfitting.
  • The experimental data exhibit low uncertainty, indicating consistency; therefore, it is unnecessary to have a significantly high number of neurons in the hidden layer.
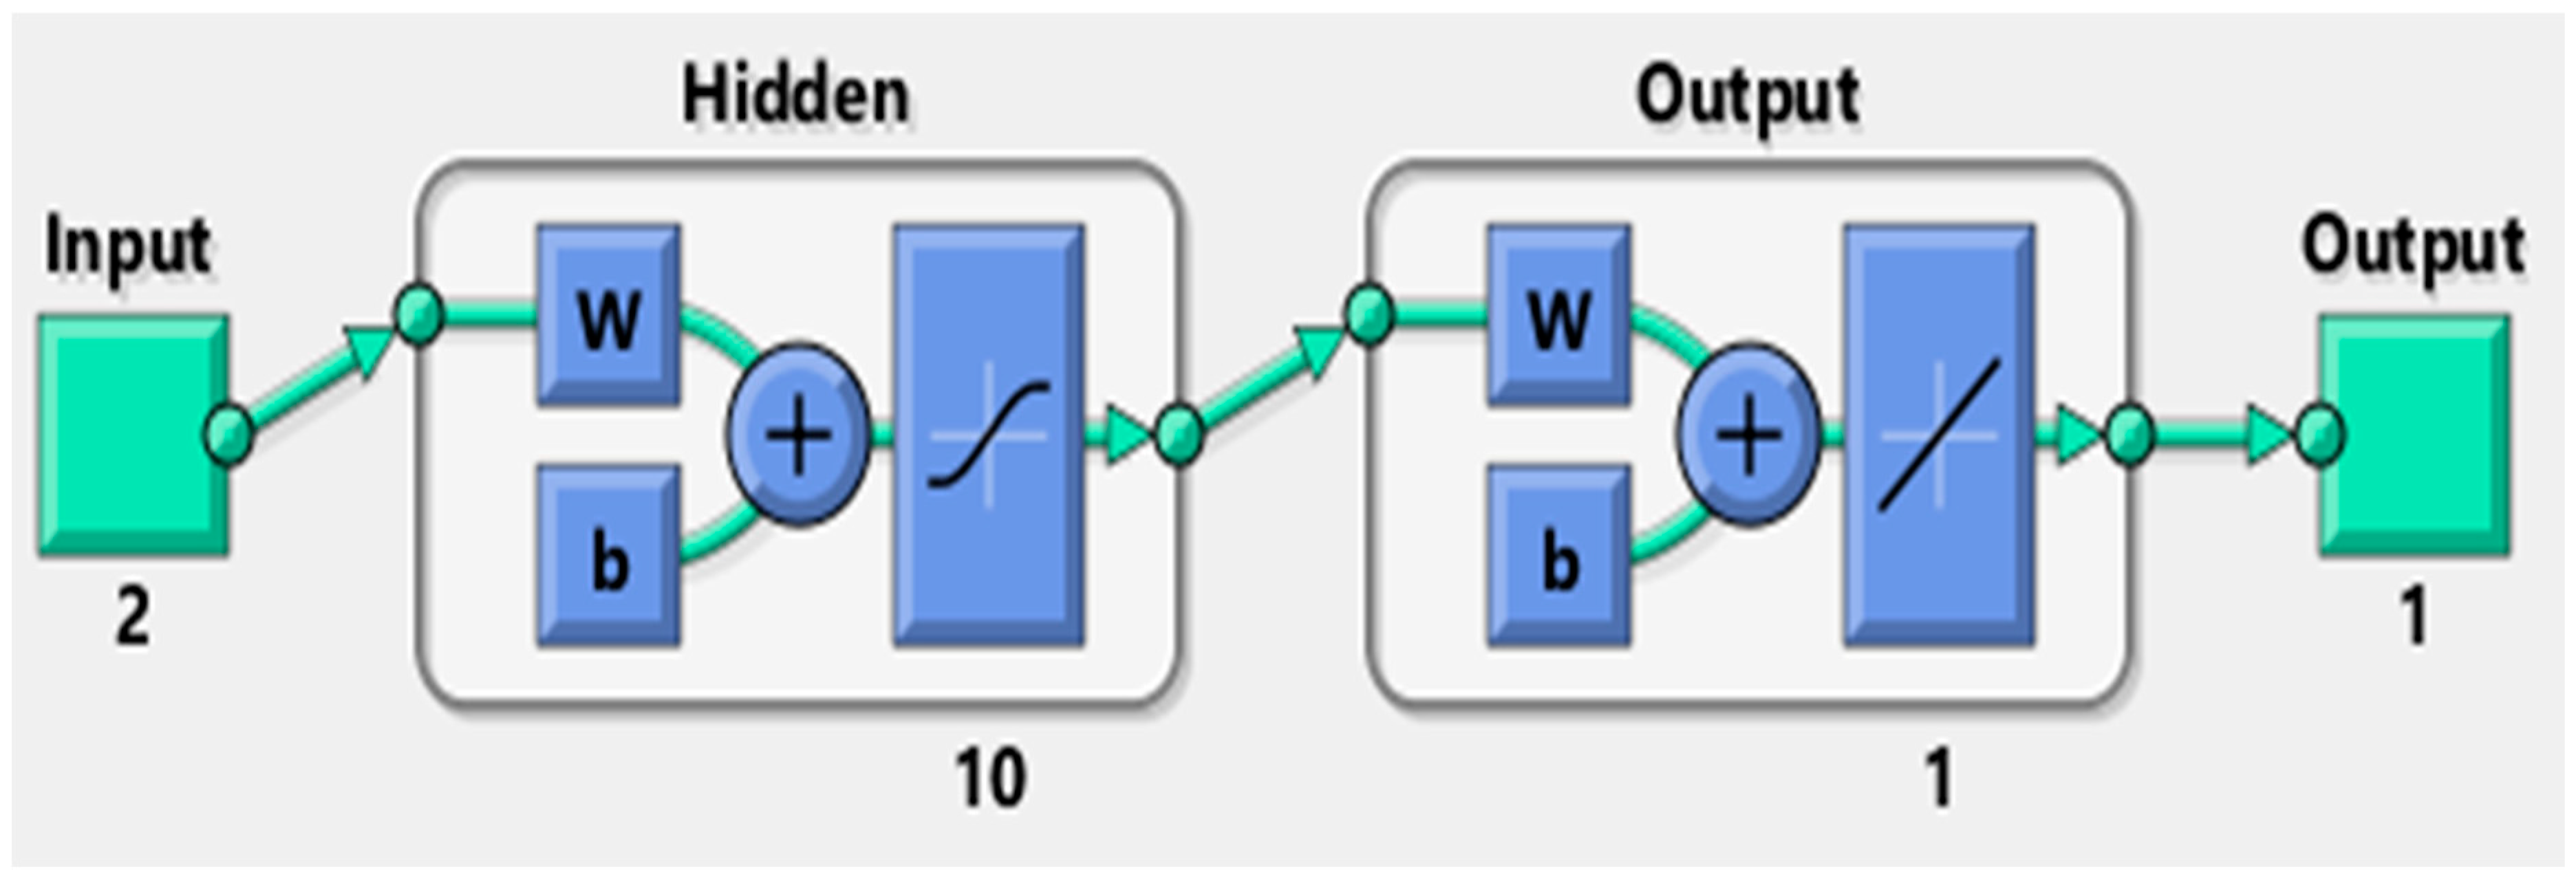
  • With a limited number of inputs (2) and outputs (1), the hidden layer’s role is to process values from the input layer and relay the results to the output layer. A greater number of inputs typically necessitates having more neurons in the hidden layer.

4.2. Artificial Neural Network Modeling

An ANN consists of three interconnected layers: the input layer, the hidden layer, and the output layer. The input layer receives the data and transmits the data to the hidden layer, where the information is processed. Each neuron in the input layer can store a single variable, meaning the number of neurons corresponds to the number of variables in the input data. The hidden layer comprises interconnected neurons that process the information received from the input layer. This processing involves various functions and parameters, including weights and transfer functions. Each neuron’s output is determined by applying a non-linear transfer function to the sum of the processed inputs [50,51].
An artificial neural network (ANN) is not restricted to having just one hidden layer. Neurons that receive the same inputs and employ the same transfer function can be structured into multiple layers. While research has shown that ANNs with two hidden layers can effectively learn almost any input–output relationship, leading to greater estimation accuracy [52], the ANN we will utilize will consist of only a single hidden layer. This choice is primarily due to the limited number of input–target pairs, which does not justify the complexity of incorporating a second hidden layer.
To correctly use an ANN, the following steps must be completed:
  • A clear determination of input and output data.
  • Saving the existing experimental data in a file, under the Matlab accepted format. This step is the creation of the training database.
  • Creating the ANN: In this step, a few important parameters of the artificial neural network are being set, and the rest of the creation process is handled by Matlab.
  • Training the ANN: In this process, it is essential to utilize the created neural network, because the data from the training database are utilized in order to obtain the future correlations, and the training process links the database to the neural network.
  • Verifying the training efficiency: This step is crucial, as it provides insight into the accuracy of the future correlations that will be derived from the neural network. The more effective the training process, the more accurate these future correlations will be, in relation to the data from the training database.
For this particular scenario, the parameters chosen included the following:
  • Number of neurons in the hidden layer: Ranging from 1 to 20;
  • Training algorithms: Levenberg–Marquardt, Bayesian Regularization, and Scaled Conjugate Gradient.
In total, 60 ANN configurations were evaluated, and the one presented in the manuscript emerged as the most effective.

4.3. Data Collection and Selection, Creating the Training Database

The data used to create the training database for the ANN were collected during the experimental plan. Because the experimental plan took into consideration mixtures that contain three different types of oil, three different training databases were created, one for each type of oil and petrodiesel mixture.
The input data for the training database are as follows:
  • The temperatures at which the blending densities listed in Table 3 and Table 5 were determined;
  • The biodiesel content, in volume %, of the same mixtures (the cases in which the mixtures had 0% biodiesel and 100% biodiesel were also taken into consideration).
The output data are the densities of the mixtures taken into consideration, which are presented in Table 3, Table 4 and Table 5. A fragment of the input data used is presented in Table 13. A fragment of the output data used is presented in Table 14.
In Table 13, the numbers on the top row represent the temperatures at which the densities of the blendings which contain palm oil were determined. On the bottom row, the palm oil ratio, in volume percentage, of the blending for which the density was determined is presented.
The data from Table 14 represent the densities specified previously. There is a causal link between the data from Table 13 and the data from Table 14: the input data from a certain column in Table 13 correspond to the output data from the same column in Table 14. As an example, the density at 15 °C of a blending that has 5% vol. palm oil is 899 kg/m3 (the first column from both tables was taken into account).

4.4. ANN Model Analysis

The artificial neural network has many very important parameters that must be set. Among those parameters are the training function, transfer function, number of hidden layers, and number of neurons from the hidden layer(s). The neural network used to estimate the mixtures’ densities was created and trained using the Neural Net Fitting app, which is a part of the Matlab R2015a software. The software will, from now on, be called “Matlab” (Mathworks) [53]. Using this software, the following steps were taken to create and train the network:
  • The necessary data for the training database were converted into a form that was agreeable to the Matlab software.
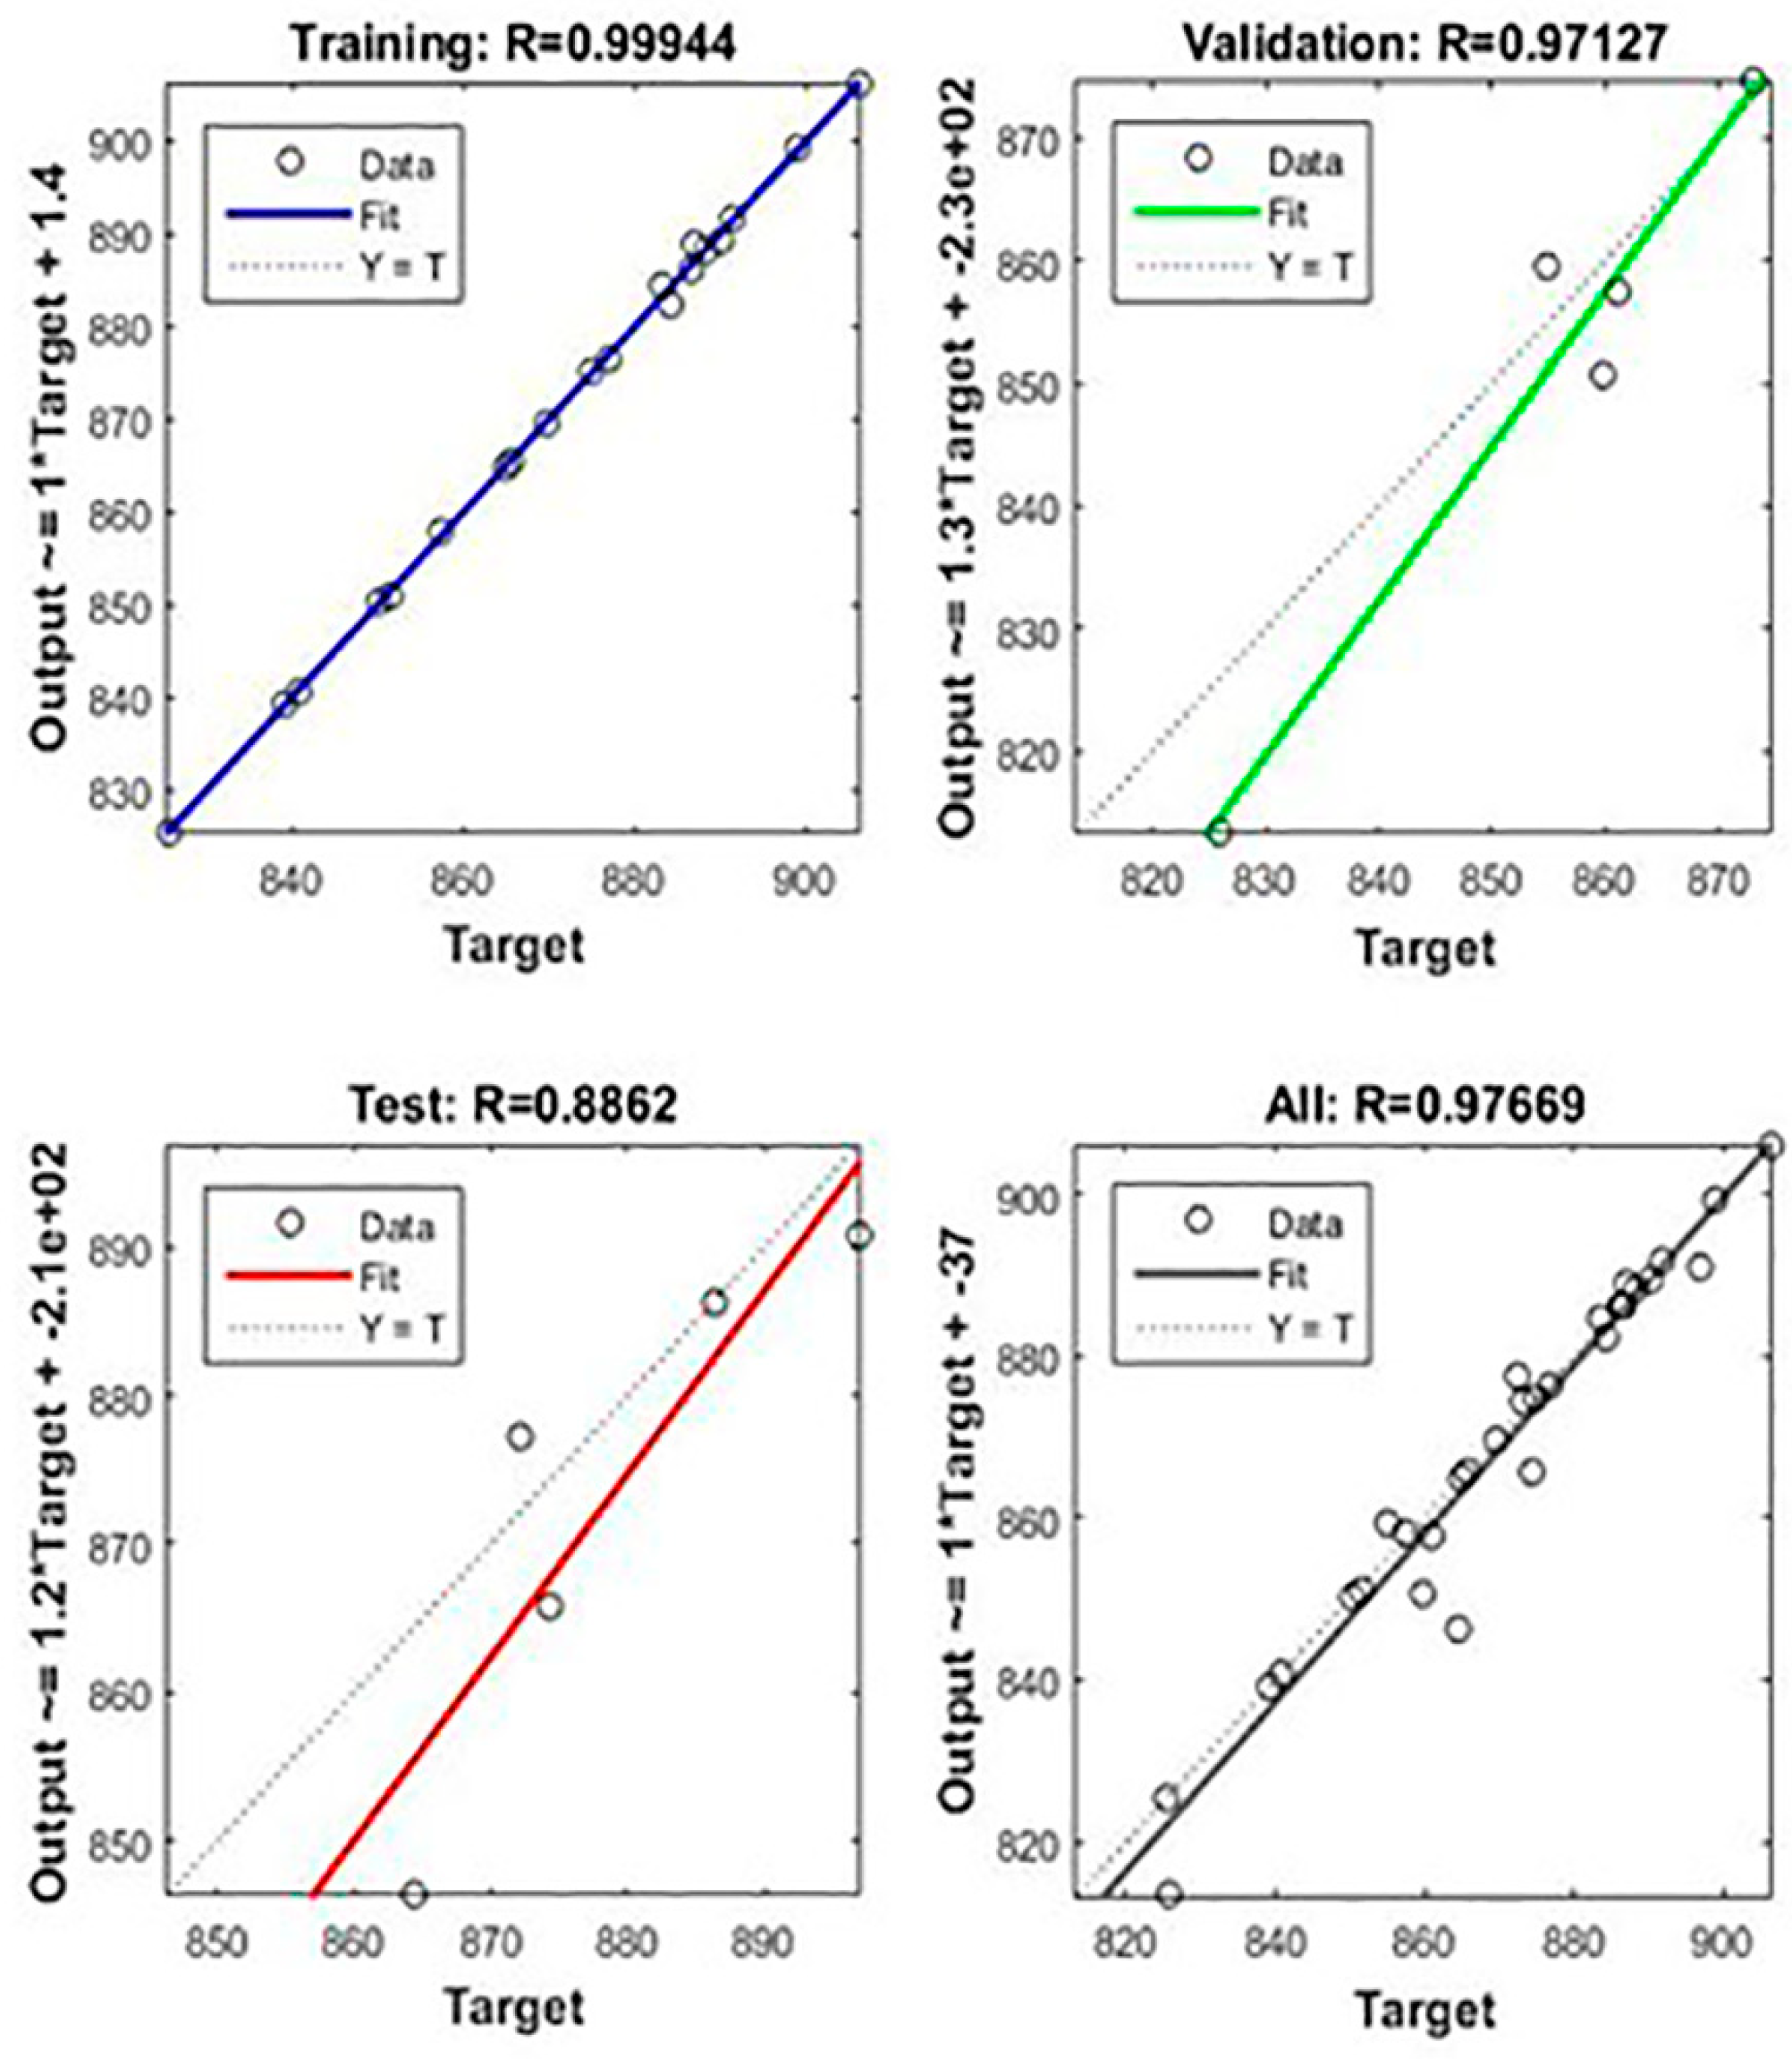
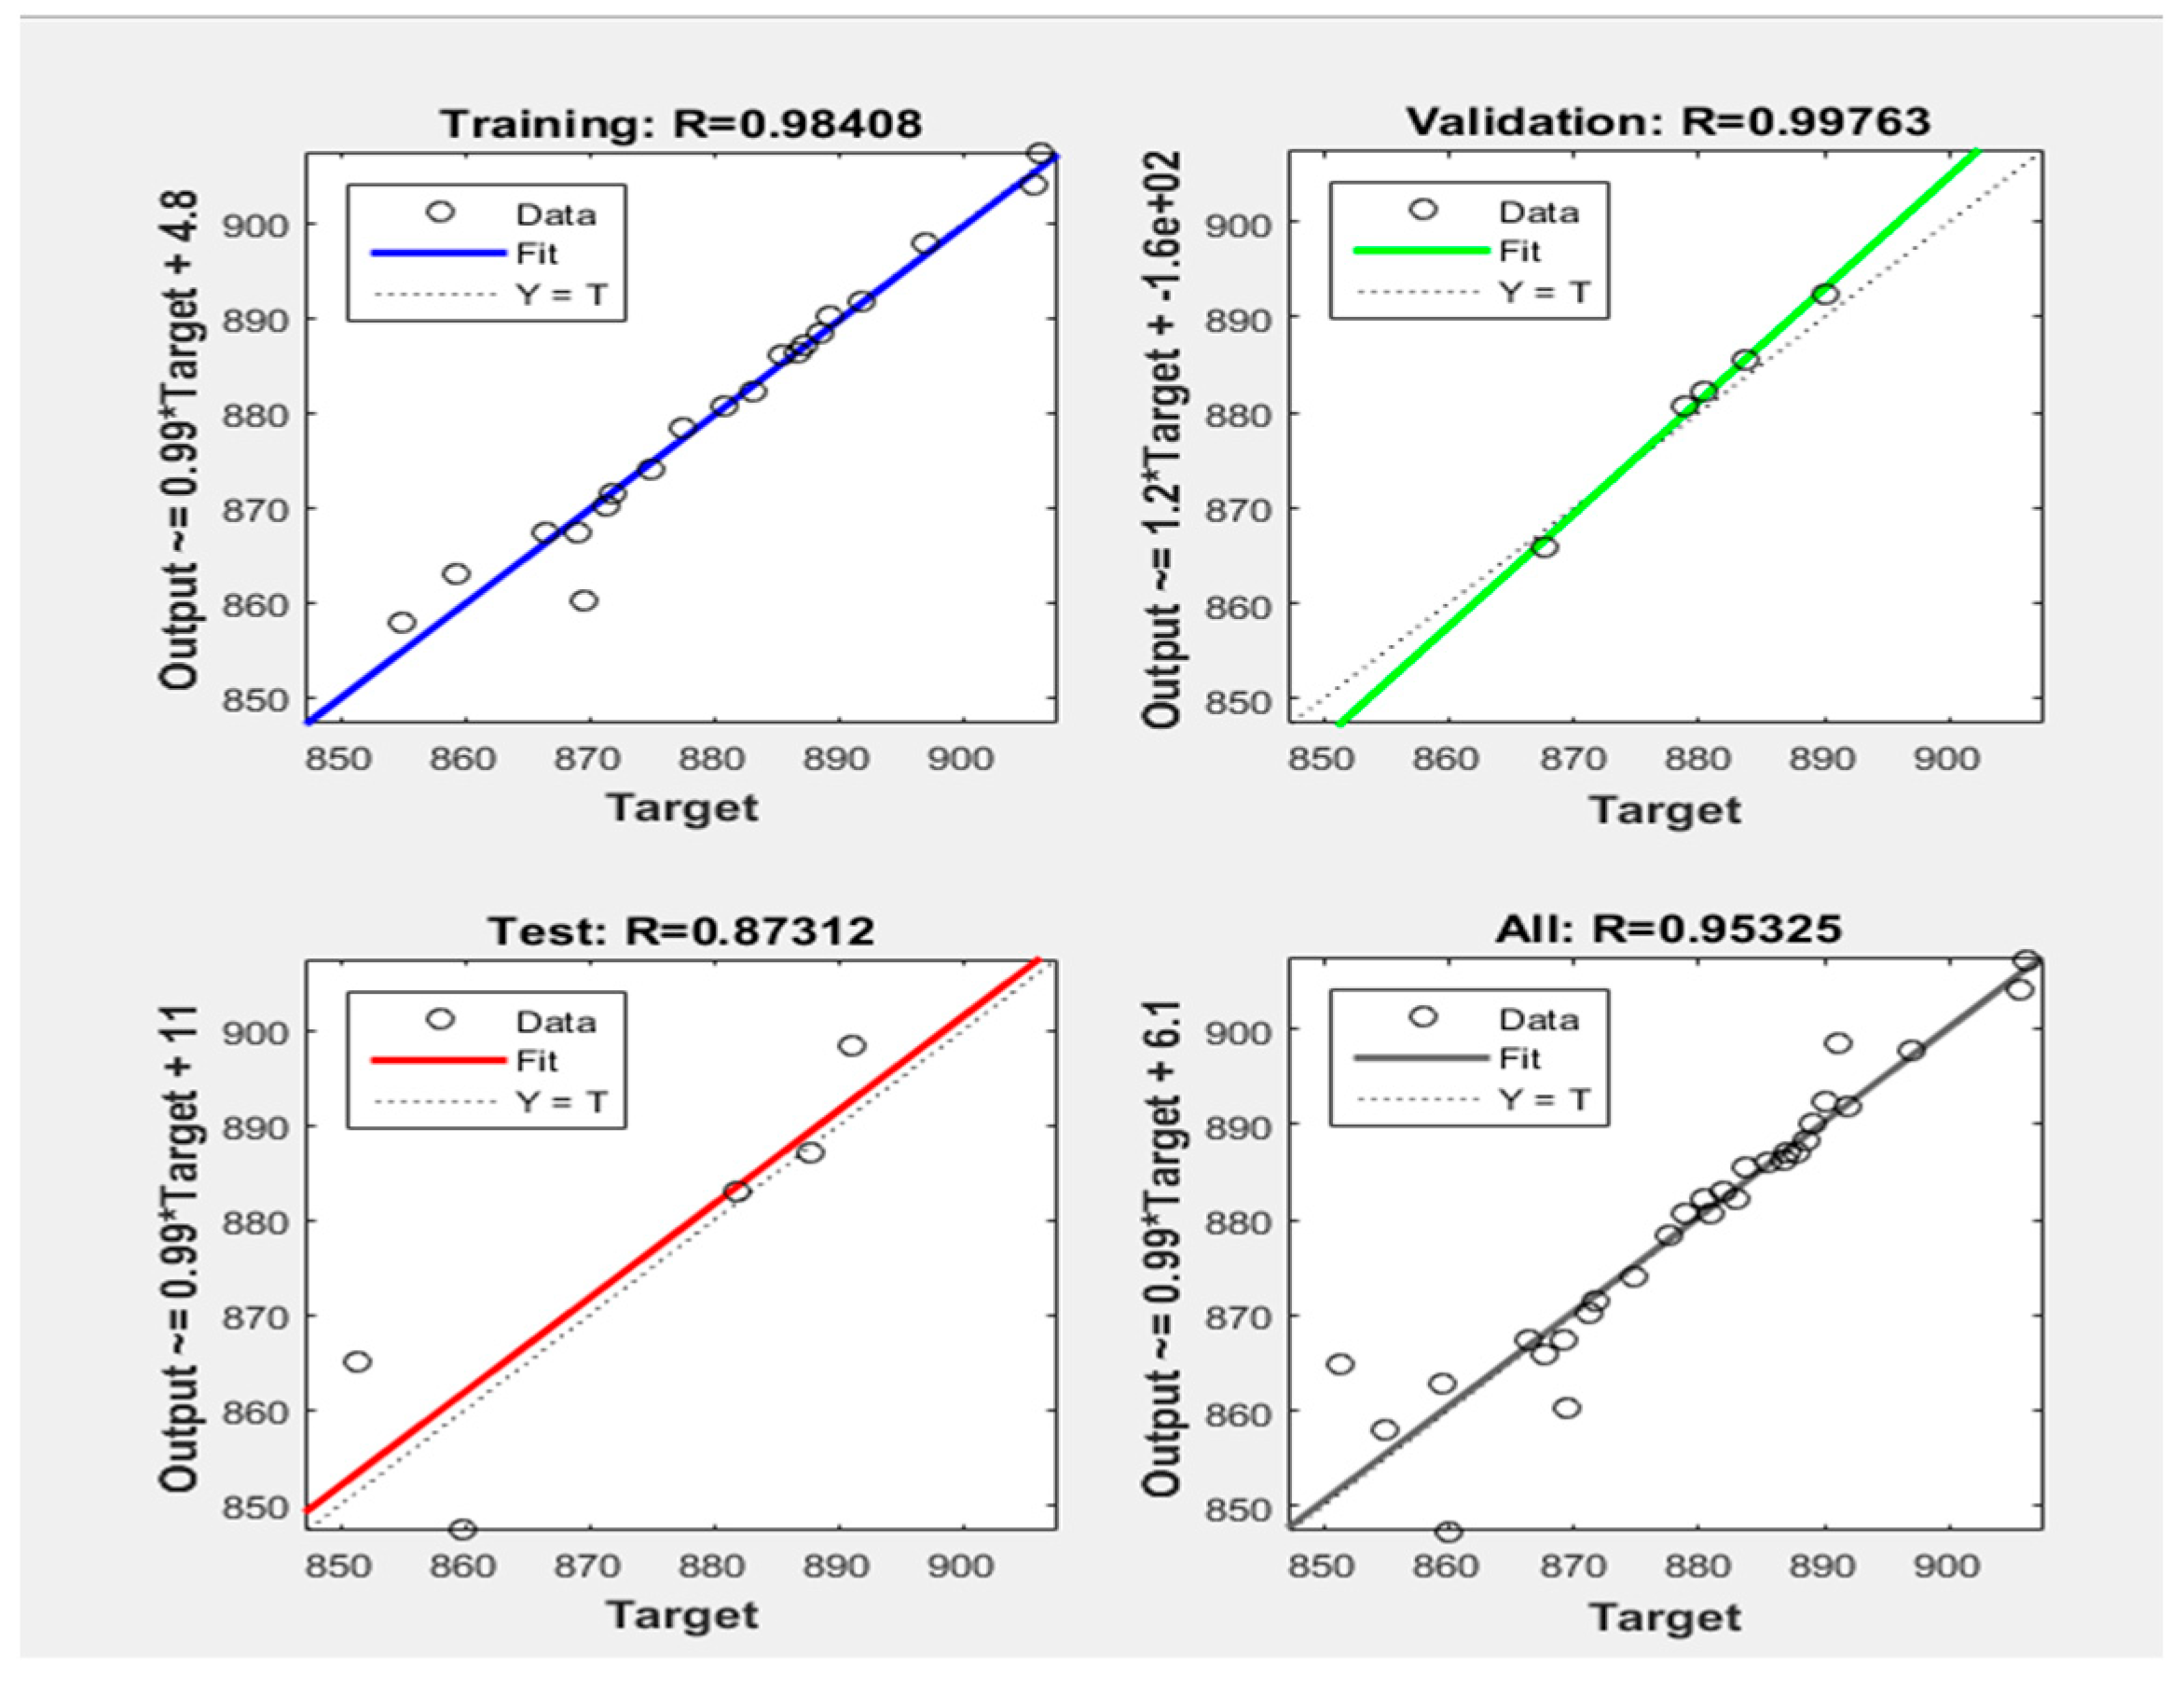
  • The division of the training data into the three categories was 70% training data, 15% validation data, and 15% testing data. The data division was random.
  • The network had one hidden layer. Ten neurons were enough for this experiment. There is not a general rule to determine the optimum number of neurons, so this number was determined through trial and error.
  • As to the training algorithm, the Levenberg–Marquardt algorithm was chosen. The reasons behind this choice are its fast execution speed, fast convergence, and accuracy in training [13,14,53,54]. However, this algorithm requires more memory than the other training algorithms offered by Matlab, the Bayesian Regularization and the Scaled Conjugate Gradient [52].
  • To evaluate the error performance, meaning to determine when the training should end, the mean squared normalized error algorithm was used.
  • Other training parameters (epoch, error goal, etc.) were automatically adjusted by Matlab.
The structure of the artificial neural network that was used for the estimations is presented in Figure 1.

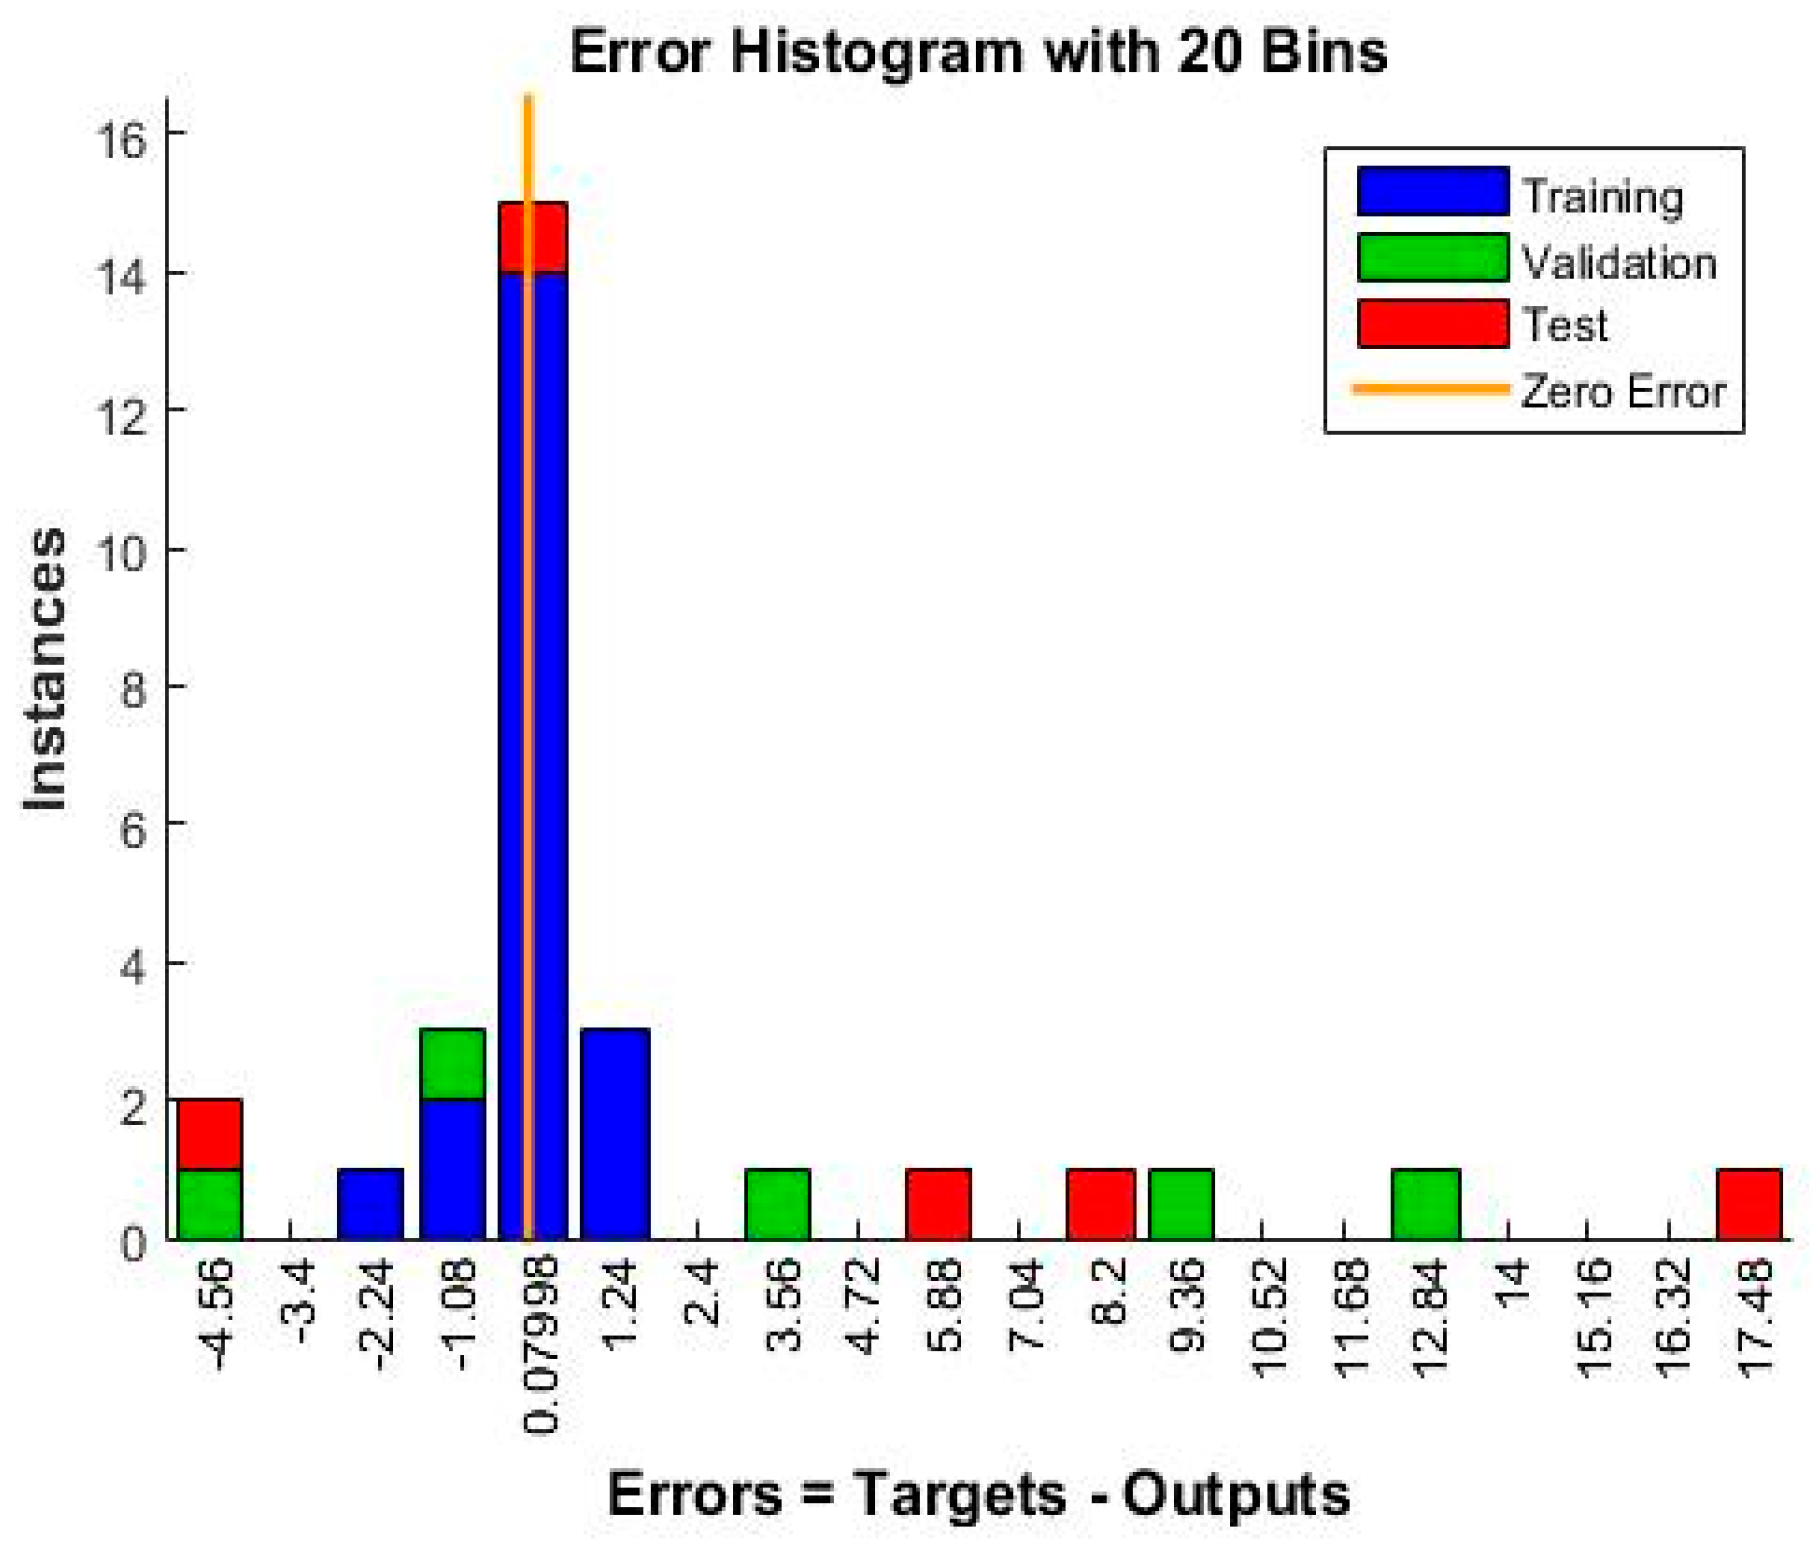
4.5. Neural Network Training, Training Efficiency

The artificial neural network created was trained using the specified parameters. Because three training databases were used, the artificial neural network had to be trained using each of the databases separately. For the petrodiesel–palm biodiesel blends, according to Matlab, 10 epochs were needed to completely train the artificial neural network, and the training time was of roughly one second. Evaluating the training performance of the artificial neural network is a way to detect possible problems that can appear during the training process. The problem that most frequently can occur at this stage is overfitting. The training performance of the ANN used in this paper is represented in Figure 2.
In Figure 2 it can be noticed that the mean squared error of the validation data is the lowest at epoch 4. After the lowest point was encountered, the training continued for six more epochs, then stopped. Because the validation data and the test data have close values throughout the entire training process, it can be stated that nothing wrong happened during the training process. If the test curve had increased significantly compared to the validation curve, then it would have been possible that some overfitting had occurred. As can be seen in Figure 2, this is not the case.
The training state of the artificial neural network is depicted in the diagram below, which presents the variations of the main training parameters (gradient, Mu, and errors; convergence and validation check) in relation to the epochs. The diagram of the training state for the ANN that was used in this paper is presented in Figure 3. It can be noticed that the gradient value drops continuously from the first to the last epoch, reaching its minimum at epoch 10. During the artificial neural network training, the gradient reached the minimum threshold value. This means that the estimation precision gains of the ANN are so low beyond this value that training continuation is not justified anymore.
Before the ANN can be used, it is necessary to verify the training efficiency, because it offers a very good preview of how accurate the estimations will be. The higher the training efficiency, the more accurate the ANN’s predictions will be, in relation to the training data. To verify the training efficiency, two criteria were used: data regression analysis and error histogram. The regression analysis correlates the data from the training database, according to the category in which it was placed. This analysis will offer a positive value, smaller than or equal to 1, for the value noted with R. If R = 1, then the data from the training database are perfectly correlated. If R = 0, then the data are completely random.
The results offered by the data regression analysis for the data in the neural network training database are presented in Figure 4. Very good correlations for the training and validation data (0.99 and 0.97), but a somewhat weaker correlation between the test data (0.88), can be noticed. The weaker test data correlation can be explained by the existence of a low number of data points, which gives a higher weight to the influence of the random factors. However, the overall correlation coefficient is very high (0.97), showing that, despite the poorer correlation of the test data, the training was efficient, and the neural network will estimate accurately.
The error histogram is another way of evaluating the training efficiency. This histogram measures the differences between the target data and the output data. The smaller these differences are, the higher the training efficiency is. The error histogram for the neural network training is presented in Figure 5. In this figure, the fact that most of the resulting differences are around the 0.07 value (close to 0) can be noticed. This proves the high efficiency of the neural network training. Based on Figure 4 and Figure 5, it can be stated that the neural network training was efficient and that the network will offer accurate estimations, relative to the data from the training database.
For the petrodiesel—Brassica carinata biodiesel, nine epochs were needed to complete the training, according to the software; the total training time was less than one second. The training performance for this database is presented in Figure 6. In this figure, it can be noticed that the lowest mean squared error for the validation curve is at epoch 12. The validation and the test curve diverge between epochs 6 and 13, but whether this divergence is the symptom of a training problem cannot be stated. The training state for the ANN is presented in Figure 7. Here, it can be noticed that the gradient value decreases until epoch 18, at which point the training is stopped.
The regression analysis for the correlation of the data from the training database is presented in Figure 8. This figure shows, like Figure 4, a very good correlations for the training and validation data (R = 0.98 and R = 0.99), but a weaker correlation for the test data (R = 0.87). However, the overall data demonstrate a very good correlation (R = 0.95), so the training was efficient, and the artificial neural network will offer good estimations.
The error histogram for the ANN trained with the training database for petrodiesel—Brassica carinata biodiesel blends is presented in Figure 9.
Similar to Figure 5, Figure 9 shows that most errors are gathered near the 0 value. This fact confirms the conclusion drawn from the analysis of Figure 8: the training was efficient.
Finally, the ANN was trained using the training database for petrodiesel—camelina biodiesel blends. The training needed 11 epochs, according to Matlab, and it lasted less than one second. Similar criteria were used to characterize the ANN training using this training database. The training performance for the petrodiesel–camelina biodiesel blends are presented in Figure 10.
In Figure 10 it can be noticed that the lowest mean squared error for the validation curve is at epoch 6. The validation and the test curve have similar trajectories, so there is nothing wrong with the training. The training state is presented in Figure 11. It can be noticed that the lowest value for the gradient is at epoch 11. Given the minimal value observed, it is not justifiable to persist with the training process, as the incremental precision improvement in the neural network appears to be negligible.
The data regression analysis is presented in Figure 12. The data show a slightly different situation, compared to the regression analysis of the other two training databases. Here, the training and the testing data have very good correlations (R = 0.99 and R = 0.98), but the validation data have a lower correlation (R = 0.9). However, like the other two cases, the overall correlation is very good (R = 0.97), showing that the training was efficient.
The error histogram is presented in Figure 13. The data here confirm the conclusion that can be drawn from Figure 12. Because most of the training errors are near the 0 value, the training of the ANN with this training database was efficient and the estimations will be accurate.

4.6. Network Prediction of the Mixtures’ Densities

The next step in the ANN cycle is the actual use of the neural network. To demonstrate the estimation accuracy of the created and trained artificial neural network, the determined and the estimated values for the blending density will be compared. The blends taken into account are the ones obtained in the experimental program. The densities of these blends are presented in Table 4, Table 5 and Table 6. Because there are three types of mixtures, the neural network will estimate the densities separately, having three different training databases.
To estimate the density for each of the mixtures taken into account, the following procedure was created:
  • The artificial neural network had been trained using the training database regarding the petrodiesel—palm biodiesel blends.
  • For each blending created, three estimations had been made. To offset the importance of the random factor induced by the ANN training, multiple estimations are necessary. Because there is no known rule to choose the number of estimations, it was determined through trial and error. In this case, three estimations are enough. Between estimation steps, the network was re-trained using the same training database, to ensure another random distribution of the training data. Without the re-training, the artificial neural network would have given the same estimations, no matter how many times the ANN had been used.
  • The value taken into account for comparison with the determined values is the arithmetic mean of the three estimations specified at the above point.
  • The calculated errors are expressed using two units of measure: kg/m3 and percent. The formulas for the two types of errors are as follows:
E k g m 3 = D M
E % = D M D 100
In the above formulas, D represents the determined density of the blending and M represents the arithmetic mean density.
  • The above steps were repeated for the other two training databases.
In Table 15, the determined and the estimated values for the petrodiesel–palm biodiesel blends are presented.
In Table 15, it can be noticed that the estimation errors of the neural network vary between −7.1% and 3.8%. Most of the errors reside in the −3.4% to 3.8% range, which indicates very good estimations. Table 15 shows the determined and the estimated values for the petrodiesel—Brassica carinata biodiesel blends. The determined values are also presented in Table 7.
In Table 16 it can be seen that the estimation errors range between −4.1% and 3.8%, a range comparable to that from Table 15. The determined and estimated densities for the petrodiesel–camelina biodiesel blends are presented in Table 15. The values determined for these mixtures are also presented in Table 8.
The error ranges in Table 17 are much wider than those from the previous two tables: between −10.3% and 9.1%. In addition, the errors are more scattered than in the previous cases. Because the training data have a good correlation, the only cause for these error ranges would be the fact that the training database is small. Thus, to improve the estimation errors, a larger training database is required.

5. Conclusions

There is significant interest in the commercial development of Brassica carinata and camelina oils for the production of alternative fuels, such as biodiesel and hydrogenated vegetable oil. These experimental results confirm the potential of these vegetable oils for this purpose.
Another crucial aspect of these findings is the potential to estimate various properties of biodiesel mixtures using neural networks. The advantages of this approach include its speed and ease of use, flexibility in selecting the properties to be estimated, and capacity to quickly incorporate newly obtained data into future estimations.
The experimental data demonstrated a strong correlation, indicating that the training process was effective and that the neural network provided accurate estimations based on the training data. The neural network estimation method outlined in this paper can be successfully adapted to other mixtures to estimate different blending properties, catering to user requirements.

Author Contributions

Data curation: B.D.; Software: B.D.; Conceptualization: C.M.D.-V. and B.D.; Investigation: C.M.D.-V., M.B., D.B. and G.V.; Methodology: C.M.D.-V., B.D. and D.B.; Formal analysis: C.M.D.-V., M.B. and G.V.; Writing—Original draft preparation: B.D., C.M.D.-V. and D.B.; Supervision: C.M.D.-V., D.B. and I.O.; Validation: C.M.D.-V., D.B. and I.O.; Writing—review and editing: C.M.D.-V., D.B., M.B. and G.V. All authors have read and agreed to the published version of the manuscript.

Funding

This work was carried out through the PN 23.06 Core Program—ChemNewDeal within the National Plan for Research, Development and Innovation 2022–2027, developed with the support of the Ministry of Research, Innovation, and Digitization, Romania, project no. PN 23.06.02.01 InteGral.

Data Availability Statement

The original contributions presented in this study are included in the article. Further inquiries can be directed to the corresponding author.

Conflicts of Interest

The authors declare no conflicts of interest.

References

  1. Kokkinos, N.C.; Emmanouilidou, E. Waste-to-Energy: Applications and Perspectives on Sustainable Aviation Fuel Production. In Renewable Fuels for Sustainable Mobility. Energy, Environment, and Sustainability; Shukla, P.C., Belgiorno, G., Blasio, G.D., Agarwal, A.K., Eds.; Springer: Singapore, 2023. [Google Scholar] [CrossRef]
  2. Moser, B.R. Influence of extended storage on fuel properties of methyl esters prepared from canola, palm, soybean and sunflower oils. Renew. Energy 2011, 36, 1221–1226. [Google Scholar] [CrossRef]
  3. Can, O.; Baklacioglu, T.; Ozturk, E.; Turan, O. Artificial neural networks modeling of combustion parameters for a diesel engine fueled with biodiesel fuel. Energy 2022, 247, 123473. [Google Scholar] [CrossRef]
  4. Sajjadi, B.; Raman, A.A.A.; Arandiyan, H. A comprehensive review on properties of edible and non-edible vegetable oil-based biodiesel: Composition, specifications and prediction models. Renew. Sustain. Energy Rev. 2016, 63, 62–92. [Google Scholar] [CrossRef]
  5. Betiku, E.; Ajala, S.O. Modeling and optimization of Thevetia peruviana (yellow oleander) oil biodiesel synthesis via Musa paradisiacal (plantain) peels as a heterogeneous base catalyst: A case of artificial neural network vs. response surface methodology. Ind. Crop. Prod. 2014, 5, 314–322. [Google Scholar] [CrossRef]
  6. EN14214; Automotive Fuels—Fatty Acid Methyl Esters (FAME) for Diesel Engines—Requirements and Test Methods. CEN: Brussels, Belgium, 2009.
  7. Tsanaktsidis, C.G.; Spinthoropoulos, K.G.; Christidis, S.G.; Sariannidis, N. Mathematical models for calculating the density of petroleum diesel fuel/biodiesel blends. Chem. Technol. Fuels Oil 2013, 49, 399–405. [Google Scholar] [CrossRef]
  8. Hoang, A.T.; Nižetić, S.; Ong, H.C.; Tarelko, W.; Pham, V.V.; Le, T.H.; Chau, M.Q.; Nguyen, X.P. A review on application of artificial neural network (ANN) for performance and emission characteristics of diesel engine fueled with biodiesel-based fuel. Sustain. Energy Technol. Assess. 2021, 47, 101416. [Google Scholar] [CrossRef]
  9. Jahirul, M.I.; Rasul, M.G.; Brown, R.J.; Senadeera, W.; Hosen, M.A.; Haque, R.; Saha, S.C.; Mahlia, T.M.I. Investigation of correlation between chemical composition and properties of biodiesel using principal component analysis (PCA) and artificial neural network (ANN). Renew. Energy 2021, 168, 632–646. [Google Scholar] [CrossRef]
  10. Rocabruno-Valdés, C.I.; Ramírez-Verduzco, L.F.; Hernández, J.A. Artificial neural network models to predict density, dynamic viscosity and cetane number of biodiesel. Fuel 2015, 147, 9–17. [Google Scholar] [CrossRef]
  11. Kumar, J.; Bansal, A. Selection of Best Neural Network for Estimating Properties of Diesel-Biodiesel Blends. In Proceedings of the 6th WSEAS Int. Conf. on Artificial Intelligence, Knowledge Engineering and Data Bases, Corfu Island, Greece, 16–19 February 2007; pp. 136–141. Available online: https://dl.acm.org/doi/abs/10.5555/1348485.1348509 (accessed on 28 May 2025).
  12. Kumar, J.; Bansal, A. Application of artificial neural network to predict properties of diesel—Biodiesel blends. Kathmandu Univ. J. Sci. Eng. Technol. 2010, 6, 98–103. [Google Scholar] [CrossRef]
  13. Balabin, R.M.; Lomakina, E.I.; Safieva, R.Z. Neural network (ANN) approach to biodiesel analysis: Analysis of biodiesel density, kinematic viscosity, methanol and water contents using near-infrared (NIR) spectroscopy. Fuel 2011, 90, 2007–2015. [Google Scholar] [CrossRef]
  14. Giwa, S.O.; Adekomaya, S.O.; Adama, K.O.; Mukaila, M.O. Prediction of selected biodiesel fuel properties using artificial neural network. Front. Energy 2015, 9, 433–445. [Google Scholar] [CrossRef]
  15. Mejia, J.D.; Salgado, N.; Orrego, C.E. Effect of blends of Diesel and Palm-Castor biodiesels on viscosity, cloud point and flash point. Ind. Crop. Prod. 2013, 43, 791–797. [Google Scholar] [CrossRef]
  16. Omidvarborna, H.; Kumar, A.; Kim, D.S. NOX emissions from low-temperature combustion of biodiesel made of various feedstocks and blends. Fuel Process. Technol. 2015, 140, 113–118. [Google Scholar] [CrossRef]
  17. Zhang, Y.; Duan, L.; Esmaeili, H. A review on biodiesel production using various heterogeneous nanocatalysts: Operation mechanisms and performances. Biomass Bioenergy 2022, 158, 106356. [Google Scholar] [CrossRef]
  18. Gheorghe, C.G.; Pântea, O.; Matei, V.; Bomboș, D.; Borcea, A.F. Testing the biodegradation of contaminated water with petroleum products Through conventional treatment in comparison with treatment through biological sludge enriched with activated charcoal. Rev. Chim. 2011, 62, 655–658. [Google Scholar]
  19. Cursaru, D.; Neagu, M.; Bogatu, L. Investigations on the oxidation stability of biodiesel synthesized from different vegetable oils. Rev. Chim. 2013, 64, 438–441. [Google Scholar]
  20. Dey, S.; Reang, N.M.; Das, P.K.; Deb, M. Comparative study using RSM and ANN modeling for performance-emission prediction of CI engine fuelled with bio-diesohol blends: A fuzzy optimization approach. Fuel 2021, 292, 120356. [Google Scholar] [CrossRef]
  21. Hirner, F.S.; Hwang, J.; Bae, C.; Patel, C.; Gupta, T.; Agarwal, A.K. Nanostructure characterization of soot particles from biodiesel and diesel spray flame in a constant volume combustion chamber. Fuel 2019, 235, 130–149. [Google Scholar] [CrossRef]
  22. Babu, D.; Karvembu, R.; Anand, R. Impact of split injection strategy on combustion, performance and emissions characteristics of biodiesel fuelled common rail direct injection assisted diesel engine. Energy 2018, 165, 577–592. [Google Scholar] [CrossRef]
  23. Aydına, M.; Uslub, S.; Çelikb, M.B. Performance and emission prediction of a compression ignition engine fueled with biodiesel-diesel blends: A combined application of ANN and RSM based optimization. Fuel 2020, 269, 117472. [Google Scholar] [CrossRef]
  24. Pourhoseini, S.H.; Mahboub, M.N.; Hosseini, E.; Alimoradi, A. A comparative exploration of thermal, radiative and pollutant emission characteristics of oil burner flame using palm oil biodiesel-diesel blend fuel and diesel fuel. Energy 2021, 217, 119338. [Google Scholar] [CrossRef]
  25. Kumar, P.V.; Ashok, B.; Kumar, M.S.; Vignesh, R.; Bhasker, J.P.; Kumar, A.N. Evaluation of performance, emissions and combustion attributes of CI engine using palmyra biodiesel blend with distinct compression ratios, EGR rates and nano-particles. Fuel 2022, 321, 124092. [Google Scholar] [CrossRef]
  26. Navaneeth, P.V.; Suraj, C.K.; Mehta, P.S.; Anand, K. Predicting the effect of biodiesel composition on the performance and emission of a compression ignition engine using a phenomenological model. Fuel 2021, 293, 120453. [Google Scholar] [CrossRef]
  27. Hosamani, B.R.; Doddi, S.; Puthani, P. Assessment of density and kinematic viscosity of two methyl ester blends at elevated temperatures. Mater. Today Proc. 2022, 56, 1588–1593. [Google Scholar] [CrossRef]
  28. Thomas, A. Fatts and Fatty Acids, in Ullmann’s Encyclopedia of Industrial Chemistry, 6th ed.; Wiley-VCH Verlag GmbH & Co. KgaA: Weinheim, Germany, 2002. [Google Scholar] [CrossRef]
  29. Seepaul, R.; Small, I.M.; Devkota, P.; Sintim, H.Y.; Mulvaney, M.J.; George, S.; Leon, R.G.; Paula-Moraes, S.V.; Esquivel, I.L.; Bennett, R.; et al. Carinata, the Sustainable Crop for a Bio-Based Economy: Production Recommendations for the Southeastern United States, SS-AGR-384; University of Florida: Gainesville, FL, USA, 2023. [Google Scholar] [CrossRef]
  30. Mohdaly, A.A.A.; Ramadan, M.F. Characteristics, composition and functional properties of seeds, seed cake and seed oil from different Brassica carinata genotypes. Food Biosci. 2022, 48, 100752. [Google Scholar] [CrossRef]
  31. Li, J.; Su, Y.; Shapiro, C.A.; Schachtman, D.P.; Wang, X. Phosphate deficiency modifies lipid composition and seed oil production in camelina. Plant Sci. 2023, 330, 111636. [Google Scholar] [CrossRef]
  32. Mansuri, S.; Bakhshabadi, H.; Moghimi, M.; Tahmasebi, A.; Gharekhani, M. Evaluating the physicochemical properties of camelina (Camelina sativa) seed oil obtained through optimized ultrasonic-assisted extraction. Ultrason. Sonochemistry 2025, 118, 107371. [Google Scholar] [CrossRef] [PubMed]
  33. Aslam, M.M.; Khan, A.A.; Cheema, H.M.N.; Hanif, M.A.; Azeem, M.W.; Azmat, M.A. Novel mutant camelina and jatropha as valuable feedstocks for biodiesel production. Sci. Rep. 2020, 10, 21868. [Google Scholar] [CrossRef] [PubMed]
  34. Zheng, Y.; Shadloo, M.S.; Nasiri, H.; Maleki, A.; Karimipour, A.; Tlili, I. Prediction of viscosity of biodiesel blends using various artificial model and comparison with empirical correlations. Renew. Energy 2020, 153, 1296–1306. [Google Scholar] [CrossRef]
  35. Pitchaiah, S.; Juchelkov, D.; Sathyamurthy, R.; Atabani, A.E. Prediction and performance optimisation of a DI CI engine fuelled diesel–Bael biodiesel blends with DMC additive using RSM and ANN: Energy and exergy analysis. Energy Convers. Manag. 2023, 292, 117386. [Google Scholar] [CrossRef]
  36. Mahmodi, K.; Mostafaei, M.; Mirzaee-Ghaleh, E. Detecting the different blends of diesel and biodiesel fuels using electronic nose machine coupled ANN and RSM methods. Sustain. Energy Technol. Assess. 2021, 51, 101914. [Google Scholar] [CrossRef]
  37. Zikri, J.M.; Sani, M.S.M.; Rashid, M.F.F.A.; Muriban, J.; Prayogo, G.S. Predictive modeling and optimization of noise emissions in a palm oil methyl ester-fueled diesel engine using response surface methodology and artificial neural network integrated with genetic algorithm. Int. J. Thermofluids 2025, 26, 101103. [Google Scholar] [CrossRef]
  38. Mishra, S.; Bukkarapu, K.R.; Krishnasamy, A. A composition based approach to predict density, viscosity and surface tension of biodiesel fuel. Fuel 2021, 285, 119056. [Google Scholar] [CrossRef]
  39. Xue, S.; Hou, K.; Zhang, Z.; Liu, H.; Zhu, C.; Liu, X.; He, M. General models for prediction densities and viscosities of saturated and unsaturated fatty acid esters. J. Mol. Liq. 2021, 341, 117374. [Google Scholar] [CrossRef]
  40. Dantas, M.B.; de Biodiesel, B. Estabilidade Térmica e Oxidativa e Monitoramento Durante Armazenamento. Master’s Thesis, Universidade Federal da Paraíba, João Pessoa, Brazil, 2010. [Google Scholar]
  41. Bandbafha, H.H.; Kumar, D.; Singh, B.; Shahbeig, H.; Lam, S.S.; Aghbashlo, M.; Tabatabaei, M. Biodiesel antioxidants and their impact on the behavior of diesel engines: A comprehensive review. Fuel Process. Technol. 2022, 232, 107264. [Google Scholar] [CrossRef]
  42. Ramírez-Verduzco, L.F.; García-Flores, B.E.; Rodríguez-Rodríguez, J.E. Prediction of the density and viscosity in biodiesel blends at various temperatures. Fuel 2011, 90, 1751–1761. [Google Scholar] [CrossRef]
  43. Knothe, G. Some aspects of biodiesel oxidative stability. Fuel Process. Technol. 2007, 88, 669–677. [Google Scholar] [CrossRef]
  44. Freire, L.M.S.; Filho, J.R.C.; Moura, C.V.R.; Soledade, L.E.B.; Stragevitch, L.; Cordeiro, A.M.T.M.; Santos, I.M.G.; Souza, A.G. Evaluation of the oxidative stability and flow properties of quaternary mixtures of vegetable oils for biodiesel production. Fuel 2012, 95, 126–130. [Google Scholar] [CrossRef]
  45. Park, J.Y.; Kim, D.K.; Lee, J.P.; Park, S.C.; Kim, Y.J.; Lee, J.S. Blending effects of biodiesels on oxidation stability and low temperature flow properties. Bioresour. Technol. 2008, 99, 1196–1203. [Google Scholar] [CrossRef]
  46. Alvisoa, D.; Záratea, C.; Durieza, T. Modeling of vegetable oils cloud point, pour point, cetane number and iodine number from their composition using genetic programming. Fuel 2021, 284, 119026. [Google Scholar] [CrossRef]
  47. Esteban, B.; Riba, J.R.; Baquero, G.; Rius, A.; Puig, R. Temperature dependence of density and viscosity of vegetable oils. Biomass Bioenergy 2012, 42, 164–171. [Google Scholar] [CrossRef]
  48. Folayan, A.J.; Anawe, P.A.L.; Aladejare, A.E.; Ayeni, A.O. Experimental investigation of the effect of fatty acids configuration, chain length, branching and degree of unsaturation on biodiesel fuel properties obtained from lauric oils, high-oleic and high-linoleic vegetable oil biomass. Energy Rep. 2019, 5, 793–806. [Google Scholar] [CrossRef]
  49. Brahma, S.; Nath, B.; Basumatary, B.; Das, B.; Saikia, P.; Patir, K.; Basumatary, S. Biodiesel production from mixed oils: A sustainable approach towards industrial biofuel production. Chem. Eng. J. Adv. 2022, 10, 100284. [Google Scholar] [CrossRef]
  50. Gülüm, M.; Bilgin, A. Density, flash point and heating value variations of corn oil biodiesel–diesel fuel blends. Fuel Process. Technol. 2015, 134, 456–464. [Google Scholar] [CrossRef]
  51. Holman, J.P. Experimental Methods for Engineers, 7th ed.; McGraw-Hill: New York, NY, USA, 2001. [Google Scholar]
  52. MathWorks Inc. MATLAB R2015a Help System; MA, USA, 2015; Available online: http://www.mathworks.com/ (accessed on 2 March 2025).
  53. Cheenkachorn, K. Predicting properties of biodiesel using statistical models and artificial neural networks. In Proceedings of the Joint International Conference on Sustainable Energy and Environment, Hua Hin, Thailand, 1–2 June 2004; pp. 176–179. [Google Scholar]
  54. Meng, X.; Jia, M.; Wang, T. Neural network prediction of biodiesel kinematic viscosity at 313K. Fuel 2014, 121, 133–140. [Google Scholar] [CrossRef]
Figure 1. Structure of the ANN that was used to estimate the mixtures’ densities.
Processes 13 01769 g001
Figure 2. Training performance of the artificial neural network for the petrodiesel—palm biodiesel blends.
Processes 13 01769 g002
Figure 3. Training state values for the petrodiesel—palm biodiesel blends.
Processes 13 01769 g003
Figure 4. Regression analysis results used to determine the ANN training efficiency for the petrodiesel—palm biodiesel blends.
Processes 13 01769 g004
Figure 5. Error histogram used to determine the ANN training efficiency for the petrodiesel—palm biodiesel blends.
Processes 13 01769 g005
Figure 6. Training performance of the artificial neural network for the petrodiesel—Brassica carinata biodiesel blends.
Processes 13 01769 g006
Figure 7. Training state values for petrodiesel—Brassica carinata biodiesel blends.
Processes 13 01769 g007
Figure 8. Regression analysis results used to determine the ANN training efficiency for petrodiesel—Brassica carinata biodiesel blends.
Processes 13 01769 g008
Figure 9. Error histogram used to determine the ANN training efficiency for petrodiesel—Brassica carinata biodiesel blends.
Processes 13 01769 g009
Figure 10. Training performance of the artificial neural network for the petrodiesel—camelina biodiesel blends.
Processes 13 01769 g010
Figure 11. Training state values for petrodiesel—camelina biodiesel blends.
Processes 13 01769 g011
Figure 12. Regression analysis results used to determine the ANN training efficiency for petrodiesel—camelina biodiesel blends.
Processes 13 01769 g012
Figure 13. Error histogram used to determine the ANN training efficiency for petrodiesel—camelina biodiesel blends.
Processes 13 01769 g013
Table 1. Properties of the vegetable oils.
TestsSampleMethod
Palm OilBrassica carinata OilCamelina Oil
Density (at 20 °C, kg/m3)919.6914.5918.1EN ISO 3838
Refractive index (at 20 °C)1.46381.47401.4754ASTM D-1218
Viscosity (at 40 °C, mm2/s)39.4768.5625.32EN ISO 3104
Saponification index (mg KOH/g)172.21174.51182.14EN ISO 3657
Iodine value (g I2/100 g) 59.1296.12146.70EN-14111
Total acidity number (mg KOH/g)2.170.791.38ASTM D-1980
Cloud point (°C)284−11ASTM D-2500
Table 2. Physical and chemical properties of the petrodiesel.
Property, u.m.Density
(at 20 °C, kg/m3)
Refractive Index
(at 20 °C)
Total Acidity Number,
(mg KOH/g)
Iodine Value,
(g I2/100 g)
Cloud Point, (°C)Flash Point, (°C)
Petrodiesel, experimental data896.91.47560.58.585<−2571
Petrodiesel,
Standard value
820–845---−10<55
Table 3. Physical and chemical characteristics of the biodiesels.
TestsBiodiesel SampleStandard ValueMethod
PalmBrassica CarinataCamelinaEN 14214
Density (at 20 °C, kg/m3)864.9883.6970.9860–900EN ISO 3838
Refractive index (at 20° C)1.4483 1.4570 1.4575 -ASTM D-1218
Viscosity (at 40 °C, mm2/s)18.4924.374.093.5–5EN ISO 3104
Saponification index (mg KOH/g)171.41 173.82 181.76 -EN ISO 3657
Iodine value (g I2/100 g) 55.9092.41 141.9<120EN-14111
Total acidity number (mg KOH/g)1.241.371.07<0.5ASTM D-1980
Cloud point (°C)38,442.5ReportASTM D-2500
Cetane number65.5656.9044.39>51Calculated
Table 4. Pycnometer mass filled with petrodiesel—palm biodiesel blends (g).
SampleBlend 1Blend 2Blend 3BiodieselPetrodiesel
Density at 15 °C42.235241.972441.622041.592042.4203
Density at 20 °C42.054941.924841.404341.386842.1876
Density at 25 °C41.939841.869841.196641.259242.0174
Density at 30 °C41.847341.687141.046541.016441.9348
Density at 35 °C41.569541.506940.743740.781241.6370
Density at 40 °C41.291741.374340.408440.398341.1366
Table 5. Pycnometer mass filled with petrodiesel—Brassica carinata biodiesel blends (g).
SampleBlend 1Blend 2Blend 3BiodieselPetrodiesel
Density at 15 °C42.405242.042441.994941.979942.4203
Density at 20 °C42.062541.942341.899841.854742.1876
Density at 25 °C41.959941.839741.784741.702142.0174
Density at 30 °C41.812241.777241.734641.559541.9348
Density at 35 °C41.546941.491941.454441.426841.6370
Density at 40 °C41.501941.249241.046541.261741.1366
Table 6. Pycnometer mass filled with petrodiesel—camelina biodiesel blends (g).
SampleBlend 1Blend 2Blend 3BiodieselPetrodiesel
Density at 15 °C42.460342.760642.963344.224542.4203
Density at 20 °C42.247642.663042.878244.039342.1876
Density at 25 °C41.999842.425342.595443.894242.0174
Density at 30 °C41.924842.332742.365243.573941.9348
Density at 35 °C41.759741.949842.102443.303641.6370
Density at 40 °C41.229141.384341.667143.103541.1366
Table 7. Densities of petrodiesel—palm biodiesel blends (kg/m3).
SampleBlend 1Blend 2Blend 3BiodieselPetrodiesel
Density at 15 °C899.0888.3874.3873.1906.2
Density at 20 °C891.6886.4865.6864.9896.9
Density at 25 °C887.0884.2857.3859.8890.1
Density at 30 °C883.3876.9851.3850.1886.8
Density at 35 °C872.2869.7839.2840.7874.9
Density at 40 °C861.1864.4825.8825.4854.9
Table 8. Densities of petrodiesel—Brassica carinata biodiesel blends (kg/m3).
SampleBlend 1Blend 2Blend 3BiodieselPetrodiesel
Density at 15 °C905.6891.1889.2888.6906.2
Density at 20 °C891.9887.1885.4883.6896.9
Density at 25 °C887.8883.0880.8877.5890.1
Density at 30 °C881.9880.5878.8871.8886.8
Density at 35 °C871.3869.1867.6866.5874.9
Density at 40 °C869.5859.4851.3859.9854.9
Table 9. Densities of petrodiesel—camelina biodiesel blends (kg/m3).
SampleBlend 1Blend 2Blend 3BiodieselPetrodiesel
Density at 15 °C907.8919.8927.9978.3906.2
Density at 20 °C899.3915.9924.5970.9896.9
Density at 25 °C889.4906.4913.2965.1890.1
Density at 30 °C886.4902.7904.0952.3886.8
Density at 35 °C876.8887.4893.5941.5874.9
Density at 40 °C858.6864.8876.1933.5854.9
Table 10. Uncertainty results for petrodiesel—palm biodiesel blends (%).
SampleBlend 1Blend 2Blend 3BiodieselPetrodiesel
Density at 15 °C5.99 × 1066.03 × 10−66.09 × 10−66.10 × 10−65.96 × 10⁻⁶
Density at 20 °C6.02 × 10−66.04 × 10−66.13 × 10−66.14 × 10−66.00 × 10−6
Density at 25 °C6.04 × 10−66.05 × 10−66.17 × 10−66.16 × 10−66.03 × 10−6
Density at 30 °C6.06 × 10−66.08 × 10−66.20 × 10−66.21 × 10−66.04 × 10−6
Density at 35 °C6.10 × 10−66.12 × 10−66.26 × 10−66.25 × 10−66.09 × 10−6
Density at 40 °C6.15 × 10−66.14 × 10−66.33 × 10−66.33 × 10−66.18 × 10−6
Table 11. Uncertainty results for petrodiesel—Brassica carinata biodiesel blends (%).
SampleBlend 1Blend 2Blend 3BiodieselPetrodiesel
Density at 15 °C5.96 × 10−66.02 × 10−66.03 × 10−66.03 × 10−65.96 × 10−6
Density at 20 °C6.02 × 10−66.04 × 10−66.05 × 10−66.05 × 10−66.00 × 10−6
Density at 25 °C6.04 × 10−66.06 × 10−66.07 × 10−66.08 × 10−66.03 × 10−6
Density at 30 °C6.06 × 10−66.07 × 10−66.07 × 10−66.11 × 10−66.04 × 10−6
Density at 35 °C6.11 × 10−66.12 × 10−66.12 × 10−66.13 × 10−66.09 × 10−6
Density at 40 °C6.12 × 10−66.16 × 10−66.20 × 10−66.16 × 10−66.18 × 10−6
Table 12. Uncertainty results for petrodiesel—camelina biodiesel blends (%).
SampleBlend 1Blend 2Blend 3BiodieselPetrodiesel
Density at 15 °C5.96 × 10−65.91 × 10−65.88 × 10−65.71 × 10−65.96 × 10−6
Density at 20 °C5.99 × 10−65.92 × 10−65.89 × 10−65.73 × 10−66.00 × 10−6
Density at 25 °C6.03 × 10−65.96 × 10−65.93 × 10−65.75 × 10−66.03 × 10−6
Density at 30 °C6.04 × 10−65.98 × 10−65.97 × 10−65.79 × 10−66.04 × 10−6
Density at 35 °C6.09 × 10−66.04 × 10−66.01 × 10−65.83 × 10−66.09 × 10−6
Density at 40 °C6.17 × 10−66.14 × 10−66.09 × 10−65.86 × 10−66.18 × 10−6
Table 13. Fragment from the input data used as a training database for the palm–biodiesel blends.
152025303540
555555
Table 14. Fragment from the output data used as a training database for the palm–biodiesel blends.
899891.6887883.3872.2861.1
Table 15. Determined and estimated values for the petrodiesel—palm biodiesel blends.
Blending NumberDetermined Value (D)EstimationMean Estimation
(M)
Error
(D − M)
Error (%)
#1#2#3
1899.0897.5901.2898.3899.00.00.0
2888.3883.2894.3891.3889.6−1.3−0.1
3874.3875.4889.8887.7884.3−10.0−1.1
4873.1876.4879.3884.6880.1−7.0−0.8
5906.2875.6890.2874.4880.126.12.9
6891.6856.7877.9860.5865.026.63.0
7886.4886.3899.3889.8891.8−5.4−0.6
8865.6878.8891.0884.4884.7−19.1−2.2
9864.9872.9879.8880.8877.8−12.9−1.5
10896.9876.1860.3876.6871.025.92.9
11887.0875.0873.4868.0872.114.91.7
12884.2848.4865.7856.3856.827.43.1
13857.3874.5897.4873.4881.8−24.5−2.9
14859.8875.1888.1866.5876.6−16.8−2.0
15890.1868.4871.0859.5866.323.82.7
16883.3875.4847.7850.6857.925.42.9
17876.9897.5856.1839.5864.412.51.4
18851.3883.2849.4826.0852.9−1.6−0.2
19850.1875.4841.9873.0863.4−13.3−1.6
20886.8876.4845.6865.0862.324.52.8
21872.2875.6842.6859.8859.312.91.5
22869.7856.7802.2850.0836.333.43.8
23839.2886.3786.3840.7837.81.40.2
24840.7878.8786.0863.2842.7−2.0−0.2
25874.9872.9903.4905.9894.1−19.2−2.2
26861.1876.1899.3896.2890.5−29.4−3.4
27864.4875.0902.5890.9889.5−25.1−2.9
28825.8848.4902.2887.2879.3−53.5−6.5
29825.4874.5903.0873.8883.8−58.4−7.1
30854.9875.1887.2855.6872.6−17.7−2.1
Table 16. Determined and estimated values for the petrodiesel—Brassica carinata biodiesel blends.
Blending NumberDetermined Value (D)EstimationMean Estimation
(M)
Error
(D − M)
Error (%)
#1#2#3
1905.6902.7902.5907.4904.21.40.2
2891.1891.2891.7900.5894.5−3.4−0.4
3889.2886.4886.7890.5887.91.30.1
4888.6882.9882.6882.5882.75.90.7
5906.2872.1872.3871.9872.134.13.8
6891.9868.3859.7846.1858.033.93.8
7887.1896.4895.0904.9898.8−11.7−1.3
8885.4887.1888.4898.1891.2−5.8−0.7
9883.6883.1883.5887.6884.7−1.1−0.1
10896.9880.2880.1879.8880.016.91.9
11887.8870.3871.6869.5870.517.32.0
12883.0858.3857.0846.2853.829.23.3
13880.8890.0887.8916.8898.2−17.4−2.0
14877.5883.4885.1899.9889.5−12.0−1.4
15890.1880.4880.4886.0882.37.80.9
16881.9878.1878.2877.5877.94.00.4
17880.5868.0871.0868.0869.011.51.3
18878.8841.4853.9852.4849.229.63.4
19871.8892.8837.6911.5880.6−8.8−1.0
20886.8884.0836.6900.4873.713.11.5
21871.3880.4848.3891.5873.4−2.1−0.2
22869.1872.4871.7879.0874.4−5.3−0.6
23867.6865.1866.3868.2866.51.10.1
24866.5861.8859.8863.4861.74.80.6
25874.9908.8909.6912.9910.4−35.5−4.1
26869.5895.4895.4903.9898.2−28.7−3.3
27859.4890.2889.9893.7891.3−31.9−3.7
28851.3886.2885.9885.5885.9−34.6−4.1
29859.9874.3873.4874.5874.1−14.2−1.6
30854.9873.8862.1850.5862.1−7.2−0.8
Table 17. Determined and estimated values for the petrodiesel—camelina biodiesel blends.
Blending NumberDetermined Value (D)EstimationMean Estimation
(M)
Error
(D − M)
Error (%)
#1#2#3
1907.8908.78911.90908.40909.7−1.9−0.2
2919.8904.13907.80905.85905.913.91.5
3927.9895.89896.29897.80896.731.23.4
4978.3887.49888.79890.98889.189.29.1
5906.2875.75881.33880.64879.227.03.0
6899.3857.83862.99859.47860.139.24.4
7915.9918.00920.07918.17918.7−2.8−0.3
8924.5908.68916.76915.01913.511.01.2
9970.9902.73905.10906.59904.866.16.8
10896.9893.07896.57897.96895.91.00.1
11889.4880.59887.78886.24884.94.50.5
12906.4863.59870.20865.01866.340.14.4
13913.2928.50927.62928.84928.3−15.1−1.7
14965.1919.90925.34924.96923.441.74.3
15890.1917.75914.91916.16916.3−26.2−2.9
16886.4905.24906.48905.72905.8−19.4−2.2
17902.7891.86897.65892.27893.98.81.0
18904.0875.02883.96871.29876.827.23.0
19952.3980.09978.88978.58979.2−26.9−2.8
20886.8971.10970.97970.83971.0−84.2−9.5
21876.8969.63965.87964.59966.7−89.9−10.3
22887.4958.04954.67952.28955.0−67.6−7.6
23893.5941.32937.10941.83940.1−46.6−5.2
24941.5931.97933.47931.67932.49.11.0
25874.9906.91903.92899.68903.5−28.6−3.3
26858.6902.69899.31897.52899.8−41.2−4.8
27864.8894.90888.91889.84891.2−26.4−3.1
28876.1888.39882.90884.73885.3−9.2−1.1
29933.5875.66877.12875.42876.157.46.2
30854.9855.43859.76854.73856.6−1.7−0.2
Disclaimer/Publisher’s Note: The statements, opinions and data contained in all publications are solely those of the individual author(s) and contributor(s) and not of MDPI and/or the editor(s). MDPI and/or the editor(s) disclaim responsibility for any injury to people or property resulting from any ideas, methods, instructions or products referred to in the content.

