Abstract
More accurate prediction of CO2/CH4 adsorption selectivity coefficients in the CO2 Enhanced Coal Bed CH4 Recovery (CO2-ECBM) project can help to judge the CO2 adsorption concentration and the desorption purity of CH4 during the CO2 injection process, and to achieve the maximization of CO2 sequestration as well as the optimization of the CH4 recovery rate. To this end, a coal molecular slit model with 16 sizes including micro-, meso-, and macropores was constructed in this study, and the competitive adsorption characteristics of CO2 and CH4 gas mixtures in bituminous coal molecules were investigated using molecular dynamics and giant canonical Monte Carlo simulations. The CO2/CH4 adsorption selectivity coefficients (Sc) as a function of gas ratio, gas pressure, pore size, and temperature were analyzed using a large amount of adsorption isotherm data. Based on the simulation results, considering the neglect of pressure and component changes when calculating the adsorption selectivity coefficient using the traditional extended Langmuir (E-L) model, a correction term regarding the pressure of the mixed gas and the mole fraction of CO2 is set, and a modified equation is proposed. The results show that the adsorption potential energy of CO2 is significantly higher than that of CH4, giving it an absolute advantage in the competition. Through multiple regression analysis, the ranking of the influence weights of the four factors on Sc is as follows: pore size > mixed gas pressure > molar fraction of CO2 > temperature. The negative exponential function can describe the variation of Sc with four factors. The fitting degree between the modified prediction model and the Sc data obtained through simulation reaches 0.84, and the model effect is good. The research results provide theoretical guidance for the optimization of gas injection parameters in the CO2-ECBM project.
1. Introduction
The technology of injecting CO2 into coal seams to enhance CH4 recovery (CO2-ECBM) has emerged against the backdrop of CO2 geological sequestration and carbon emission reduction [1,2]. This technology not only improves the economic viability of CO2 storage in coal seams but also strengthens mine gas control. Due to its multifaceted benefits, it has garnered widespread attention and research worldwide [3,4].
To predict the changes in adsorption selectivity, many scholars have conducted in-depth explorations on the competitive adsorption mechanism of multiple gases in coal and the improvement of the competitive adsorption equilibrium model; during this process, the giant canonical Monte Carlo simulation (GCMC) has been widely applied in the study of coal adsorption due to its accuracy [5,6]. Studies show that under the same conditions, the adsorption capacity of coal for CO2 is approximately twice that of CH4, and it varies with specific environmental factors and the internal structure of coal [7,8,9]. Huang et al. [10] explained from a thermodynamic perspective that CO2 has a stronger adsorption capacity compared to CH4. Zhao [11] and Zhang et al. [12] studied the influence of different influencing factors on the competitive adsorption of CO2 and CH4 through numerical simulation. The results show that an increase in temperature, gas concentration, pressure and coal pore size will reduce the adsorption advantage of CO2. The adsorption selectivity coefficient [13,14] is commonly used to evaluate the strength or weakness of competitive adsorption of binary mixed gases in adsorbents. Many scholars have analyzed the research results through this coefficient. Liao et al. [15] experimentally inferred that the adsorption selectivity coefficient of CO2 relative to CH4 Sc (CO2/CH4 adsorption selectivity coefficient) first increased and then decreased with the increase in CO2 fraction. However, the simulation results of Xie et al. [16] indicated that Sc continuously decreased with the increase in CO2 fraction. Jia et al. [17] found through molecular simulation methods that with the increase in the volume fraction of CO2 and the equilibrium pressure of the system, the competitive adsorption strength of CO2 compared with CH4 showed a decreasing trend. Dutta et al. [18] obtained the same view through experimental means. Unlike the slit model, Wang et al. [19] constructed an organic nanopore model to adsorb CO2/CH4 mixed gas and found that the adsorption selectivity coefficient of CO2 decreased with the increase in temperature. The E-L model and the Ideal Adsorption Solution Theory (IAST) are the most commonly used methods for calculating the adsorption capacity of multi-component gases [20,21]. However, the calculation results are insufficient to reflect the variation of competitive adsorption characteristics with different factors discovered in the existing studies. Therefore, on this basis, many scholars have proposed improved models by adding correction factors to the adsorption constant and equilibrium pressure according to the variation mechanism of competitive adsorption strength [22,23,24]. However, due to the complex form of the equation, it is not convenient to calculate the adsorption selectivity coefficient.
Although existing studies have systematically explored the influences of temperature, pressure, gas ratio, and pore size on the competitive adsorption of CO2/CH4, different scholars still have differences regarding the variation law of Sc with key factors. In addition, the Sc prediction model based on the traditional E-L model is solely determined by the Langmuir adsorption constant, and it is difficult to reflect the dynamic influence of multiple factors on Sc. In order to establish an Sc prediction model considering factors such as pore size, pressure, gas ratio, and temperature based on the E-L model, so as to obtain more accurate Sc in the CO2-ECBM and CO2 sequestration processes, this paper simulates the competitive adsorption of CO2 and CH4 in the pores of bituminous coal under different conditions, and obtains the influence laws of various factors such as coal quality characteristics and environmental conditions on the competitive adsorption. The functional relationships of each factor on the adsorption selectivity coefficient are analyzed through a large amount of mixed gas adsorption data. Combined with the simulation results, the correction parameters are set to quantify these influences and optimize the calculation method of Sc based on the E-L model, and provide a theoretical reference for the optimization of gas injection parameters for CO2 injection into coal seams.
2. Simulation Method of Competitive Adsorption of CO2/CH4 in Coal
2.1. Model Construction
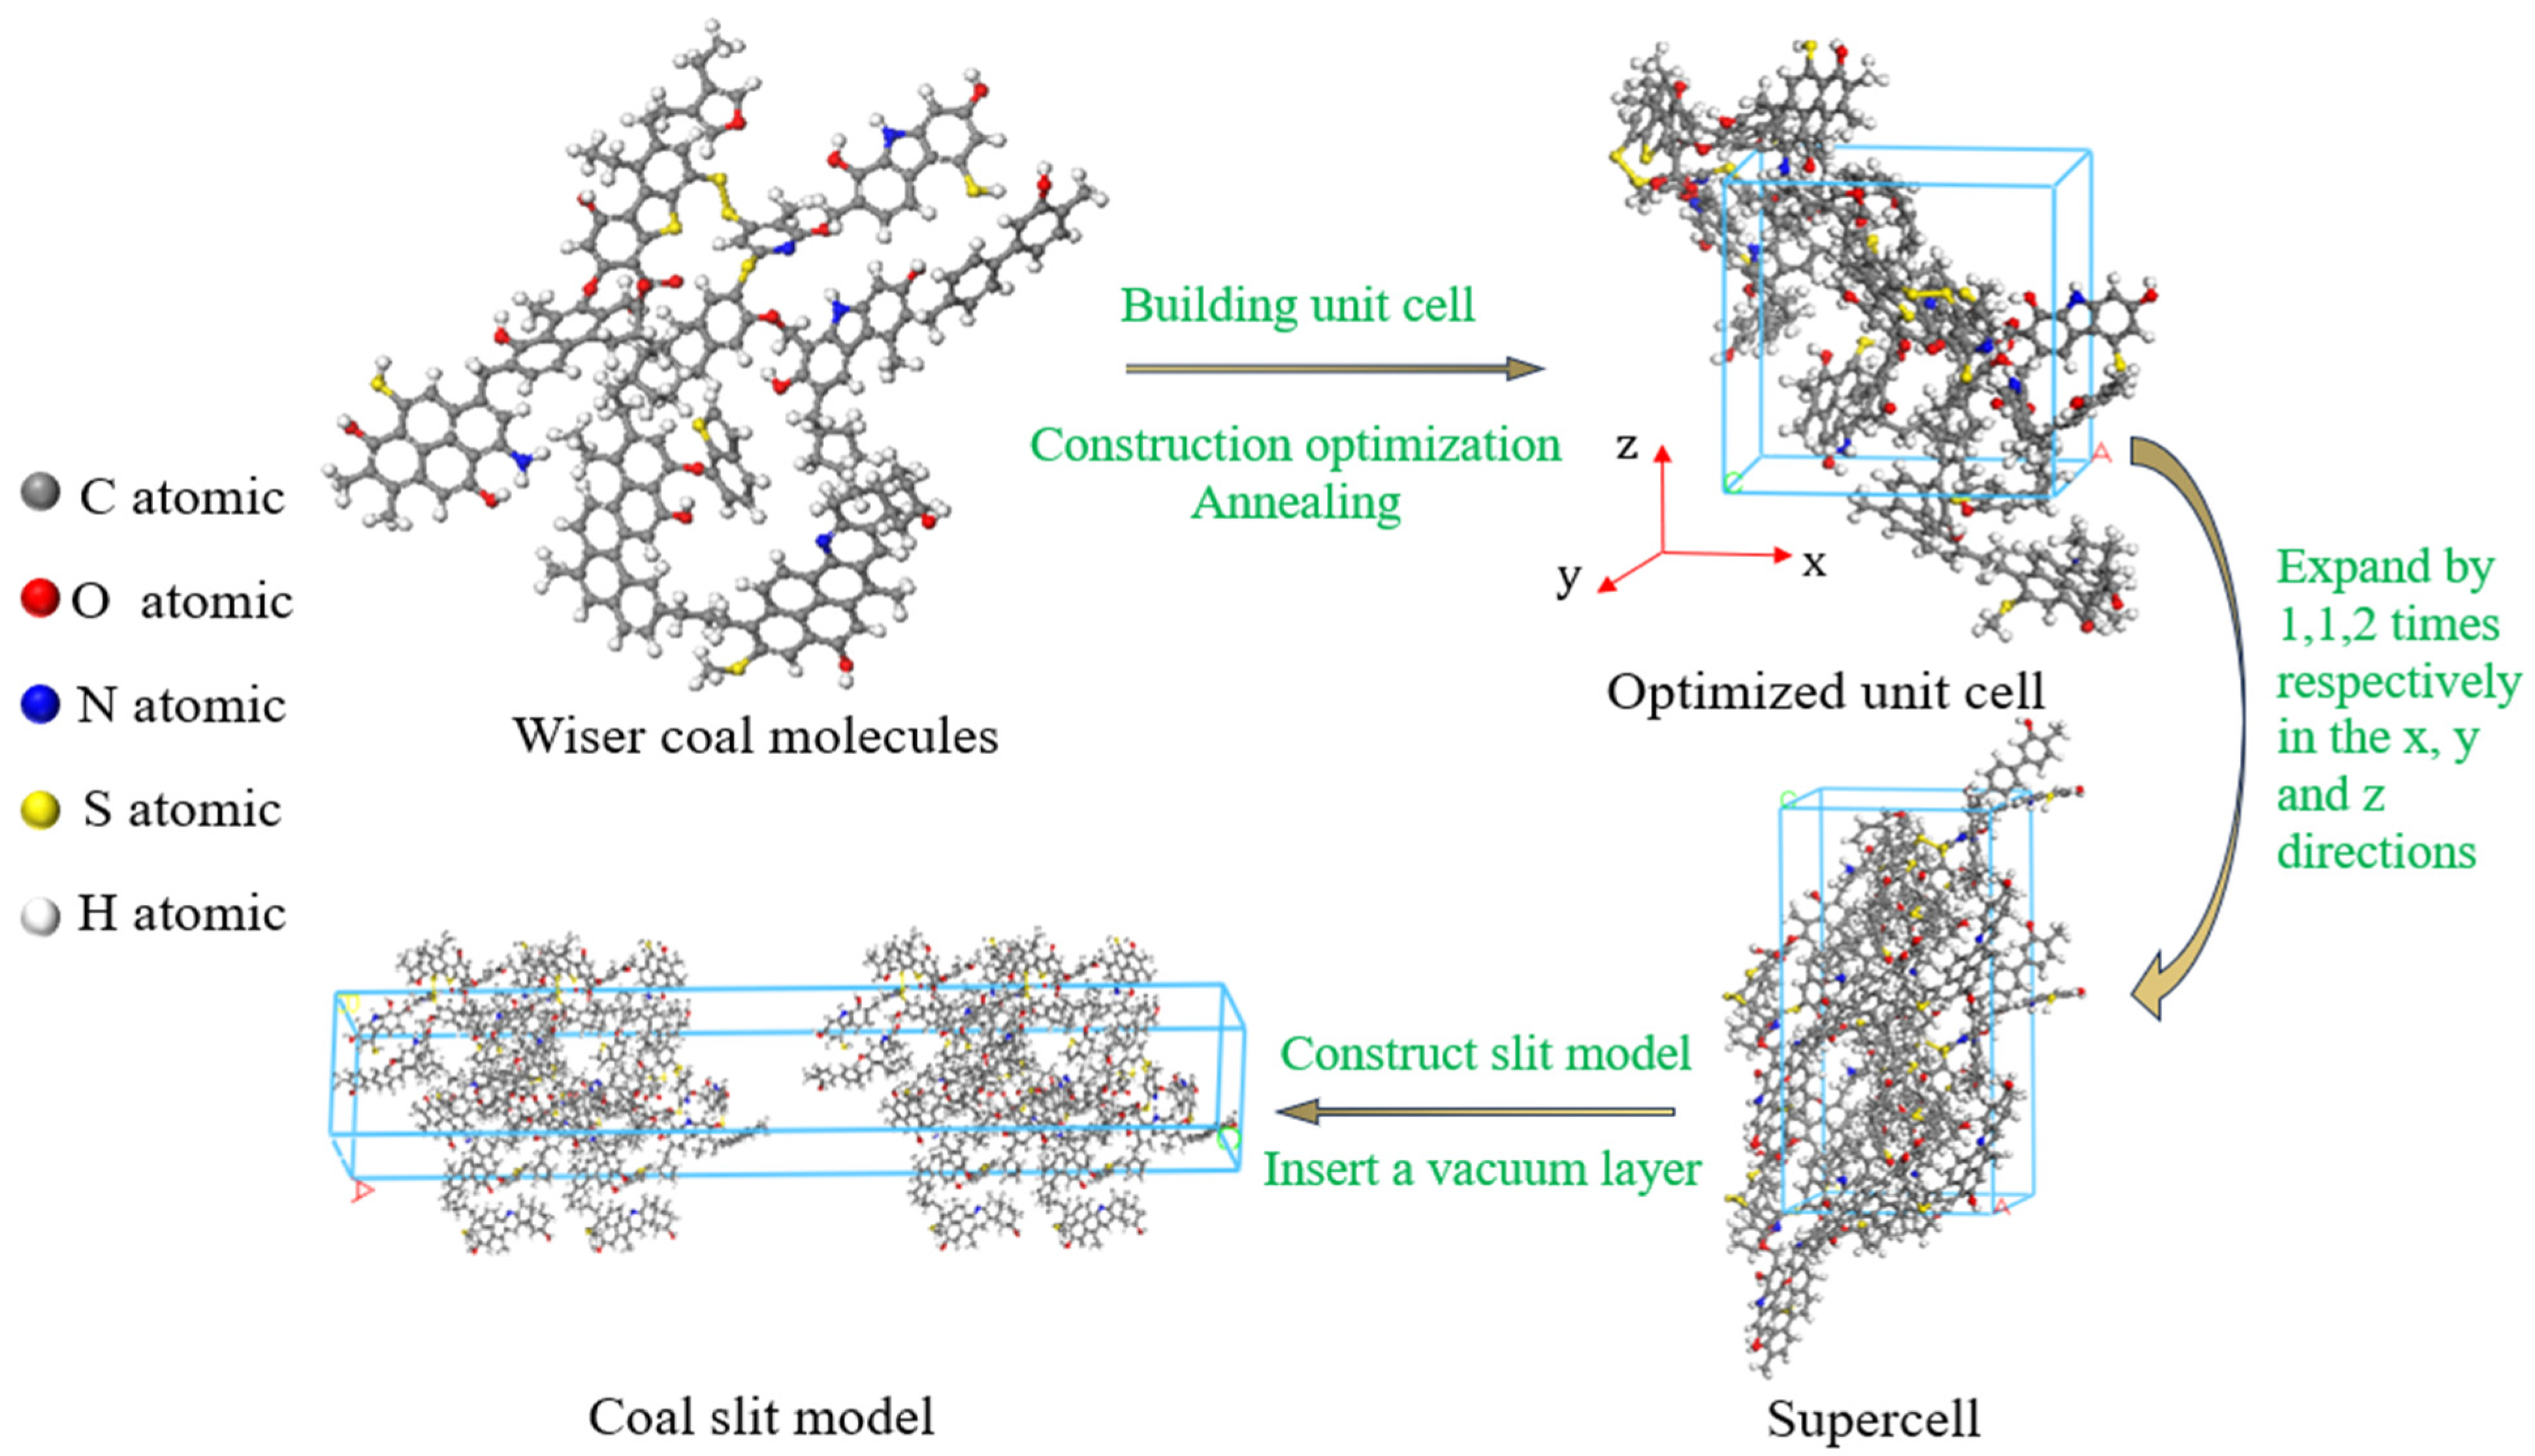
Bituminous coal has abundant reserves worldwide and is often used in coalbed methane adsorption experiments [25]. In this paper, the Wiser bituminous coal molecular model was selected to construct the adsorption system in Materials Studio 2020 (MS) software. This model is widely used due to its relatively comprehensive structure and high stability [26]. Each single unit cell created was composed of two coal molecules, with the molecular formula C184H155N3O20S3 [27], and the cycle boundary for it was set. The Compass force field was used to describe the molecular inter- and intramolecular interactions, the charge distribution was calculated using the Qeq method, and the final density of the coal molecules was 1.30 g/cm3, which is in the range of bituminous coal densities (1.25 to 1.5 g/cm3) [28]. The final cell geometry parameters were a = b = c = 19.98 Å, α = β = γ = 90°, and the pore model construction process is shown in Figure 1. Geometric and energy optimization were carried out using the forcite module, the annealing cycle was 20, the initial temperature was 293 K, the maximum temperature was 600 K, the NVT ensemble was selected, the Nose temperature control method was adopted, the time step was 1 fs, and the simulation time was 200 ps. Then, the unit cell units were expanded along the x, y, and z directions to obtain a super unit cell with a 1 × 1 × 2 structure. And, based on this, a slit model with a vacuum layer was constructed to simulate coal pores of different sizes. The equilibrium step size and total step size of the adsorption process were 2.5 × 10⁵ and 5 × 10⁶ steps, respectively, and the truncation radius was set to 12.5Å.
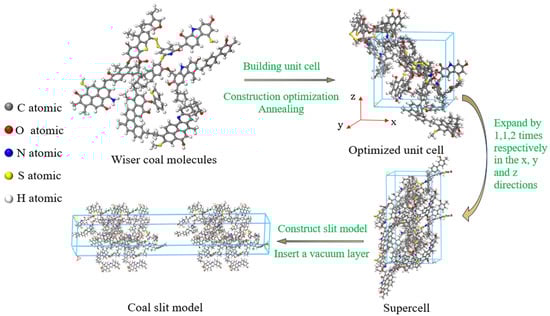
Figure 1.
Modeling process of coal slit model.
The molecular models of adsorbent CO2 and CH4 were directly called from the software model library, and the same method as that of coal molecular model was used for structure optimization and energy optimization. After inspection, the established coal slit pore model and adsorbate molecules were electrically neutral.
2.2. Simulation Parameter
In this study, the control variable method was adopted to design the test conditions. Considering the breakthrough pressure during the actual storage process [29,30], the test temperature range of 20~50 °C and the pressure range of 0~4 MPa were determined. The adsorption of the mixed gas of CO2 and CH4 in three types of coal pore diameters (microporous < 2 nm ≤ mesoporous < 50 nm ≤ macroporous [31]) within the range of 0.6~100 nm was simulated. Micropores in bituminous coal occupy a sizable specific surface area and contribute the most to the total adsorption, so the effects of total pressure, gas ratio, and temperature on the adsorption selectivity were explored in 2 nm micropores. The parameter settings for each simulation group are shown in Table 1.

Table 1.
Simulation parameter setting table.
In the table, groups 1~16 study the effect of pore size on competitive adsorption, setting 0.5 MPa as the pressure gradient in the range of 0~4 MPa. Different pressure points on the same isotherm are used to study the effect of different total pressures, and are supplemented with the pressure points of 0.05 MPa, which is close to the adsorption group under the pressure of 0 MPa. Groups 5 and 19~26 explore the effect of the proportion of the gas, which is the ratio of the amount of gas substance, where Groups 17 and 18 were set as pure gas adsorption control groups. Group 5 and groups 27~32 were investigated for the effect of temperature.
Under high pressure conditions, the compressibility of gases varies. To control the amount of the two gases to be consistent under different total pressures, the partial pressure of the two gases at each pressure point is calculated using the following system of equations.
where P is the total pressure of mixed gas, P1 and P2 are the pressures of CO2 and CH4, respectively, and n1 and n2 are amount of substance of CO2 and CH4, respectively. Z1 and Z2 are the compression factors of CO2 and CH4, respectively, and the compression factor, which is also a function of the gas pressures, is calculated using the virial equation expanded to the second term [32,33,34]:
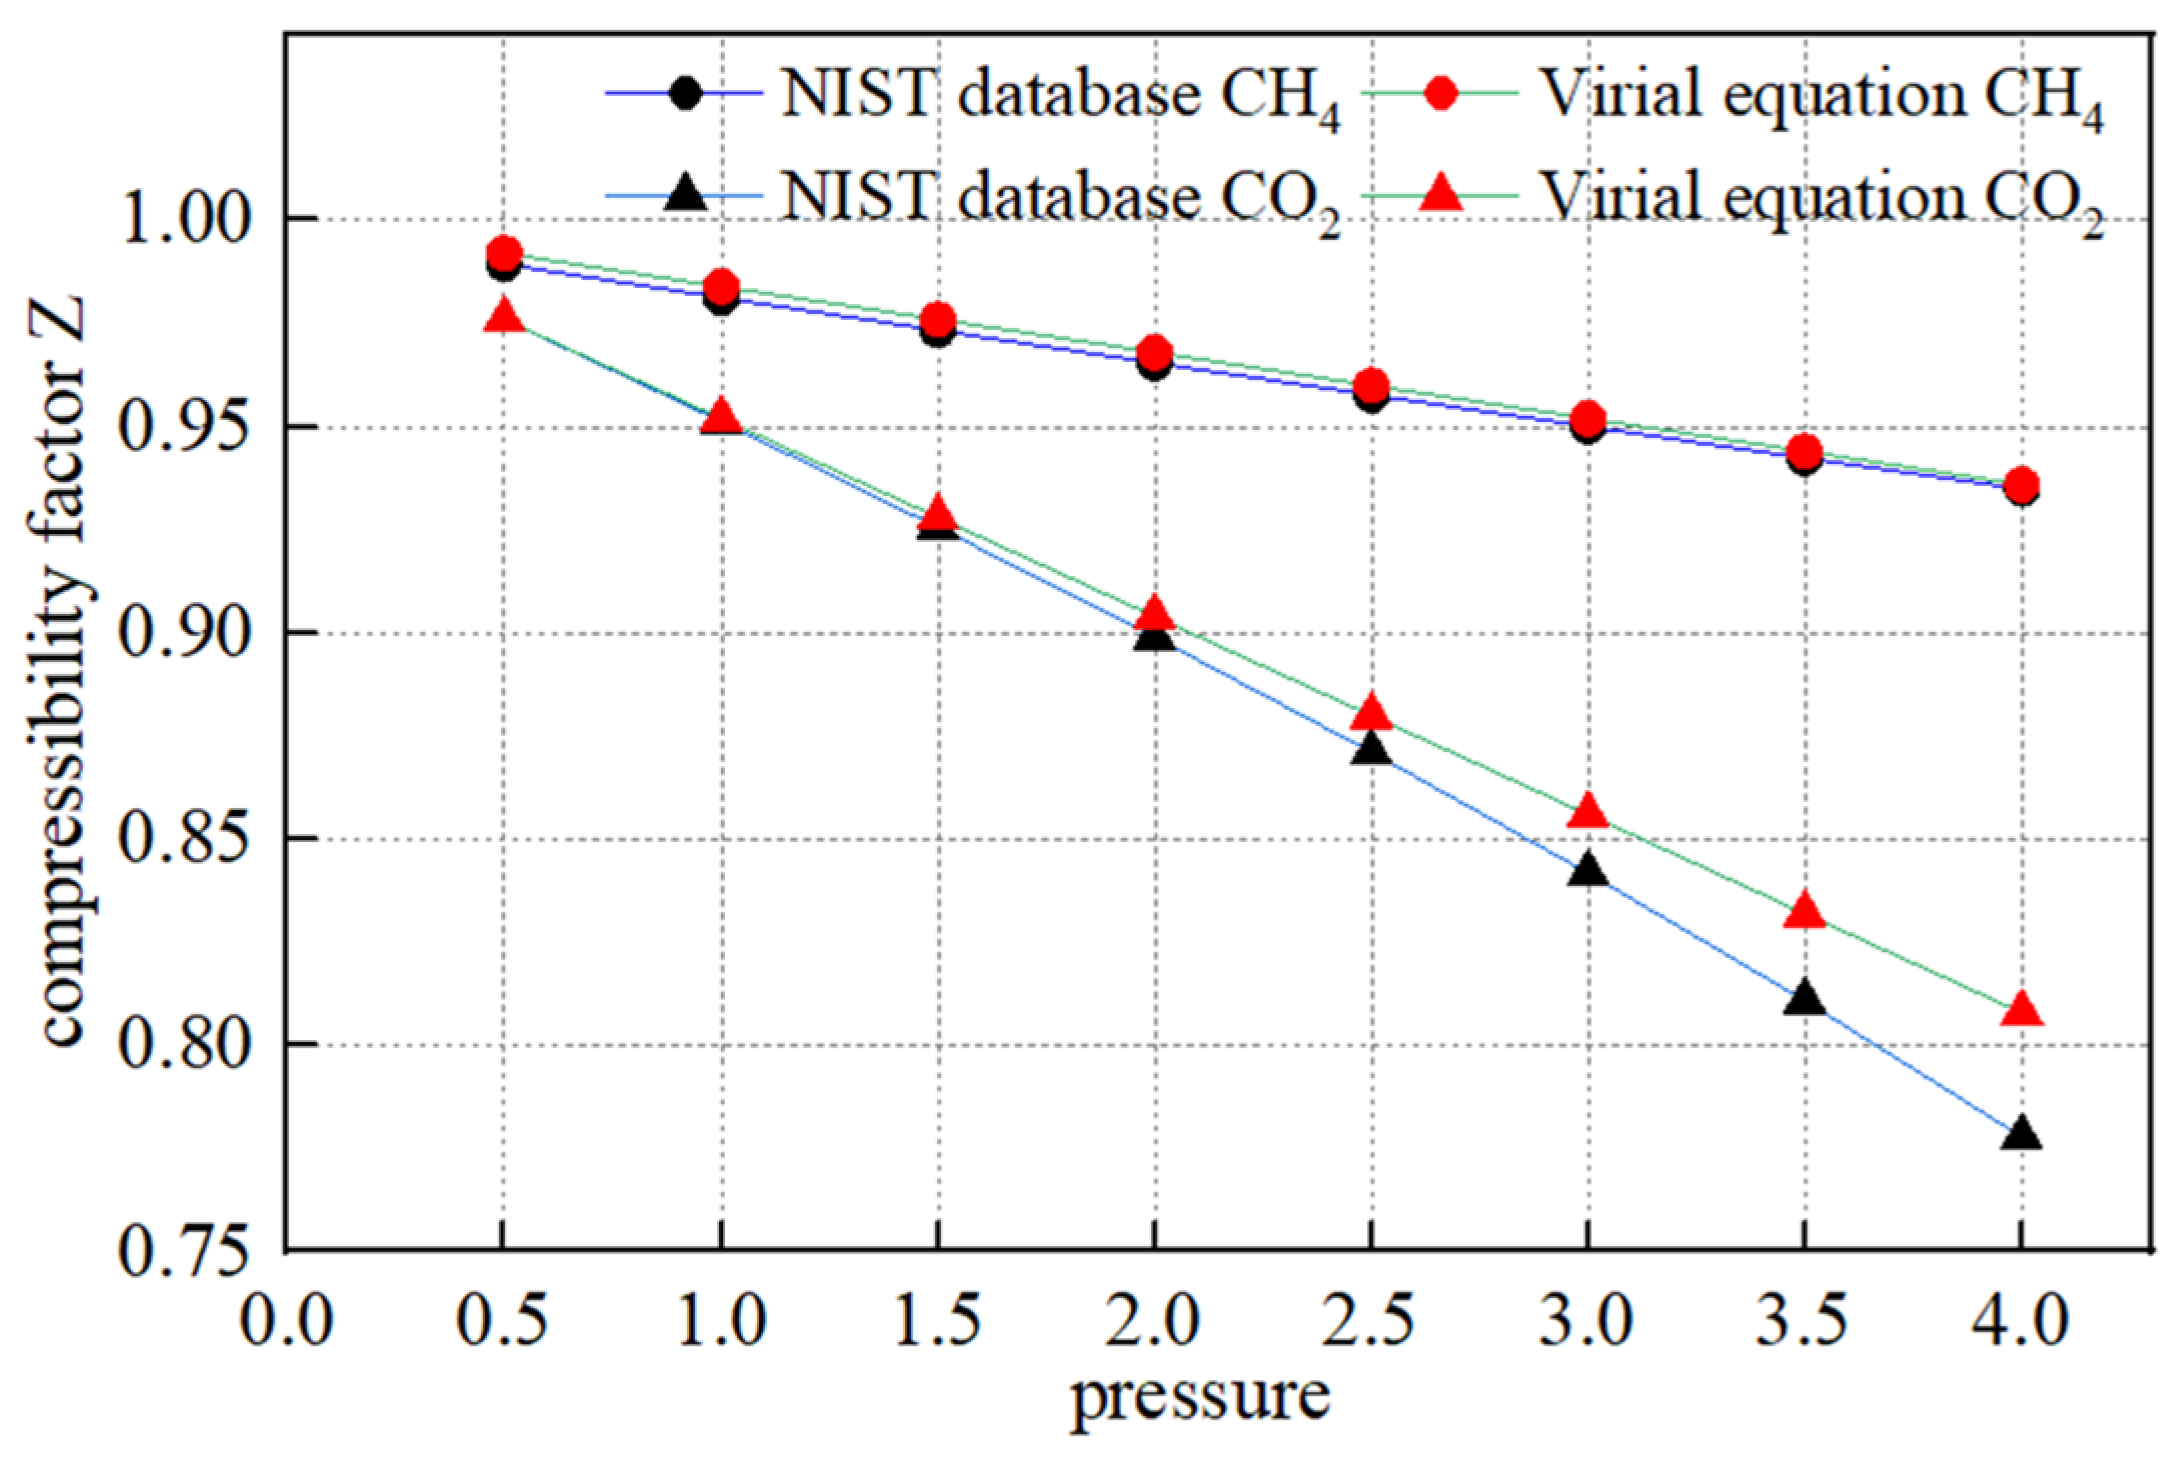
where BV is the second virial coefficient, p is the gas pressure, MPa; T is the gas temperature, K, R is the gas constant, J/(kg·K); Tc is the gas critical temperature, K; Pc is the critical pressure, MPa; Tr is the reduction temperature, dimensionless; and ω is the eccentricity factor, dimensionless. The physical parameters of CO2 and CH4 gases are known by querying the NIST database, and the values are taken as shown in Table 2 below. The compression factors at different pressure points calculated by the virial equation are compared with the data in the NIST database as shown in Figure 2, and the two curves overlap well, which verifies the reliability of the equation.
Table 2.
Physical properties parameters of CO2 and CH4.
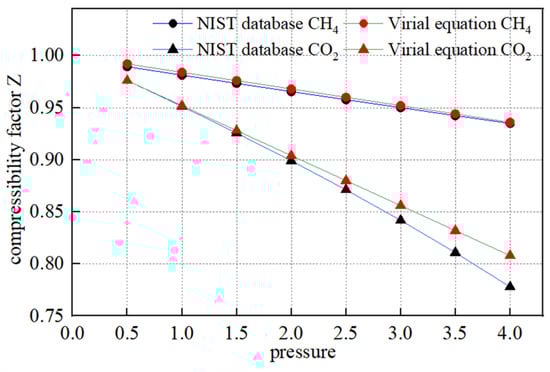
Figure 2.
Comparison of compression factors obtained from virial equation and NIST database.
It is also worth noting that fugacity is used in MS to represent gas pressure, and for real gases, fugacity f and pressure p can be converted by the following equation:
where φ is the fugacity coefficient, pθ is a constant infinitely close to 0, and p is the gas pressure, MPa. From this, the fugacity of CO2 and CH4 gases at different pressures in specific substance amount ratios can be obtained.
Combining the above equation with the gas data, the formula for calculating the fugacity from pressure at different temperatures was obtained, as shown in Table 3, and these can be input into the simulation software as pressure points on the adsorption isotherm to calculate the adsorption amount.
Table 3.
Calculation formulas for the fugacity of CO2 and CH4 gases at different temperatures.
In molecular simulations, the adsorption of various gases by coal can be calculated from the average number of gas molecules adsorbed per cell of the coal slit model in the simulated system:
where V is the gas adsorption amount, mmol/g; N is the number of adsorbed gas molecules, Na is the number of molecules in the cell, here 4; Mc is the molecular molar mass of waser bituminous coal molecules, g/mol, with a specific value of 2821.
3. The Influence Law of Multiple Factors on the Competitive Adsorption of CO2 and CH4
3.1. Adsorption Isotherm of CO2/CH4 Mixed Gas
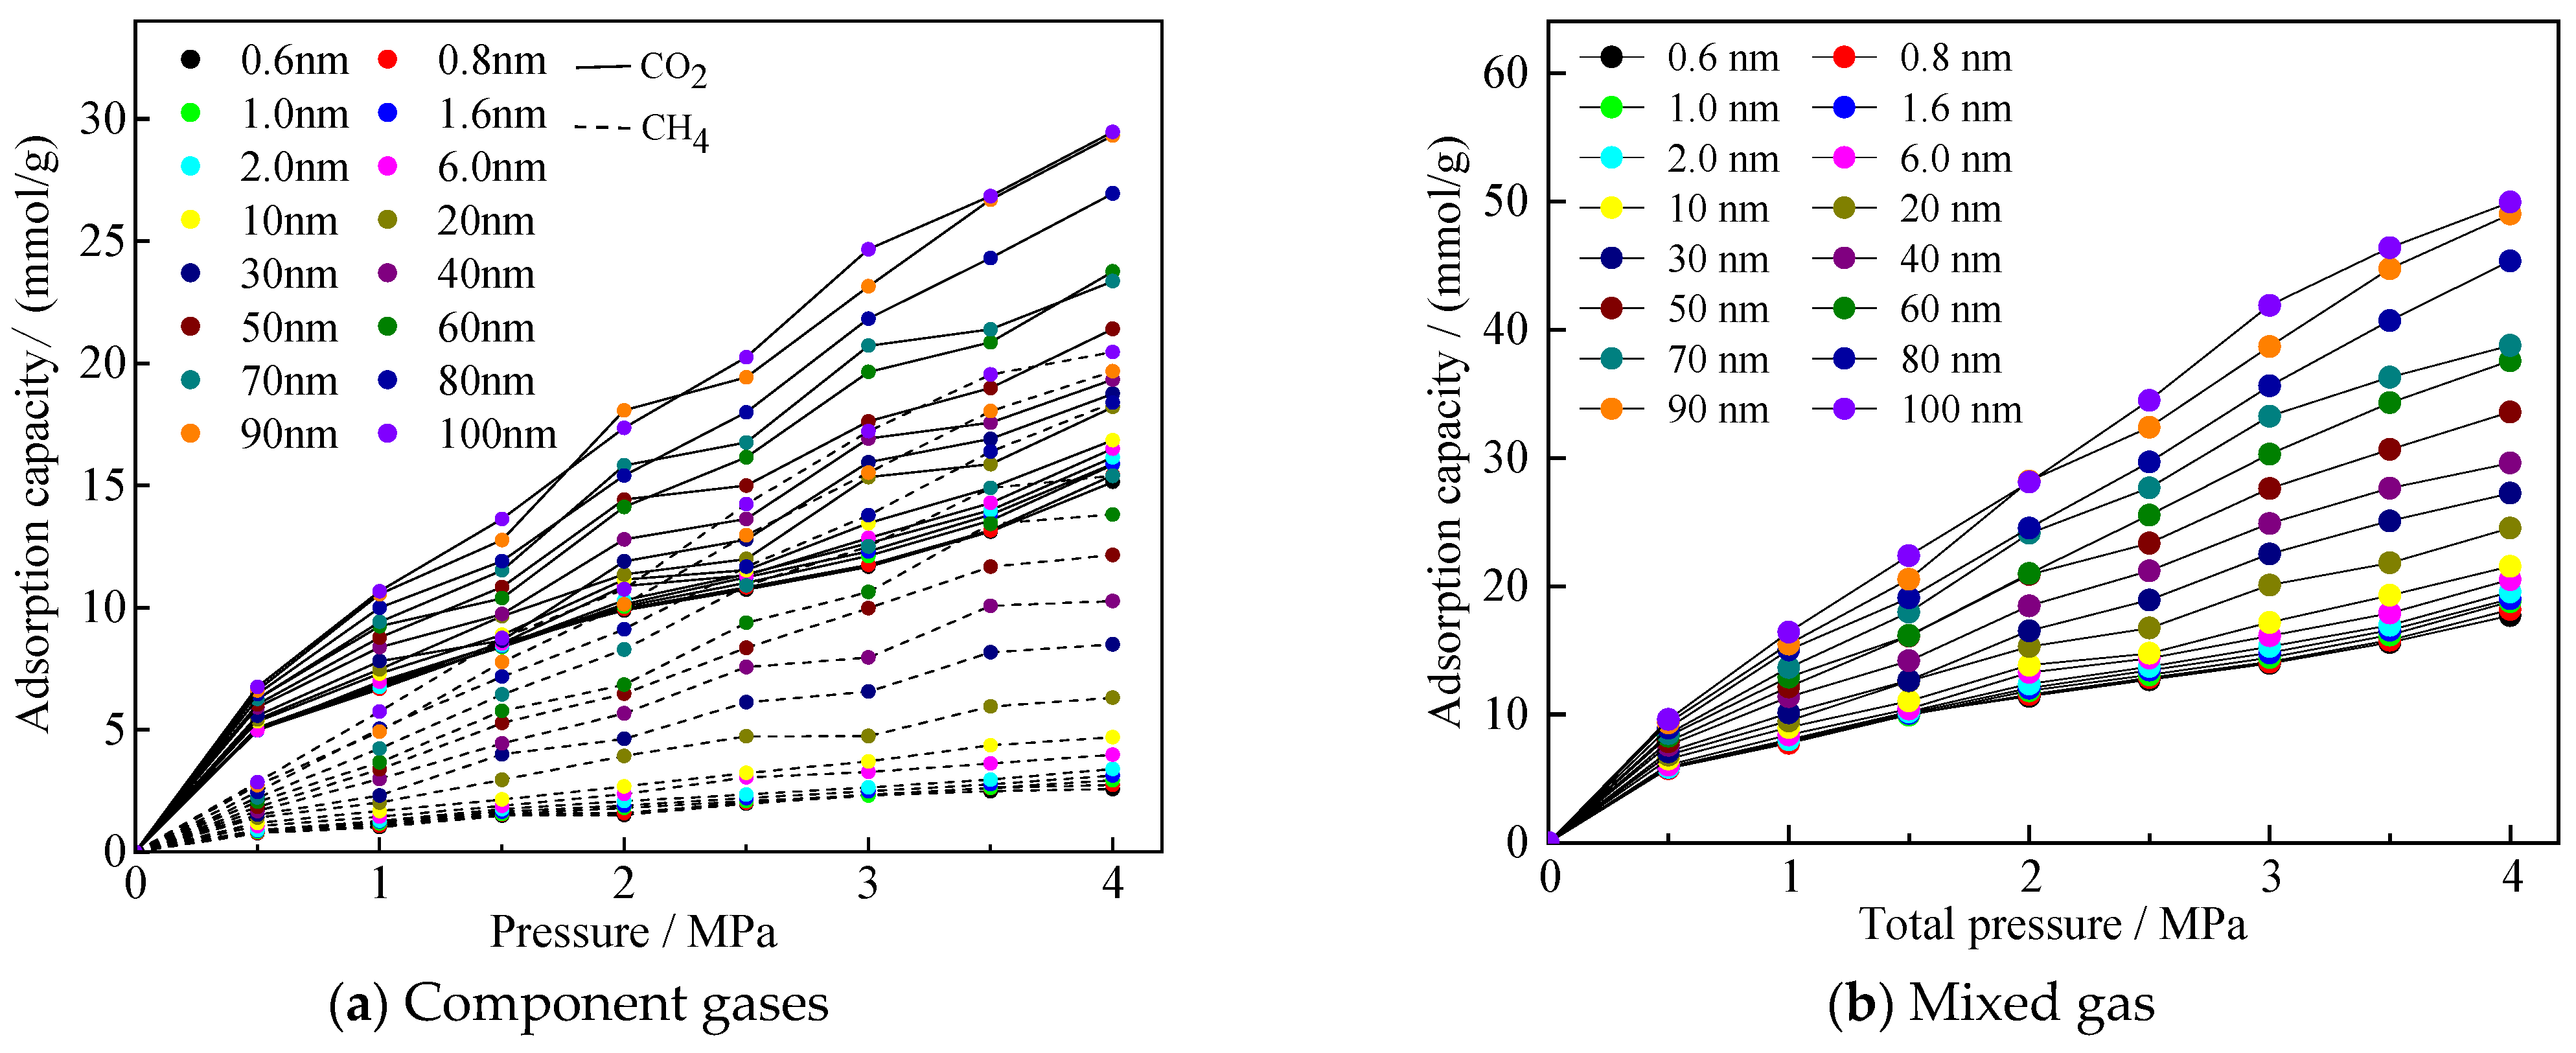
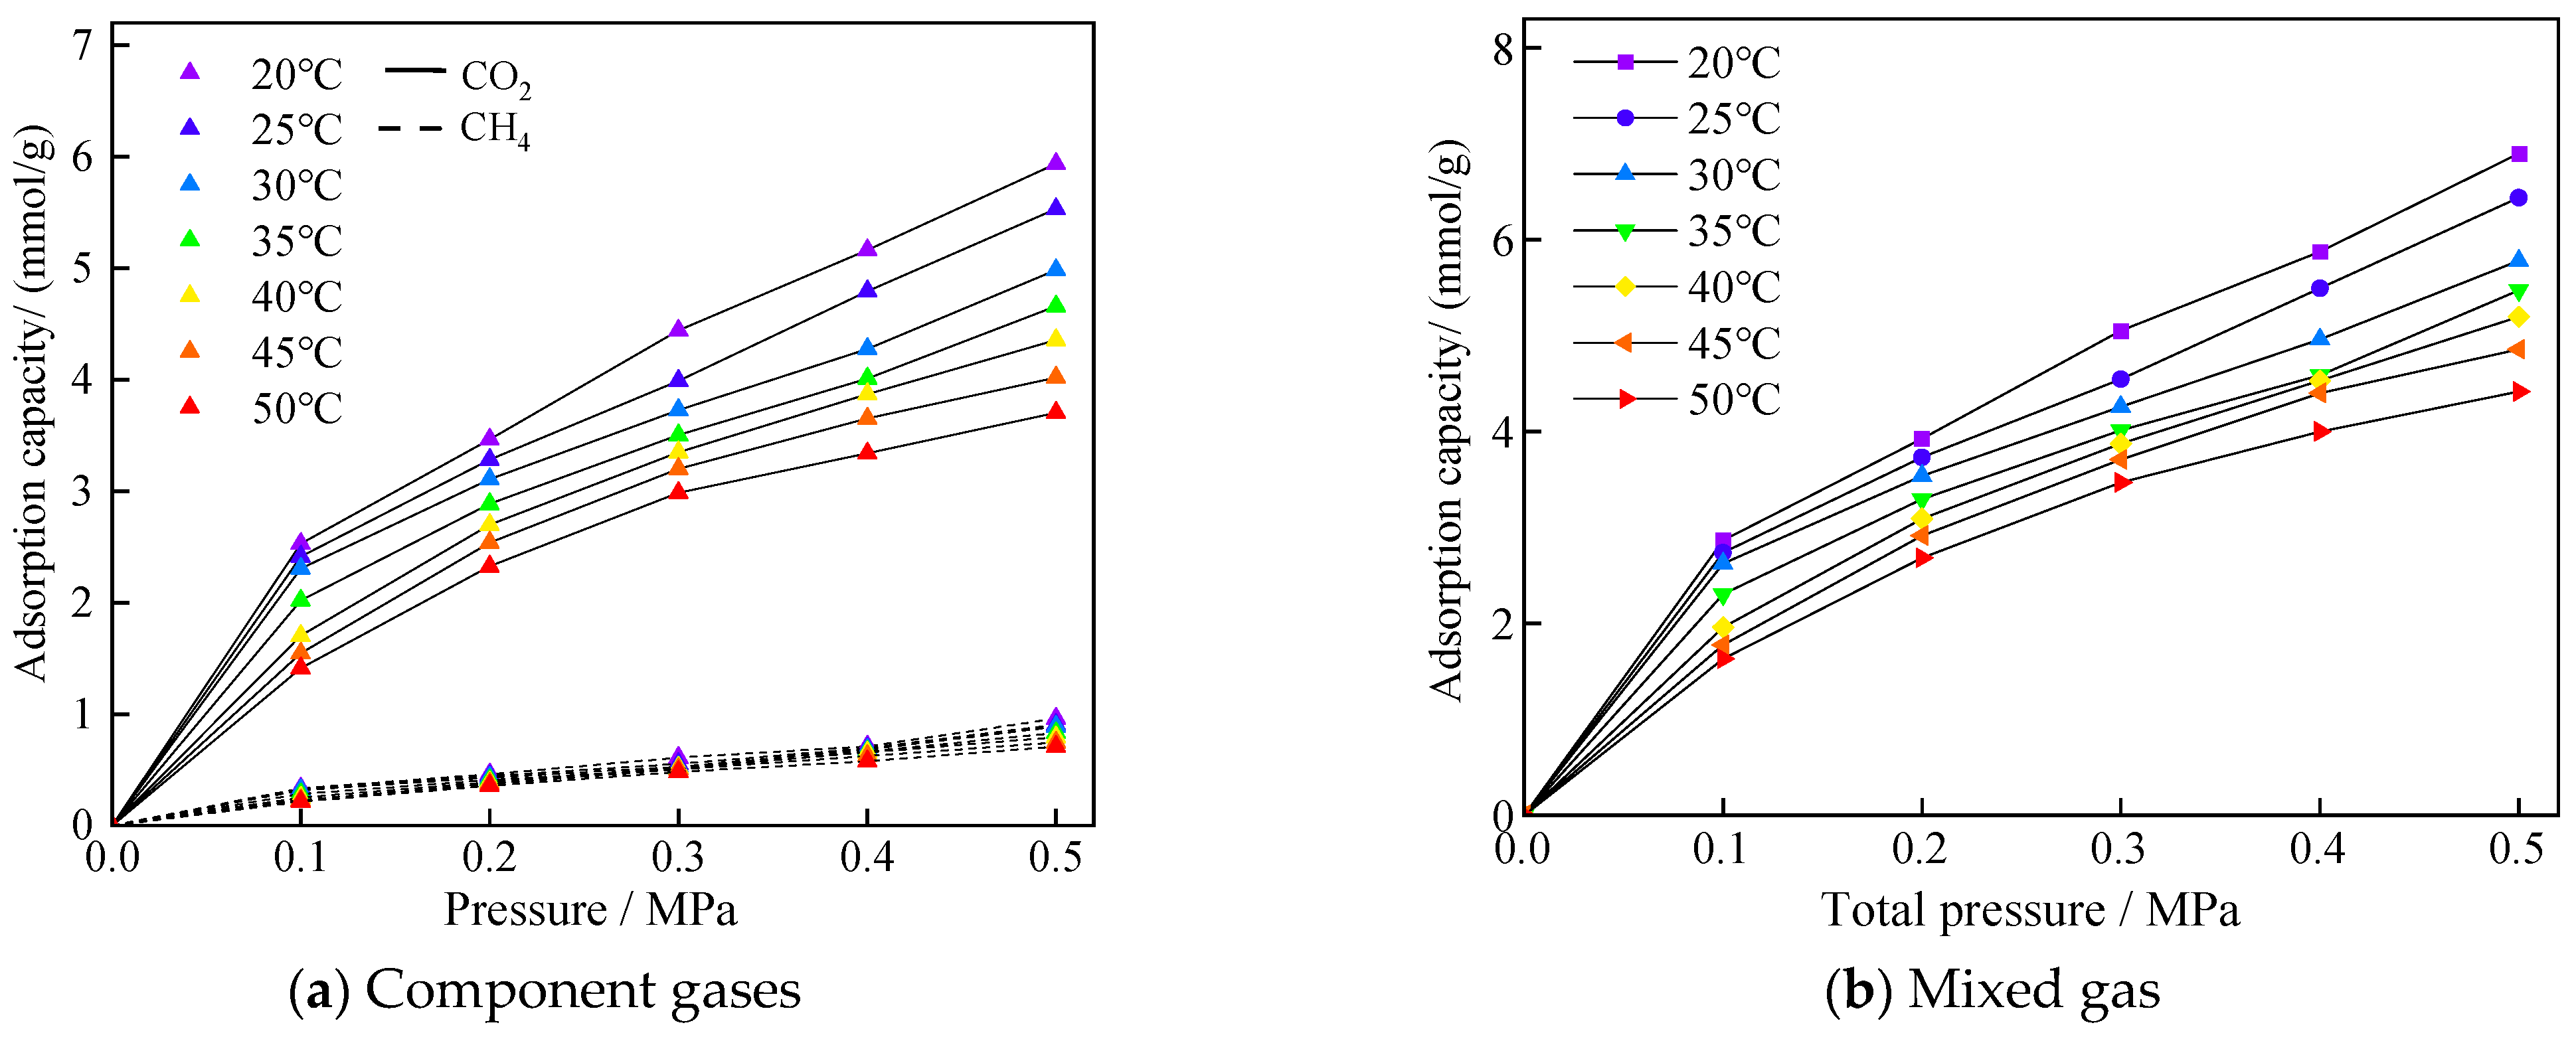
Before the simulation began, six simulation groups in micro-, meso-, and macropores were selected in this paper, and repeated simulations were conducted 3 to 4 times. The simulation results showed that the range of the number of adsorbed molecules under the same conditions was much smaller than the average value, proving that the adsorption results were stable under the simulation parameters set in this study. After the adsorption system in the model reached equilibrium, adsorption isotherms for an equimolar CO2/CH4 gas mixture in coal pores of different sizes were obtained. Figure 3a,b show the adsorption isotherms of the component gases and the mixture of gases, respectively, and all the adsorption isotherms are typical of the Langmuir-type adsorption curves. It can be seen that the adsorption amount of CO2 is larger than that of CH4 in each pore size, which reflects that CO2 has an advantage in the adsorption process of competing with CH4.
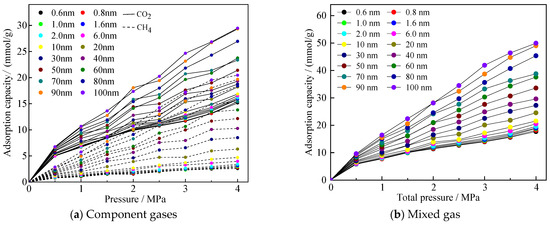
Figure 3.
Adsorption curves of gases mixed in equal proportions of CO2/CH4 in different pore sizes.
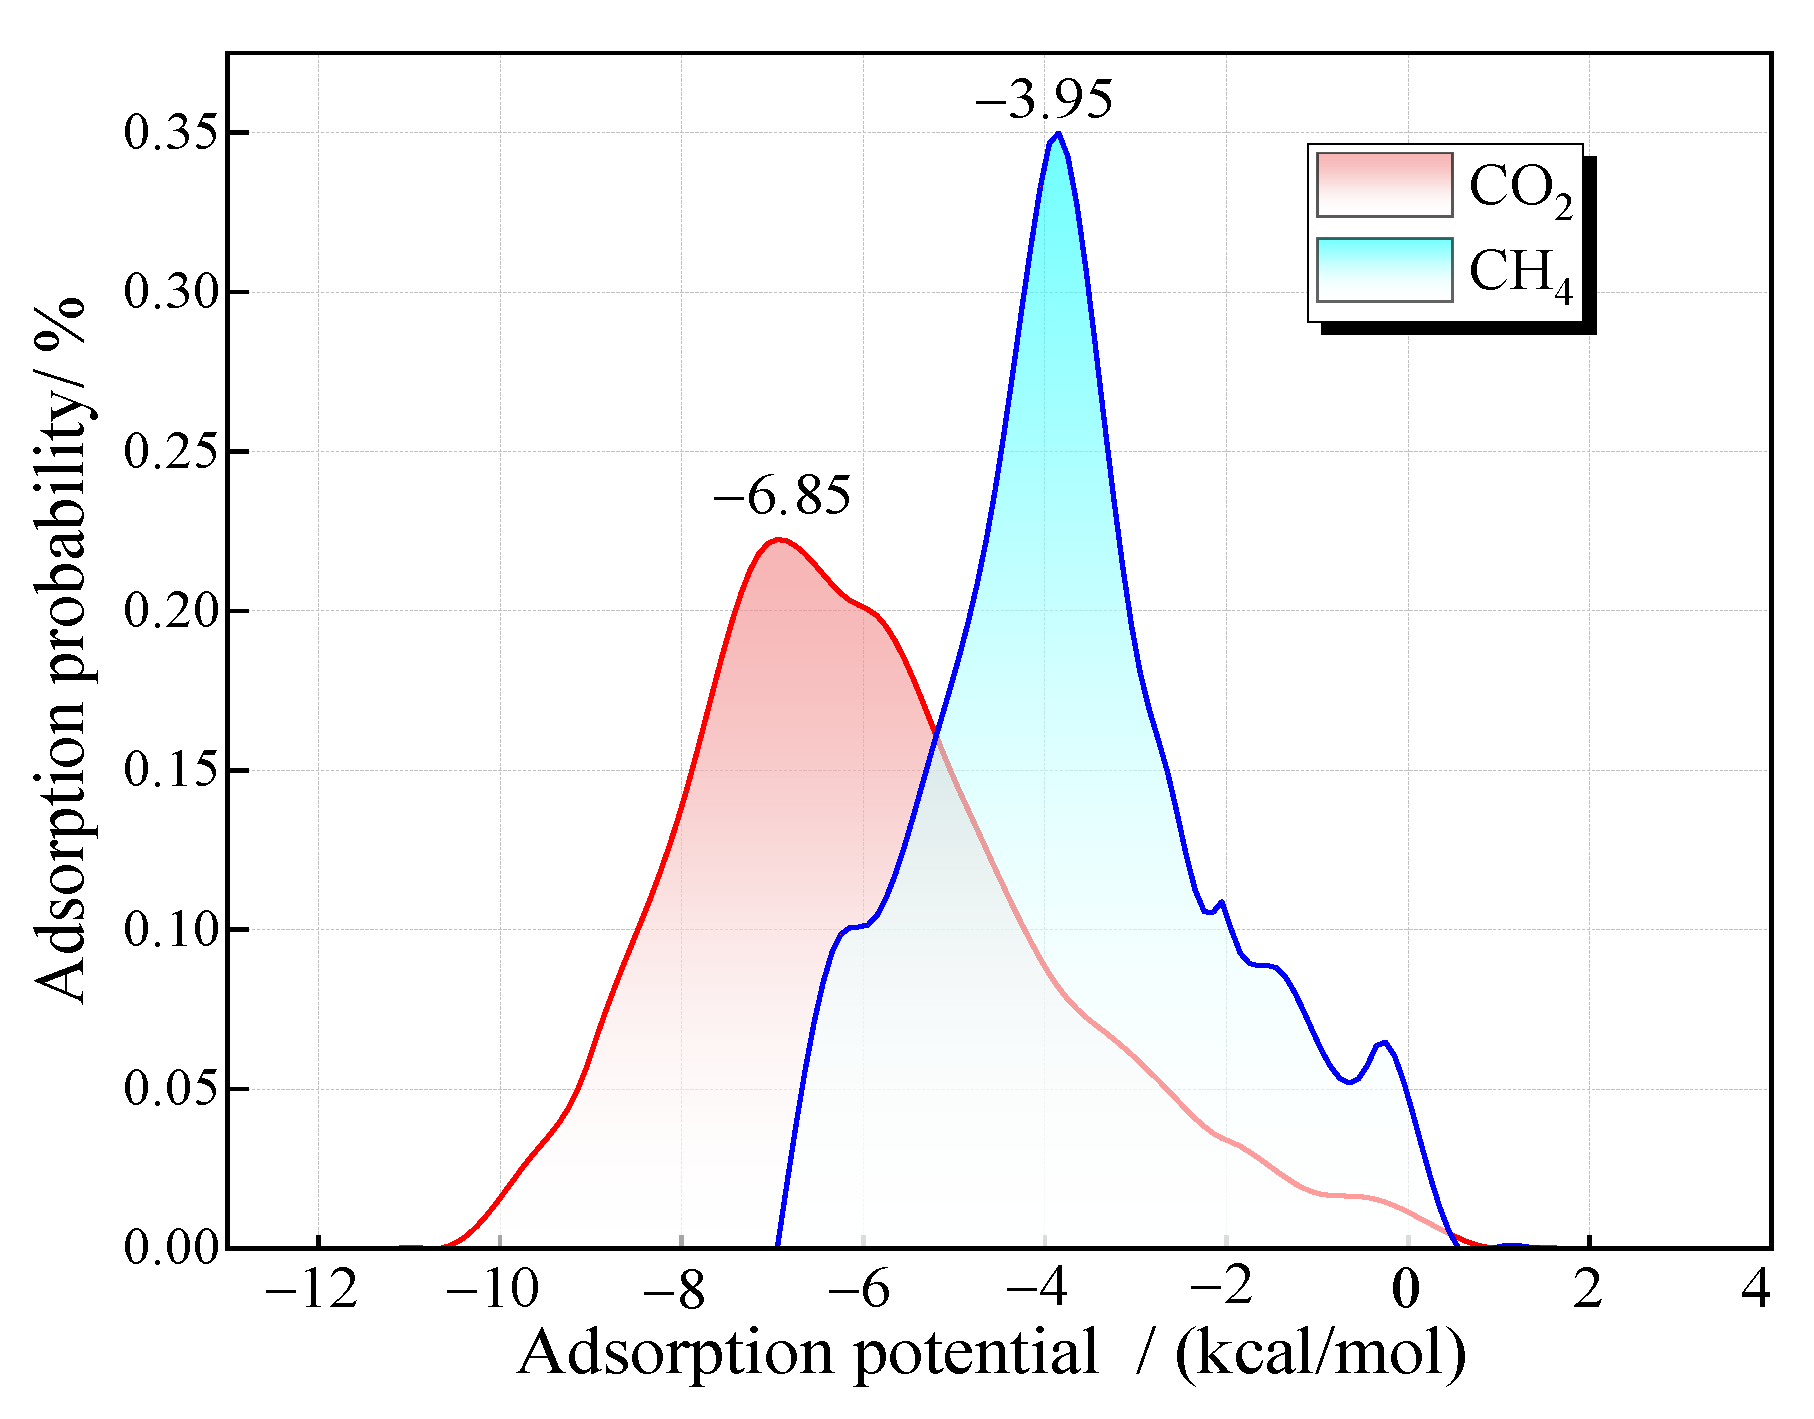
The distribution of gas adsorption probability at each adsorption potential energy point during the adsorption process can be obtained through Monte Carlo simulation. The larger the absolute value of the adsorption potential energy, the more stable the adsorption and the higher the priority of the adsorption point. If a gas has a greater adsorption capacity at the preferred adsorption point, it indicates that the adsorption affinity of the gas is stronger. Figure 4 shows the adsorption probability distribution of pure CO2 and pure CH4 in a 2 nm pore at 30 °C. The results reveal that the adsorption probability of coal molecules for gases follows a normal distribution with respect to adsorption potential energy. The optimal adsorption sites for CO2 and CH4 exhibit adsorption potentials of −6.85 kcal/mol and −3.95 kcal/mol, respectively. The adsorption potential energy of CO2 is generally higher than that of CH4.

Figure 4.
Distribution of adsorption probability of CO2 and CH4 with potential energy.
Furthermore, the distribution range of the adsorption probability of CO2 is relatively wide. There is a certain adsorption probability at the points with lower adsorption potential energy, indicating that CO2 also has a certain adsorption at the weak adsorption points on the coal surface. However, CH4 is concentrated around the points with an adsorption potential energy of −3.95 kcal/mol, suggesting that CH4 tends to attach to specific adsorption sites. Moreover, it has a relatively high competitive adsorption capacity on this type of adsorption site, which explains the preferred adsorption of CO2 in the adsorption system. It can be predicted that the adsorption affinity of CH4 gradually increases after the priority adsorption sites are occupied.
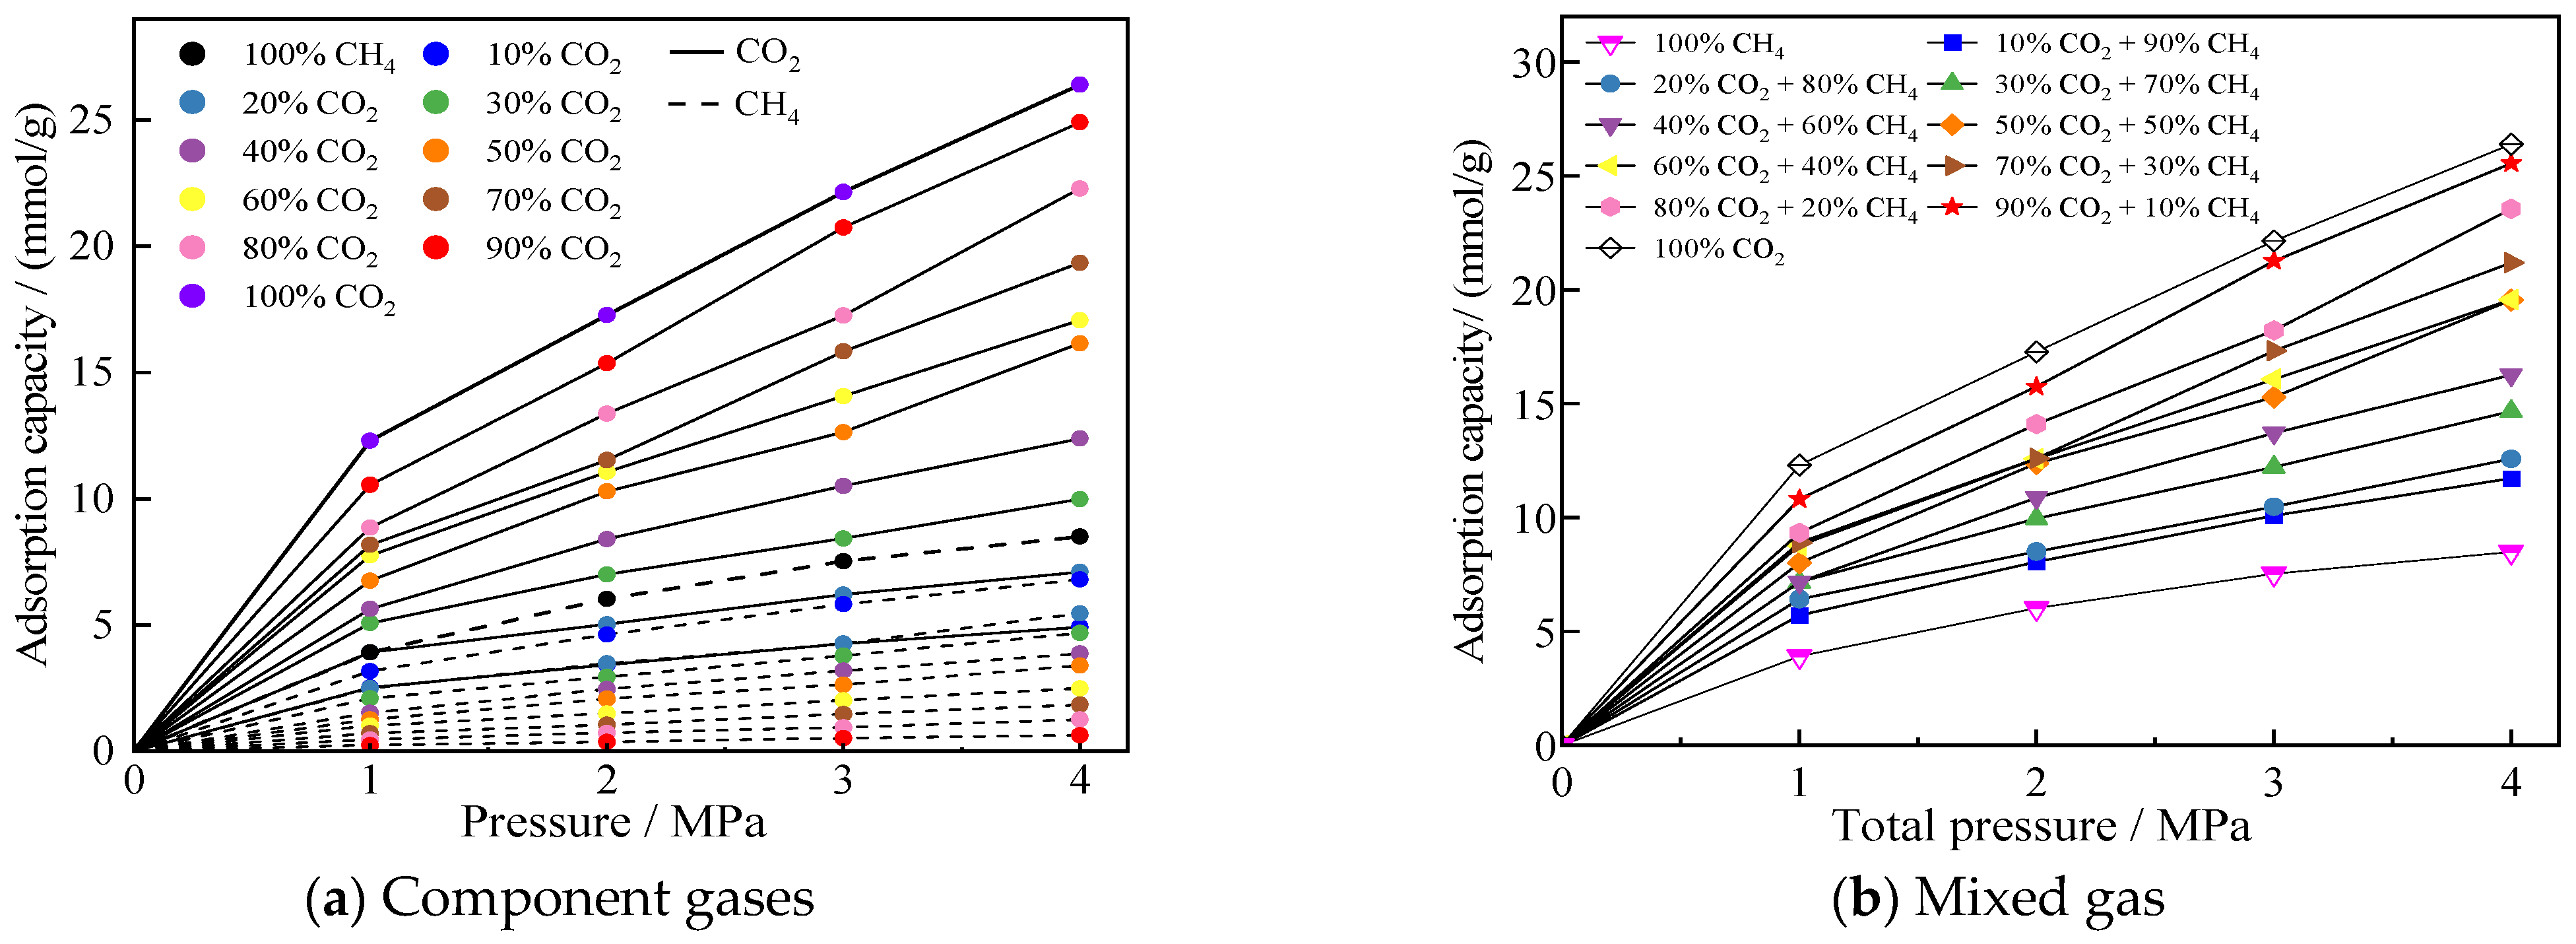
The isothermal adsorption curves of CO2/CH4 mixed gases with different molar ratios in 2 nm pores are shown in Figure 5. Figure 5a presents the component gas adsorption isotherms, demonstrating that coal exhibits significantly stronger adsorption affinity for CO2 than CH4. Even when CO2 only accounts for 20% of the mixed gas, its adsorption quantity still exceeds that of CH4. This phenomenon occurs because CO2 is a polar molecule while CH4 is non-polar, making CO2 more easily attracted by polar functional groups (such as hydroxyl and carboxyl groups) abundantly distributed on coal surfaces. Additionally, the smaller molecular diameter of CO2 facilitates its access to coal pores. Figure 5b displays the overall adsorption curves of the mixed gas, revealing that higher CO2 proportions result in greater mixed gas adsorption capacity.
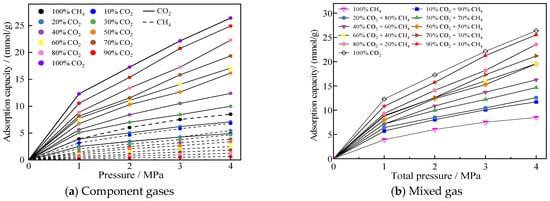
Figure 5.
Adsorption profiles of different ratios of CO2/CH4 mixed gases in a 2 nm pore.
The adsorption isotherms of CO2/CH4 mixed gases in equal substance ratios at different temperature environments are shown in Figure 6. The adsorption amounts of both gases decreased with increasing temperature, and, in terms of the adsorbed molecular weights, the change of temperature had a more obvious effect on CO2 adsorption, which was caused by the larger adsorption amount of CO2 molecules.
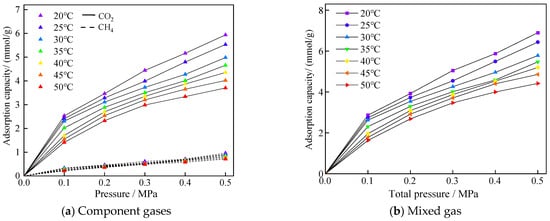
Figure 6.
Adsorption profiles of mixed gases of CO2/CH4 at different temperatures with equal ratio mixing.
3.2. The Variation in the Adsorption Selectivity Coefficient Under the Influence of Pore Size
In the adsorption model, the CO2/CH4 adsorption selectivity coefficient can be calculated according to Equation (6):
where NCO2 and NCH4 are the number of molecules of adsorbed CO2 and CH4, respectively, and nCO2 and nCH4 are the amounts of substance of CO2 and CH4 in the free phase, respectively. The ratio of the amounts of substance of the two is a certain value under a specific partial pressure, and this constant value is the ratio of the gases in the different simulation groups; the values are shown in Table 1. When Sc is greater than 1, it indicates that CO2 adsorption is preferred over CH4. A high CO2/CH4 adsorption selectivity coefficient indicates that CO2 is more enriched in the adsorbed phase than CH4 compared to the free phase ratio.
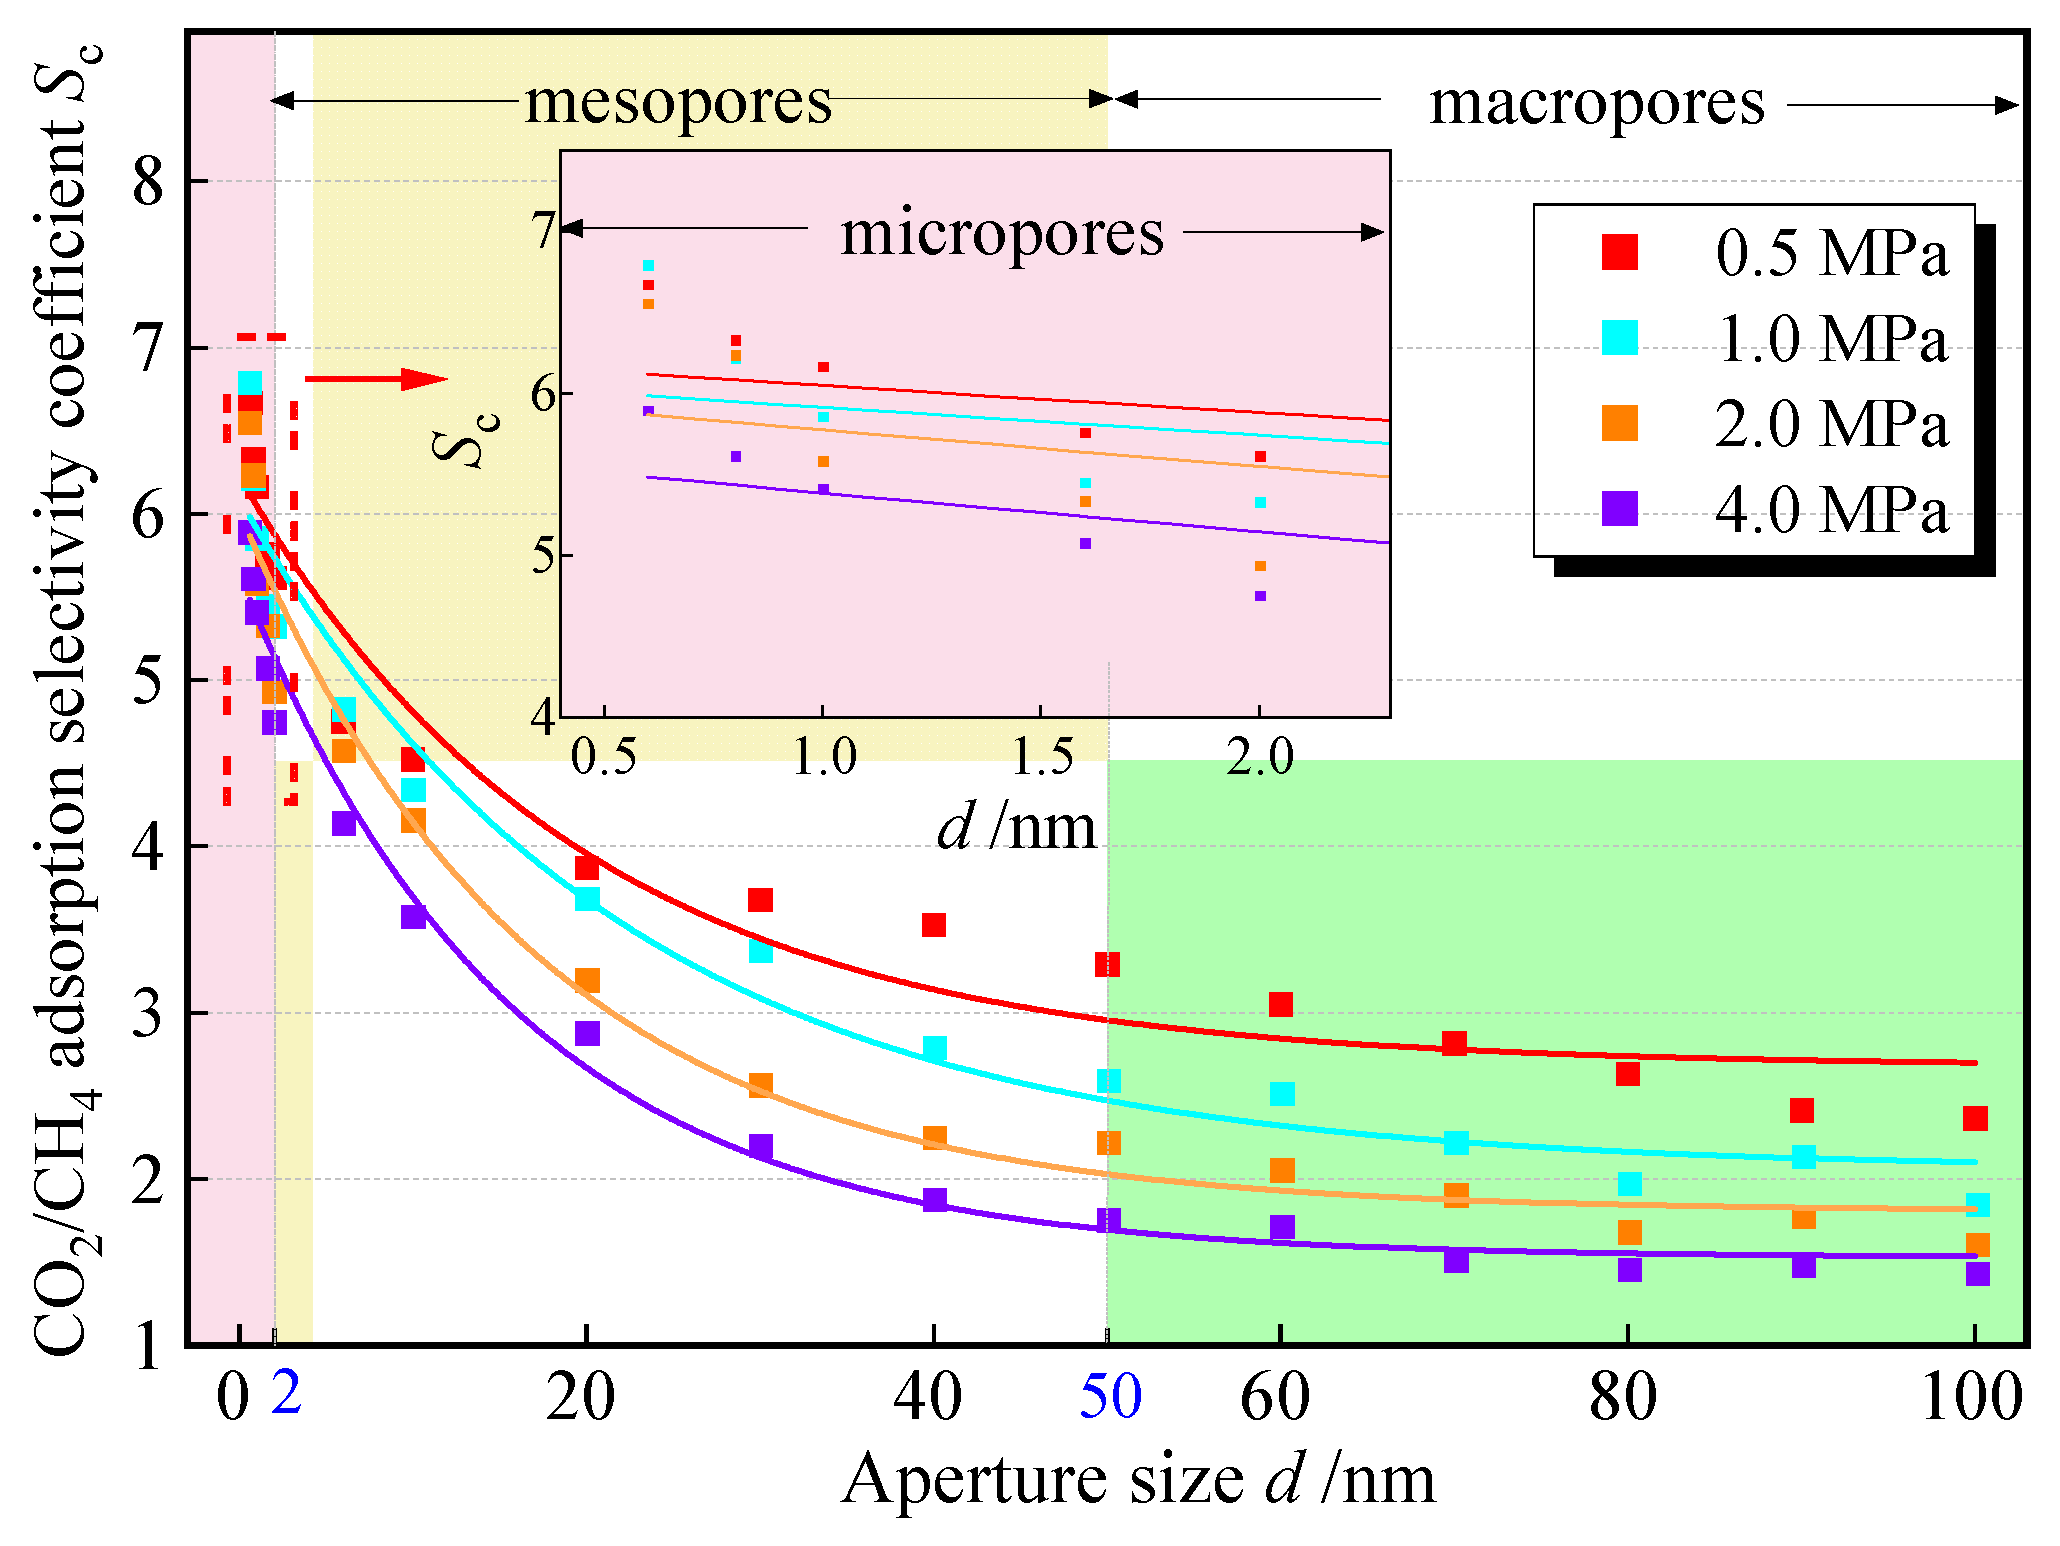
To explore the influence of pore size on the competitive adsorption of CO2 and CH4, in experimental groups 1 to 16, four pressure points, 0.5 MPa, 1.0 MPa, 2.0 MPa, and 4.0 MPa, were selected among the measured pressure points for side-by-side comparisons. The change in Sc with pore size is shown in Figure 7; it can be seen that among the three types of pores (microporous < 2 nm ≤ mesoporous < 50 nm ≤ macroporous), Sc shows a negative exponential decreasing trend with the increase of pore size: in the range of micropore sizes, Sc is the most sensitive to changes in pore size, and its value decreases rapidly with the increase in pore size; in pore sizes from 0.6 nm to 2.0 nm, the Sc value of the various pressure points generally decreases by more than 1; in the medium and large pore sizes, the trend of the decrease in the Sc slows down and gradually tends to stabilize with the increase in pore size, but always stabilizes above 1. The change rule of Sc with pore size at different pressure points is consistent, and it shows the phenomenon of decreasing the advantage of adsorption of CO2 with the increase in pressure.
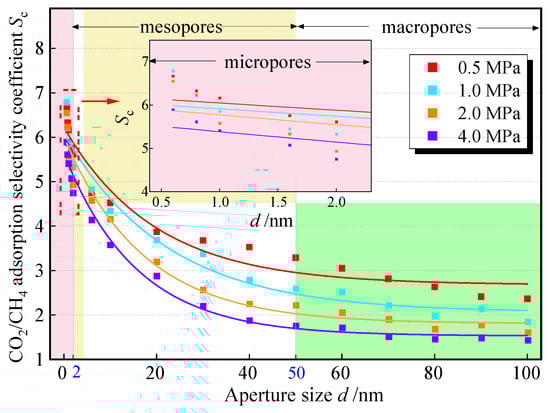
Figure 7.
The relationship between Sc and pore size.
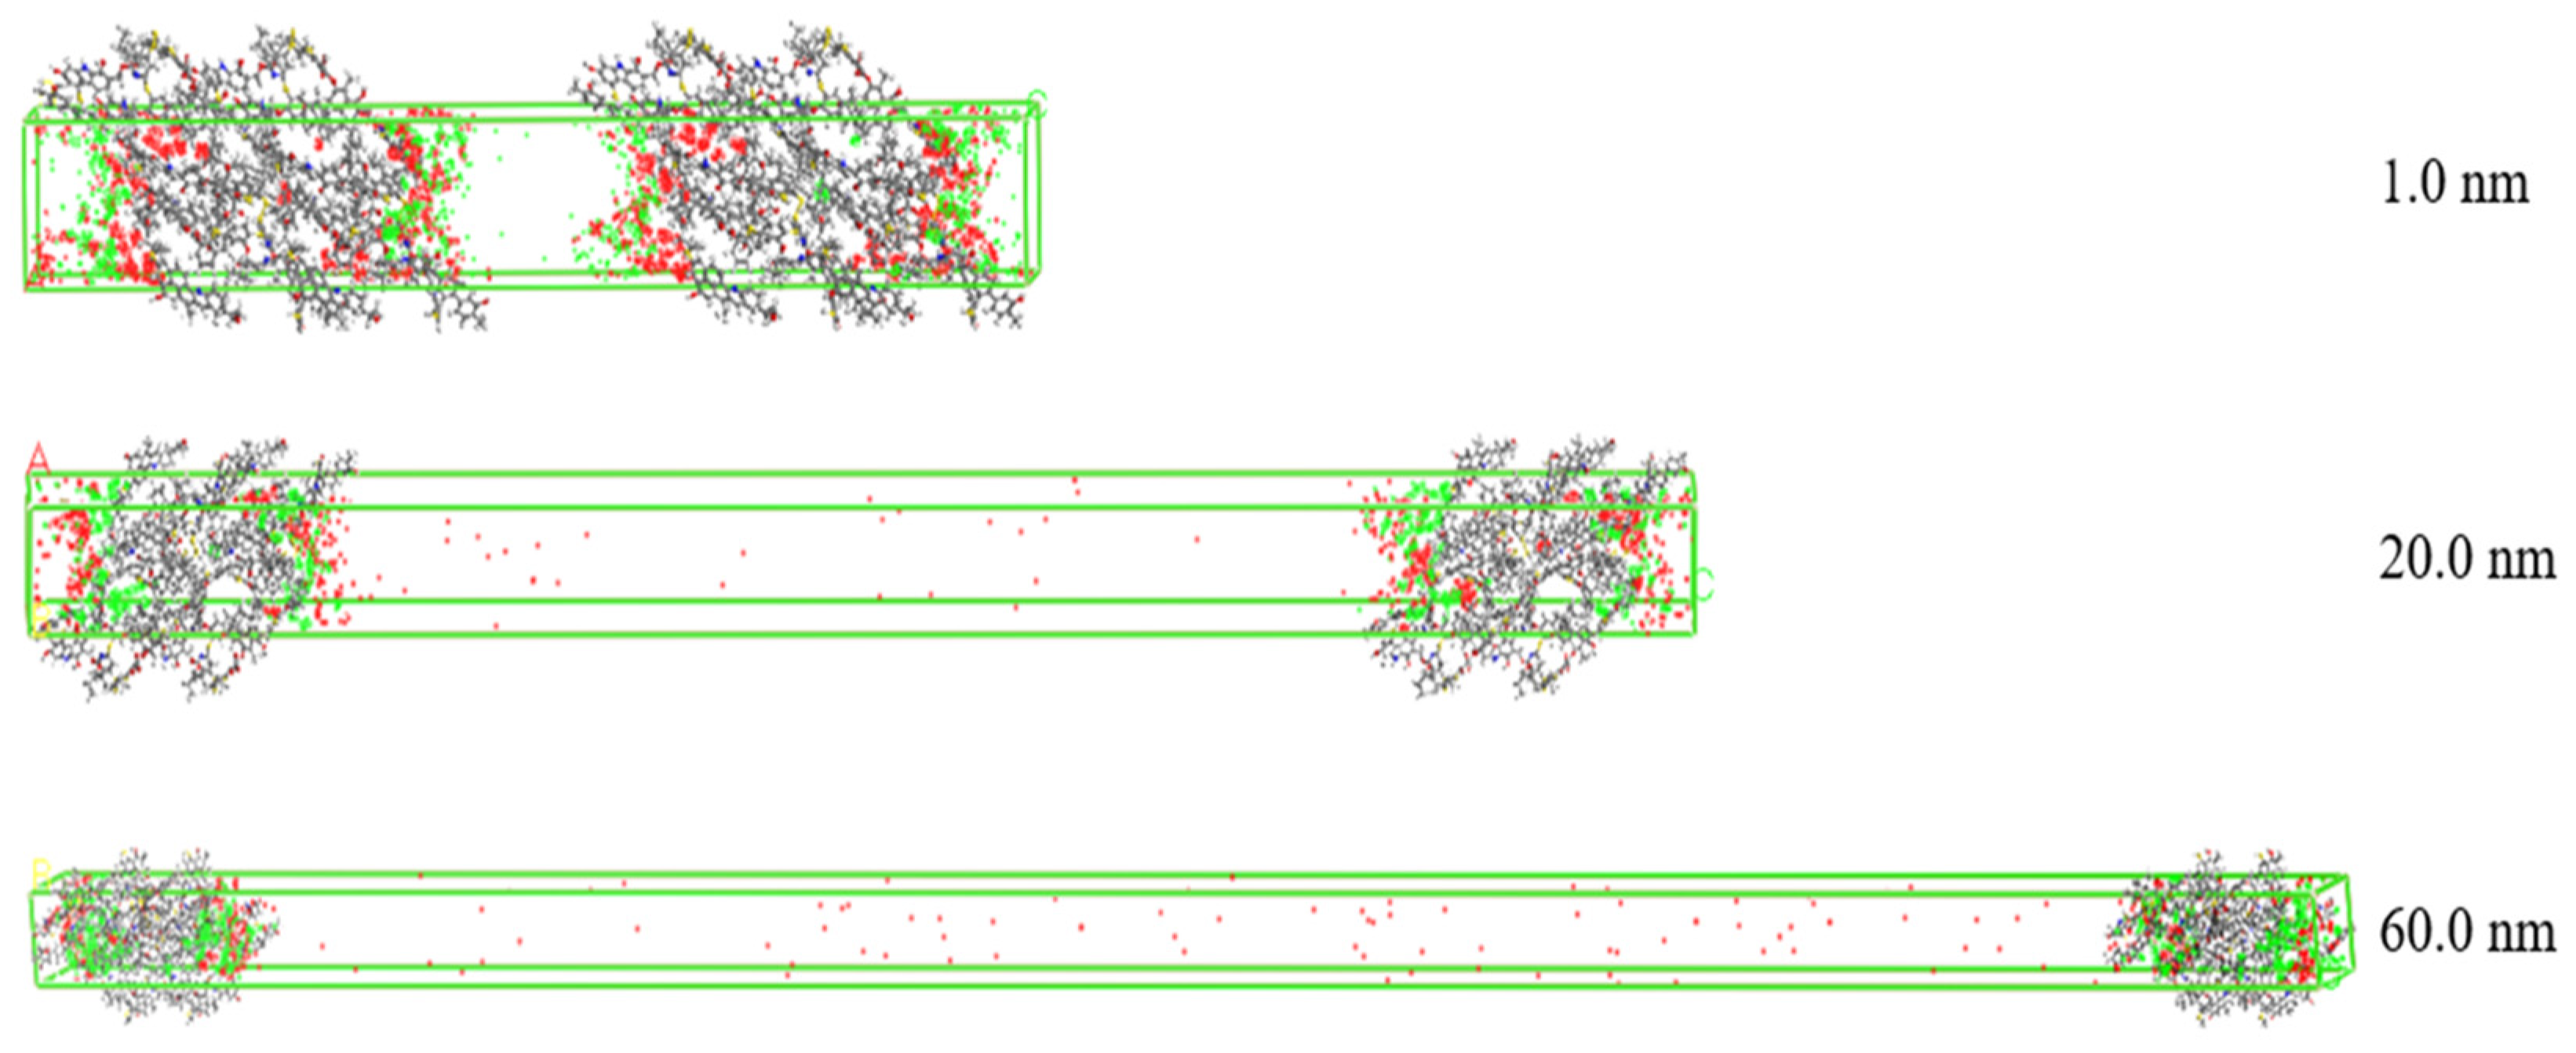
The density distribution of gas molecules adsorbed in different pore sizes at 2 MPa in the slit model is shown in Figure 8. The resolution of the scattered points represents the density of the gas in space. Red represents the density of CO2 molecules, and green represents the density of CH4 molecules. It can be seen that the gas molecules are concentrated on the surface of coal molecules. As the pore size increases from 1.0 nm to 60.0 nm, the density of CO2 gradually decreases while that of CH4 increases. This is because in the micropores, the specific surface area is relatively high and the free space volume is small, the intermolecular forces are strong, and CO2 and CH4 undergo intense competitive adsorption in the narrow space. CO2 has a significant adsorption advantage. When the pore size increases, the free space increases, the competitive intensity between gas molecules weakens, and the inhibitory effect of CO2 on CH4 adsorption decreases. Therefore, the larger pore size weakens the adsorption affinity of coal molecules for CO2.
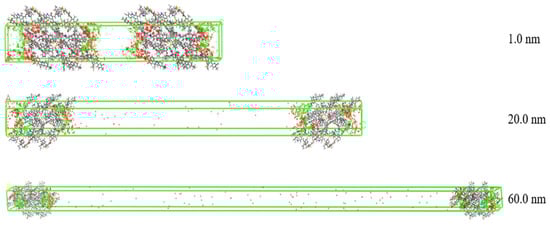
Figure 8.
The density distribution of component gases in different pore sizes at 2 MPa (red discrete dots explain CO2, green discrete dots explain CH4).
In order to quantitatively analyze the effect of pore size (d) on Sc, the change curves were fitted exponentially, and the results are shown in Table 4. The coefficients of determination of the fitted curves, R2, are all above 0.94, and the form of the equation expressed in Equation (7) basically explains the law of the effect of pore size on Sc:
where a, b, and c are the fitting parameters, and x is the independent variable representing each of the influencing factors. e is the base of the natural logarithm.
Table 4.
Fitting equation for the relationship between Sc and pore size.
The results show that the micropores of coal have a stronger adsorption capacity for CO2, and the proportion of micropores and mesopores in high-rank coal is relatively high. It can be predicted that it has a greater adsorption capacity for CO2. Within the range of mesopores and macropores, especially when it is greater than 50 nm, Sc enters a stage of gradual decline. At this time, the pore size has little influence on the adsorption selectivity. It can be considered to sacrifice the competitive adsorption advantage and select coal seams or coal bodies with a large distribution of macropores for injection to improve the injection efficiency.
3.3. The Variation in the Adsorption Selectivity Coefficient Under the Influence of Gas Proportion
To explore the influence of the proportion of gas components on the competitive adsorption of CO2 and CH4, the simulation set nine different gas mixture ratios, with the CO2 mole fraction increasing in 10% increments from 10% to 90%. The variation in Sc with the percentage of CO2 in the mixed gas obtained from the simulation and the fitted curves is shown in Figure 9.
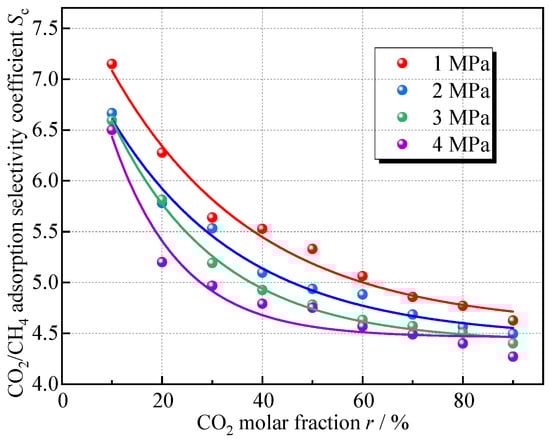
Figure 9.
Relationship between Sc and molar fraction of CO2.
The selective adsorption effect of the coal on CO2 gradually weakens with the increase in the CO2 molar fraction in the mixed gas, under different pressures, as the molar proportion of CO2 increases from 10% to 90%, the reduction rate of Sc is generally above 30%; the decreasing tendency is also exponential, and the overall pattern is consistent at different pressures. This indicates that coal exhibits stronger CO2 adsorption capacity when the CO2 concentration is lower; this is similar to the research results of Jia et al. [17], and is because at low CO2 fractions, CO2-surface interactions dominate, allowing CO2 molecules to fully occupy the active sites on coal surfaces, resulting in high adsorption selectivity. As CO2 concentration increases, intermolecular repulsion between CO2 molecules weakens their interaction with coal surfaces. The accumulated CO2 molecules near the surface create a shielding effect, increasing CH4’s access to adsorption sites. Consequently, CH4 adsorption rises.
Denoting the CO2 molar fraction, %, by r, the relationship between CO2 molar fraction and Sc was also fitted by Equation (7), and the results are shown in Table 5. From the fitted coefficient of determination, Equation (7) still explains the relationship.
Table 5.
Fitting equation for the relationship between Sc and CO2 molar fraction.
3.4. The Variation in the Adsorption Selectivity Coefficient Under the Influence of Mixed Gas Pressure
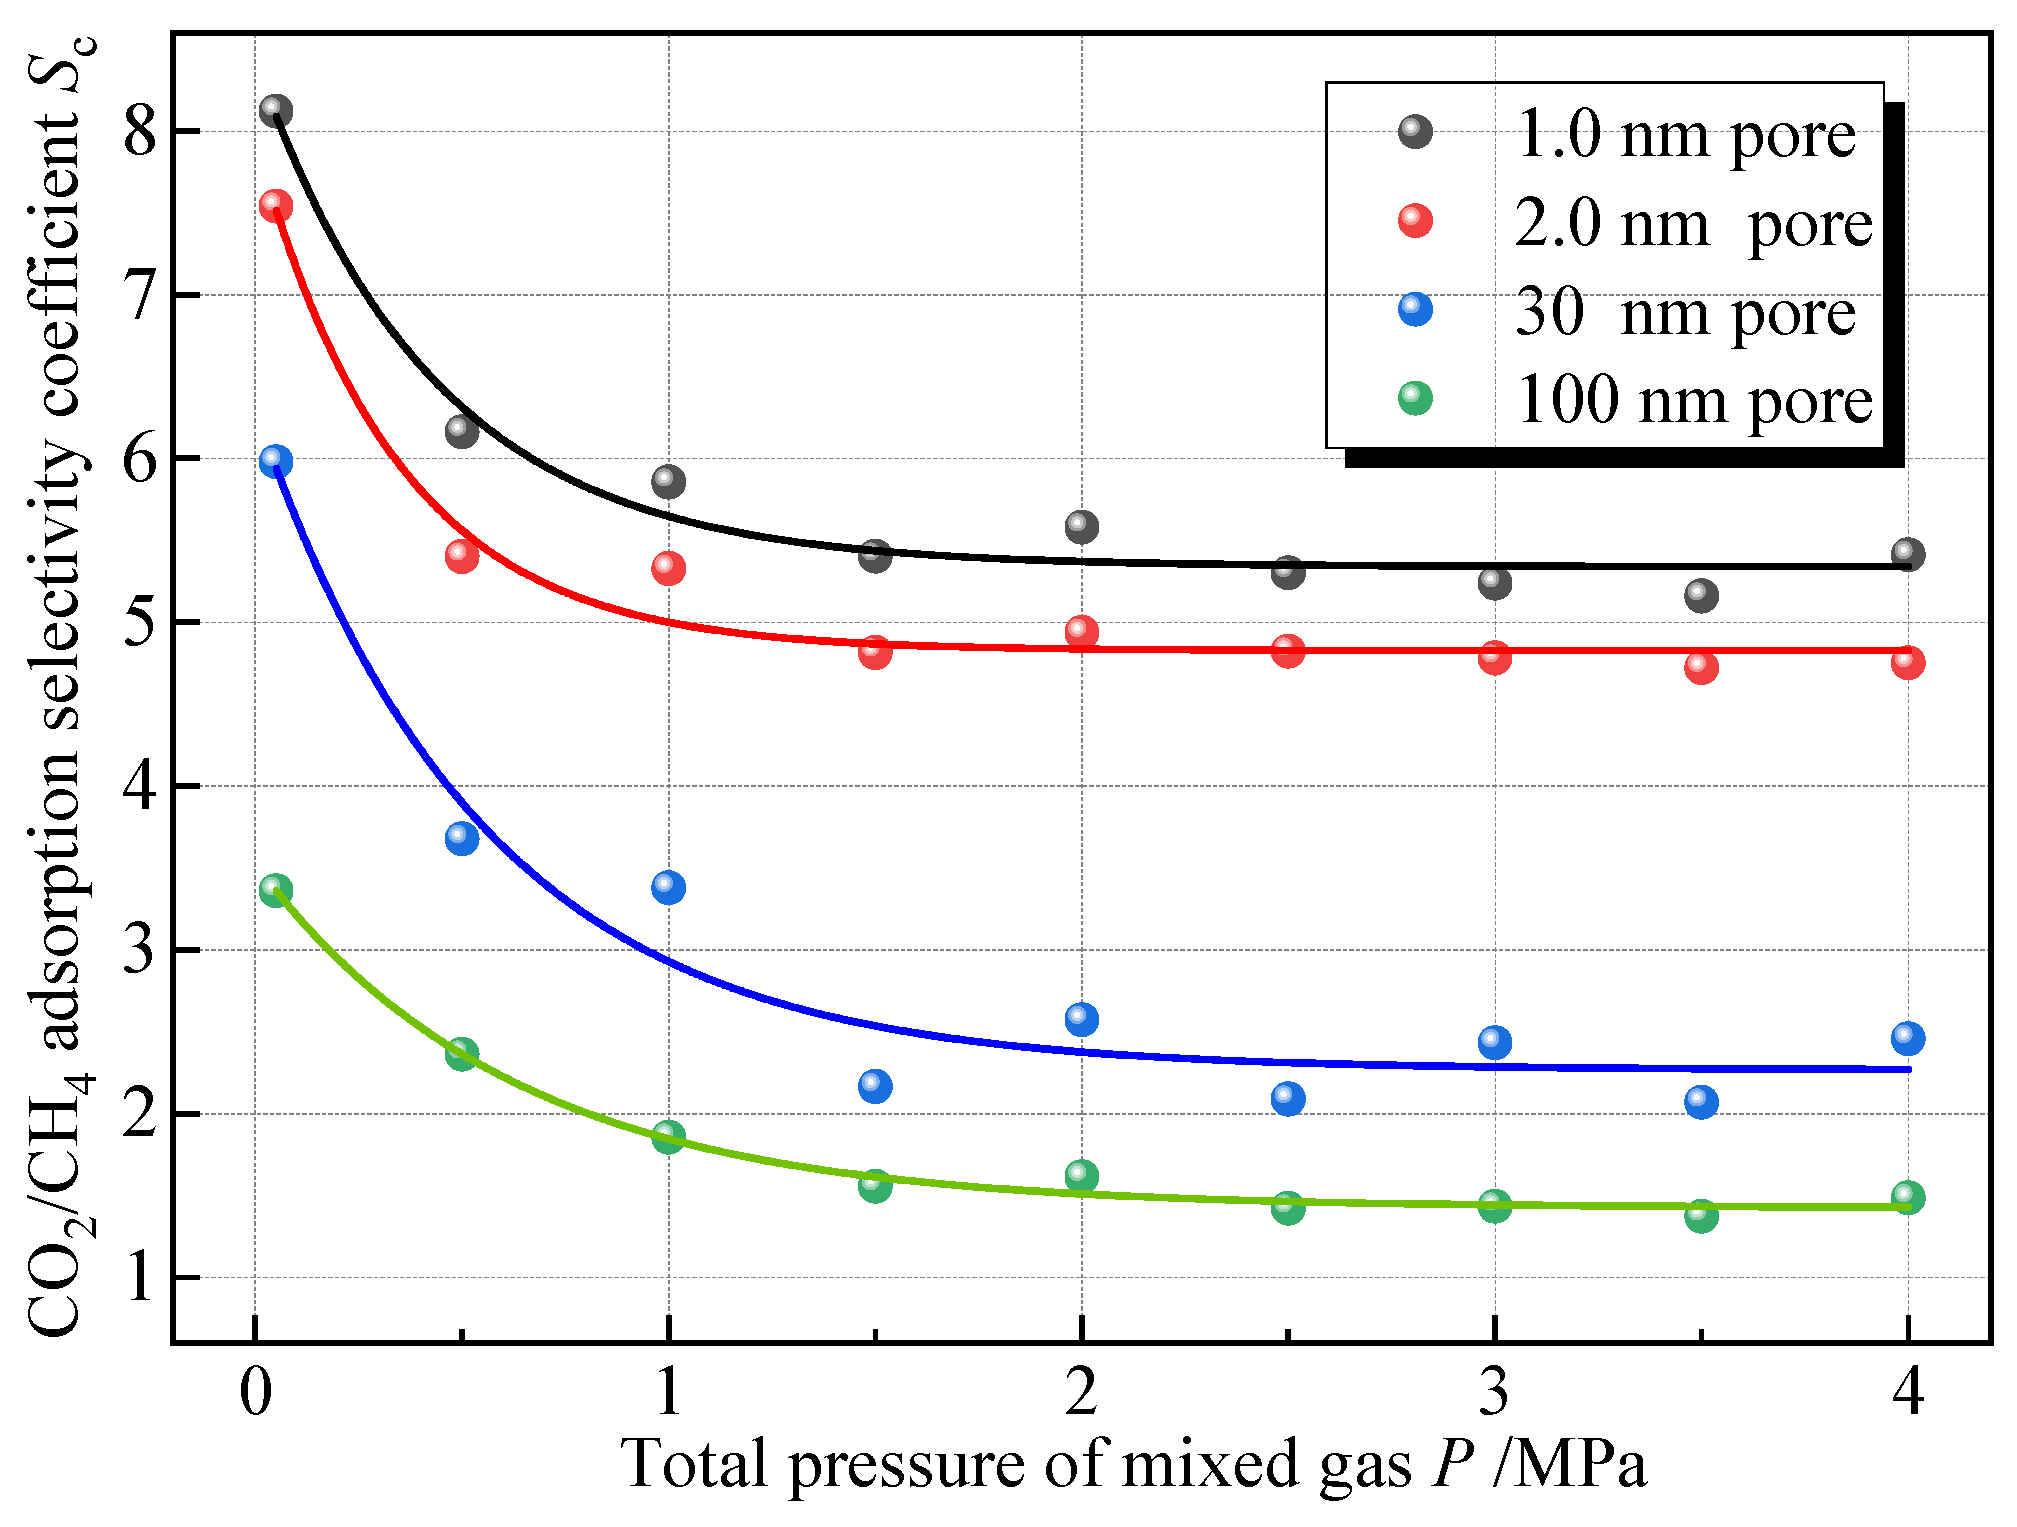
To explore the influence of the total pressure of the mixed gas on the competitive adsorption of CO2 and CH4, comparing the adsorption isotherms of adsorbing equal amounts of mixed CO2 and CH4 gases in four pore sizes at 30 °C, Sc was calculated at each pressure point, and Figure 10 shows the variation in Sc with the total pressure of the mixed gases. As the total pressure increases, the selectivity of coal adsorption on CO2 gradually decreases, and it can be seen that the action law still conforms to the negative exponential function. Under the same pressure, the smaller the pores, the larger the Sc. As the pressure increases from 0 to 4 MPa, the Sc of the pores at 1.0 nm, 2.0 nm, 30 nm, and 100 nm decreases by approximately 34%, 36%, 60%, and 57% respectively. The decreasing trend of Sc exhibits a rapid decrease, a slow decrease, and a gradual steady decrease when the pressure is 0~0.5 MPa, 0.5~2 MPa, and more than 2 MPa, respectively. This is consistent with the findings of Xie et al. [16]. In addition, Liao et al. [15] conducted an experiment on the adsorption of 50%CH4 + 50%CO2 mixed gas by shale. The experimental results also showed that Sc changed negatively exponentially with pressure, which confirmed the accuracy of the simulation results.
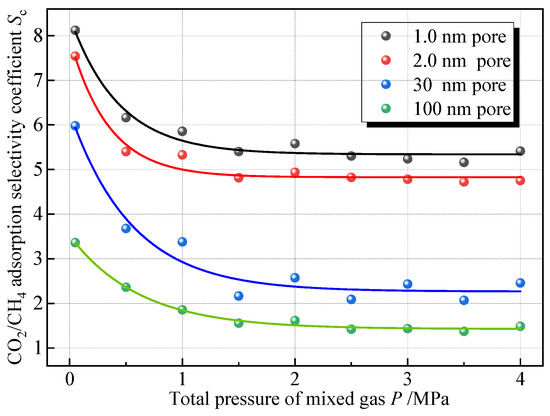
Figure 10.
Sc versus mixed gas pressure.
This is because at lower pressure, the adsorption sites on the coal surface are relatively more numerous, and CO2 molecules will preferentially occupy the dominant adsorption sites on the coal surface due to their stronger adsorption capacity during the adsorption process of the coal, and at this time, the adsorption selectivity of coal on CO2 is stronger. With the increase in gas pressure, the advantageous adsorption sites on the coal surface are gradually occupied, and the remaining adsorption sites are weak energy sites; at this time, the competitive ability of CO2 relative to CH4 is weakened, and the Sc is also reduced. Curve fitting was performed on the scatter points, and the fitted equations for the relationship between the mixed gas pressure and Sc are shown in Table 6, with p denoting the total mixed gas pressure, MPa; the fitted equations in each aperture have a high degree of fit, with the coefficients of determination above 0.94.
Table 6.
Fitting equation for the relationship between Sc and total pressure.
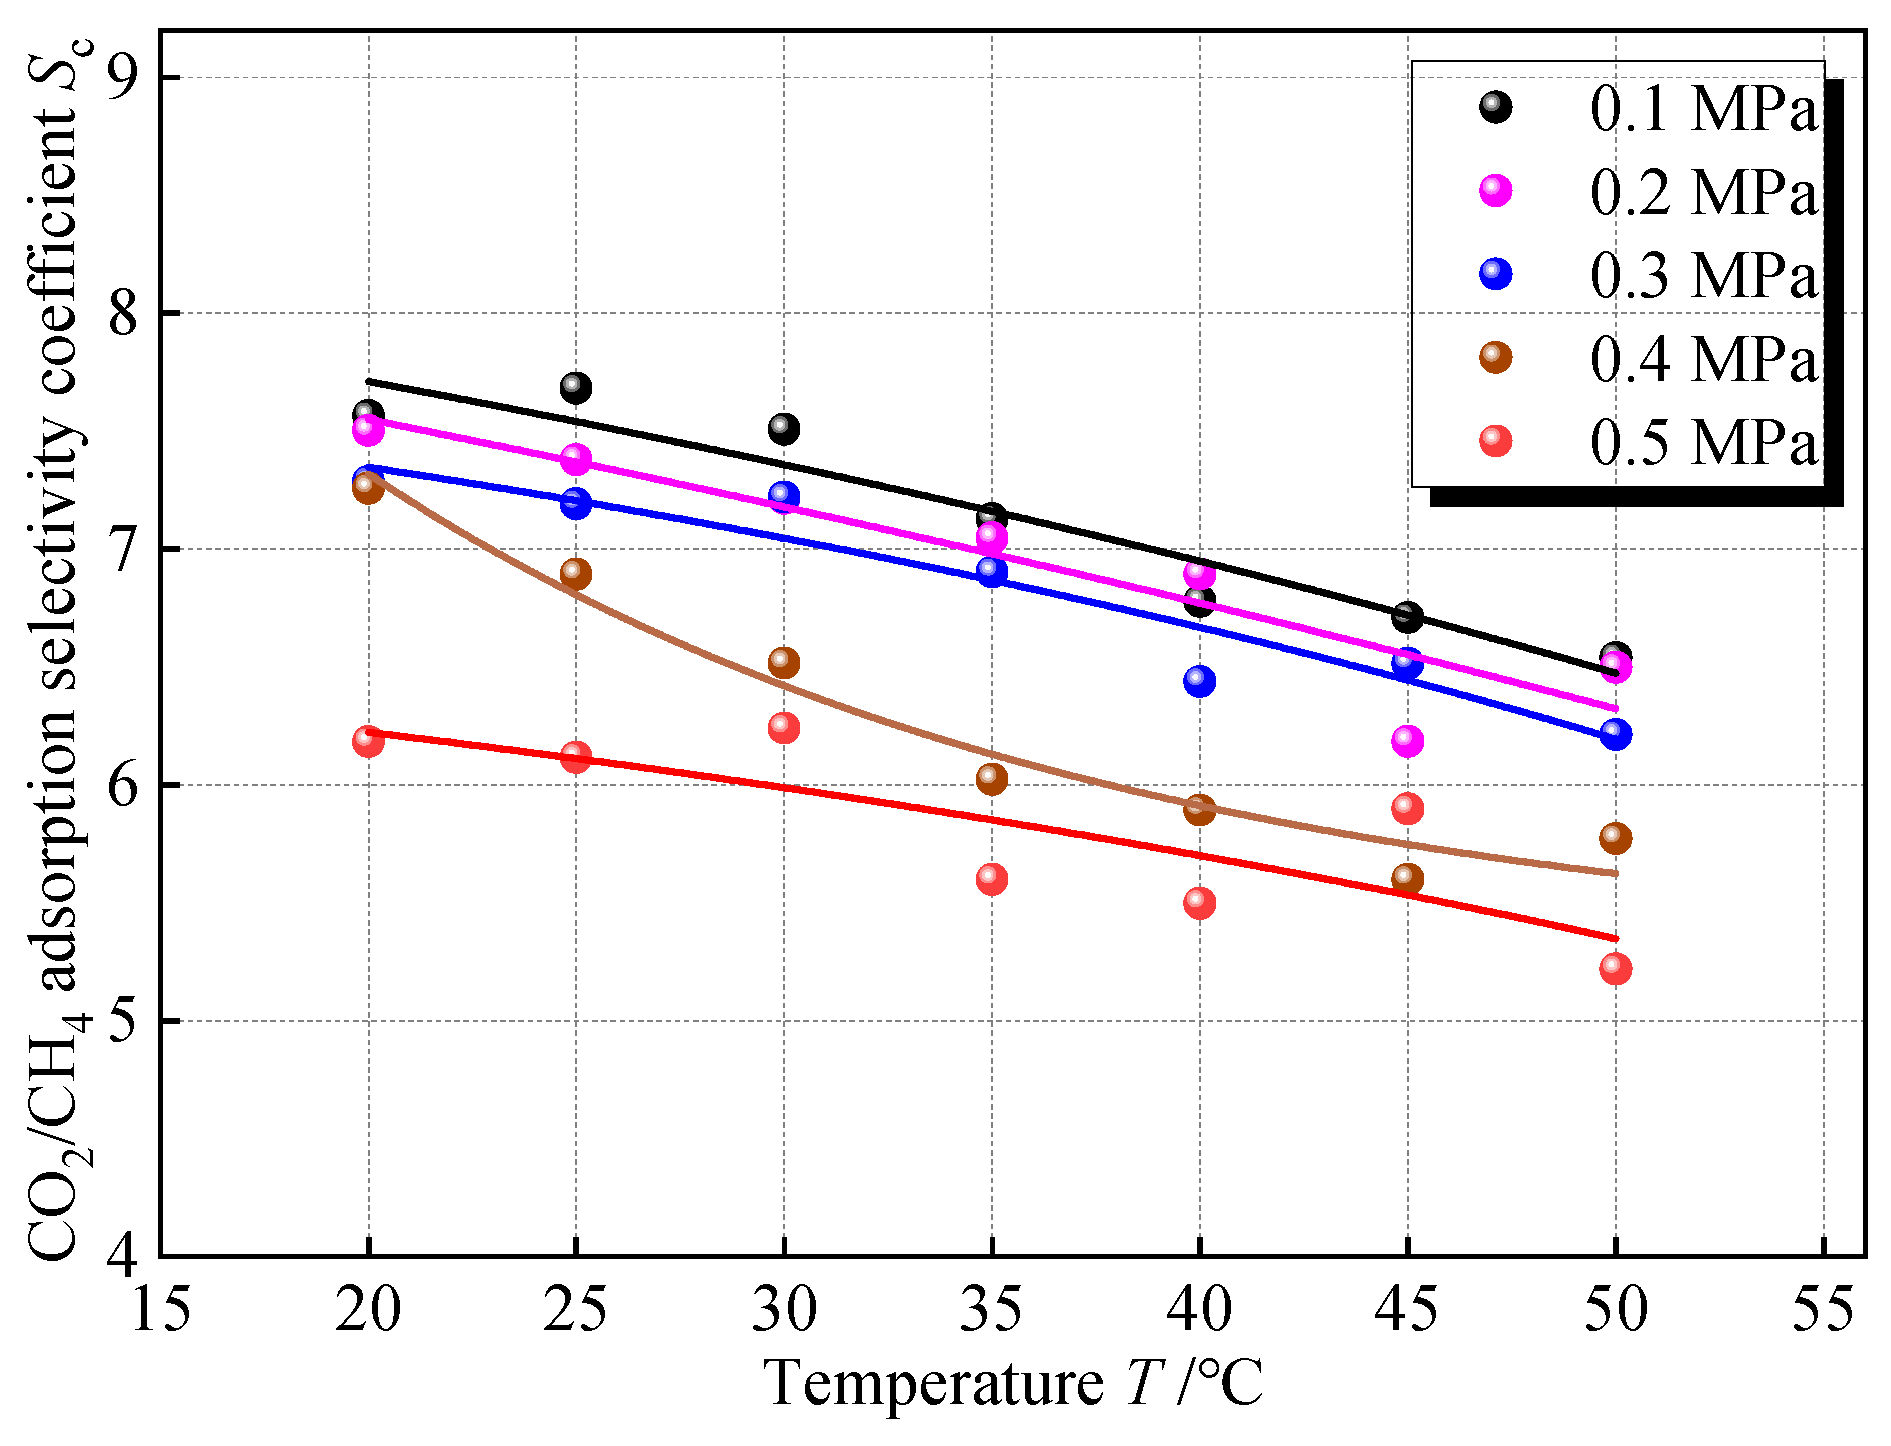
3.5. The Variation in the Adsorption Selectivity Coefficient Under the Influence of Temperature
To explore the influence of temperature on the competitive adsorption of CO2 and CH4, the simulation of adsorption of CO2 and CH4 gases mixed in equal amounts at different temperatures in 2 nm coal pores was carried out, and the Sc at the same pressure point on different isotherms was taken for comparison, and the results are shown in Figure 11. Sc shows a slow decreasing trend with increasing temperature. Within the temperature difference range of 20~50 °C, the variation range of Sc in all pressure groups was only about 1, and the change was not obvious. Under the buried condition, in the horizontal direction of the same coal seam, if it is not affected by local geologic structures such as magma intrusion and strong groundwater activity, the temperature difference is smaller. In the vertical direction, the buried depth span of the same coal seam tends to be small, and the temperature variation is also small, so the unevenness of the temperature of the coal seam does not have much effect on the selectivity of CO2 and CH4 adsorption.
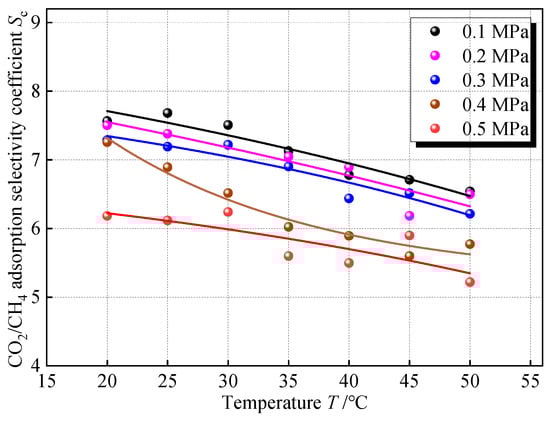
Figure 11.
Relationship between Sc and temperature.
In terms of the nature of adsorption, the adsorption process is an exothermic process, and an increase in temperature at the same pressure will desorb the gas and reduce the amount of adsorption. Compared with CH4, CO2 is more affected by temperature. Because CO2 has a stronger force with the surface of the coal, the heat of adsorption is greater, and its desorption tendency is more obvious when the temperature increases, making the Sc decrease. Still trying to fit the effect of temperature on Sc with an exponential regression model, this paper denotes the temperature by T, °C. The fitted equation is shown in Table 7, which shows a good fit in terms of the coefficient of determination.
Table 7.
Fitted equations for the relationship between Sc and temperature.
3.6. Ranking of the Importance of Factors Affecting Competitive Adsorption
From the above analysis, it can be seen that the pore width, CO2 molar fraction, gas pressure, and temperature are all negatively correlated with Sc, but with different strengths of influence on the Sc value. In order to compare the intensity of the influence of the four factors on the adsorption selectivity of coal adsorption of CO2/CH4 mixed gas, the relationship between the four factors and Sc was analyzed by multiple regression. In the multiple regression model, the size of the absolute value of the regression coefficients of the influencing factors indicated their importance to the dependent variable Sc.
The four influencing factors have different units and orders of magnitude, which may lead to misjudgment of the importance of other variables. In order to eliminate the influence of the order of magnitude and scale of the variables, this study applied range normalization to the independent variables, mapping the range of the values of these data with different scales into a specific interval (set as 0~1 in this paper), so that each variable is comparable. The variable standardization method is:
wher, X′ represents the range-normalized variable value, X denotes the original variable value before normalization, and Xmax and Xmin correspond to the maximum and minimum values of the variable X, respectively.
In order to simplify the calculation and facilitate the conversion to a multiple linear regression model, this paper takes the natural logarithm on both sides of the equation at the same time, and has the following equations for a single influencing factor:
where m is a fitting constant. Considering the combined effects of four factors on Sc, regression analysis of the normalized independent variables yields the following model equation:
where β0 is the intercept, ω is the error term, and c1, c2, c3, and c4 are the normalization coefficients of the pore width normalized quantity d′, CO2 molar fraction normalized quantity r′, mixed gas pressure normalized quantity p′, and temperature normalized quantity T′, respectively, and the magnitude of its absolute value reflects the importance of the corresponding influencing factors on Sc. Using the existing simulation results as data samples, Equation (10) was used as the model for multivariate linear fitting, and the results are shown in Table 8.
Table 8.
Results of multivariate linear fitting of the effect of multiple factors on lnSc.
The coefficients of the regression equation are all negative, and the absolute values are |c1| > |c3| > |c2| > |c4|, which shows that the values of the four influencing factors are negatively correlated with lnSc, and the importance of the four influencing factors is ranked as pore size > mixed gas pressure > CO2 molar fraction > temperature. This indicates that the size of the coal pore size has the most critical influence on the adsorption selectivity of CO2 and CH4, and the smaller the pores in the coal, the stronger the adsorption selectivity of CO2, followed by the gas pressure, and the CO2 molar fraction and the ambient temperature have a weaker influence on the adsorption selectivity.
4. Optimization of Adsorption Selectivity Coefficient Model
In the CO2-ECBM work, an accurate adsorption selectivity coefficient can better predict the adsorption concentration of CO2 and the desorption purity of CH4 in the coal after CO2 is injected into the coal seam and the adsorption equilibrium is reached, which can help to determine the pressure and quantity during the CO2 injection process, and to evaluate the CH4 production at different development stages. The expression of the adsorption selectivity coefficient for the competitive adsorption of CO2 and CH4 obtained from E-L model is [13]
where VL1 and VL2 denote the Langmuir volume of CO2 and CH4, respectively, cm3/g; PL1 and PL2 denote the Langmuir pressure of CO2 and CH4, respectively, MPa. Equation (11) shows that the adsorption selectivity coefficient in the process of competitive adsorption of two gases is completely determined by the adsorption constants of a single gas at the time of adsorption. Temperature and pore structure have a large influence on the adsorption constants [35], and changes in both will change the adsorption constants; therefore, Equation (11) can reflect the influence of temperature and pore structure on adsorption selectivity, but it cannot accurately reflect the changes in the competitive adsorption characteristics with the gas pressure, the ratio of component gases, and other factors.
To investigate the response patterns of Sc to these factors, we modified the existing E-L model accordingly. Based on the above analysis and considering that pore size distribution and temperature variations remain relatively constant in homogeneous coal seam [36], the two are not used as correction factors. According to the molecular simulation results, Sc shows exponential changes with both gas pressure and CO2 molar fraction and an exponential correction factor is set to Equation (11), and the correction model is shown in Equation (12):
where α1, α2, and α3 are correction parameters.
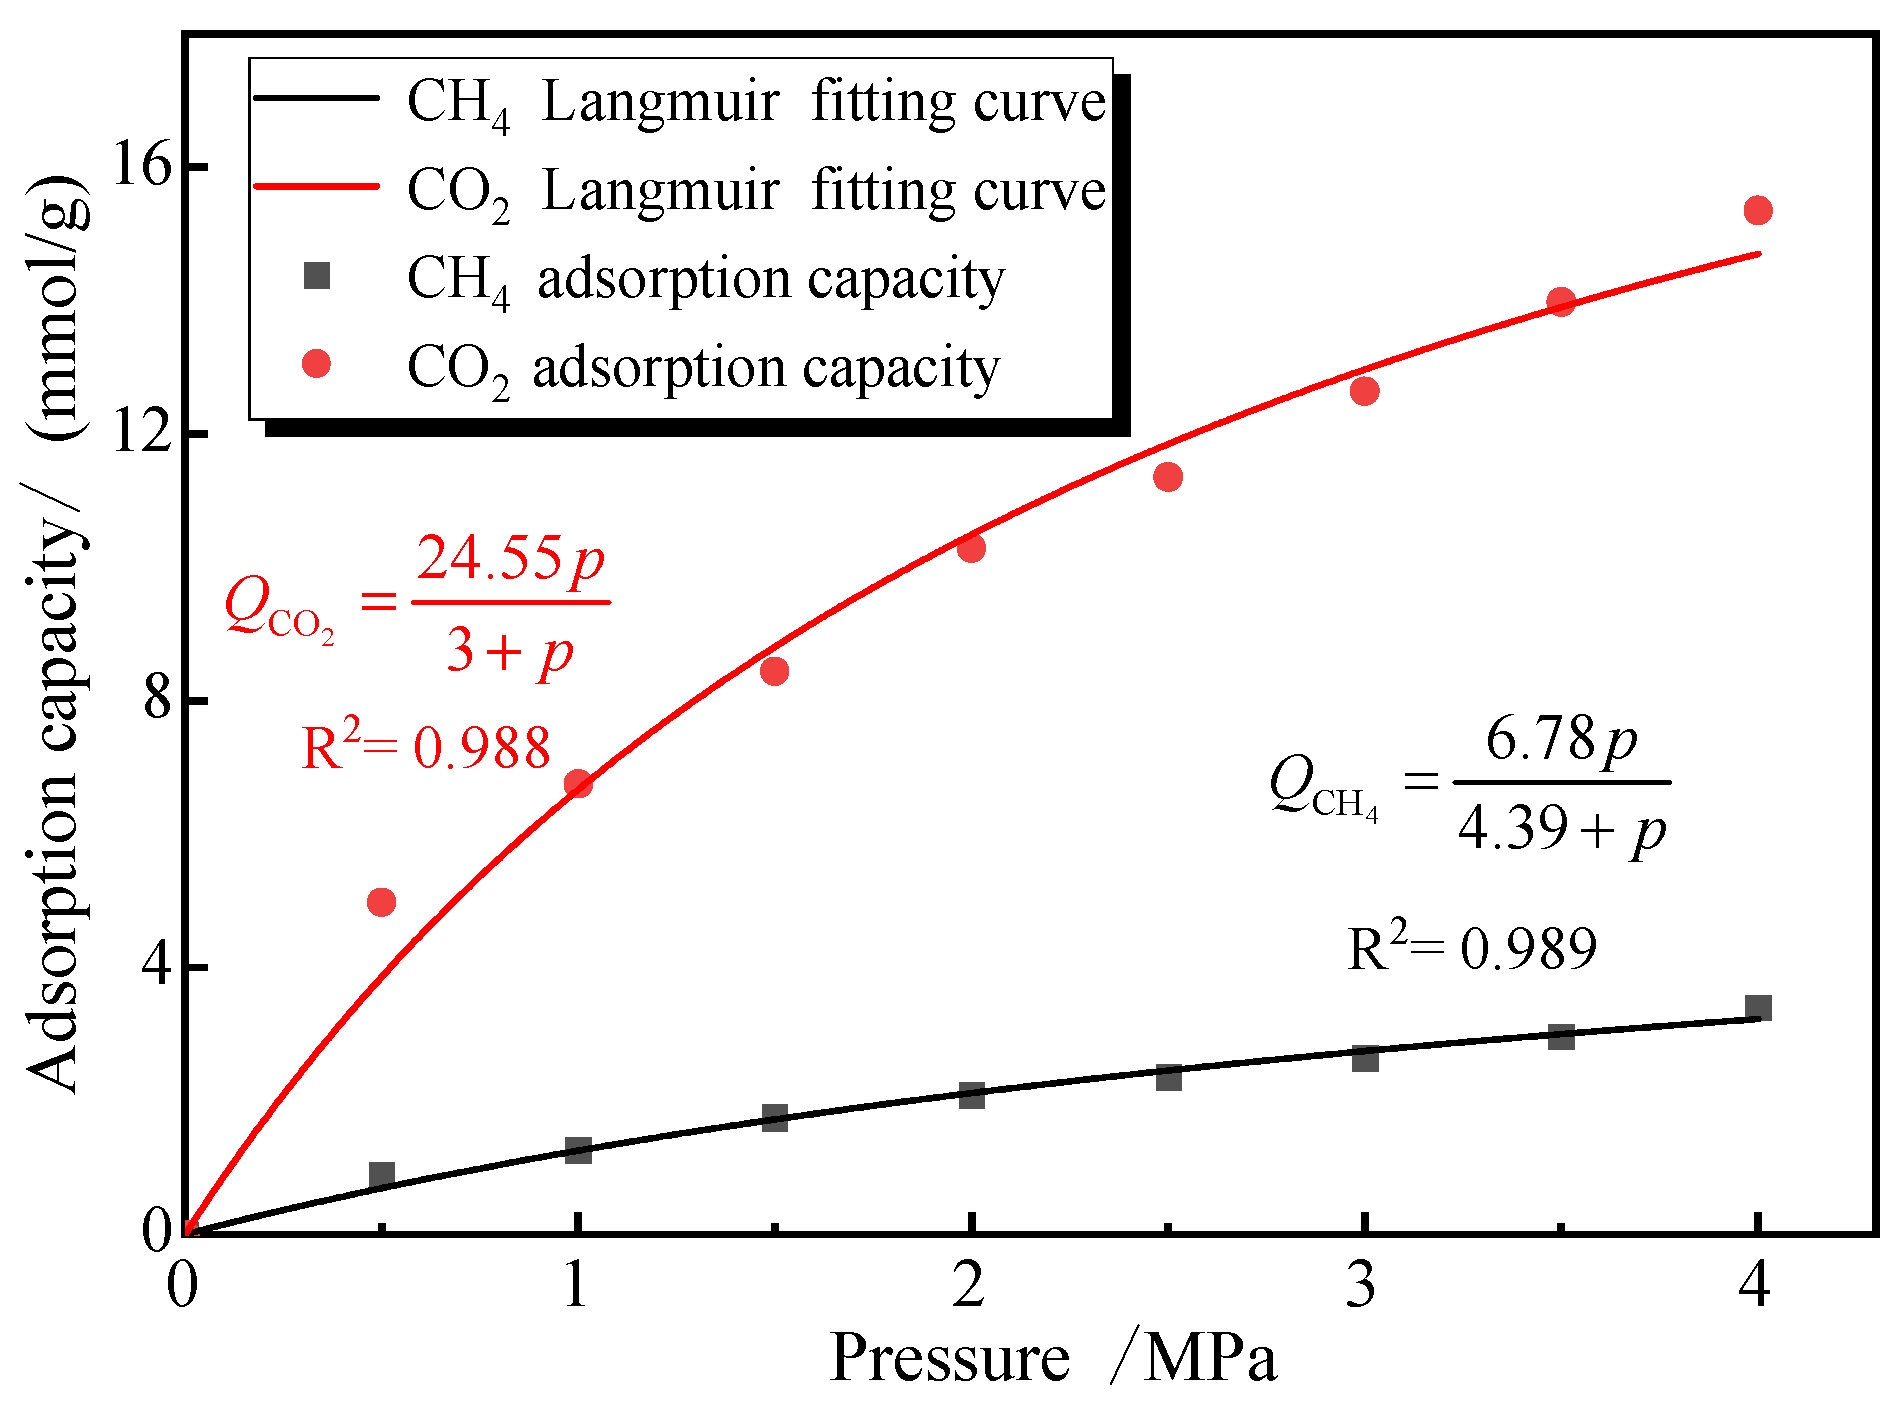
The simulation primarily used 2 nm pores as the basis for testing adsorption isotherms. Therefore, to validate the modified model’s applicability in predicting adsorption selectivity, we substituted the single-component gas adsorption parameters (CO2 and CH4) from 2 nm pores at 30 °C into Equation (12) and used this equation to fit the Sc values for mixed gas adsorption under identical temperature and pore size conditions. Figure 12 presents both the single-component adsorption isotherms and their corresponding Langmuir adsorption functions.
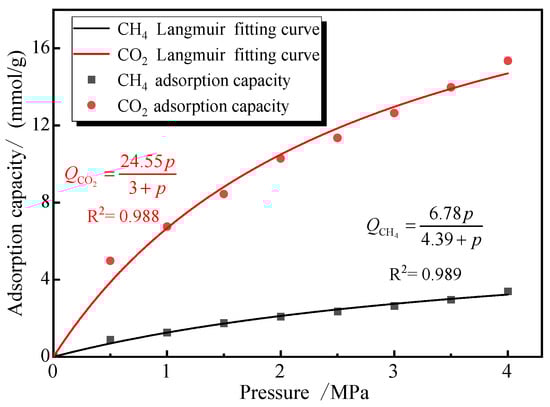
Figure 12.
Adsorption isotherms of CO2 and CH4 single gas in 2 nm pore.
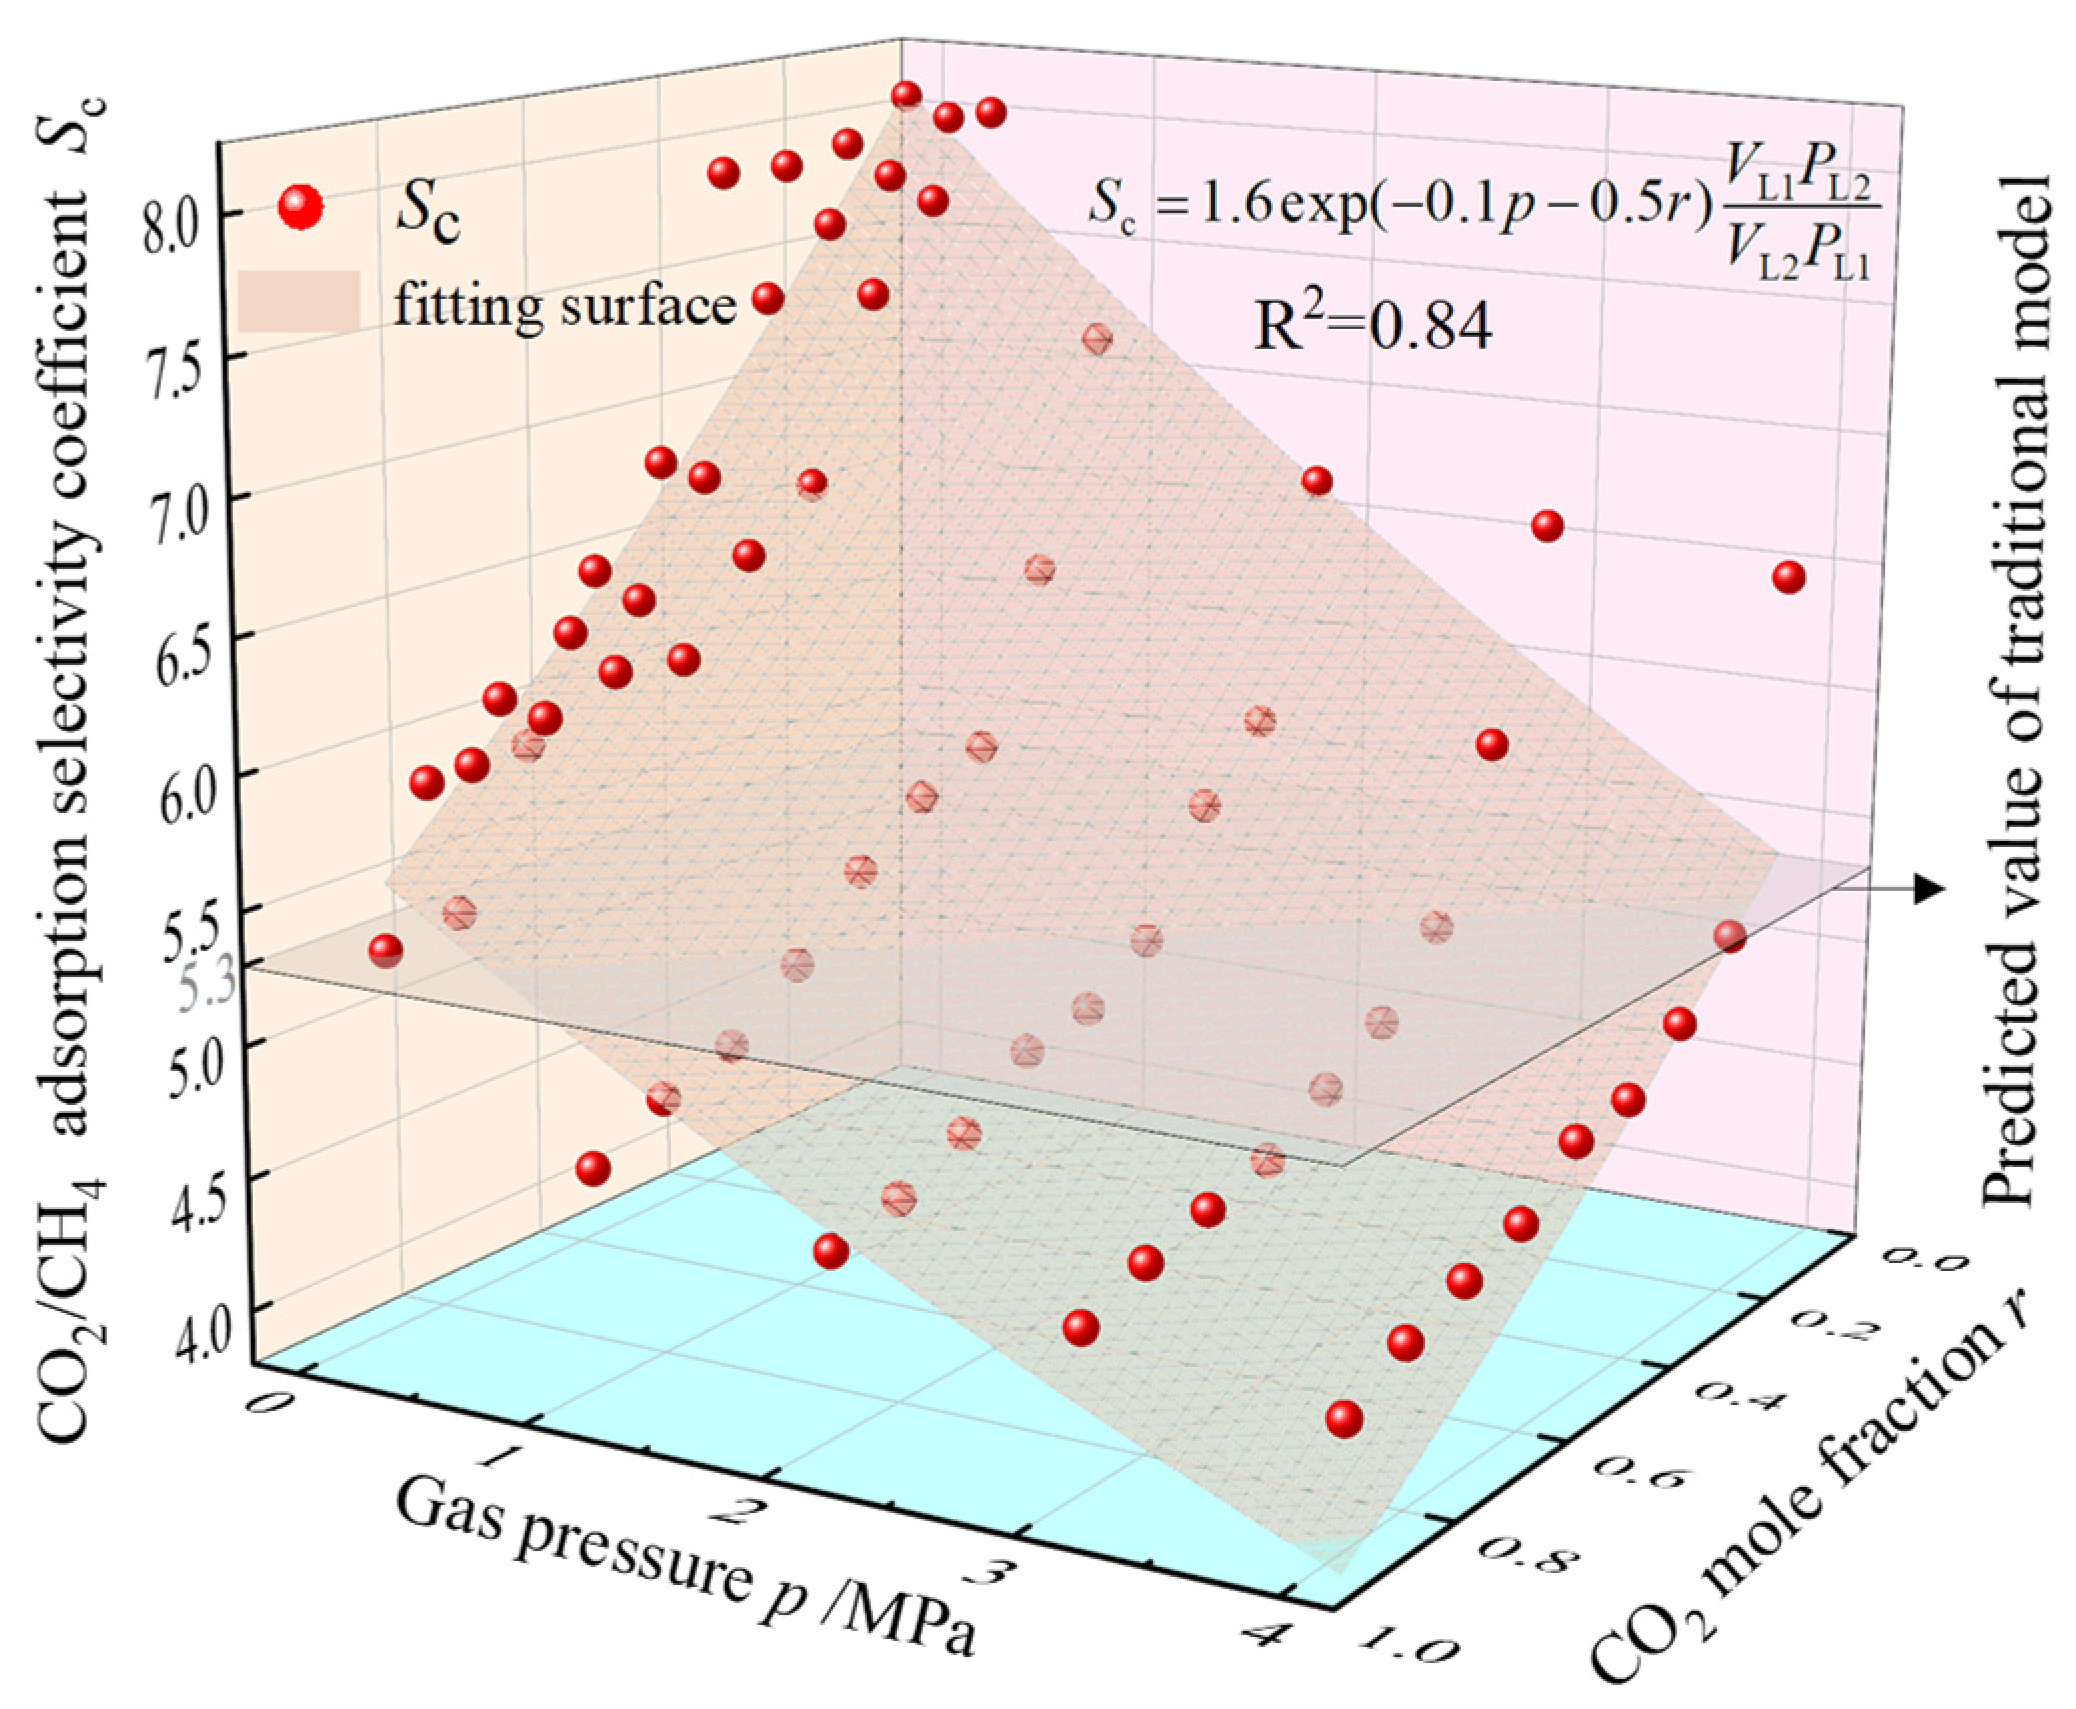
Figure 13 demonstrates the Sc values corresponding to different total pressures and CO2 molar fractions at 30 °C in the 2 nm pores from the previous simulation results. Based on the adsorption constants obtained, surface fitting of the data points using Equation (12) achieved a goodness-of-fit of 0.84, suggesting that the modified model can provide a more accurate prediction of adsorption selectivity coefficients for the competitive adsorption of CO2/CH4. The modified computational model for the CO2/CH4 adsorption selectivity coefficient considering pressure and CO2 molar fraction was obtained as Equation (13).

Figure 13.
Variation of 2 nm pore Sc with total gas pressure and CO2 molar fraction.
In homogeneous coal seams, Equation (13) can represent the calculation method of the CO2/CH4 adsorption selectivity coefficient in coal with pore diameters mostly concentrated at 2 nm at a coal seam temperature of 30 °C. It is known that the proposed model Equation (12) still has certain limitations. This is because in this paper, the correction parameters are mainly obtained through simulation to obtain Equation (13). In fact, when calculating with Equation (12), conducting a large number of experiments in advance to obtain empirical parameters in order to obtain the accurate values of the correction parameters α1, α2, and α3 is a more rigorous and accurate calculation method. However, the correctness of the improved model in the form of equations has been verified by the simulation results. The comparison of the advantages and disadvantages between the improved model and the traditional model can be seen in Table 9.
Table 9.
The comparison between the traditional E-L model and the improved model.
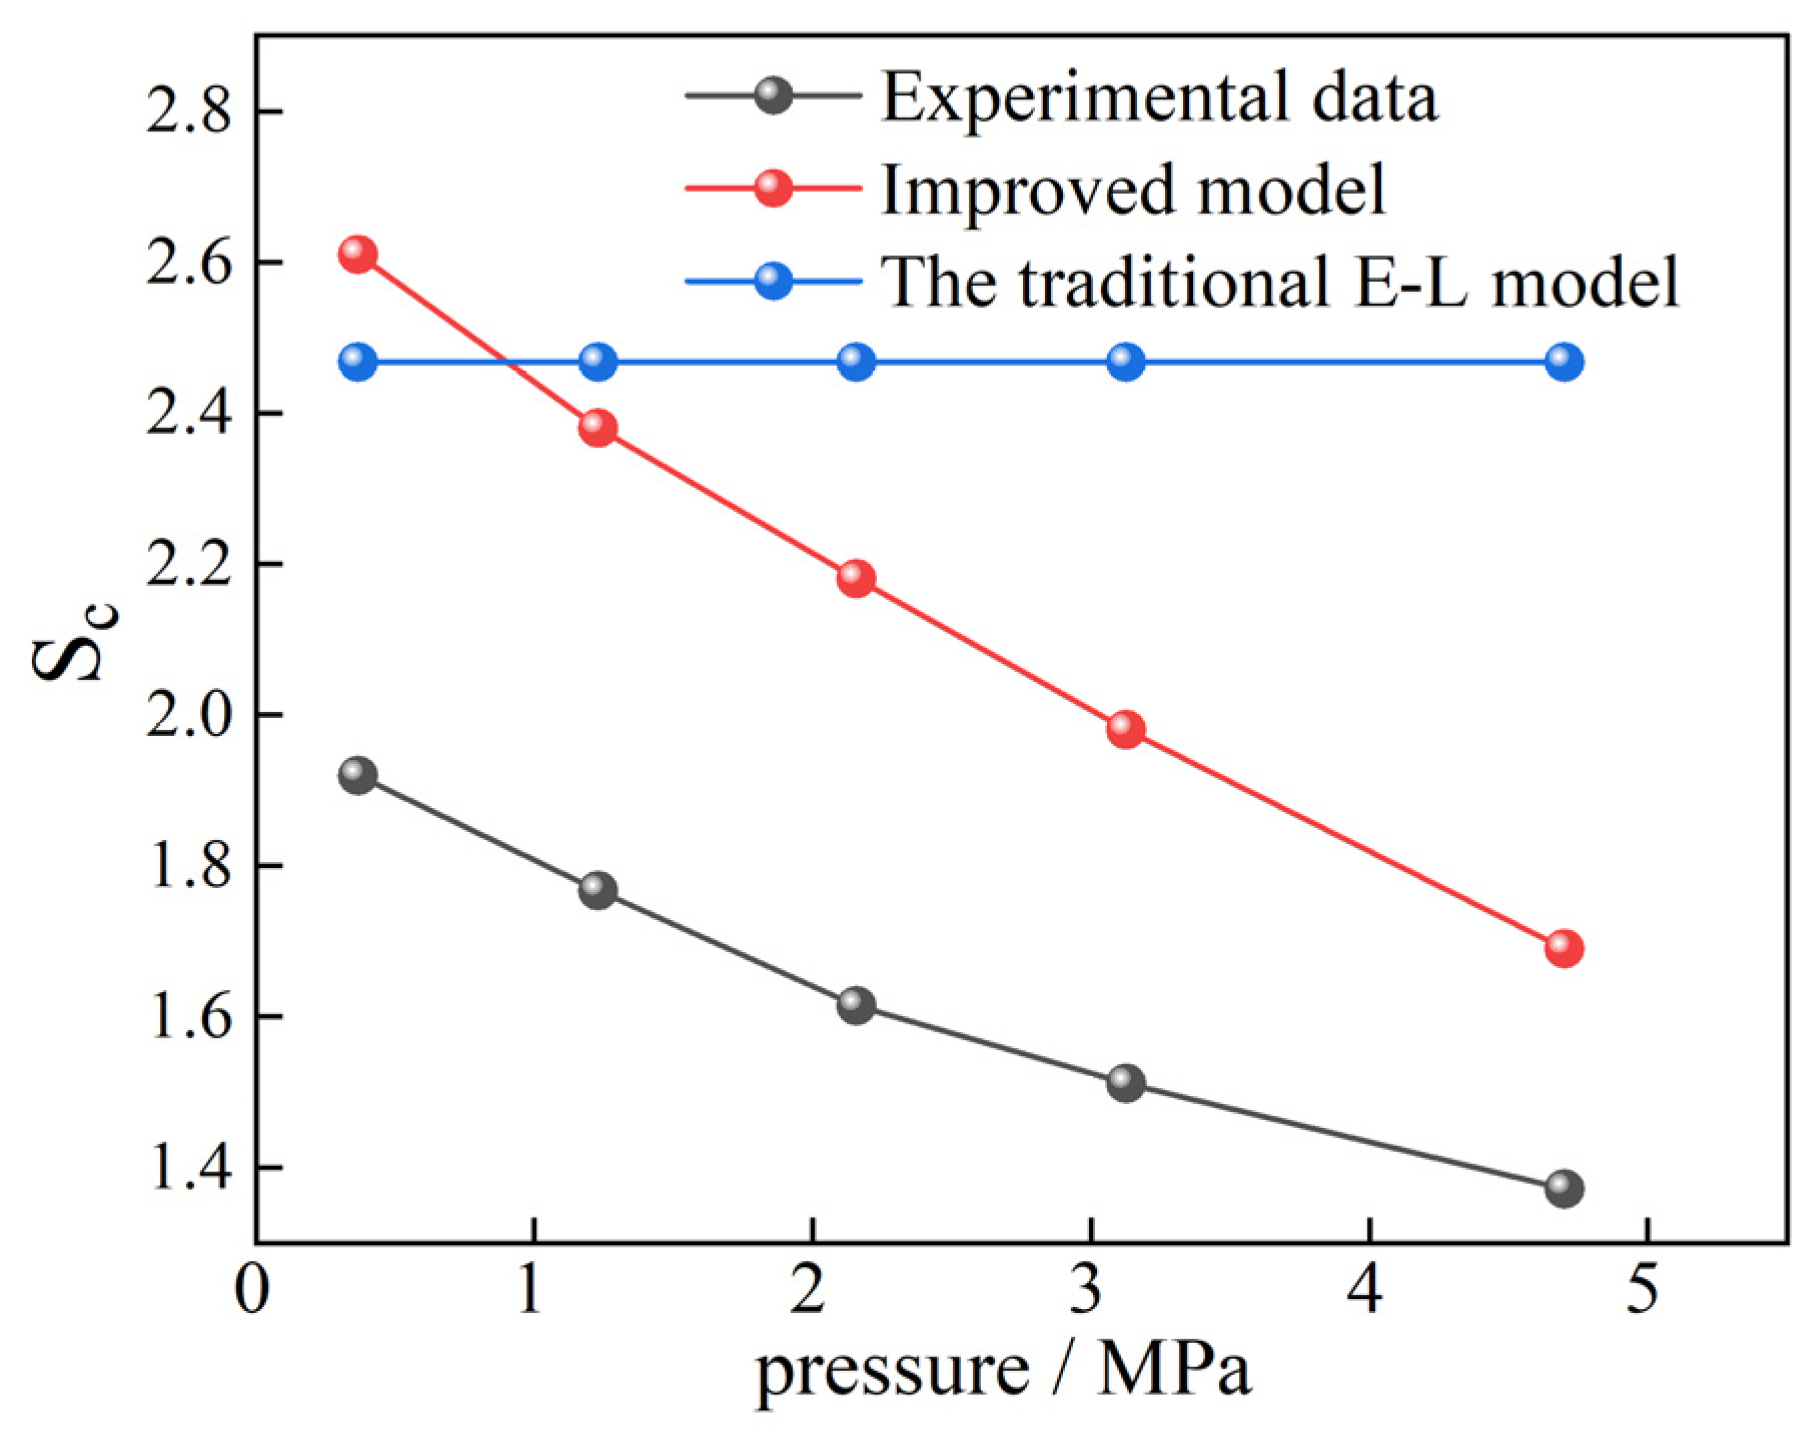
To verify the rationality of the improved model in practical applications, the results of single gas adsorption and competitive adsorption of CO2 and CH4 in shale obtained by Liao et al. [15] through experiments were used for testing. Based on the absolute isothermal adsorption amounts of CO2 and CH4 single gases adsorbed by marine shale of the Ordovician Wufeng Formation in the Sichuan Basin at 323.15 K temperature and different pressure points measured in the experiment, the adsorption constants of the two gases can be obtained by fitting the adsorption data using the Langmuir model, as shown in Table 10. The Sc of the 25%CH4 + 75%CO2 mixed gas under different pressures was calculated by Equation (13). The real experimental results, the calculated values of the traditional E-L model, and the calculated results of the improved model were compared, as shown in Figure 14. It can be seen that the improved model can very well display the variation of Sc with gas pressure. When the gas pressure is above 1 MPa, the predicted results are closer to the true results, but there are still errors. This is due to the errors in the values of the calculation parameters α1, α2, and α3. Obtaining the parameter values applicable to this shale sample will lead to more accurate results.
Table 10.
Adsorption constants of pure gases such as CO2 and CH4 in shale.

Figure 14.
Comparison of the results of Sc in shale obtained by three methods.
It can be seen from the verification results of real experiments that although the correction parameter values in Equation (13) were only obtained from the adsorption data in 2 nm pores at 30 °C, Equation (13) may have wider applicability in the Sc prediction of actual coal and rock masses, which awaits further testing.
In summary, the modified model incorporates the two key influencing factors of total gas pressure and CO2 molar fraction into the calculation of the adsorption selectivity coefficient, which supplements the defects of the traditional model that ignores the influence of pressure and gas composition on the adsorption selectivity in the actual working conditions, and can make the model more closely match the real mixed gas adsorption results.
5. Conclusions
In this paper, through the methods of molecular dynamics and massive canonical Monte Carlo simulation, the competitive adsorption behavior of CO2/CH4 in the pores of bituminous coal and the dynamic variation law of its adsorption selectivity coefficient with the characteristics of the coal and environmental conditions were systematically studied. Based on a large amount of adsorption data, the negative exponential influence mechanism of pore size, gas pressure, gas ratio, and temperature on the adsorption selectivity coefficient was quantified. Correction factors were set for the gas proportion and the pressure of the mixed gas. Based on the Sc calculation formula of the extended Langmuir model, a correction equation of the adsorption selectivity coefficient suitable for homogeneous coal seams was proposed, and a more accurate and reliable Sc calculation method was obtained. However, its applicability still needs further study. The core conclusions are as follows:
- (1)
- The adsorption isotherm of coal on CO2, CH4 single-component and mixed gases under different conditions were obtained by molecular simulation, and found that the main adsorption potential energy was −6.85 kcal/mol for CO2 and −3.95 kcal/mol for CH4, which explains the absolute dominance of CO2 in the competition, from the perspective of energy.
- (2)
- Based on the adsorption isotherm results from molecular simulations, the effects of four factors, namely, pore size, gas pressure, CO2 molar fraction, and temperature, on the CO2/CH4 adsorption selectivity coefficient were analyzed and found to have negative exponential relationships.
- (3)
- The influence weights of four factors on CO2/CH4 adsorption selectivity coefficient were investigated by multiple linear regression analysis as pore size > mixed gas pressure > CO2 molar fraction > temperature, which verified the superiority of using the high-ranking coal seam as a target layer for CO2 sequestration.
- (4)
- Aiming at the shortcomings of the traditional extended Langmuir (E-L) model, which ignores the dynamic changes of pressure and components, a correction equation is proposed to introduce an exponential correction term for the CO2 mole fraction and total gas pressure; after the verification of the simulation results and the experimental results of shale adsorption in the existing studies, the prediction error of the newly built model is lower than that of the traditional model.
- (5)
- The newly constructed model has achieved success in terms of variance, but the corrected parameters are derived from the simulation data of bituminous coal adsorption, and it assumes that the coal seam is homogeneous. Its applicability in other coal types (such as anthracite, lignite), heterogeneous coal seams, and broader temperature scenarios awaits further study.
Author Contributions
M.Y.: validation, project administration, review & editing; C.W.: validation, data analysis, writing; H.L.: resources, supervision; P.J.: review & editing; S.L.: project administration, investigation; H.J.: data curation, supervision. All authors have read and agreed to the published version of the manuscript.
Funding
This work was supported by the National Natural Science Foundation of China (52274228).
Data Availability Statement
The original contributions presented in this study are included in the article. Further inquiries can be directed to the corresponding author.
Conflicts of Interest
The authors declare that they have no known competing financial interests or personal relationships that could have appeared to influence the work reported in this paper.
References
- Massarweh, O.; Abushaikha, A.S. CO2 sequestration in subsurface geological formations: A review of trapping mechanisms and monitoring techniques. Earth-Sci. Rev. 2024, 253, 104793. [Google Scholar] [CrossRef]
- Song, X.; Wang, F.; Ma, D.; Gao, M.; Zhang, Y. Progress and prospect of carbon dioxide capture, utilization and storage in CNPC oilfields. Pet. Explor. Dev. 2023, 50, 229–244. [Google Scholar] [CrossRef]
- Mukherjee, M.; Misra, S. A review of experimental research on Enhanced Coal Bed Methane (ECBM) recovery via CO2 sequestration. Earth-Sci. Rev. 2018, 179, 392–410. [Google Scholar] [CrossRef]
- Liu, Z.; Lin, X.; Zhu, W.; Hu, Z.; Hao, C.; Su, W.; Bai, G. Effects of coal permeability rebound and recovery phenomenon on CO2 storage capacity under different coalbed temperature conditions during CO2-ECBM process. Energy 2023, 284, 129196. [Google Scholar] [CrossRef]
- Ottiger, S.; Pini, R.; Storti, G.; Mazzotti, M. Measuring and Modeling the Competitive Adsorption of CO2, CH4, and N2 on a Dry Coal. Langmuir 2008, 24, 9531–9540. [Google Scholar] [CrossRef]
- Kurniawan, Y.; Bhatia, S.K.; Rudolph, V. Simulation of binary mixture adsorption of methane and CO2 at supercritical conditions in carbons. AIChE J. 2006, 52, 957–967. [Google Scholar] [CrossRef]
- Zhang, S.; Zhang, X.; Wang, Z.; Liu, X.; Heng, S.; Li, Y.; Sun, Z. Molecular simulation of CH4 and CO2 adsorption behavior in coal physicochemical structure model and its control mechanism. Energy 2023, 285, 129474. [Google Scholar] [CrossRef]
- Long, H.; Lin, H.; Yan, M.; Chang, P.; Li, S.G.; Bai, Y. Molecular simulation of the competitive adsorption characteristics of CH4, CO2, N2, and multicomponent gases in coal. Powder Technol. 2021, 385, 348–356. [Google Scholar] [CrossRef]
- Jia, J.; Wang, D.; Li, B.; Wu, Y.; Zhao, D. Molecular simulation study on the effect of coal metamorphism on the competitive adsorption of CO2/CH4 in binary system. Fuel 2023, 335, 127046. [Google Scholar] [CrossRef]
- Huang, K.; Du, X.; Li, K.; Zhou, J.; Zhang, D.; Abbas, N.; Cheng, Y.; Wu, T.; Liu, G.; He, C. Competitive adsorption of CO2/CH4 on coal: Insights from thermodynamics. Alex. Eng. J. 2024, 97, 114–126. [Google Scholar] [CrossRef]
- Zhao, Y.L.; Feng, Y.H.; Zhang, X.X. Selective Adsorption and Selective Transport Diffusion of CO2-CH4 Binary Mixture in Coal Ultramicropores. Environ. Sci. Technol. 2016, 50, 9380–9389. [Google Scholar] [CrossRef]
- Zhang, H.; Diao, R.; Mostofi, M.; Evans, B. Molecular simulation of enhanced CH4 recovery and CO2 storage by CO2–N2 mixture injection in deformable organic micropores. J. Nat. Gas Sci. Eng. 2020, 84, 103658. [Google Scholar] [CrossRef]
- Clarkson, C.R.; Bustin, R.M. Binary gas adsorption/desorption isotherms: Effect of moisture and coal composition upon carbon dioxide selectivity over methane. Int. J. Coal Geol. 2000, 42, 241–271. [Google Scholar] [CrossRef]
- Dang, Y.; Zhao, L.; Lu, X.; Xu, J.; Sang, P.; Guo, S.; Zhu, H.; Guo, W. Molecular simulation of CO2/CH4 adsorption in brown coal: Effect of oxygen-, nitrogen-, and sulfur-containing functional groups. Appl. Surf. Sci. 2017, 423, 33–42. [Google Scholar] [CrossRef]
- Liao, Q.; Zhou, J.; Xian, X.; Yang, K.; Zhang, C.; Dong, Z.; Yin, H. Competition adsorption of CO2/CH4 in shale: Implications for CO2 sequestration with enhanced gas recovery. Fuel 2023, 339, 127400. [Google Scholar] [CrossRef]
- Xie, W.; Wang, M.; Chen, S.; Vandeginste, V.; Yu, Z.; Wang, H. Effects of gas components, reservoir property and pore structure of shale gas reservoir on the competitive adsorption behavior of CO2 and CH4. Energy 2022, 254, 124242. [Google Scholar] [CrossRef]
- Jia, J.; Xing, Y.; Li, B.; Jia, P.; Wu, Y.; Yang, Q.; Wang, D. Molecular simulations of multivariate competitive adsorption of CH4, CO2 and H2O in gas-fat coal. Colloids Surf. A Physicochem. Eng. Asp. 2024, 683, 132917. [Google Scholar] [CrossRef]
- Dutta, P.; Bhowmik, S.; Das, S. Methane and carbon dioxide sorption on a set of coals from India. Int. J. Coal Geol. 2011, 85, 289–299. [Google Scholar] [CrossRef]
- Wang, X.; Zhai, Z.; Jin, X.; Wu, S.; Li, J.; Sun, L.; Liu, X. Molecular simulation of CO2/CH4 competitive adsorption in organic matter pores in shale under certain geological conditions. Pet. Explor. Dev. 2016, 43, 841–848. [Google Scholar] [CrossRef]
- Singh, M.; Hakimabadi, S.G.; Van Geel, P.J.; Carey, G.R.; Pham, A.L. Modified competitive Langmuir model for prediction of multispecies PFAS competitive adsorption equilibria on colloidal activated carbon. Sep. Purif. Technol. 2024, 345, 127368. [Google Scholar] [CrossRef]
- Amrutha; Jeppu, G.; Girish, C.R.; Prabhu, B.; Mayer, K. Multi-component Adsorption Isotherms: Review and Modeling Studies. Environ. Process. 2023, 10, 38. [CrossRef]
- Wang, Z.; Li, Y.; Guo, P.; Meng, W. Analyzing the Adaption of Different Adsorption Models for Describing the Shale Gas Adsorption Law. Chem. Eng. Technol. 2016, 39, 1921–1932. [Google Scholar] [CrossRef]
- Acharya, A.; Jeppu, G.; Girish, C.R.; Prabhu, B.; Murty, V.R.; Martis, A.S.; Ramesh, S. Adsorption of arsenic and fluoride: Modeling of single and competitive adsorption systems. Heliyon 2024, 10, e31967. [Google Scholar] [CrossRef] [PubMed]
- Laskar, I.I.; Hashisho, Z. Insights into modeling adsorption equilibria of single and multicomponent systems of organic and water vapors. Sep. Purif. Technol. 2020, 241, 116681. [Google Scholar] [CrossRef]
- Busch, A.; Gensterblum, Y. CBM and CO2-ECBM related sorption processes in coal: A review. Int. J. Coal Geol. 2011, 87, 49–71. [Google Scholar] [CrossRef]
- Mathews, J.P.; Chaffee, A.L. The molecular representations of coal—A review. Fuel 2012, 96, 1–14. [Google Scholar] [CrossRef]
- Bai, Y.; Lin, H.; Li, S.; Yan, M.; Long, H. Molecular simulation of N2 and CO2 injection into a coal model containing adsorbed methane at different temperatures. Energy 2021, 219, 119686. [Google Scholar] [CrossRef]
- Xie, K. Physical Characteristics of Coal. In Structure and Reactivity of Coal: A Survey of Selected Chinese Coals; Xie, K., Ed.; Springer: Berlin/Heidelberg, Germany, 2015; pp. 29–65. [Google Scholar]
- Chen, J.; Gildin, E.; Kompantsev, G. Optimization of pressure management strategies for geological CO2 storage using surrogate model-based reinforcement learning. Int. J. Greenh. Gas Control 2024, 138, 104262. [Google Scholar] [CrossRef]
- Mohamadi-Baghmolaei, M.; Heagle, D.; Izadpanahi, A.; Zaremoayedi, F. Geological CO2 storage feasibility in Southwestern Ontario: Cost assessment and the role of pressure management. Fuel 2025, 396, 135255. [Google Scholar] [CrossRef]
- Rouquerol, J.; Avnir, D.; Fairbridge, C.W.; Everett, D.H.; Haynes, J.M.; Pernicone, N.; Ramsay, J.D.F.; Sing, K.S.W.; Unger, K.K. Recommendations for the characterization of porous solids (Technical Report). Pure Appl. Chem. 1994, 66, 1739–1758. [Google Scholar] [CrossRef]
- Al-Raeei, M. Morse oscillator equation of state: An integral equation theory based with virial expansion and compressibility terms. Heliyon 2022, 8, e09328. [Google Scholar] [CrossRef] [PubMed]
- Pitzer, K.S.; Lippmann, D.Z.; Curl, R.F., Jr.; Huggins, C.M.; Petersen, D.E. The Volumetric and Thermodynamic Properties of Fluids. II. Compressibility Factor, Vapor Pressure and Entropy of Vaporization1. J. Am. Chem. Soc. 1955, 77, 3433–3440. [Google Scholar] [CrossRef]
- Orbey, H.; Vera, J.H. Correlation for the third virial coefficient using T, P and ω as parameters. AIChE J. 1983, 29, 107–113. [Google Scholar] [CrossRef]
- Xiao, P.; Liu, X.; Zhao, B. Experimental study on gas adsorption characteristics of coals under different Protodyakonov’s coefficient. Energy Rep. 2022, 8, 10614–10623. [Google Scholar] [CrossRef]
- Pu, H.; Bian, Z.; Zhang, J.; Xu, J. A study of an abandoned mine geothermal resource reuse system. J. China Coal Soc. 2021, 46, 677–687. [Google Scholar] [CrossRef]

Disclaimer/Publisher’s Note: The statements, opinions and data contained in all publications are solely those of the individual author(s) and contributor(s) and not of MDPI and/or the editor(s). MDPI and/or the editor(s) disclaim responsibility for any injury to people or property resulting from any ideas, methods, instructions or products referred to in the content. |
© 2025 by the authors. Licensee MDPI, Basel, Switzerland. This article is an open access article distributed under the terms and conditions of the Creative Commons Attribution (CC BY) license (https://creativecommons.org/licenses/by/4.0/).