Abstract
To achieve low-carbon economic dispatch and collaborative optimization of carbon capture efficiency in power systems, this paper proposes a flexible carbon capture power plant and generalized energy storage collaborative operation model under a dynamic carbon quota mechanism. First, adjustable carbon capture devices are integrated into high-emission thermal power units to construct carbon–electricity coupled operation modules, enabling a dynamic reduction of carbon emission intensity and enhancing low-carbon performance. Second, a time-varying carbon quota allocation mechanism and a dynamic correction model for carbon emission factors are designed to improve the regulation capability of carbon capture units during peak demand periods. Furthermore, pumped storage systems and price-guided demand response are integrated to form a generalized energy storage system, establishing a “source–load–storage” coordinated peak-shaving framework that alleviates the regulation burden on carbon capture units. Finally, a multi-timescale optimization scheduling model is developed and solved using the GUROBI algorithm to ensure the economic efficiency and operational synergy of system resources. Simulation results demonstrate that, compared with the traditional static quota mode, the proposed dynamic carbon quota mechanism reduces wind curtailment cost by 9.6%, the loss of load cost by 48.8%, and carbon emission cost by 15%. Moreover, the inclusion of generalized energy storage—including pumped storage and demand response—further decreases coal consumption cost by 9% and carbon emission cost by 17%, validating the effectiveness of the proposed approach in achieving both economic and environmental benefits.
1. Introduction
With the increasing urgency of climate change and the global energy crisis, many countries have set targets for energy transition and the low-carbon operation of modern electric energy systems. In this context, nations are actively reducing greenhouse gas emissions through international agreements, while China has specifically proposed the dual goals of carbon peaking and carbon neutrality to promote sustainable low-carbon development. At present, the application of carbon capture equipment in power systems has been extensively studied [1,2,3]. Carbon capture equipment has been explored as a flexible resource to enhance system rotational reserve, participating in electricity-to-gas conversion, hydrogen production, coal-fired hydrogen blending, and electric heating systems, with its impact on system economics being verified [4,5]. However, existing studies have not thoroughly examined the rationality of coordination between carbon capture equipment and other subsystems.
In recent studies, the role of carbon capture systems (CCSs) has evolved beyond emission mitigation to that of an active grid participant. Their operational flexibility allows CCS-equipped power units to contribute to grid services, including rotational reserve provision, load shifting, and hydrogen blending operations [6,7]. However, a gap remains in understanding the systemic interactions between CCS and other energy subsystems. To address this, enhanced CCS models have been proposed by incorporating intermediate storage to modulate energy consumption timing and improve dispatch efficiency [8]. These models are particularly valuable in systems with high renewable penetration, where the coordinated operation of carbon capture power plants (CCPPs) significantly reduces wind curtailment and enhances renewable accommodation [9,10].
Moreover, integrating carbon trading policies into power system optimization has gained attention. For instance, ref. [11] develops an integrated energy system (IES) dispatch framework incorporating stepped carbon price signals, solved using the CPLEX optimizer. Similarly, ref. [12] explores a multi-scale dispatch method for combined cooling, heating, and power (CCHP) systems under a tiered reward–penalty carbon pricing mechanism. These approaches emphasize how dynamic carbon prices directly shape energy scheduling strategies, impacting system cost and emission intensity. Another study [13] introduces a gas price fluctuation model based on particle swarm optimization and Bayesian inference, suggesting that dispatch strategies prioritize electricity over natural gas in cost–carbon trade-offs under uncertainty.
Blockchain technologies have also enabled novel mechanisms for market integration. For example, ref. [14] proposes a cross-chain architecture for coordinating distributed PV trading and carbon credit exchange using the Ethereum platform, while ref. [15] analyzes the bidding behavior of virtual power plants (VPPs) in joint electricity–carbon markets. A ladder-type carbon emission pricing scheme embedded into IES optimization enables improved economic and renewable energy performance [16]. Recent work emphasizes the role of prosumers and energy sharing in achieving net-zero goals. A real-time scheduling strategy leveraging shared energy storage models—namely, asset sales and lease contracts—was proposed in [17]. These models enable flexibility under stochastic load and supply, and improve cost-effectiveness by minimizing real-time deviations. Furthermore, studies like [18] explore bilateral coordination among power producers to create economically viable dispatch solutions and internalize emission externalities.
Carbon trading costs constitute a significant portion of the total economic cost of the system. The accurate estimation of carbon emissions from thermal power units is essential for optimizing energy consumption and reducing overall emissions, contributing to improved economic and environmental performance. This study introduces an innovative tri-layer framework that combines various game mechanisms to explore the interactions between power-integrated energy systems and coupled energy markets. The findings demonstrate that this approach effectively reduces system carbon emissions and supports the integration of renewable energy sources [19]. This paper examines the pivotal role of dynamic carbon emission factors in source–network–storage power system planning and introduces an innovative inverse dynamic carbon emission factor model that effectively captures the nonlinear relationship between load rates and emissions. Comparative analysis using the HRP-38 test case demonstrates that the inverse model enhances computational efficiency, reduces solution times, and more accurately represents the emission characteristics of coal-fired units under varying operational conditions. In parallel, refined carbon cost estimation methods have emerged. Ref. [20] introduces an inverse dynamic carbon emission factor model that reflects the non-linear relationship between coal-fired unit load levels and emission intensity. Compared to static models, this inverse formulation enhances scheduling precision and reduces computational overhead. Building on this, ref. [21] proposes a carbon rights trading mechanism based on time-of-use tariffs, allowing dispatch strategies to better align carbon consumption with renewable availability. A dynamic carbon cost model incorporating reward and penalty terms has also been proposed [22] to enable fine-grained emission control across multi-energy carriers. Nonetheless, these works often adopt daily or annual granularity, overlooking the operational relevance of intra-day quota dynamics [23].
In multi-energy systems, scheduling decisions span across diverse temporal scales due to varying dynamics in load, generation, and market signals. Long-term carbon quota allocation interacts with short-term operational constraints, necessitating a unified modeling approach that captures these multi-scale interactions. To this end, multi-stage optimization frameworks have been proposed, where day-ahead decisions guide real-time dispatch while responding to updated forecasts and system imbalances [24]. Capturing this temporal coupling ensures that emission reduction strategies are operationally feasible and economically sound. For large-scale nonlinear optimization problems arising from such formulations, commercial solvers like GUROBI offer high computational efficiency and flexibility in handling mixed-integer linear programming (MILP) models. Compared with CPLEX or IPOPT, GUROBI demonstrates superior convergence properties in energy dispatch problems with renewable uncertainty, discrete startup/shutdown variables, and carbon trading constraints [25]. Its advanced presolve techniques and parallelization capabilities are particularly advantageous when solving hourly dispatch models over extended time horizons.
In view of this, research on integrating pumped storage and virtual energy storage as a load-side power regulation method in the context of carbon capture for power system scheduling remains limited. Additionally, there is a lack of studies examining the variations in storage tank capacity within carbon capture systems under generalized energy storage regulation. Furthermore, existing literature predominantly assumes fixed values for carbon emission factors and carbon quotas, which limits the ability to capture the impact of varying thermal power outputs on system economics and low-carbon performance. Building upon previous research, this study introduces the concept of generalized energy storage and proposes a joint operation model for carbon capture and generalized energy storage based on a dynamic carbon quota mechanism. The proposed model aims to minimize the comprehensive operating cost of the system, and its economic benefits are analyzed under varying pumped storage and storage tank capacities.
The key contributions of this study are summarized as follows:
- (1)
- A dynamic carbon quota mechanism is proposed, featuring a time-varying carbon quota allocation strategy and a correction model for carbon emission factors. This mechanism enables the adaptive adjustment of unit outputs under a fixed total carbon cap, significantly improving the accuracy of carbon emission tracking and enhancing the flexibility of low-carbon dispatch compared with traditional static quota models.
- (2)
- To optimize system flexibility, this study integrates pumped storage and price-guided demand response into a generalized energy storage framework. This approach effectively reduces wind power curtailment and load loss while increasing carbon trading revenues.
- (3)
- A multi-timescale optimization scheduling model is constructed to jointly coordinate the operation of carbon capture-integrated thermal units, renewable energy sources, and flexible demand resources. The model, solved via the GUROBI solver, ensures a dynamic balance between emission reduction capability and economic efficiency, providing a scalable and practical pathway toward low-carbon power system development.
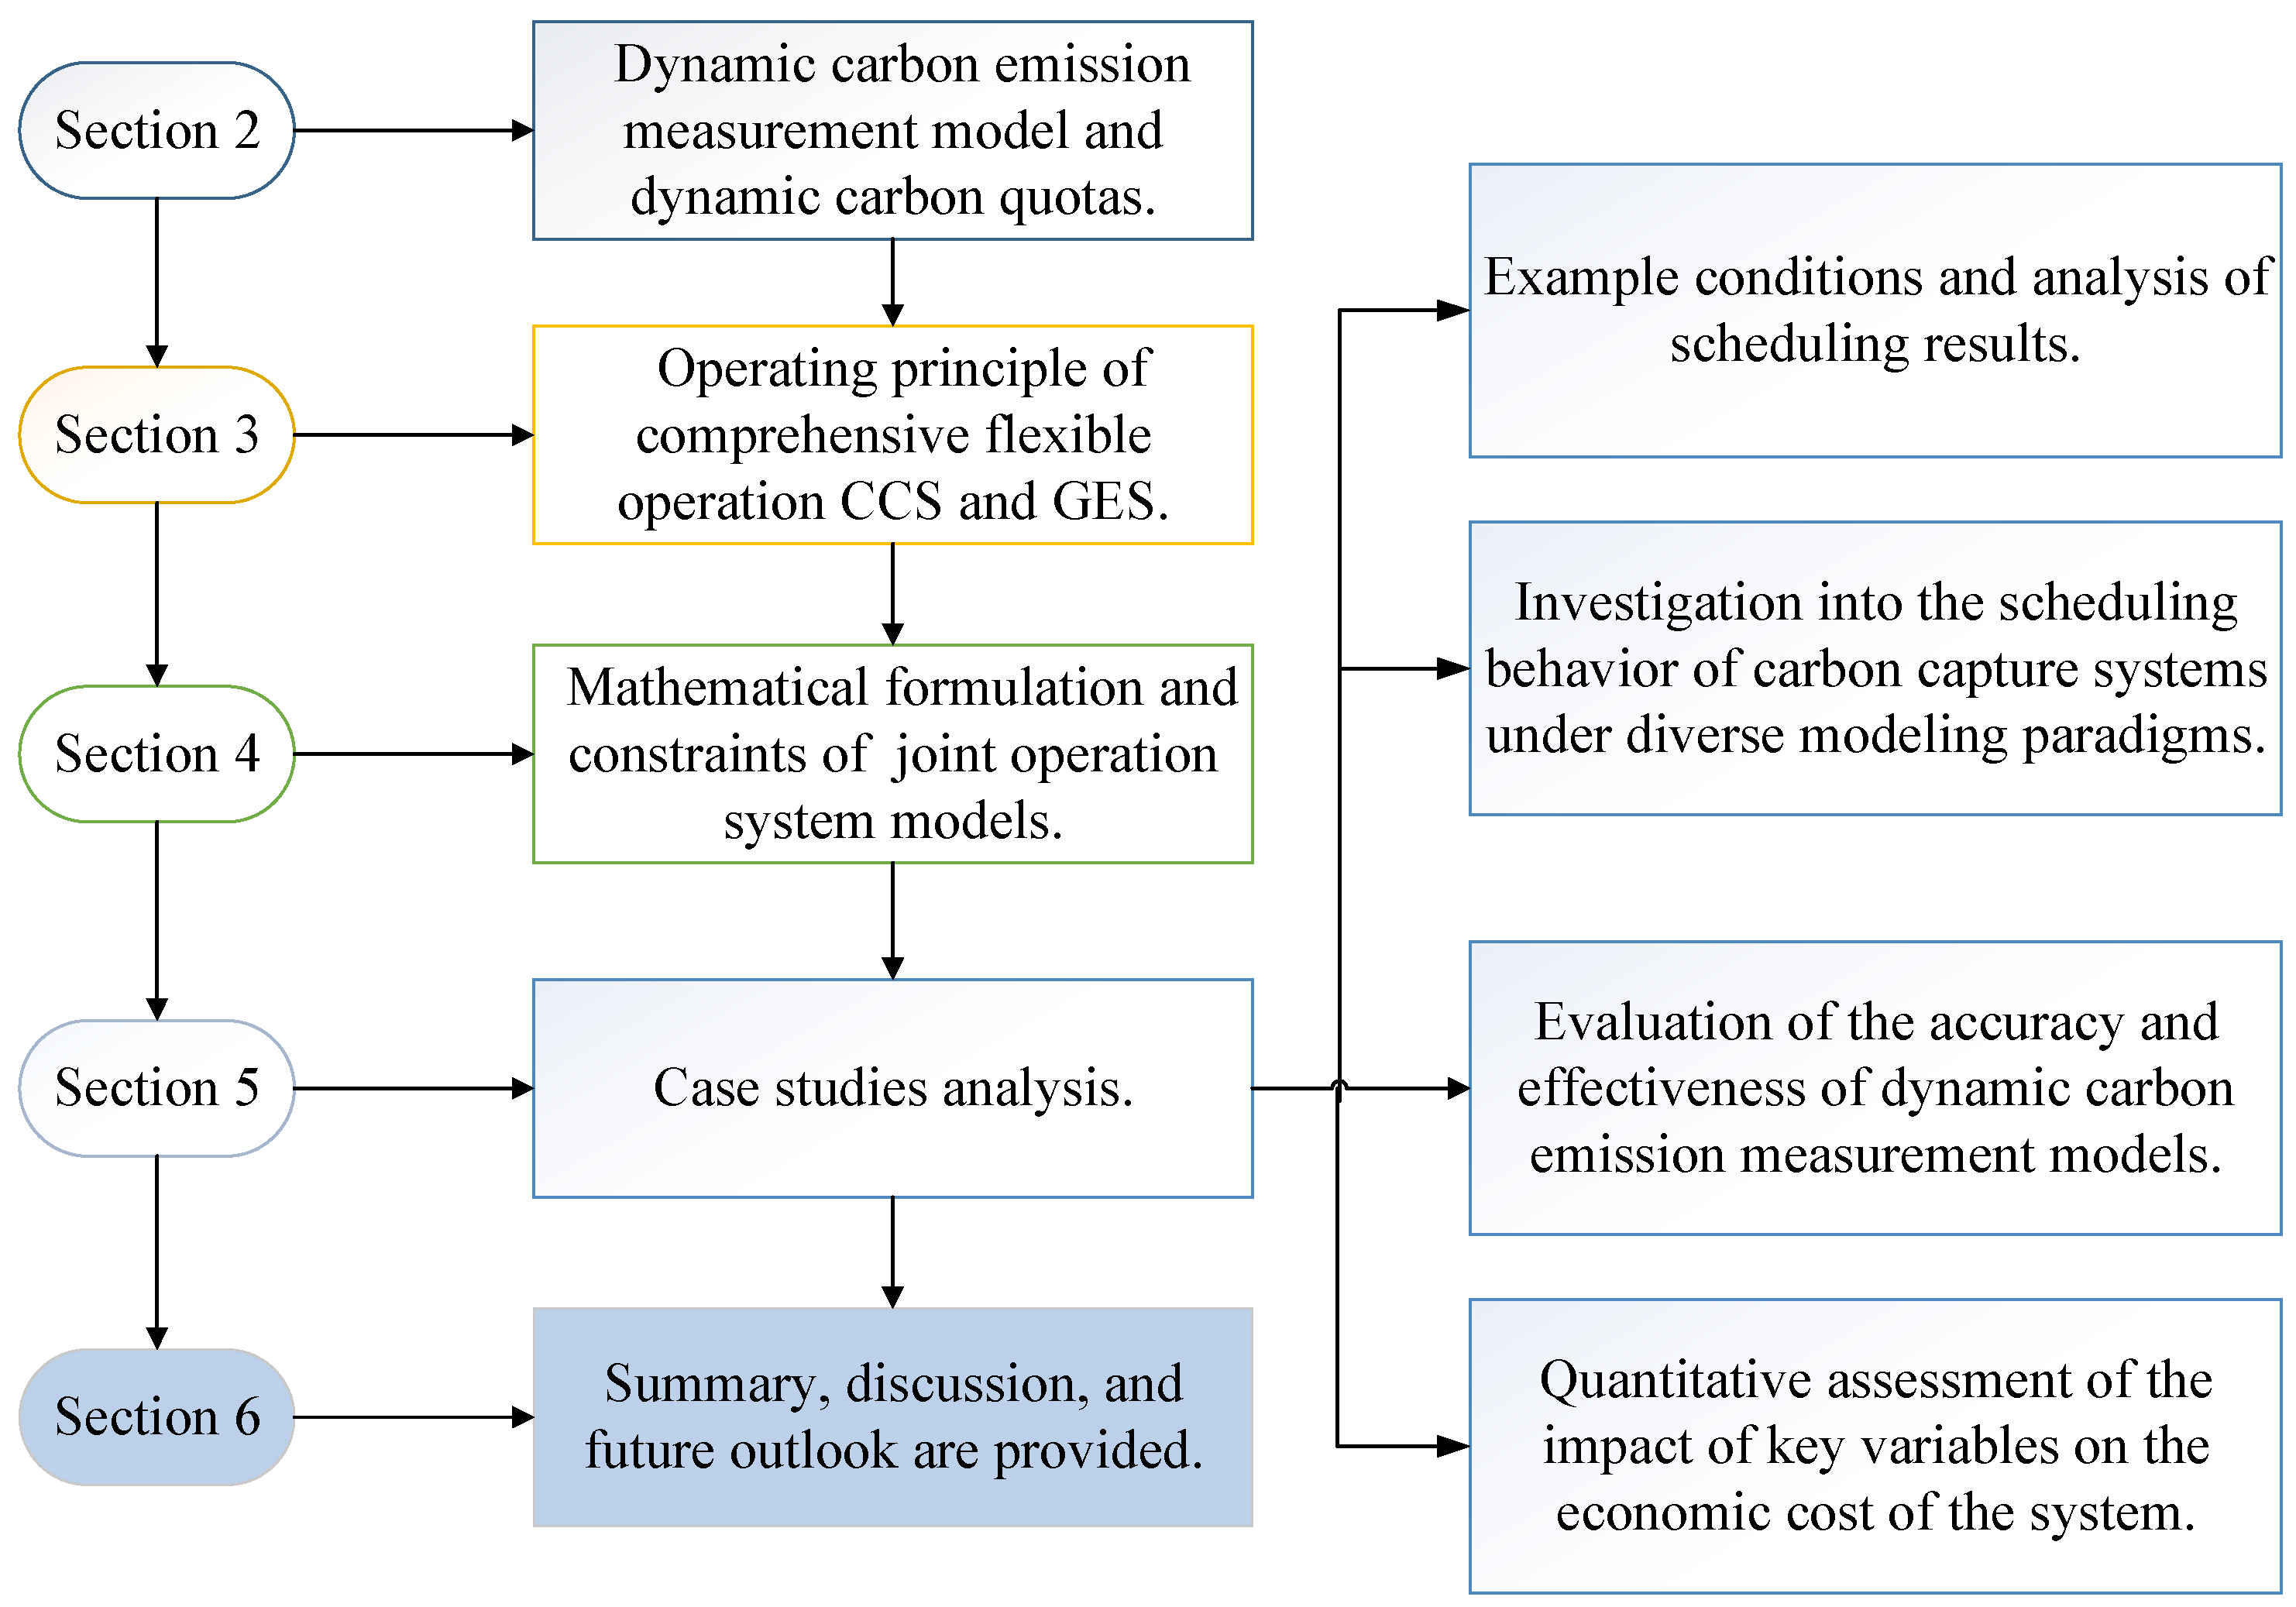
The structure of this paper is outlined as follows, with the overall framework depicted in Figure 1. Section 2 introduces the dynamic carbon emission measurement model along with the concept of dynamic carbon quotas. Section 3 describes the operating principles of comprehensive flexible coordination between carbon capture systems (CCS) and generalized energy storage (GES). Section 4 formulates the joint operation system model and its associated constraints. Section 5 presents case studies, encompassing example operating scenarios and corresponding scheduling results. It further examines the scheduling behavior of CCS under various modeling paradigms, evaluates the accuracy and effectiveness of dynamic carbon emission models, and assesses the impact of key variables on system economic cost. Section 6 concludes the paper by summarizing the main findings and providing directions for future research.
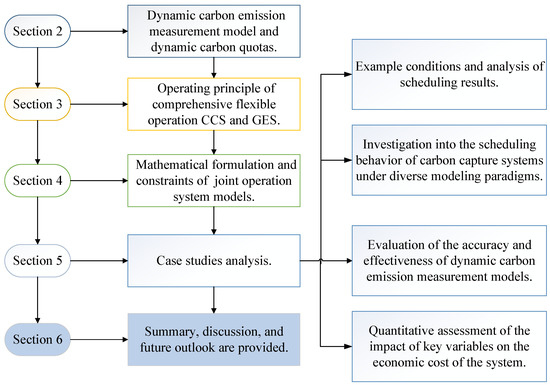
Figure 1.
Article structure chart.
2. Principle of Dynamic Carbon Model
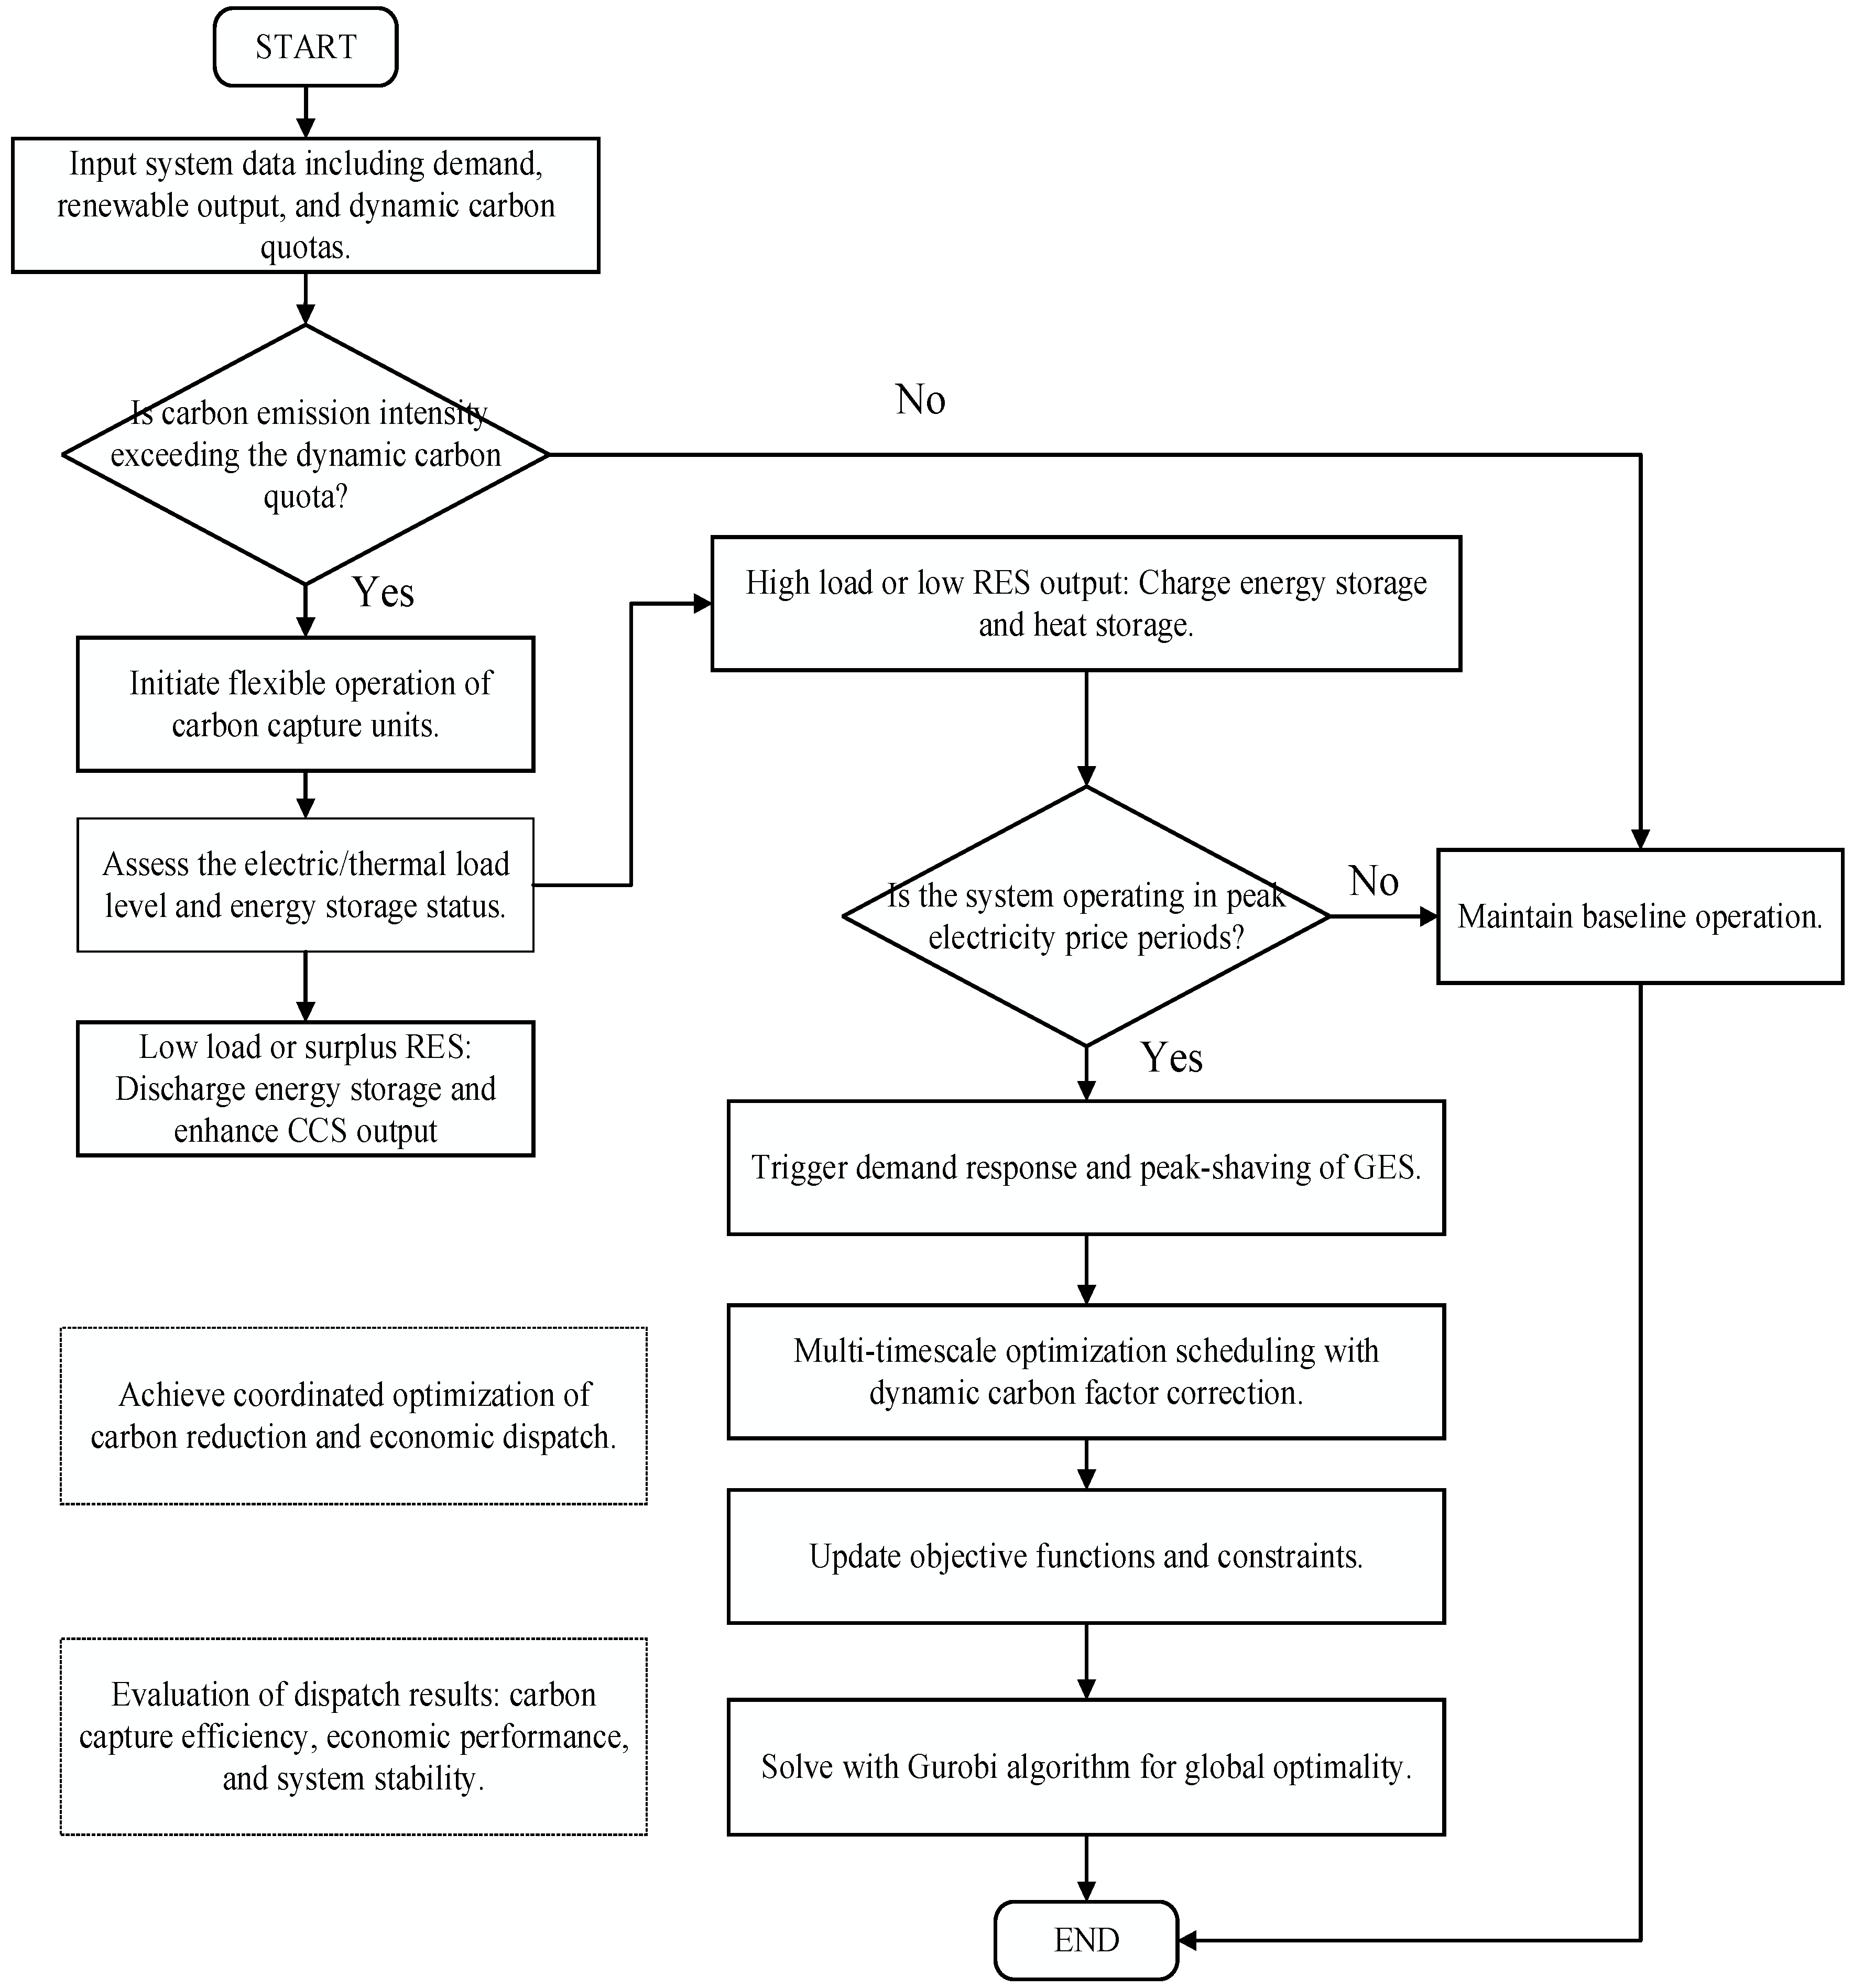
Figure 2 displays the scheduling system structure of the integrated operation of flexible carbon capture power plants and generalized energy storage under dynamic carbon constraints. The workflow begins with real-time system data input and evaluates whether the carbon emission intensity exceeds the dynamic carbon quota. Based on load conditions and electricity pricing, the system coordinates the flexible operation of carbon capture units, energy storage dispatch, and generalized energy storage (GES) for heat storage and demand-side response. A multi-timescale optimization framework corrects the carbon factor dynamically and updates dispatch objectives and constraints. The Gurobi solver is employed to achieve global optimization, ensuring both carbon efficiency and economic performance.
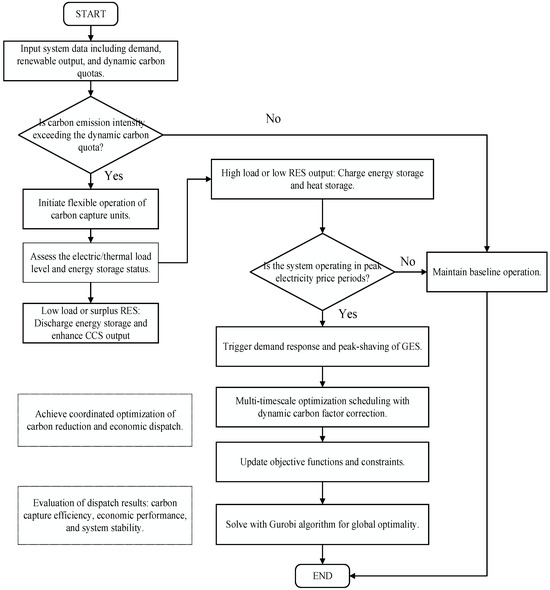
Figure 2.
Workflow of carbon-constrained dispatch optimization with flexible CCS and multi-timescale scheduling.
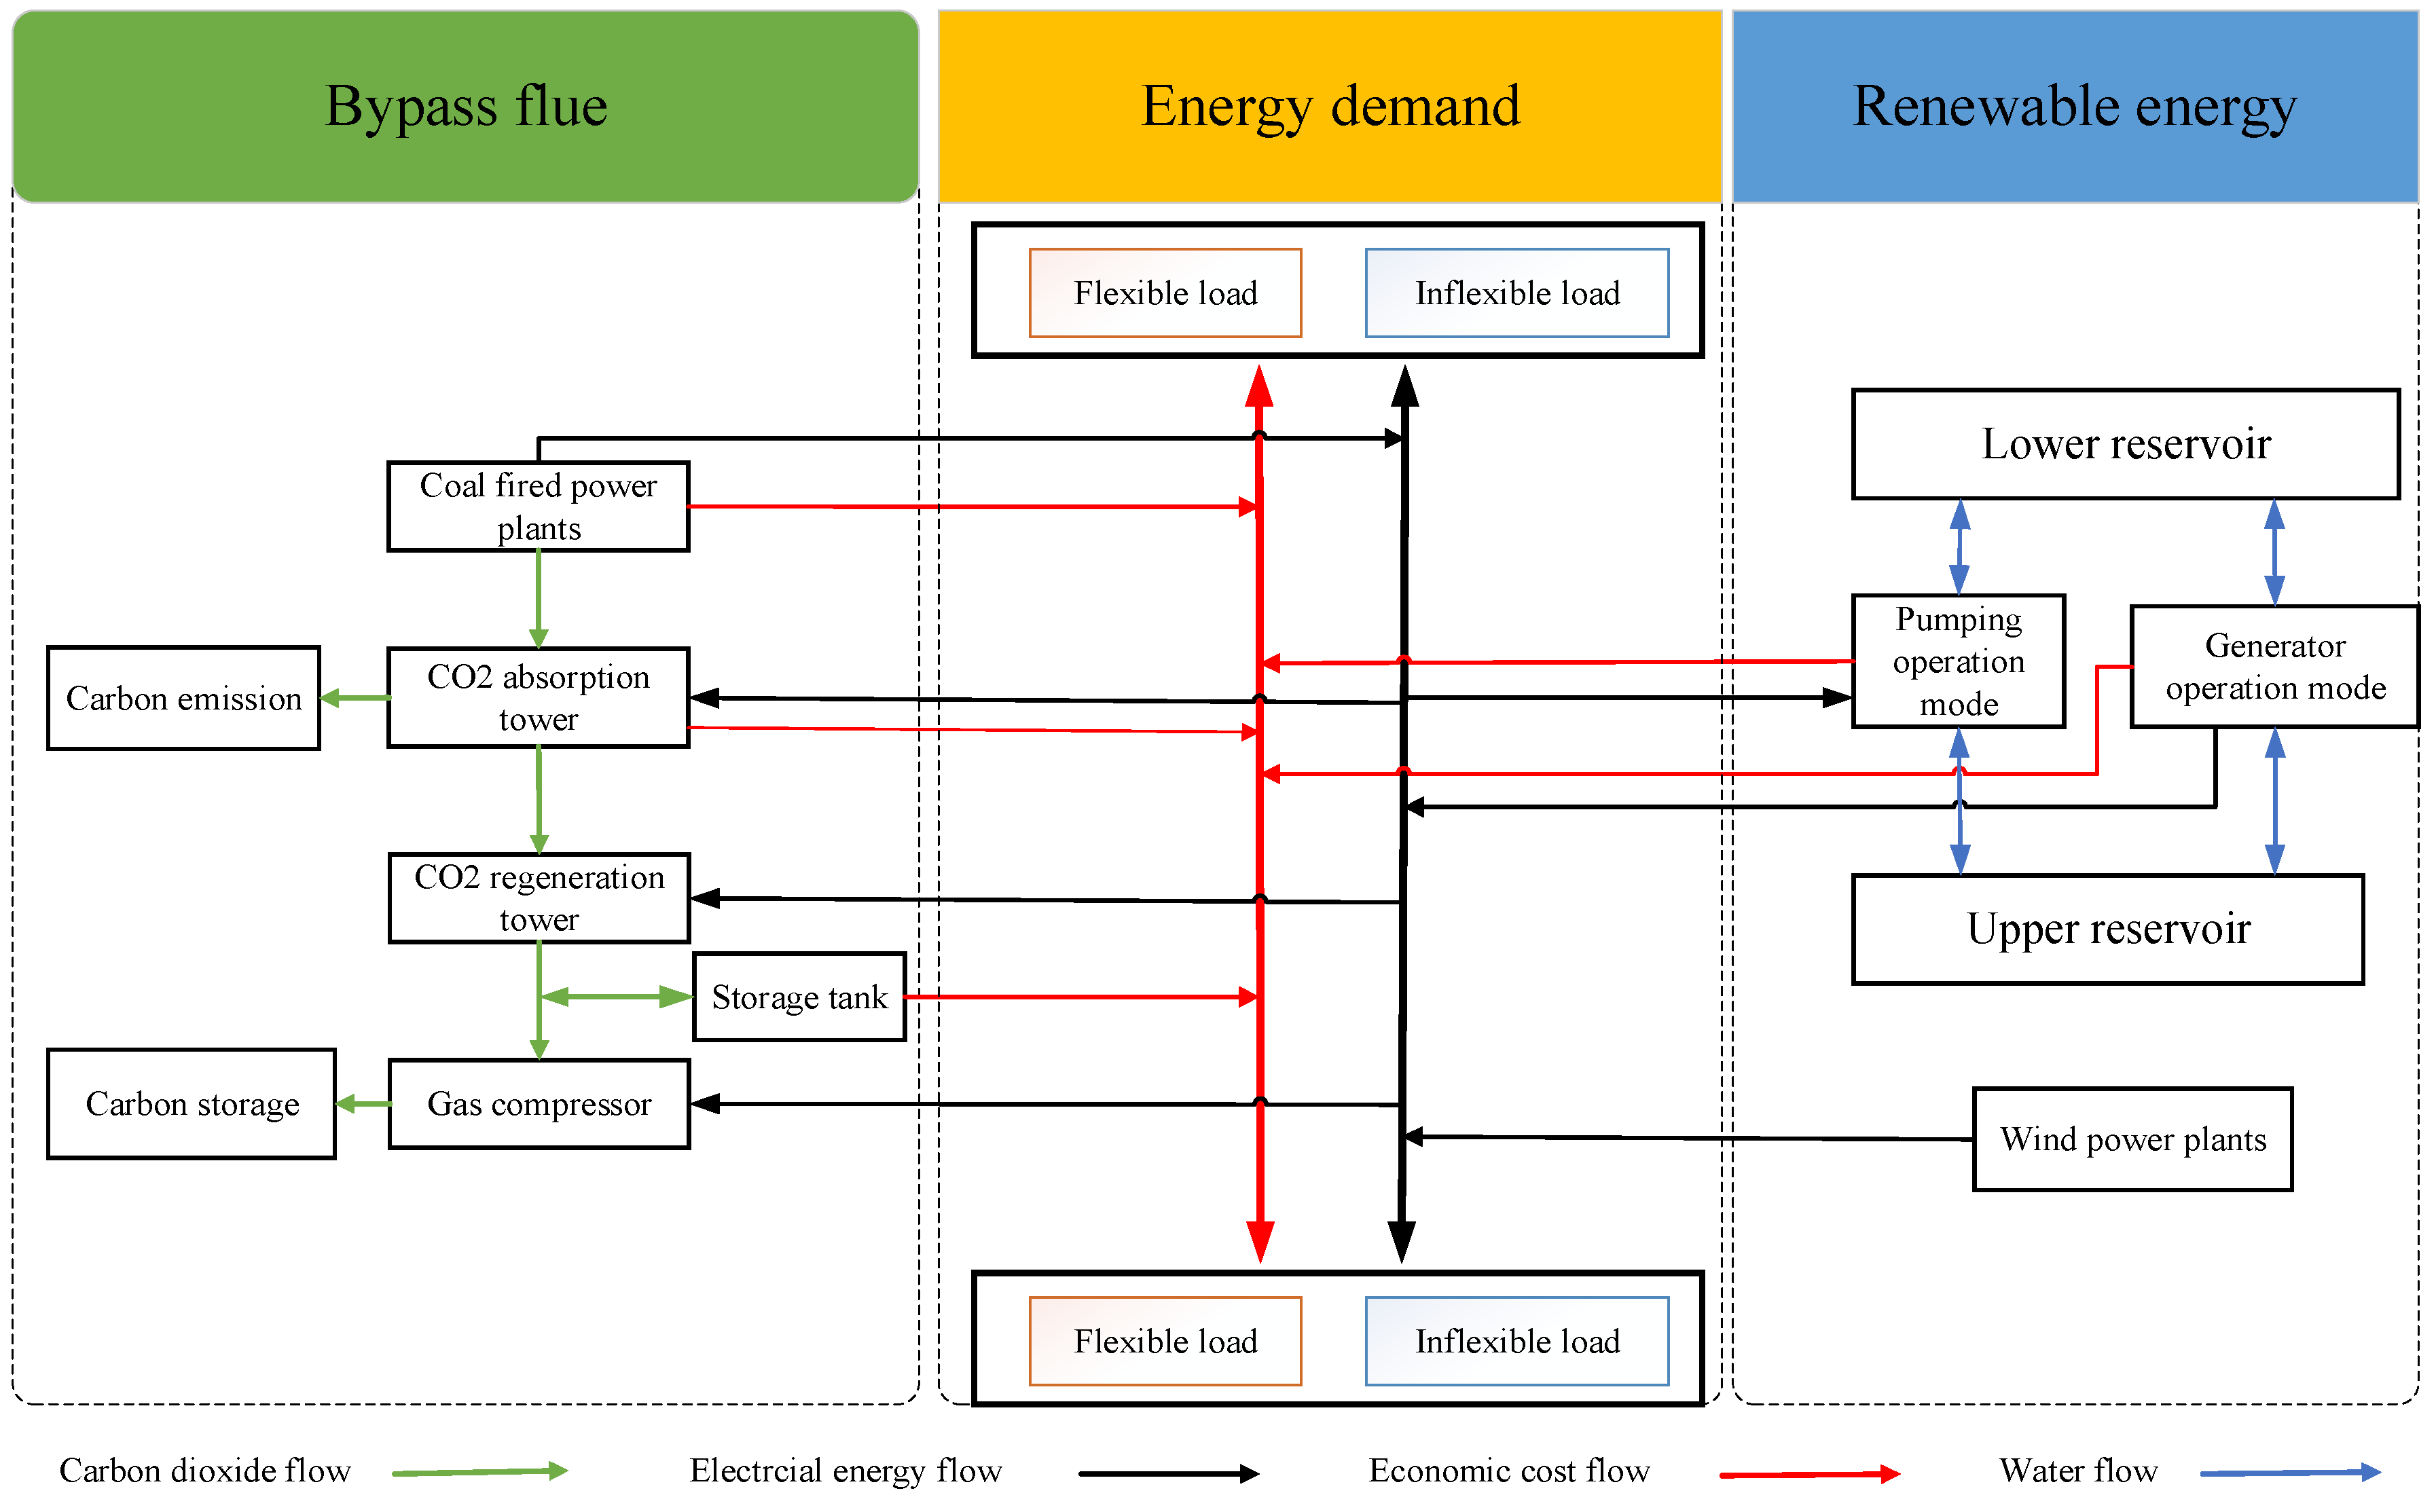
The scheduling system structure of the integrated flexible operation carbon capture power plant generalized energy storage joint operation is shown in Figure 3. The flexible scheduling of power resources can be achieved through the conversion of operating conditions and electricity pricing mechanisms through pumped storage.
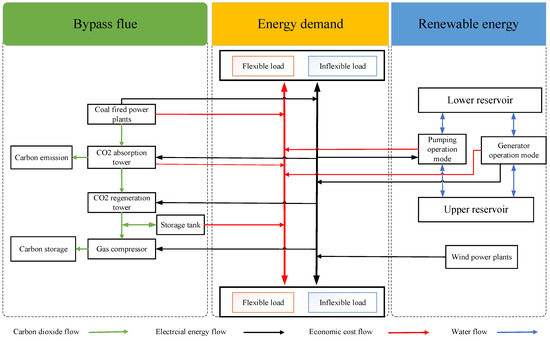
Figure 3.
Framework for integrated energy systems with carbon capture and pumped storage.
2.1. Dynamic Carbon Emission Measurement Model
With the gradual increase in the proportion of new energy, the peak shaving range of thermal power units has increased. When calculating the carbon emissions of thermal power units, a fixed carbon emission factor is often used, and the carbon emissions of thermal power units show a linear relationship with the load rate. In practical situations, as the load rate increases, the carbon emission factor of thermal power units decreases [26]. Compared to calculating carbon emissions with a fixed carbon emission factor, using a dynamic carbon emission measurement model can simulate the real-time dynamic changes in carbon emission factors, which is beneficial for accurate measurement of carbon emissions. The model is as follows
where —carbon emissions of thermal power unit n during time period t, t; —output of thermal power unit n during time period t, MW; —basic value of carbon emission factor; —the length of the output range of thermal power units, MW; —the correction amount of the unit’s carbon emission factor. decreases as the unit output increases. This trend reflects the efficiency improvements of the unit under higher load conditions [17]; and and —the maximum and minimum power values of thermal power unit n, MW.
2.2. Dynamic Carbon Quotas
Calculate the carbon emission quota coefficient based on the daily total carbon emission quota of the units.
where —unit carbon emission quota coefficient, t/MWh; —daily average unit total carbon quota, t; —the number of hours in a day; N—the number of thermal power units; and —considering the power of thermal power units before dynamic carbon quotas, MW.
In conventional scheduling plans, the unit carbon quota coefficient is a fixed value. In high-proportion new energy systems, the large peak–valley differences in net load indeed pose challenges for accurately assessing carbon emissions. Using a fixed carbon quota coefficient in such scenarios can lead to an underestimation of the carbon efficiency of thermal power units operating at higher outputs. This miscalculation would result in reduced high-output operation and lower carbon capture utilization, ultimately increasing the overall low-carbon costs [10]. If the proportion of carbon quotas is appropriately increased to reduce the impact of low-carbon measures, it will decrease the system’s failure rate and carbon emission costs. During periods of high wind power proportion and system wind curtailment, using fixed carbon quotas will limit the peak shaving capacity of thermal power units and carbon capture units. If carbon quotas are appropriately reduced to increase low-carbon emission reduction costs, it will help improve the energy consumption and capture efficiency of carbon capture, and correspondingly reduce the system wind curtailment rate.
To reduce the system’s abandoned air volume and load loss rate, a dynamic carbon emission quota coefficient for the unit is proposed based on the hourly load peak valley difference and wind power proportion correction, while ensuring that the total daily carbon quota remains unchanged.
where —preliminary correction value of carbon quota, t/MWh; —wind power at time t, MW; —maximum wind power, MW; —minimum wind power, MW; and and —carbon quota correction factor.
where —modified dynamic carbon quota coefficient, t/MWh; and —the correction amount of carbon quotas, t/MWh; —peak–valley difference of net load at time t, MW; and and —maximum and minimum peak–valley difference, MW.
To ensure that the modified carbon quota coefficient maintains the same total carbon quota for the day, the following equation is satisfied.
where —considering the power of thermal power units after dynamic carbon quotas, MW.
3. Principle of Carbon Capture Generalized Energy Storage System
3.1. Principle of Comprehensive Flexible Operation Carbon Capture System
Carbon capture and storage (CCS) is a low-carbon technology aimed at reducing carbon dioxide emissions in the atmosphere to mitigate climate change. Carbon capture technology can be divided into three types based on combustion methods: post-combustion capture, pre-combustion capture, and oxygen-enriched combustion capture [27]. Among them, post-combustion capture technology is more mature and widely used in thermal power units, so this article adopts this carbon capture technology.
Traditional carbon capture power plants have poor decoupling ability between electricity and carbon due to the lack of solution storage or other buffering mechanisms, which limits their ability to perform energy consumption time shifting. The comprehensive flexible operation carbon capture power plant introduces innovative strategies to decouple electricity generation from carbon emissions. There are two key mechanisms during peak electricity demand periods. (1) The plant can pause energy-intensive exhaust gas treatment while still absorbing CO2 by utilizing stored capture solutions. (2) By redirecting a portion of the flue gas through a bypass system, the plant can control the amount of exhaust gas sent to the carbon capture unit. The maximum and minimum net power of the carbon capture and ignition unit are as follows:
where and —the maximum and minimum net power of the carbon capture and ignition unit, MW; and —the maximum and minimum power values of the carbon capture unit, MW; —fixed energy consumption of the carbon capture unit, MW; —maximum capture energy consumption of the carbon capture unit, MW.
Under the maximum net output condition, the comprehensive flexible operation carbon capture power plant can only store carbon dioxide without treating it. Under the minimum net output condition, the comprehensive flexible operation carbon capture power plant can process the maximum amount of carbon dioxide, and the fixed energy consumption is provided by the carbon capture power plant. However, at present, the comprehensive flexible operation carbon capture power plant has certain limitations in peak shaving and valley filling capacity due to high-capture energy consumption, the limited storage capacity of liquid tanks, low energy consumption during peak load periods, and the low capture of carbon dioxide. This hinders the economic and low-carbon operation of the system.
3.2. Operating Principle of GES
Conventional energy storage includes practical energy storage technologies such as battery storage and pumped storage. Generalized energy storage refers to all scheduling measures or equipment that can achieve bidirectional energy exchange and storage. In the field of power systems, in addition to conventional energy storage, it also includes virtual energy storage composed of controllable loads such as electricity price demand response, electric vehicles, data centers, and air conditioning [28].
Among them, electricity price-based demand response, as a flexible and controllable resource, has great regulatory potential. By setting different electricity prices at different times and using electricity pricing mechanisms to guide users to change their electricity consumption status, it promotes the consumption of wind power in the system and low-carbon emission reduction.
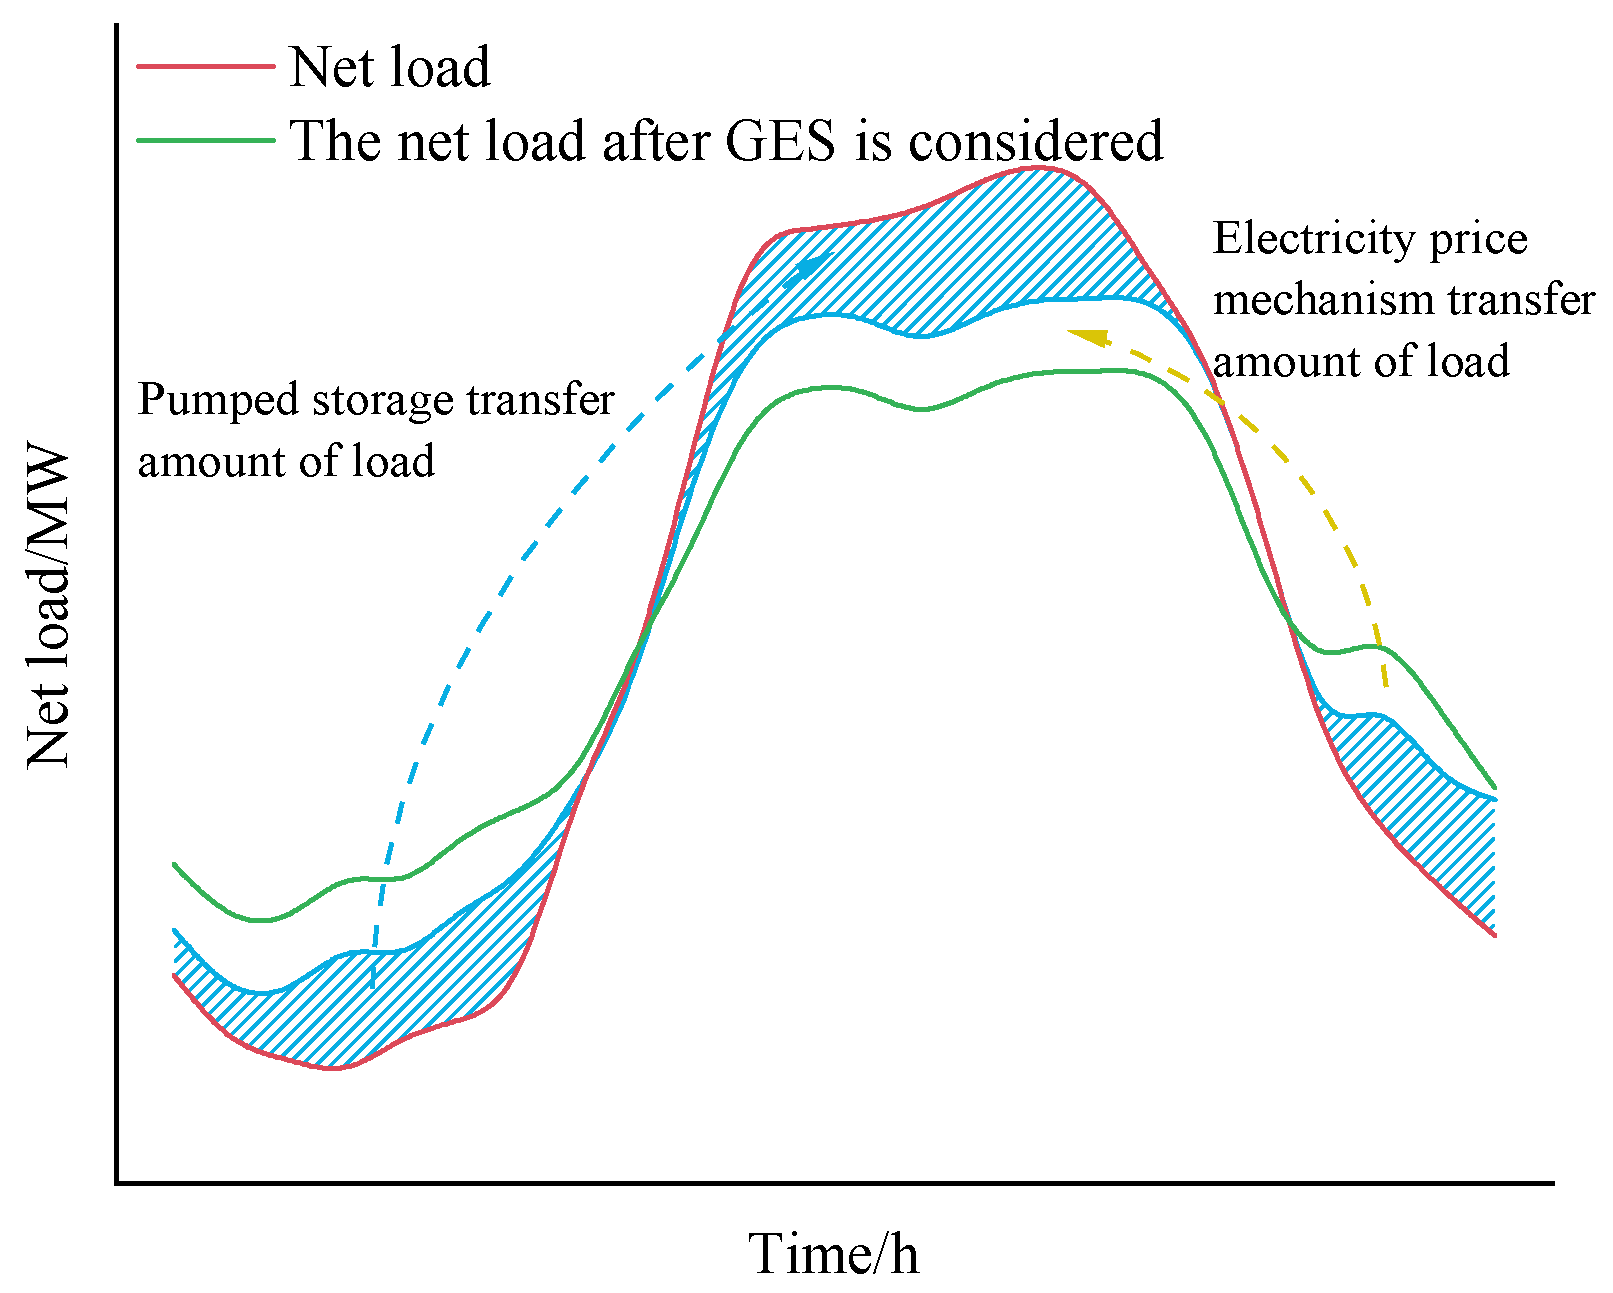
From Figure 4, it can be seen that during peak load periods, thermal power units have reached their output limit, and the system’s load loss rate has increased. Through the electricity pricing mechanism to guide user loads, peak load is reduced and transferred to valley time, and electricity is supplied by non-carbon emitting wind power during valley time.

Figure 4.
Schematic diagram of joint peak shared of actual energy storage and virtual energy storage.
After introducing pumped storage units, during peak load periods, pumped storage units release water to reduce carbon emissions by decreasing the output of thermal power units. During the valley season, pumped storage can extract water and absorb excess wind power output. The combination of the two forms GES makes the system both flexible and economical. It can be seen that GES can alleviate peak load pressure, absorb valley wind power, and reduce system carbon emissions by increasing carbon capture levels.
4. Modeling of Joint Operation System
This section develops a joint operation model combining carbon capture units and generalized energy storage (GES), aiming to support low-carbon and economic scheduling under dynamic carbon constraints [24,26].
4.1. Objective Function
- (1)
- Operating costs of thermal power units
- (2)
- Operating cost of pumped storage
- (3)
- Carbon trading costs
- (4)
- Abandoned wind and the loss of load costs
- (5)
- Carbon capture equipment solution loss cost
4.2. Constraints
- (1)
- System power balance constraint
- (2)
- Operational constraints of thermal power units
The operational constraints include unit output constraints, ramp constraints, and start–stop constraints.
where and —the maximum and minimum operating power of the nth thermal power unit, MW; and —the uphill and downhill climbing rates of thermal power unit n, MW; —Boolean variable for the start–stop state of the thermal power unit; and —the continuous operation or shut-down time of thermal power from the starting time to t − 1 time, h; and and —the minimum shut-down and start-up time for unit n, h.
- (3)
- Constraints on pumped storage operation
The operational constraints of pumped storage units include output constraints and storage capacity constraints [25].
where —the upper reservoir capacity of the reservoir at time t, m3; and —pumping efficiency and power generation efficiency, m3/MWh; and —the pumping and generating power of the j-th unit, MW; , , , and —the upper and lower limits of the pumping and generating power of the j-th pumped storage unit, MW; and —the maximum and minimum storage capacity of the upper reservoir, m3; T—scheduling period, h; and and —the storage capacity of the upper reservoir at the beginning and end of the scheduling cycle, m3.
- (4)
- Operational constraints of carbon capture system
The smoke diversion ratio constraint is as in
where and —maximum and minimum limits for smoke diversion ratio.
Carbon capture energy consumption constraint is as in
where —carbon capture power at time t, MW; and —the maximum and minimum power of carbon capture, MW.
Solution storage constraints are as in
where —the molar mass of alcohol amine solution, g/mol; —alcohol amine solution concentration; —the density of alcohol amine solution, g/mL; —the volume of a solution after absorbing an equal amount of carbon dioxide, m3; —the molar mass of carbon dioxide, g/mol; —analysis efficiency; and —the mass of carbon dioxide absorbed by the solution, t.
Where —the storage capacity of the rich liquid tank at time t, m3; and —the inflow and outflow of the rich liquid tank at time t, m3.
where and —maximum and minimum storage capacity of the rich liquid tank, m3; —liquid volume of the rich liquid tank at time t, m3; —the initial volume of the rich liquid tank, m3; —the volume of the rich liquid tank at time T, m3; and F and P—rich liquid tank and lean liquid tank.
where —the proportion of carbon dioxide (CO2) that requires power consumption for compression and storage in carbon capture and storage; —unit carbon capture energy consumption, MWh/t.
- (5)
- Price-based demand response (PDR) constraints
The relationship before and after electricity regulation is as in
where —price demand elasticity coefficient; and —the change in electricity price before and after the implementation of the electricity price adjustment mechanism, CNY/MWh; and —the amount of electricity consumed before the implementation of the electricity pricing mechanism and the amount of change in electricity consumption after the adjustment mechanism, MW.
where —elasticity coefficient matrix; F, G, and P—electricity prices peak, valley, and normal periods.
The load response model is as in
where , , and —before implementing PDR, the electricity consumption during peak, valley, and normal periods, MW; , , and —the peak, valley, and normal electricity consumption after implementing PDR, MW; , , and —the change in electricity prices during peak, valley, and normal periods after the implementation of PDR, CNY/MWh; and —fixed electricity price before implementing PDR, CNY/MWh.
5. Case Studies Analysis
5.1. Example Conditions
Taking the carbon capture generalized energy storage system constructed in Figure 1 as the research object, four thermal power units are selected with parameters shown in Table 1. Carbon capture equipment was installed on units G1 and G2. The equipment parameters and other system parameters are shown in Table 2, the elasticity matrix parameters are shown in Table 3, and the pumped storage unit parameters are shown in Table 4.

Table 1.
Thermal power unit parameters.
Table 2.
System parameters.
Table 3.
Elastic coefficient matrix parameters.
Table 4.
Pumped storage unit parameters.
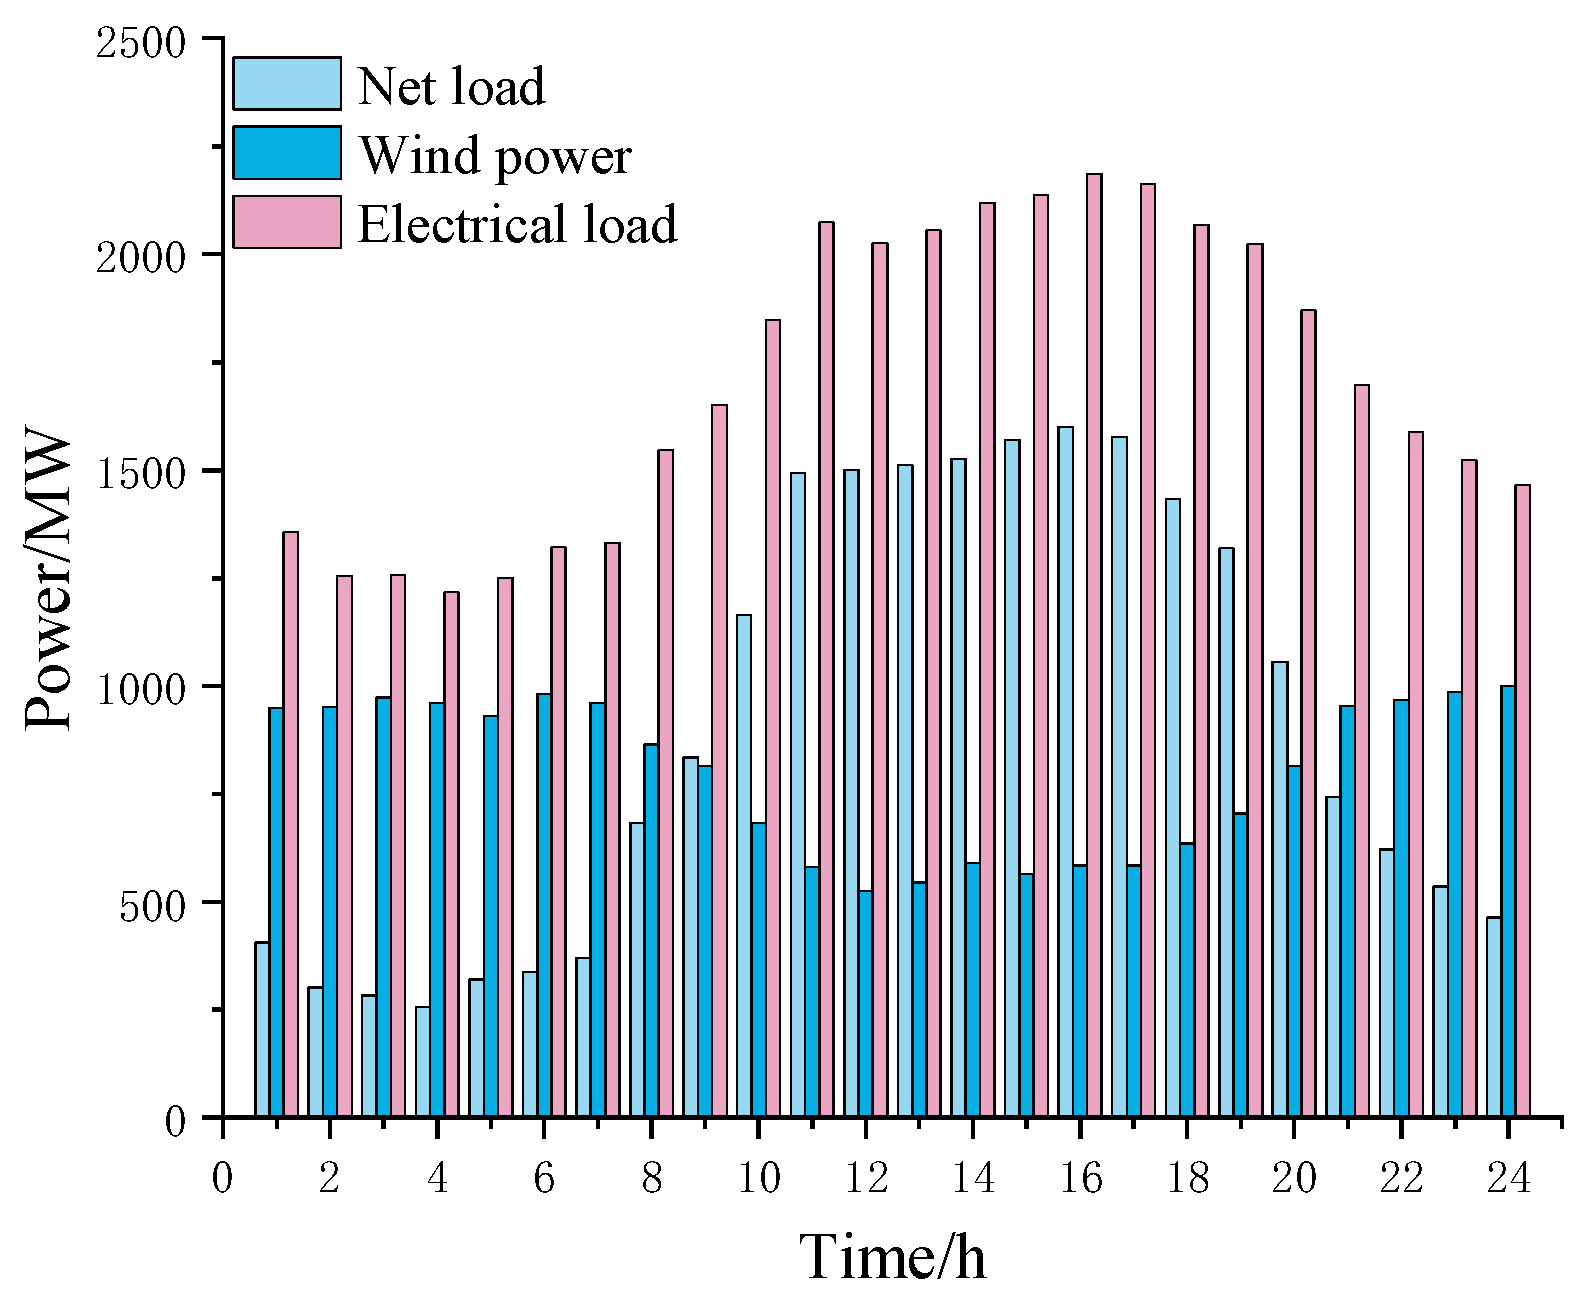
Wind power and electricity load data were obtained for a certain location in China, and a day with a large peak valley difference in net load was used as an example. The wind power and load power are shown in Figure 5 by using Matlab 2018b software with the Gurobi solver.
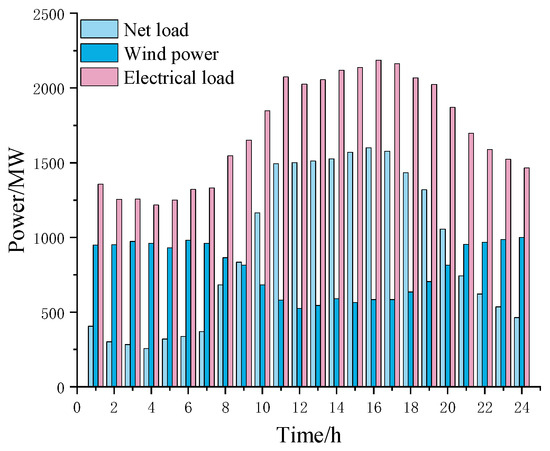
Figure 5.
Wind forecast power and load forecast power.
In order to verify the effectiveness of the scheduling strategy proposed in this article, the following three examples were set up.
Example 1 only considers flexible operation carbon capture systems.
Example 2 considers a flexible operational carbon capture system based on a dynamic carbon quota model.
Example 3 considers a flexible operational carbon capture generalized energy storage system based on a dynamic carbon quota model.
5.2. Analysis of Scheduling Results
The dispatch load curve consists of 24 time periods, with a maximum net load of 1577 MW and a maximum peak valley difference of 1265 MW. The maximum peak valley difference for wind power is 474 MW.
Economic Analysis
The economic costs of each example are shown in Table 5.
Table 5.
Economic cost of each example (price unit: CNY).
Compared with Example 1, the loss of load cost in Example 2 decreases by 48.8%, the wind power curtailment cost decreases by 9.6%, and the carbon emission cost decreases by 15%. This is because during periods when wind power accounts for a large proportion of the system, the carbon quota value of the unit calculated by the dynamic carbon quota method decreases, and the impact of carbon emissions on the system economy increases. Thermal power units reduce carbon emissions by reducing output, while the energy consumption of carbon capture increases, reducing the amount of abandoned air. During periods of high net load and low wind power, increasing the carbon quota of the units reduces the impact of carbon emissions on economy performance, lowers the system’s low-carbon requirements, increases the output of thermal power units, reduces the energy consumption of carbon capture, and reduces system costs.
Compared to Example 2, the cost of wind power curtailment has been reduced by 93%, and the cost of load loss has been reduced to zero in Example 3. This is due to the addition of generalized energy storage, which adjusts the system load through pumped storage and electricity-based demand response, reducing coal consumption costs by 9% and carbon emission costs by 17%. This is because during peak load periods, generalized energy storage assists thermal power units in supplying power to the system, resulting in a reduction in overall carbon emissions. This demonstrates that the model in Example 3 can improve the energy consumption and capture efficiency of carbon capture while ensuring economic efficiency.
From Figure 6, it can be seen that pumped storage and demand response both have the ability of bidirectional regulation, which reduces the peak valley difference of the net load of the system. Among them, pumped storage has a more pronounced regulating effect due to its larger capacity.
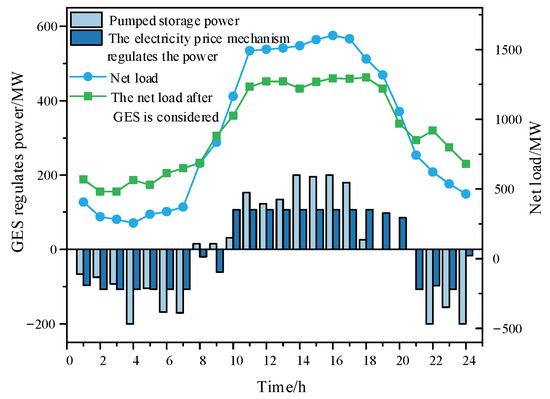
Figure 6.
Generalized energy storage regulation effect.
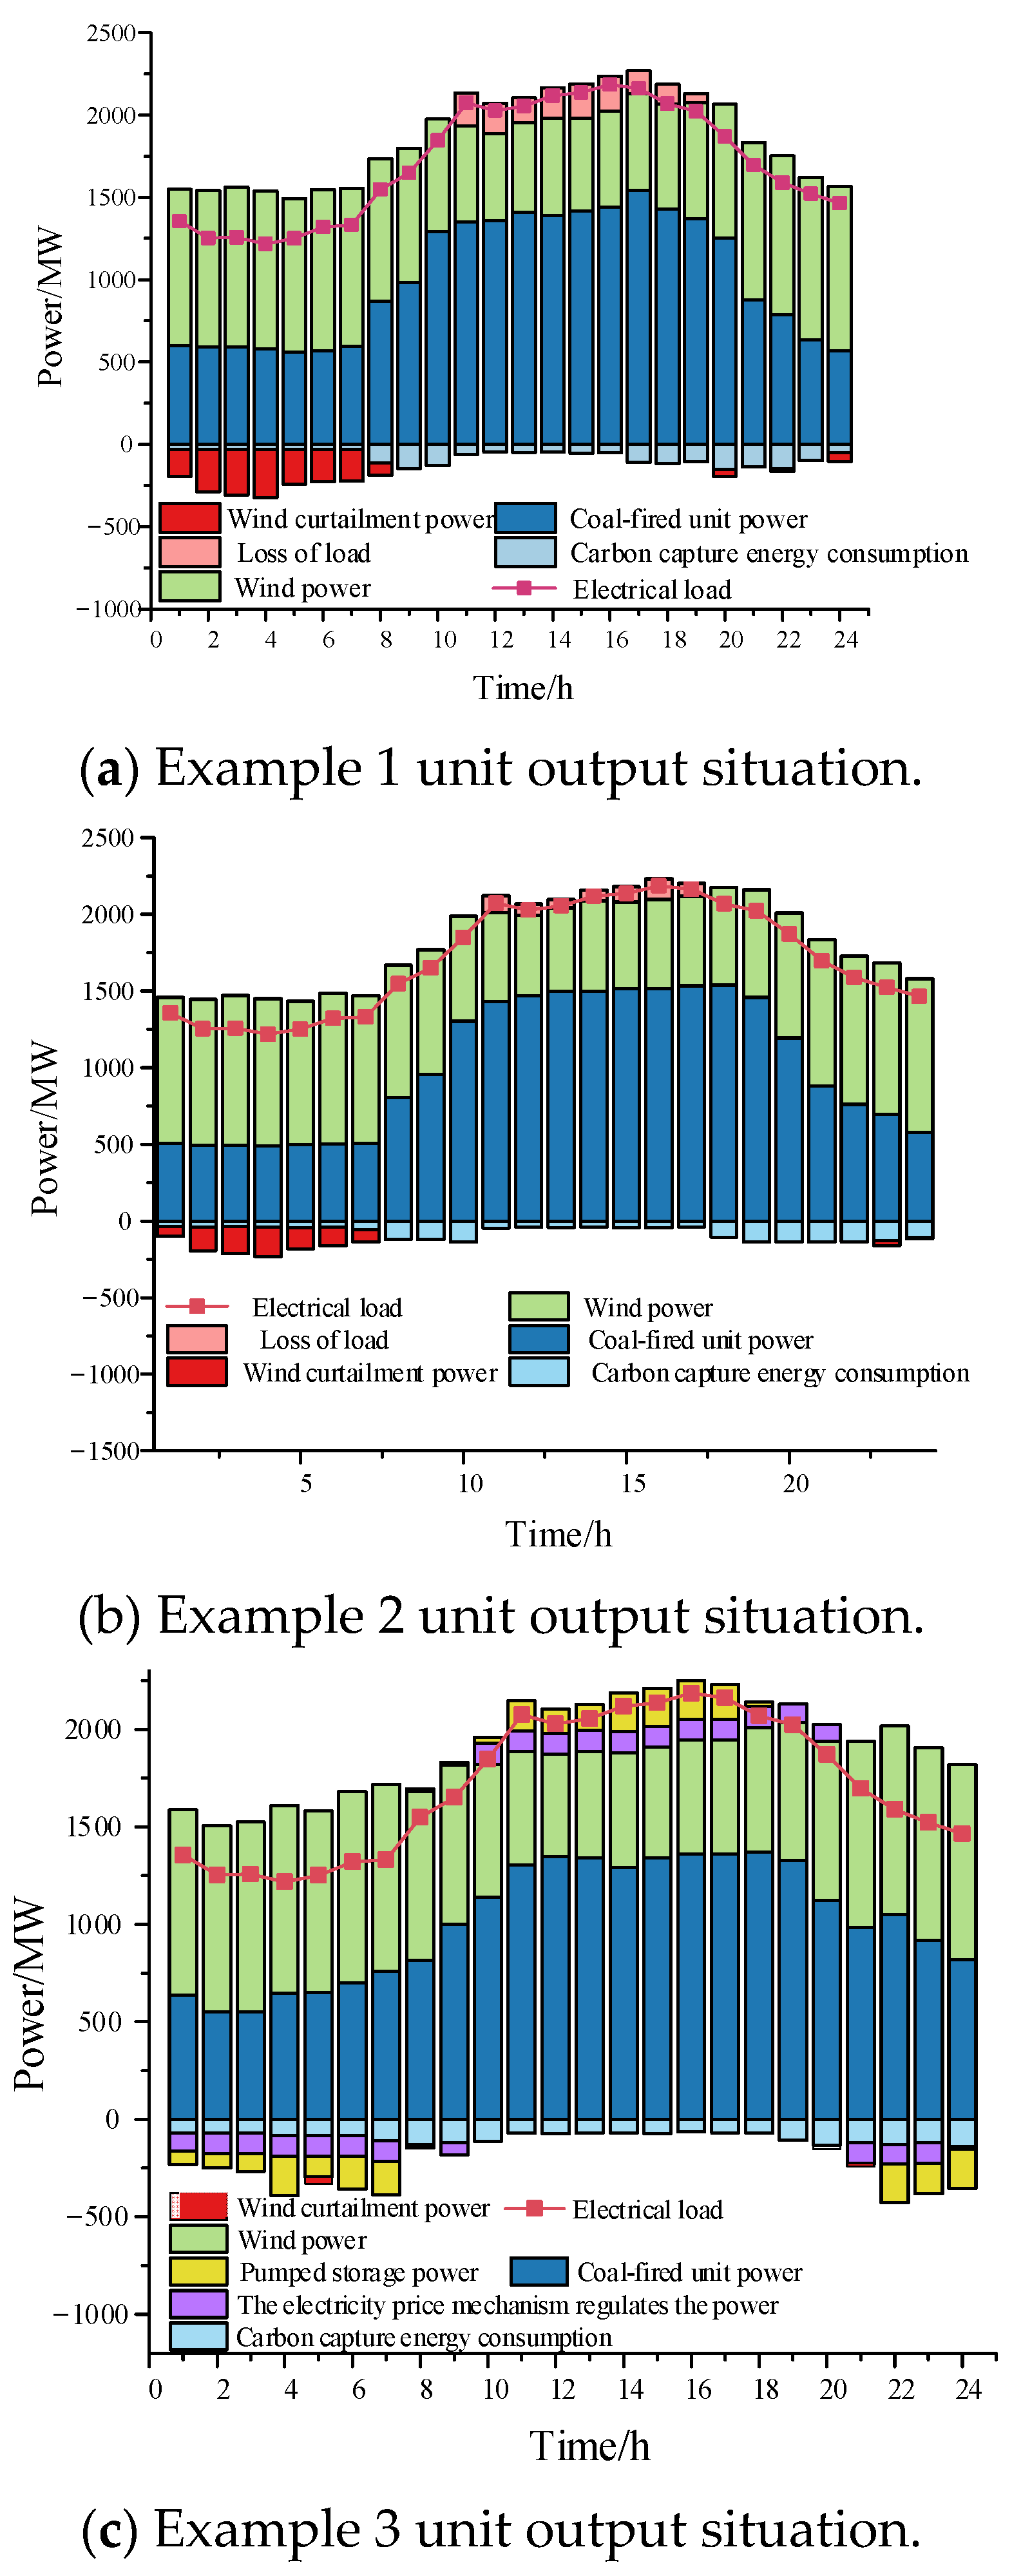
From Figure 7, it can be seen that there is a phenomenon of wind abandonment and load loss in Figure 7a. This is because during the 0–8 period, the net load level of the system was low, and the thermal power unit reaches its minimum output when starting up, making it impossible for the system to absorb all of the wind power. During the period of 9–16, thermal power plants have not reached their maximum output level due to the impact of low carbon emissions, resulting in a certain degree of load loss. During the peak load period, the phenomenon of load loss in Figure 7b has been alleviated compared to Figure 7a. This is because the corrected carbon quota value has increased during this period, and the thermal power units are operating at full capacity. The carbon capture level of the carbon capture units has decreased, reducing the net load of the system. However, the low-carbon benefits of the system have decreased during this period. Due to the existence of generalized energy storage in Figure 7c, the phenomenon of wind curtailment and load loss has been reduced, the carbon capture efficiency during peak periods of net load has been improved, and the climbing frequency and size of thermal power units have been alleviated, balancing low-carbon and economic considerations.
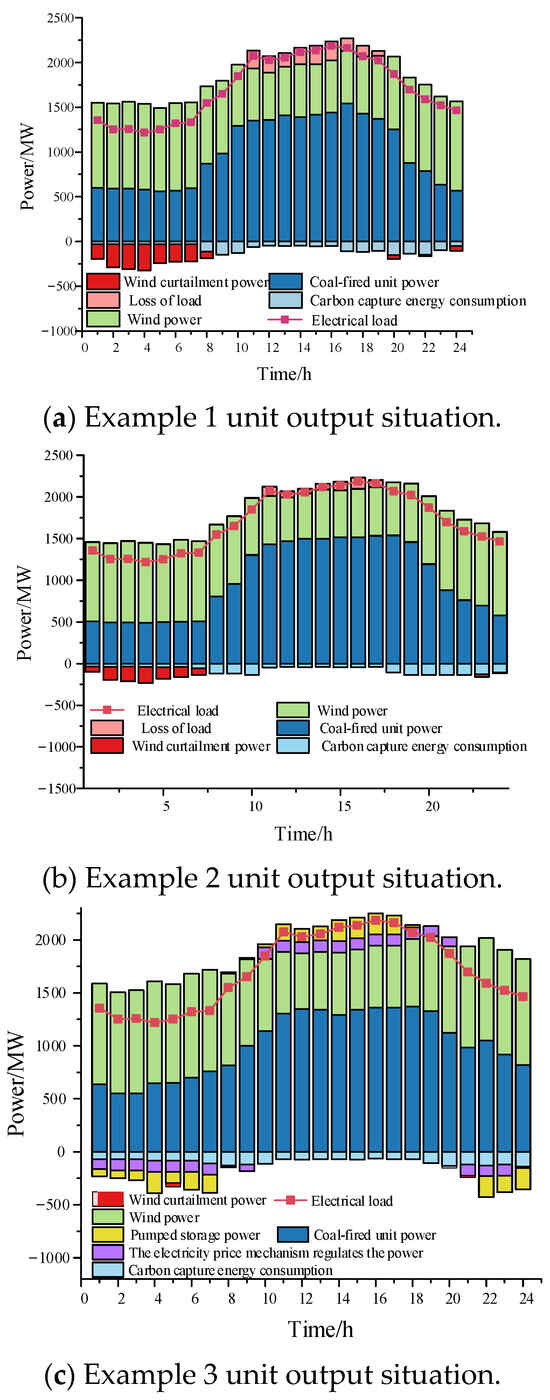
Figure 7.
Comparison of performances of various control schemes under load disturbance.
5.3. Analysis of the Scheduling Effect of Carbon Capture Systems Under Various Models
5.3.1. Energy Consumption of Carbon Capture
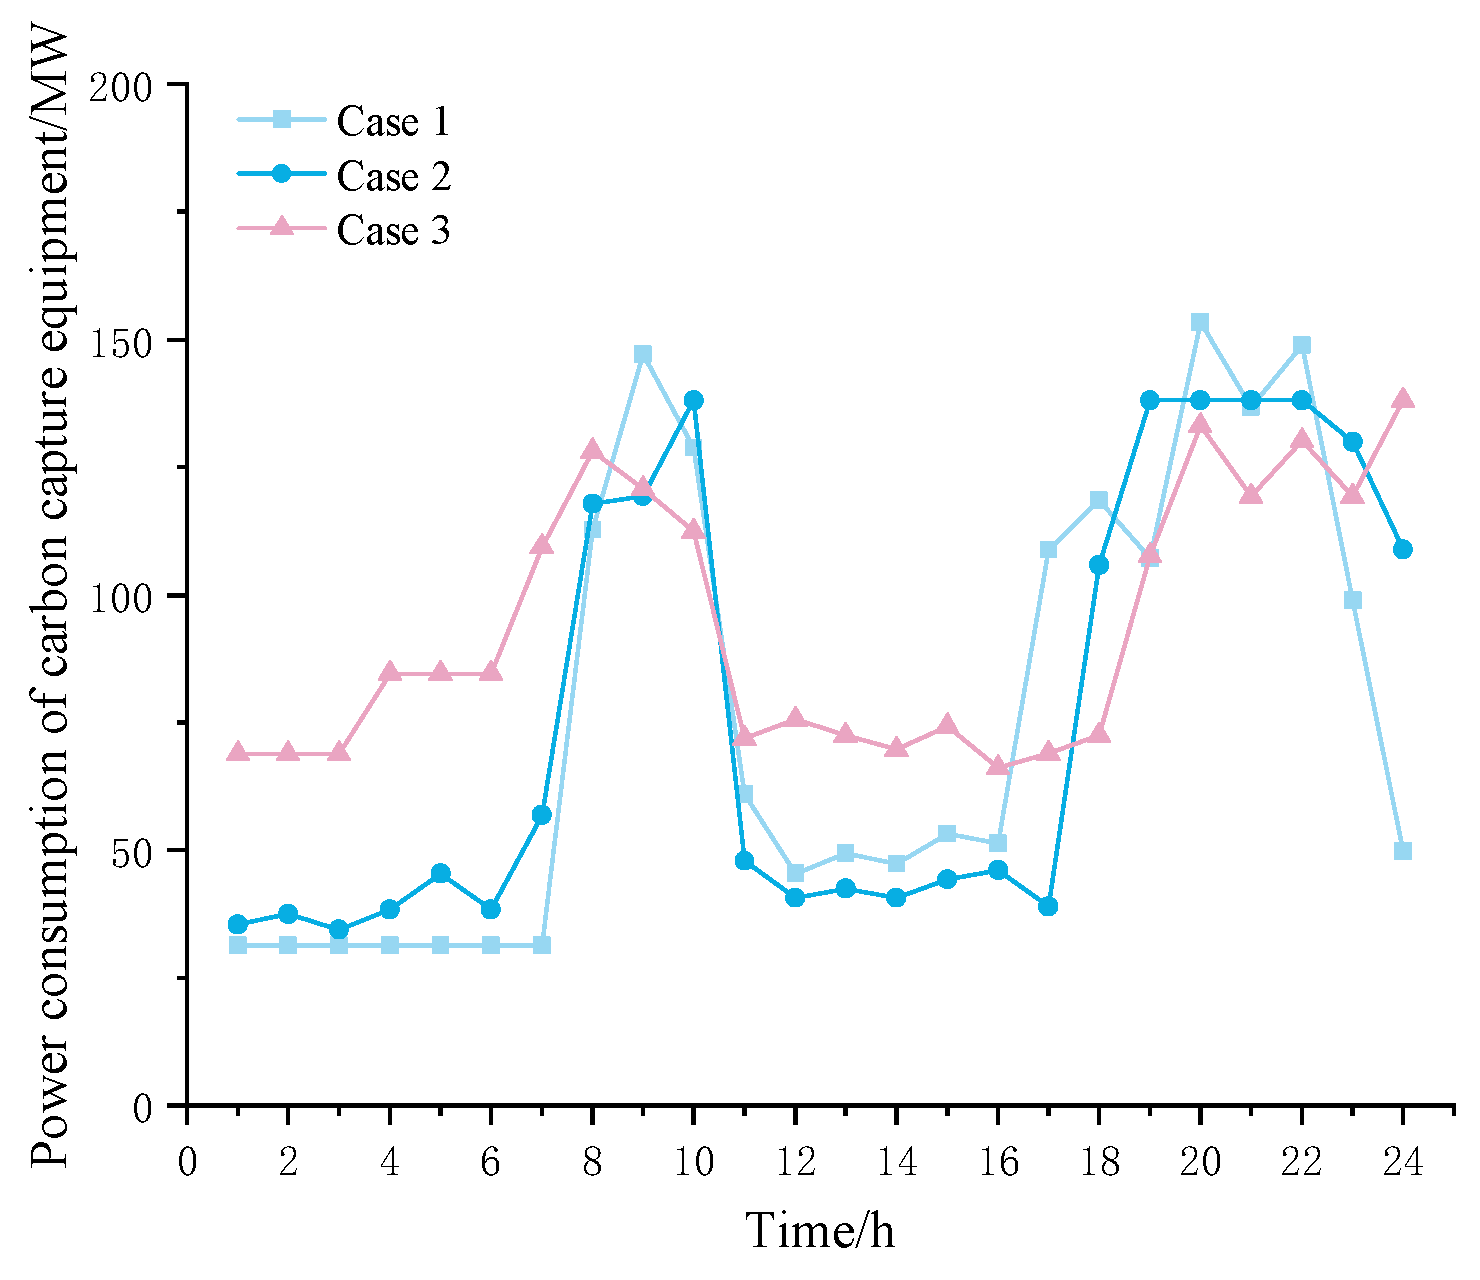
Comparing the carbon capture energy consumption of each time period in Figure 8, during the peak period of net load, the carbon capture energy consumption of Case 1 is higher than that of Case 2. This is because Case 2 considers dynamic carbon quotas. When the load is high, in order to improve the peak shaving and valley filling ability of the carbon capture equipment, the dynamic carbon quota correction amount is positive. As the carbon quota amount increases, the system’s capture energy consumption decreases. The energy consumption of carbon capture in Case 3 is higher than that in Case 2, due to the addition of generalized energy storage. The pumped storage and electricity pricing mechanism alleviate the load loss problem caused by the high energy consumption of carbon capture equipment, and the carbon capture equipment can still capture carbon at full capacity during peak load periods. The model in Case 3 demonstrates a comprehensive approach to balancing low-carbon goals, energy efficiency, and economic feasibility.

Figure 8.
Carbon capture energy consumption.
During the period of 0–8 when wind power output is high, thermal power output is low, carbon production is small, and the overall carbon capture energy consumption of the system is low. The carbon capture energy consumption of Case 2 is higher than that of Case 1. This is because the modified carbon quota is reduced, and the system’s requirements for low carbon are higher, which improves the capture efficiency of carbon capture units.
The capture energy consumption of Case 3 is greater than that of Case 2. During this period, generalized energy storage is used as the load side to fill the valley of the system. However, due to the large amount of load loss during peak load periods, pumped storage generates more electricity during peak periods, and consumes more electricity during low periods. During periods of low load, the sum of the amount of pumped water consumption on the load side and the amount of load transferred by the electricity pricing mechanism is relatively large, resulting in insufficient wind power output, increased output of thermal power units, increased carbon dioxide emissions, and increased capture energy consumption.
5.3.2. Storage Tank Capacity Analysis
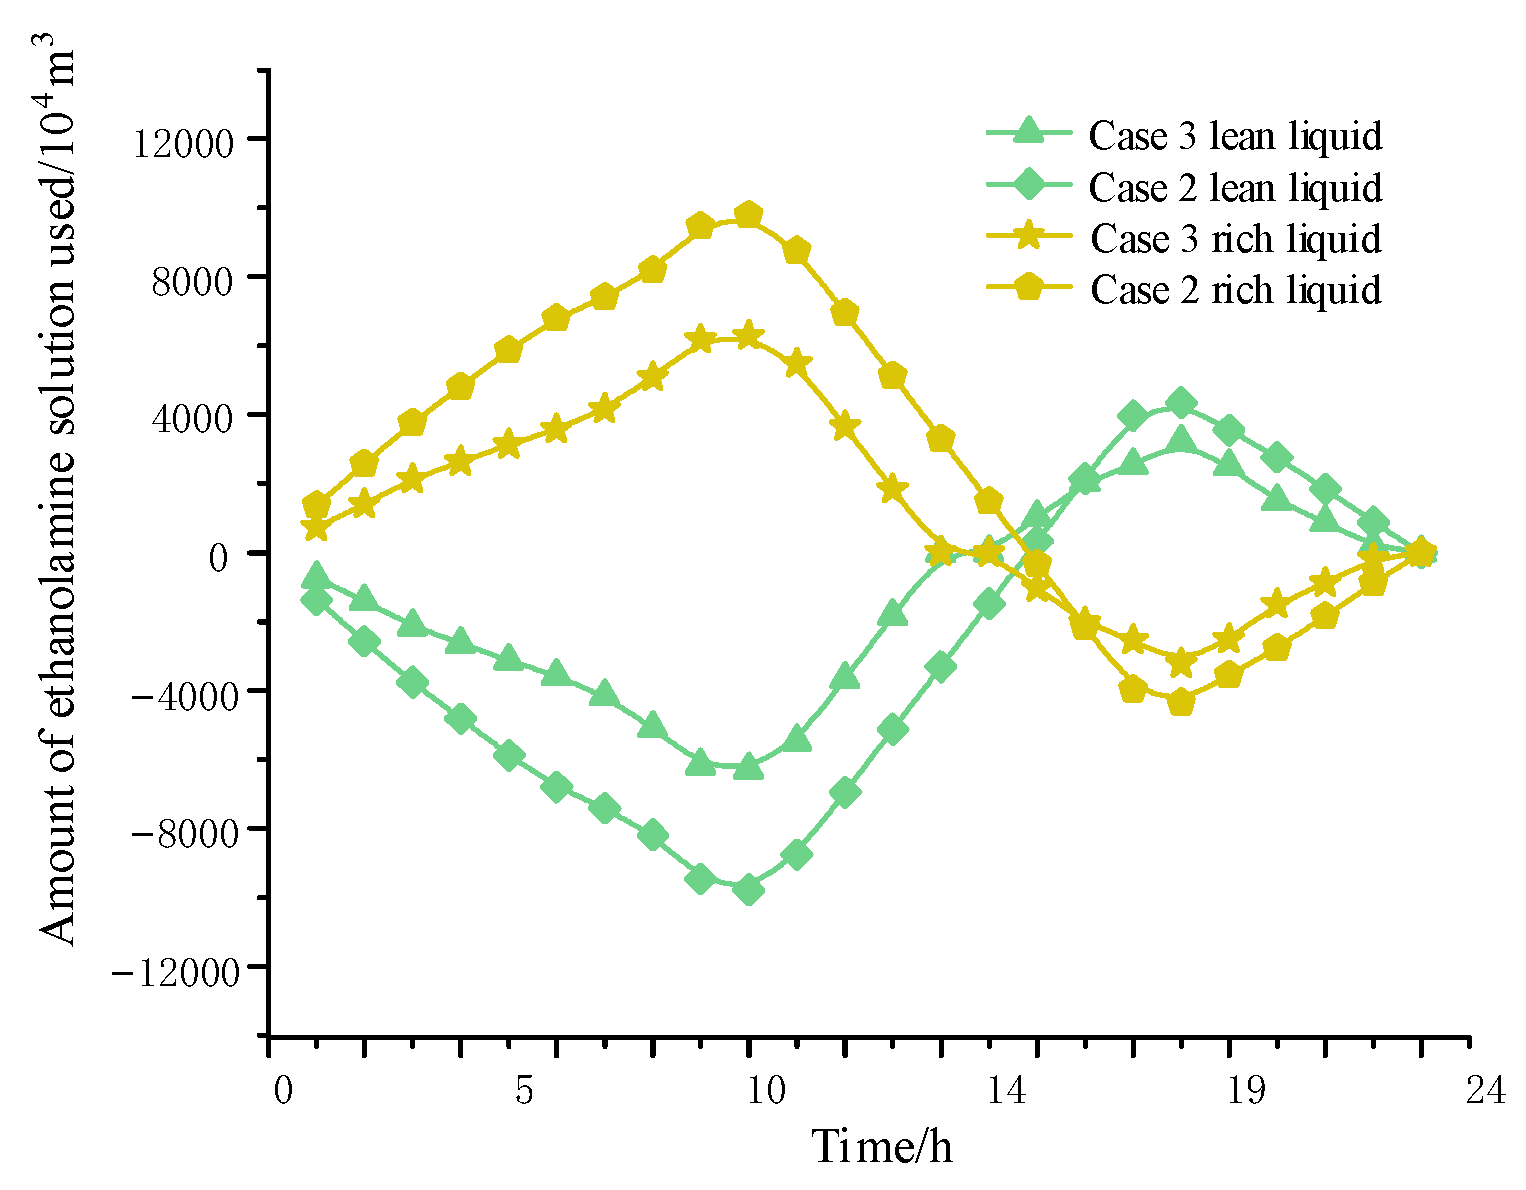
For the storage capacity of the storage tank in different periods of the example in Figure 9, the usage of the alcohol amine solution in Case 3 is smaller than that in Case 2, and the peak storage capacity of the storage tank is smaller than that in Case 2. This indicates that due to the introduction of generalized energy storage in Case 3, the energy storage measures bear the main peak load pressure of the system, weakening the peak shaving and valley filling ability of the carbon capture equipment and reducing the demand for the storage capacity of the carbon capture equipment.
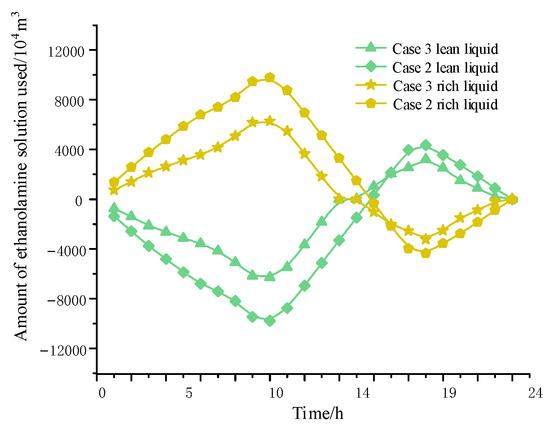
Figure 9.
Liquid storage tank reserves.
5.3.3. Analysis of Smoke Diversion Ratio
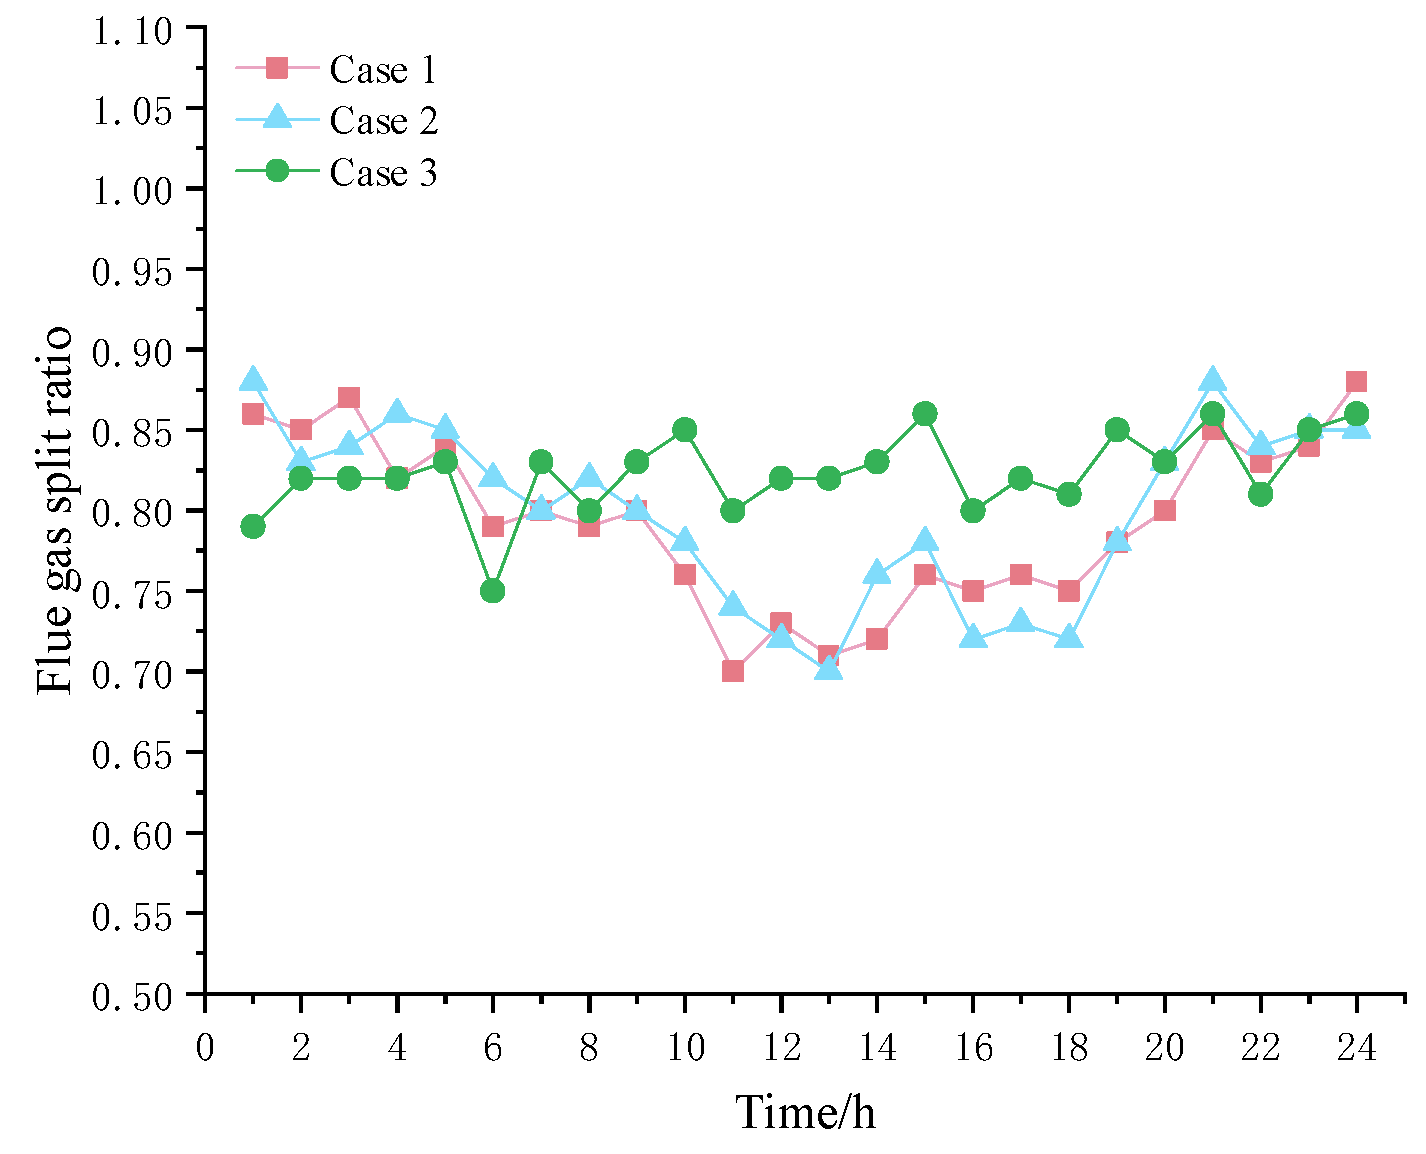
Comparing the flue gas diversion ratios of each time period in Figure 10, during the peak period of net load, the thermal power unit is still unable to meet the load demand at full capacity. The system reduces the level of load loss by reducing carbon capture energy consumption. At this time, the flue gas diversion ratio is mostly lower than at other time periods. Case 3 has a higher flue gas diversion ratio than Cases 1 and 2. This is because by integrating energy storage into the system, the storage acts as a source to supply energy during times of low demand, relieving the output pressure of the thermal power unit and making the carbon capture equipment more focused on carbon capture.
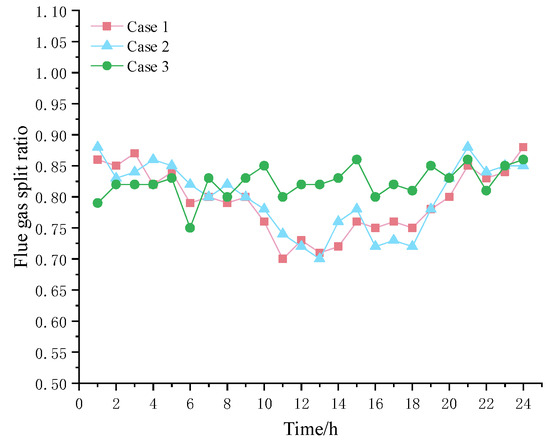
Figure 10.
Flue gas separation ratio of each example.
During the low net load period from 0 to 9 h and 17 to 24 h, the flue gas diversion ratio in Case 2 is moderately increased compared to Case 1, indicating that the dynamic carbon quota mechanism increases the carbon capture output during this period, which is beneficial for the system to reduce abandoned air volume. During this period, the smoke diversion ratio in Case 3 is slightly lower than in Cases 1 and 2. This is because energy storage, as the charging side, effectively absorbs wind power and weakens the valley filling effect of carbon capture.
5.4. Analysis of the Measurement Effect of Dynamic Carbon Emission Models
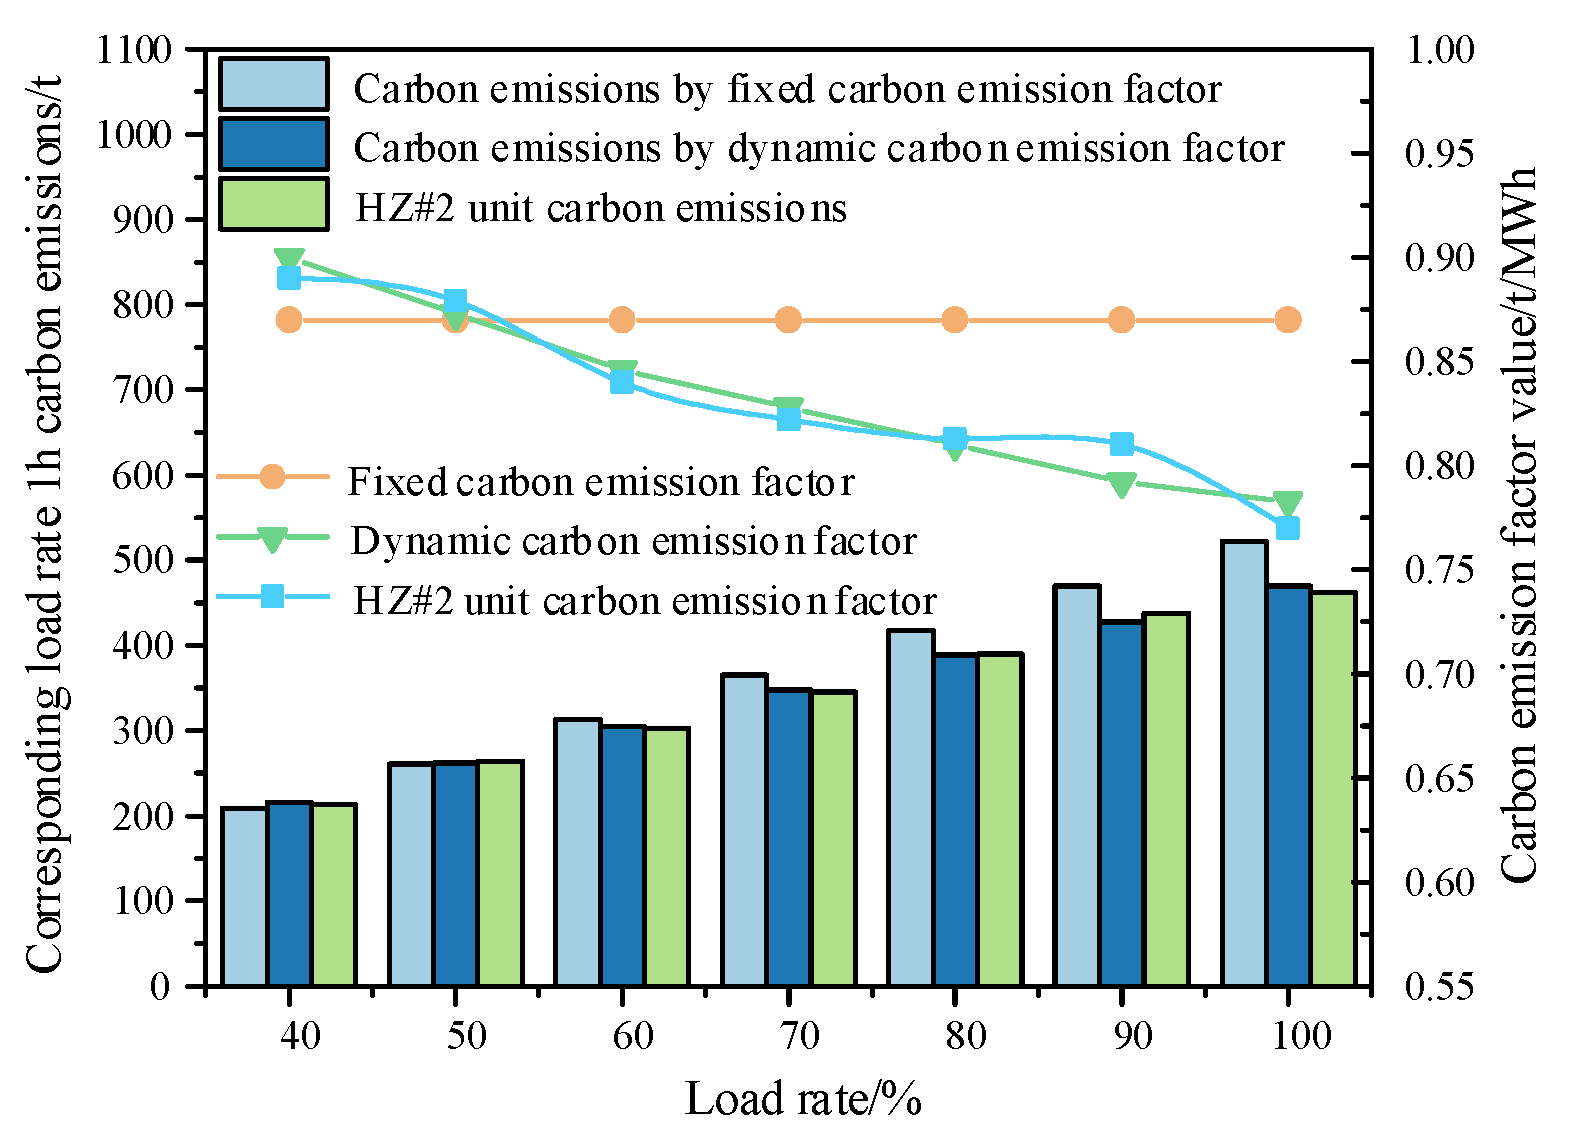
The carbon emissions of thermal power units at different load rates are shown in Figure 11. The actual carbon emission monitoring values are selected from the carbon emission intensity data of the 600 MW unit of Zhonghua Run HZ2 (HZ # 2) in ref. [23]. The basic value of the carbon emission factor in the dynamic carbon emission model is taken as 0.9, and it decreases with the increase in the unit load rate. The fixed carbon emission factor is taken as 0.87. At different load rates, the monitored carbon emission factor value of HZ # 2 unit decreases with the increase in load rate. As shown in Figure 11, the dynamic carbon emission factor also conforms to this law. The standard deviation between the fixed carbon emission factor value and the monitoring value is 0.028 t/MWh, and the standard deviation between the dynamic carbon emission factor value and the monitoring value is 0.0048 t/MWh. After using the dynamic carbon emission factor, the error is reduced by 82.9%. The standard deviation between the 1-hour carbon emissions calculated by the fixed carbon emission model and the actual 1-hour carbon emissions monitored is 77.14 t, and the standard deviation between the 1-hour carbon emissions calculated by the dynamic carbon emission factor model and the actual 1-hour carbon emissions of the unit is 13.32 t, reducing the error by 82.7%.

Figure 11.
Carbon emission measurement under different load rates.
5.5. The Impact of Different Variables on the Economic Cost of the System
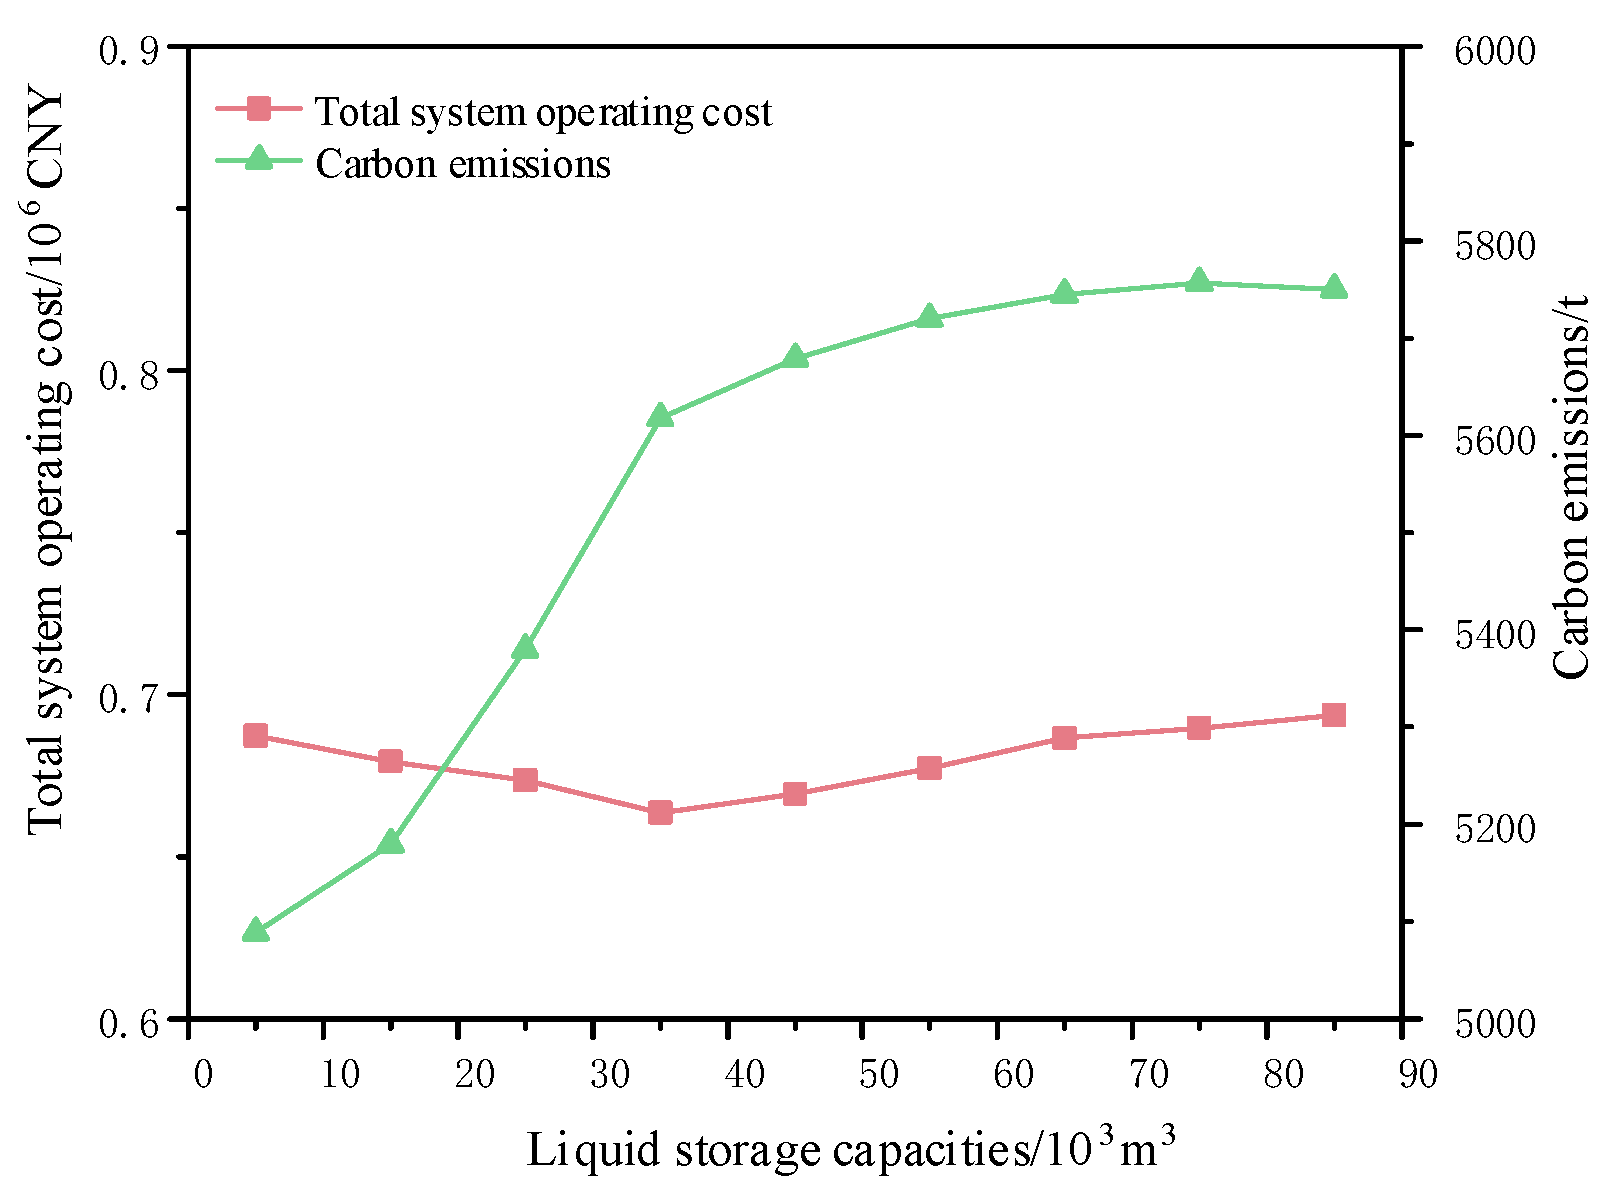
The storage tank can achieve an energy consumption time shift. As the storage capacity of the storage tank increases, the reduction effect of system waste air cost caused by the energy consumption time shift becomes more significant, and the amount of carbon dioxide captured increases. However, the increase in storage capacity will simultaneously lead to an increase in the cost of alcohol amine solution. As shown in Figure 12, when the storage capacity is 35,000 m3, the total system cost is the lowest, and increasing the capacity further has little effect on the capture of carbon dioxide, and the emission reduction benefits are not significant.
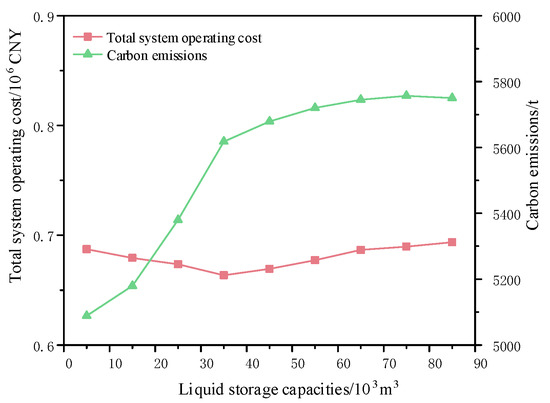
Figure 12.
Comparison of total cost and carbon capture under different liquid storage tank capacities.
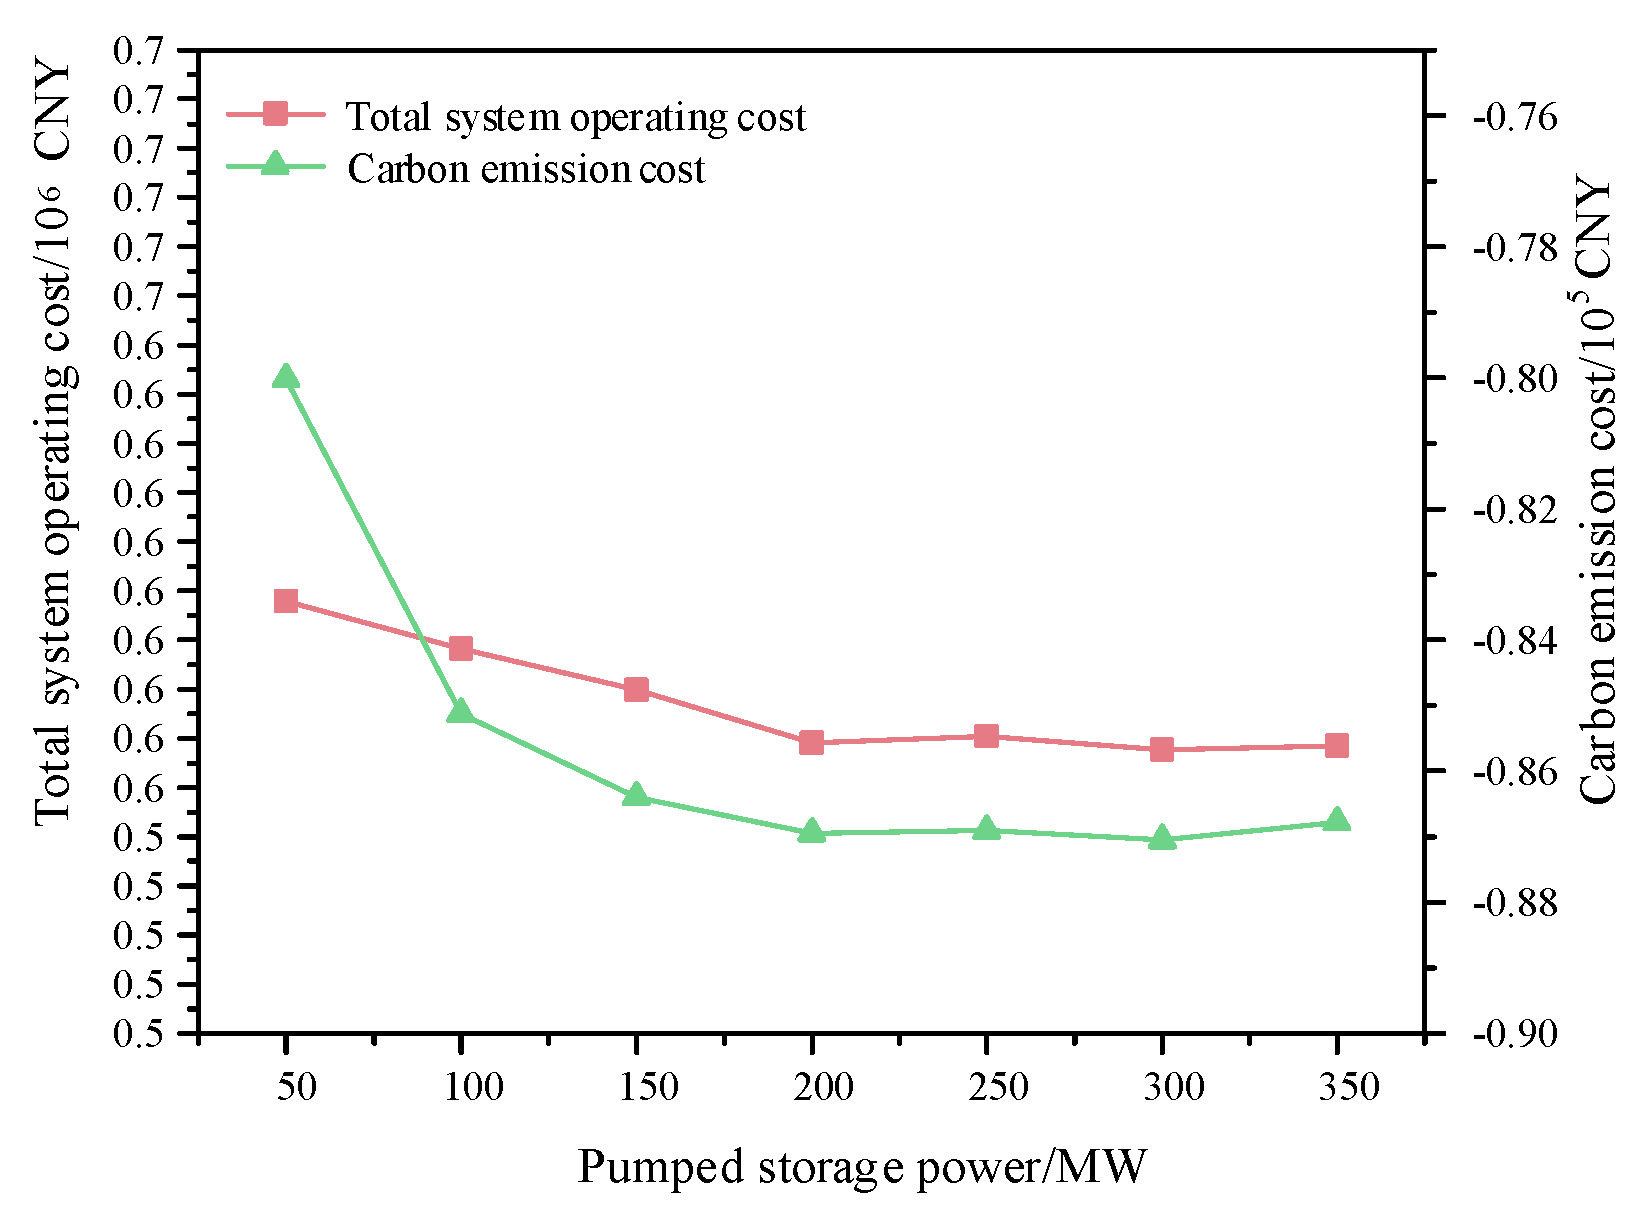
As shown in Figure 13, with the increase in pumped storage capacity, the total economic cost gradually decreases when the pumped storage capacity reaches 200 MW. The overall operating cost and carbon emission benefits of the system have not changed significantly, indicating that under this calculation parameter, 200 MW is the most suitable installed capacity for pumped storage.
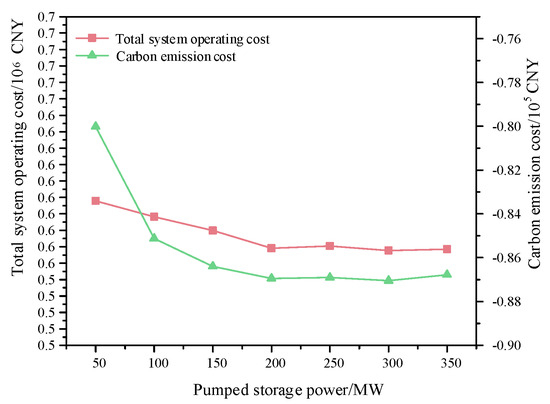
Figure 13.
Total cost and carbon emission cost under different extraction and storage capacities.
6. Conclusions
In summary, the proposed model enhances the system’s flexibility by integrating a dynamic carbon quota mechanism and generalized energy storage resources. The dynamic carbon emission factor improves emission estimation accuracy, while the flexible output adjustment under carbon constraints strengthens the system’s low-carbon performance. Meanwhile, the GES mechanism mitigates wind power curtailment and load loss, promoting both operational stability and economic efficiency. This integrated approach offers a coordinated solution for low-carbon optimization across supply and demand sides in multi-energy systems.
This study provides theoretical support and a technical implementation path for the development of low-carbon power systems under a high proportion of renewable energy integration. A joint operation system combining carbon capture and generalized energy storage is established. Multiple case studies are designed, incorporating actual operational parameters of carbon capture-related units. The proposed model is solved iteratively using the Gurobi solver, and the simulation results are compared and discussed against real plant data to verify the reliability of the experimental outcomes. Based on this, the following conclusions are drawn:
(1) The proposed dynamic carbon quota model enables flexible output adjustment of individual units within the power system while ensuring compliance with the overall carbon emission cap. By integrating dynamic carbon emission factors, the model significantly improves the accuracy of carbon emission estimation. Specifically, the standard deviation between the dynamic emission factor and monitored values is reduced to 0.0048 t/MWh, compared to 0.028 t/MWh under a fixed-factor model—representing an 82.9% improvement in estimation accuracy. Likewise, the error in hourly carbon emissions drops from 77.14 t to 13.32 t, with an 82.7% reduction, enhancing the precision of emission monitoring and control.
(2) The incorporation of generalized energy storage (GES) provides the system with dispatchable, controllable resources capable of absorbing surplus renewable energy and responding to load fluctuations. Simulation results demonstrate that the dynamic quota model, when combined with GES, reduces wind power curtailment costs by 9.6%, load loss costs by 48.8%, and carbon emission costs by 15%. Additionally, the coordinated dispatch of pumped storage and price-driven demand response helps further optimize system operation, leading to a 9% reduction in coal consumption costs and a 17% decrease in total carbon emission costs.
(3) The integrated model enhances system-wide flexibility across both the supply and demand sides, facilitating multi-dimensional coordination of power generation, energy storage, and consumption. Through dynamic adjustments based on carbon quota deviations and price signals, the model achieves substantial improvements in both carbon reduction and economic performance. It thus offers a viable, comprehensive solution for low-carbon optimization in multi-energy systems under dynamic environmental constraints.
While the proposed model demonstrates strong performance in achieving low-carbon economic dispatch, several important aspects warrant further investigation. Future research will incorporate transmission network constraints to assess regional congestion, locational carbon signals, and grid-level coordination. The effects of component degradation—particularly in thermal units, carbon capture systems, and energy storage—will also be modeled to support long-term scheduling and maintenance strategies. In addition, the model will be expanded to account for broader environmental impacts, such as water consumption and air pollutant emissions.
Furthermore, the impact of uncertainties in renewable energy generation and load fluctuations will be explored using stochastic or robust optimization methods. Future work will also examine the economic interactions between carbon trading mechanisms and generalized energy storage participation, offering deeper insights into their long-term feasibility and operational efficiency in low-carbon power systems.
Author Contributions
Conceptualization, T.W., Y.L. and Y.J.; methodology, T.W. and Y.J.; software, T.W. and Y.J.; validation, T.W. and Y.J.; formal analysis, T.W. and Y.J.; investigation, T.W. and Y.J.; resources, T.W. and Y.J.; data curation, T.W. and Y.J.; writing—original draft preparation, T.W., Y.L. and Y.J.; writing—review and editing, T.W. and Y.J.; visualization, T.W. and Y.J.; supervision, T.W. and Y.J.; project administration, T.W.; funding acquisition, T.W. All authors have read and agreed to the published version of the manuscript.
Funding
This research was supported by Science and Technology Research Projects of Henan Provincial Department of Science and Technology, grant number 222102240072.
Data Availability Statement
The original contributions presented in this study are included in the article. Further inquiries can be directed to the corresponding author.
Conflicts of Interest
The authors declare no conflicts of interest.
Abbreviations
| CCS | Carbon Capture Systems |
| CCHP | Combined Cooling, Heating, and Power |
| IES | Integrated Energy System |
| CCPP | Carbon Capture Power Plant |
| GES | Generalized Energy Storage |
| PDR | Price-Based Demand Response |
| P2G | Power To Gas |
| CEUC | Carbon Emission Unit Cost |
References
- Li, M.; Liu, H.; Sun, Y.; Xu, Z.; Tian, H.; Fu, H. The Transformation Path of Industrial Parks under the Goals of Carbon Peak and Neutrality in China. Processes 2024, 12, 2197. [Google Scholar] [CrossRef]
- Huo, S.; Li, Q.; Pu, Y.; Xie, S.; Chen, W. Low carbon dispatch method for hydrogen-containing integrated energy system considering seasonal carbon trading and energy sharing mechanism. Energy 2024, 308, 132794. [Google Scholar] [CrossRef]
- Zhang, M.; Li, W.; Yu, S.S.; Zhao, J. Day-ahead dispatch with carbon trading for multi-regulation participation and emission reduction considering multi-type energy storage. Int. J. Electr. 2024, 158, 109942. [Google Scholar] [CrossRef]
- Wang, D.; Fan, R.; Xu, X.; Du, K.; Wang, Y.; Dou, X. Hybrid game model for electricity trading and pricing among multiple microgrids and consumers based on demand-side complex networks. Energy 2024, 313, 133961. [Google Scholar] [CrossRef]
- Dang, Y.; Wang, W. Low-Carbon Economic Scheduling of Hydrogen-Integrated Energy Systems with Enhanced Bilateral Supply–Demand Response Considering Vehicle to Grid Under Power-to-Gas–Carbon Capture System Coupling. Processes 2025, 13, 636. [Google Scholar] [CrossRef]
- Liu, X.; Li, X.; Tian, J.; Yang, G.; Wu, H.; Ha, R. Low-carbon economic dispatch of integrated electricity-gas energy system considering carbon capture, utilization and storage. IEEE Access 2023, 11, 25077–25089. [Google Scholar] [CrossRef]
- Xie, T.; Wang, Q.; Zhang, G.; Zhang, K.; Li, H. Low-Carbon Economic Dispatch of Virtual Power Plant Considering Hydrogen Energy Storage and Tiered Carbon Trading in Multiple Scenarios. Processes 2024, 12, 90. [Google Scholar] [CrossRef]
- Han, L.; Wang, C.; Yu, X.; Yu, H.; Wang, X. Low-carbon and economic dispatch considering the carbon capture power plants with flexible adjustment of wind power ramp. Trans. China Electrotech. Soc. 2023, 239607. [Google Scholar] [CrossRef]
- Cui, Y.; Zeng, P.; Hui, X.; Li, H.; Zhao, J. Low-carbon Economic Dispatch Considering the Integrated Flexible Operation Mode of Carbon Capture Power Plant. Power Syst. Technol. 2021, 45, 1877–1886. [Google Scholar]
- Chen, H.; Chen, J.; Zhang, Z.; Wang, C.; Wang, J.; Han, H.; Lv, X. Low-carbon economic dispatching of power system considering capture energy consumption of carbon capture power plants with flexible operation mode. Electr. Power Autom. Equip. 2021, 41, 133–139. [Google Scholar]
- Fang, Z.; Li, Z.; Hu, H.; Zhao, B. Impact of Carbon Trading Price Parameters on the Optimization of Integrated Energy System. In Proceedings of the 2024 IEEE 5th International Conference on Advanced Electrical and Energy Systems, Lanzhou, China, 29 November–1 December 2024; pp. 219–224. [Google Scholar]
- Ma, T.; Wang, Y.; Li, T.; Zhang, Y.; Wang, Z. Optimizing Multi-Timescale Scheduling of Combined Cooling, Heating, and Power Systems Under Penalty-Reward Tiered Carbon Trading. IEEE Access 2024, 12, 113474–113489. [Google Scholar] [CrossRef]
- Qin, M.; Yang, Y.; Zhao, X.; Xu, Q.; Yuan, L. Low-carbon economic multi-objective dispatch of integrated energy system considering the price fluctuation of natural gas and carbon emission accounting. Prot. Control. Mod. Power Syst. 2023, 8, 61. [Google Scholar] [CrossRef]
- He, H.; Luo, Z.; Wang, Q.; Chen, M.; He, H.; Gao, L. Joint Operation Mechanism of Distributed Photovoltaic Power Generation Market and Carbon Market Based on Cross-Chain Trading Technology. IEEE Access 2020, 8, 66116–66130. [Google Scholar] [CrossRef]
- Yang, D.; He, S.; Chen, Q.; Li, D.; Pandžić, H. Bidding strategy of a virtual power plant considering carbon-electricity trading. CSEE J. Power Energy Syst. 2019, 5, 306–314. [Google Scholar]
- Luo, Y.; Hao, H.; Yang, D.; Zhou, B. Multi-Objective Optimization of Integrated Energy Systems Considering Ladder-Type Carbon Emission Trading and Refined Load Demand Response. J. Mod. Power Syst. Clean Energy 2024, 12, 828–839. [Google Scholar] [CrossRef]
- Du, P.; Huang, B.; Liu, Z.; Yang, C.; Sun, Q. Real-Time Energy Management for Net-Zero Power Systems Based on Shared Energy Storage. J. Mod. Power Syst. Clean Energy 2024, 12, 371–380. [Google Scholar] [CrossRef]
- Peng, F.; Gao, Z.; Hu, S.; Zhou, W.; Sun, H.; Wang, Z. Bilateral Coordinated Dispatch of Multiple Stakeholders in Deep Peak Regulation. IEEE Access 2020, 8, 33151–33162. [Google Scholar] [CrossRef]
- Yue, Z.; Liu, H.; Li, Y.; Zhong, Y.; Yao, J.; Li, Y. Tri-layer low-carbon distributed optimization of integrated energy systems based on hybrid games under stochastic scenarios. IET Gener. Transm. Distrib. 2023, 17, 5323–5339. [Google Scholar] [CrossRef]
- Li, Y.; Wu, W.; Yang, H.; Gong, G.; Zhang, Y.; Luo, S.; Zhou, S.; Wang, P. Dynamic Carbon Emission Factors in Source–Network–Storage Power System Planning: A Focus on Inverse Modelling. Energies 2024, 17, 6346. [Google Scholar] [CrossRef]
- Wang, P.; Ge, Y.; Yu, N.; Lin, Q.; Chen, R.; Wang, J. Low-carbon optimal dispatch of virtual power plant based on time-of-use ladder carbon emission rights exchange mechanism. Syst. Sci. Control. Eng. 2023, 11, 2180688. [Google Scholar] [CrossRef]
- Wu, Y.; Shi, Z.; Lin, Z.; Zhao, X.; Xue, T.; Shao, J. Low-carbon economic dispatch for integrated energy system through the dynamic reward and penalty carbon emission pricing mechanism. Front. Energy Res. 2022, 10, 843993. [Google Scholar] [CrossRef]
- He, H.; Zhou, S.; Zhang, L.; Zhao, W.; Xiao, X. Model andmethodology for dynamic carbon emission metering on powergrid side. Modern Electric. Power 2025, 42, 39–45. [Google Scholar] [CrossRef]
- Ren, X.; Wang, J.; Yang, S.; Zhao, Q.; Jia, Y.; Ou, K.; Hu, G.; Yan, J. A novel multi-objective Stackelberg game model for multi-energy dynamic pricing and flexible scheduling in distributed multi-energy system. Energy 2025, 325, 136206. [Google Scholar] [CrossRef]
- Li, W.; Dong, F.; Ji, Z.; Wang, P. Internal and external coordinated distributionally robust bidding strategy of virtual power plant operator participating in day-ahead electricity spot and peaking ancillary services markets. Appl. Energy 2025, 386, 125514. [Google Scholar] [CrossRef]
- Wang, P.; Zhang, Y.; Wang, F.; Xu, M. Carbon capture, utilization, and storage in China’s high-emission industries: Optimal deployment under carbon neutrality goals. Energy 2025, 323, 135774. [Google Scholar] [CrossRef]
- Uddin, M.; Clark, J.R.; Hilliard, M.R.; Thompson, J.A.; Langholtz, M.H.; Webb, E.G. Agent-based modeling for multimodal transportation of CO2 for carbon capture, utilization, and storage: CCUS-agent. Appl. Energy 2025, 378 Pt A, 124833. [Google Scholar] [CrossRef]
- Wang, Y.; He, S. A Multi-Objective Hybrid Game Pricing Strategy for Integrated Energy Operator-Load Aggregator Alliances Considering Integrated Demand Response. IEEE Access 2024, 12, 187112–187127. [Google Scholar] [CrossRef]

Disclaimer/Publisher’s Note: The statements, opinions and data contained in all publications are solely those of the individual author(s) and contributor(s) and not of MDPI and/or the editor(s). MDPI and/or the editor(s) disclaim responsibility for any injury to people or property resulting from any ideas, methods, instructions or products referred to in the content. |
© 2025 by the authors. Licensee MDPI, Basel, Switzerland. This article is an open access article distributed under the terms and conditions of the Creative Commons Attribution (CC BY) license (https://creativecommons.org/licenses/by/4.0/).