Article

Research on the Method of Determining the Loosening Circle and Sealing Depth of High-Gas Coal Bed Roadway Based on Direct Current Method

1
Yongcheng Coal Power Holding Group Co., Ltd., Yongcheng 476600, China
2
School of Resources and Safety Engineering, University of Science and Technology Beijing, Beijing 100083, China
3
Juji Coal Mine of Henan Longyu Energy Co., Ltd., Yongcheng 476600, China
*
Author to whom correspondence should be addressed.
Processes 2025, 13(6), 1743; https://doi.org/10.3390/pr13061743
Submission received: 7 April 2025 / Revised: 19 May 2025 / Accepted: 27 May 2025 / Published: 1 June 2025
(This article belongs to the Section Energy Systems)

Abstract

:
Gas extraction is the main method to reduce the gas content of a coal seam and prevent coal and gas outburst. The sealing depth is one of the key parameters affecting the sealing effect. The principle of the high-density direct current method is to lay electrodes underground, and by injecting a stable DC current into the underground medium, the potential difference is measured to calculate the apparent resistivity, which reflects the difference in electrical conductivity of the underground rock or coal body, and then inferring the physical characteristics, such as its structure, water content, or stress state. Based on the basic principle of the high-density direct current method, this study analyzed the change rule of resistivity after the secondary stress of the roadway; tested the distribution of the roadway stress field in Juji Mine; and finally, determined the sealing depth of this coal seam. The main conclusions were as follows: The resistivity of the loose crushing zone after the roadway disturbance stress corresponded to the plasticity and destruction stage of the coal body, and the resistivity was larger compared with that of the original rock stress area. The stress concentration zone corresponded to the compression stage, where the destruction of the coal and rock state was smaller, and the resistivity was smaller compared with that of the original rock stress area. The range of the loose circle of the roadway of the coal seam was 6 m, and the range of the stress concentration zone was 6–17.5 m. The range of resistivity changes of the loose crushing zone was larger, and it had a large range of resistance, which had a good effect. The resistivity of the loose broken zone varied widely and was random, while the visual resistivity of the stress concentration zone was basically the same and was stable.

1. Introduction

As coal mining in China gradually enters the deep underground mining stage, it faces more and more serious power disasters. The total number of coal mine accidents has shown a decreasing trend over the years, but the proportion of protrusion accidents in the total accidents has increased [1]. Coal seam gas extraction is an important technical means to prevent coal and gas protrusion. Among them, the sealing depth is one of the key factors to ensure the effectiveness of extraction [2,3,4].
When a roadway is excavated, the surrounding coal rock body will change under the action of secondary surrounding rock stress to form the “three zones” distribution of loose broken zone, stress concentration zone, and original rock stress zone [5]. If the sealing hole is not deep enough, the coal seam gas will enter into the roadway through the fissure between the drill hole and the fracture zone, which affects the extraction effect [6]. The long sealing hole will also lead to the bottleneck of sealing, which will affect the gas extraction [7]. Currently, the method of determining the depth of sealing holes is mainly based on theoretical numerical simulation combined with on-site measurement [8].
The high-density direct current method is a geophysical detection method based on resistivity changes, which has the advantages of being non-damaging and having a wide detection range [9]. It has been found that the resistivity has a significant response to coal rock damage [10,11,12]. Li et al. [13] monitored the change in coal body resistivity under true triaxial loading conditions by the DC method and found that the range and degree of change in the apparent resistivity were mainly affected by the spatial distribution of cracks and the water content status. Song et al. [14] found that the resistivity of coal seams is closely related to the degree of rupture and crack development of coal seams through hydraulic fracturing experiments and field tests. Since the coal rock load damage resistivity has a significant stage change law [15,16], it can cause different responses to different coal rock states. Qiu et al. [17] studied the change rule of resistivity at different stages of the coal body by uniaxial compression and found that the resistivity of a coal body shows the change rule of decreasing—basically unchanged—rising—suddenly increasing, and the volatility of resistivity is caused by the closure of the old fissure and the generation of a new fissure together. Guo et al. [18] carried out coal rock loading resistivity test experiments, as well as field tests, and found that the expansion of the cracks in the coal samples led to a change in resistivity, and the point of sudden increase in resistivity had a good correspondence with the point of destruction of the coal. At present, the DC method technology has achieved good results in many aspects, such as mine water damage and coal bed overburden changes [19,20,21,22]. Therefore, based on the stress–resistivity correspondence of coal rock damage, it can be used to analyze the distribution of the “three zones” in a roadway.
Based on the change in the secondary stress field after mining and the change rule of resistivity of coal rock damaged by a load, in this study, the DC method was used to monitor the spatial distribution of resistivity of the coal rock, to identify the stress concentration zone and pressure relief zone, and to test the distribution of the “three zones” along the open roadway in the working face of 2715 in the Juji Mine, which provided a geophysical basis for the drilling and extraction of this coal seam.

2. Basic Principles of Electrical Testing

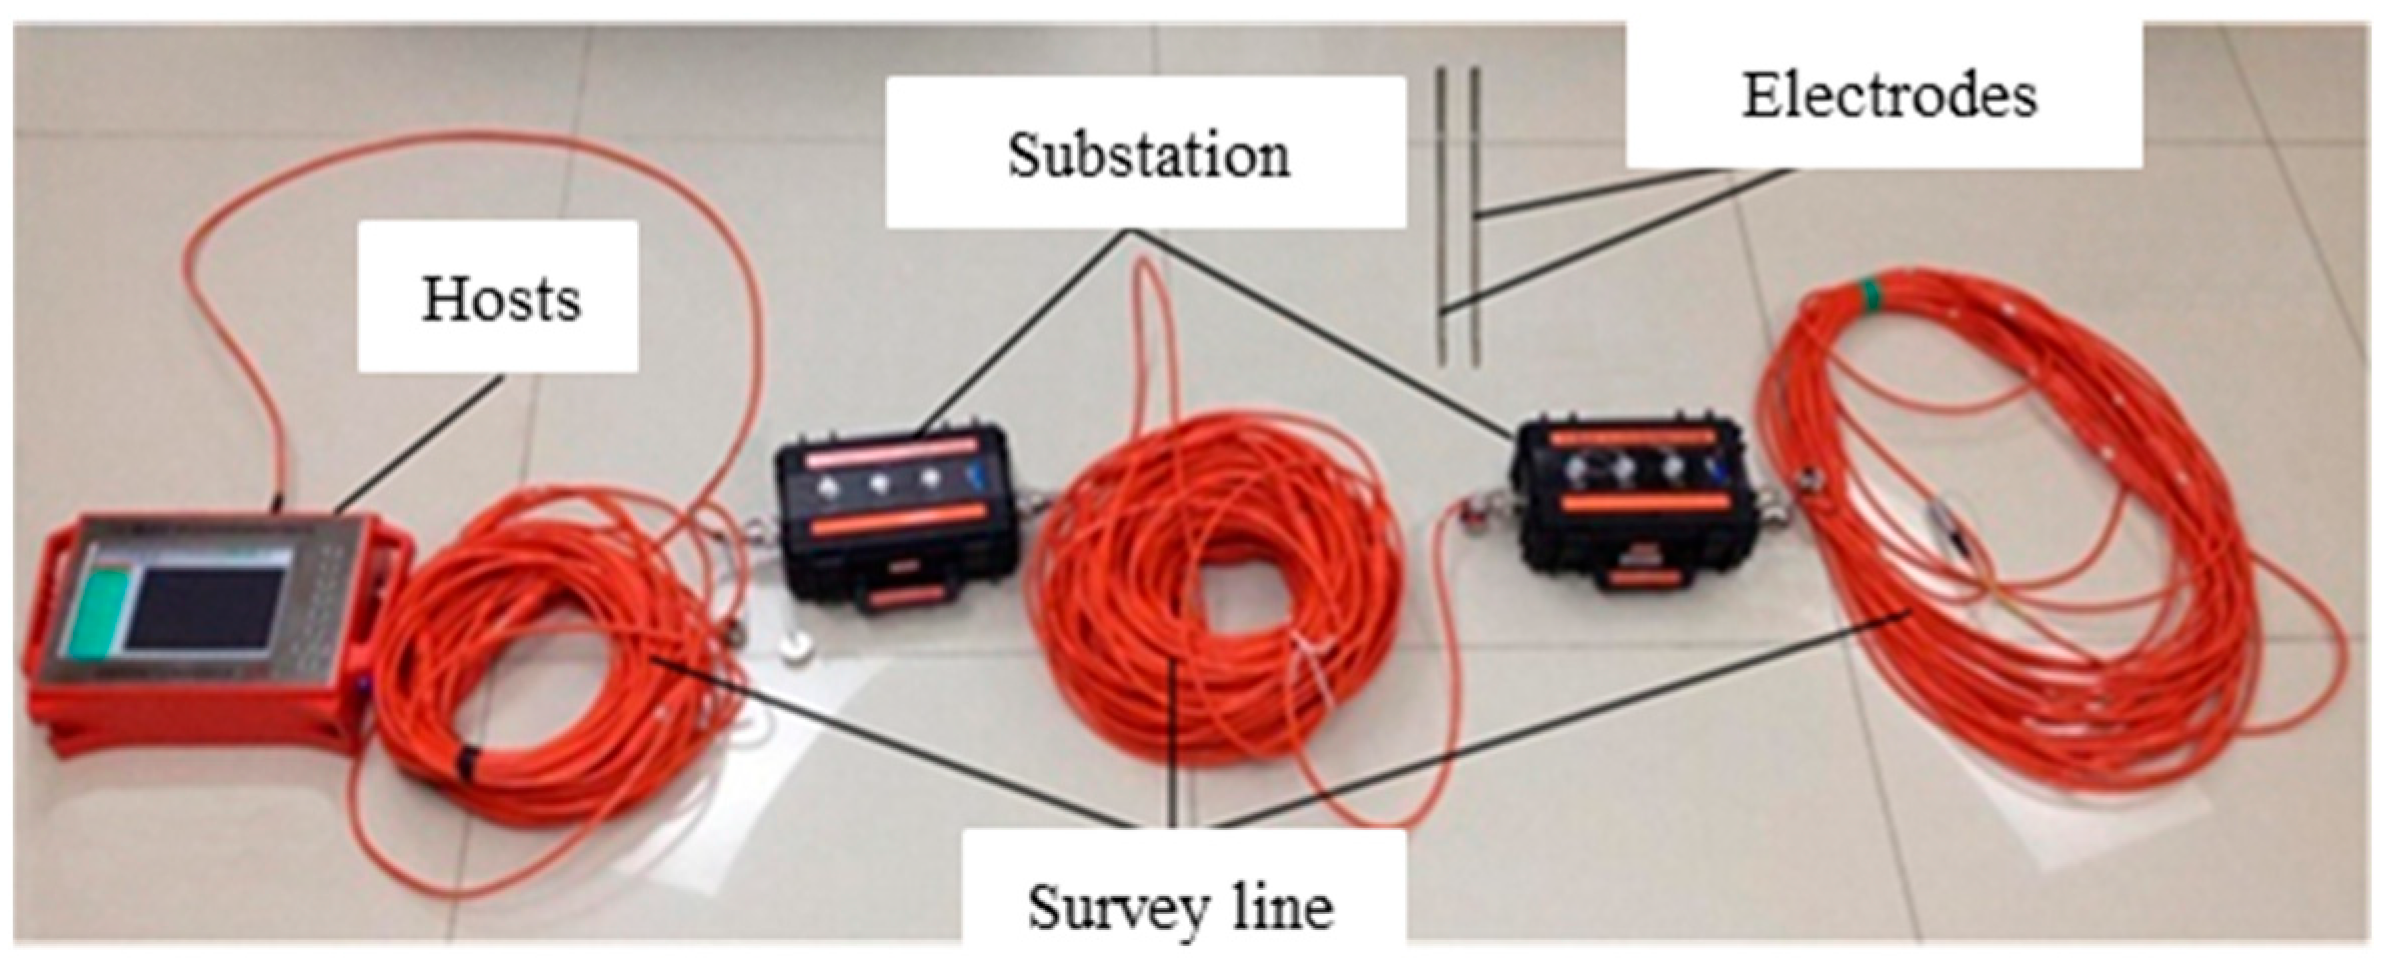
2.1. Principle of High-Density DC Method Testing

The high-density direct current method is also known as resistivity imaging technology, which is a kind of geophysical exploration method developed based on detecting the difference in the electrical properties of coal and rock bodies [20]. It is based on the difference in electrical conductivity of coal and rock layers by artificially supplying excitation current into the ground and observing the change rule of the earth current field so as to determine the change rule of the physical properties of rock and mineral bodies (such as water-poor and water-rich areas) or the characteristics of geological structures (such as faults and fissure development areas) [23,24]. The instrument is shown in Figure 1. It mainly consists of a host, substation, electrode, and measuring line.
When the ground mass is inhomogeneous, assuming a simple two-layer structure as in Figure 2, at this time, the measured ρ using neither ρ1 nor ρ2, but the result of the combined effect of ρ1 and ρ2 is known as the apparent resistivity ρs, whose magnitude is directly related to the magnitudes of ρ1 and ρ2, the thickness of the superstructure, and the shape of the interface of the parting, and so on.
The resistivity expression for a homogeneous body is given by [25]
ρ = K Δ U MN I
where K is the device coefficient, which is determined by the relative position between A, B, M, and N.
To illustrate the relationship between the apparent resistivity and the different resistivity parts of the non-homogeneous body model, let the surface current density between M and N be jMN. The field strength E between M and N is homogeneous for the case of a small MN, i.e., the following equation holds:
E = U N U M M N = Δ U M N M N = j M N ρ M N
where E is the field strength between M and N, V; UN and UM are the potentials at the points N and M, V; MN is the distance between the two points; and jMN is the surface potential density between MN.
This yields Δ U M N = j M N ρ M N M N , which is obtained by substituting this Equation into (1):
ρ s = K j M N ρ M N M N I

2.2. Change Rule of Resistivity After Disturbing Stress in the Roadway

With the excavation of an underground roadway, the original coal rock stress field is damaged, resulting in stress changes in the coal seam and the formation of a secondary stress field [26,27]. The change of coal rock under a pressure state can easily cause deformation of the roadway and may even cause a sheet gang [27]. Resistivity has a good correspondence with stress and has different change rules under different damage forms [16,28]. Figure 3 shows the typical uniaxial compressive stress–resistivity correspondence curves of two coal rock loaded damage processes, where λ is the normalized resistivity value.
At the beginning of loading, i.e., at the stage when the stress was loaded to about 20%, the resistivity of the coal samples showed a gradual decrease. After this, with the increase in stress, the resistivity basically remained unchanged or gradually decreased. When the stress reached 85%, the resistivity showed an inflection point, which corresponded to the change in the stress fluctuation during the loading process of the coal samples. After the stress drop, the resistivity showed a sudden change, followed by a sudden increase after the coal body was destroyed. This indicates that the sudden increase in resistivity corresponds well with the rupture of the coal body itself.
The resistivity of the coal in the loading damage process showed a “decline—basically unchanged—rise—sudden increase”. This phenomenon was due to the existence of a large number of primary micropores and other structures within the coal; as the coal’s loaded compression increased, primary microfractures in the direction of the compression gradually closed and the coal’s conductive channel contact was better, which made the resistance of the whole body of the coal decrease. Then, with the continued loading, the fissures and pores inside the coal were still in the closed state, and the contact area between the particles did not change much, which resulted in the resistivity basically remaining unchanged or decreasing. Due to the increasing stress, the coal samples began to change from elastic deformation to plastic deformation, and new fissures were formed. This led to a larger resistivity and an inflection point. Finally, the coal sample ruptured and an expansion point appeared, the internal structure was damaged, and the resistivity increased dramatically.
The above experiments showed that the change in resistivity of the coal body with the stress had significant stage characteristics. The resistivity was relatively small when the coal sample was not pressurized or was pressurized in a small area; the resistivity decreased when the pores closed after the coal body was initially pressurized, and the resistivity reached the maximum value after the coal sample was destroyed. This phenomenon is closely related to the stress distribution around a roadway [5]. The stress distribution around a roadway is affected by many factors showing an uneven distribution [29]. The desirable “three zones” and stress distribution around the roadway are shown in Figure 4.
From Figure 4, the three zones around the roadway can be divided into a loose crushing zone, stress concentration zone, and original rock stress zone. The coal body in the loose broken zone is located around the roadway, the coal body in this area was broken under the action, the stress is relatively small, and the main layer exists in the form of residual stress, corresponding to the plasticity and destruction stage in Figure 3. The coal and rock in the stress concentration zone is in the state of compression but not exceeding the limit of destruction, and the coal seam stress is highly concentrated currently, corresponding to the linear stage in Figure 3. The stress in the original rock stress zone is not affected by the mining of the seam, and the mechanical properties of the coal rock do not change, corresponding to the compression stage in Figure 3. The stress in the primary rock stress zone is not affected by the disturbance of the seam. The stress in the original rock stress zone is not affected by the mining of the coal seam, and the mechanical properties of the coal rock do not change, corresponding to the compression stage in Figure 3.

3. Test Program Layout

3.1. Site Conditions

Juji Coal Mine is located in the southeast of Yongcheng City. The approved production capacity of the mine is 2.8 million tons/year. The current production level of the mine is −550 m, and there are three mining areas: 26, 27, and 211 respectively. The mine has an absolute gas outflow of 9.001 m3/min and a relative gas outflow of 3.035 m3/t. The hydrogeological conditions of the mine are moderate. Among the mining areas, the 21103 lower working face and 21,104 upper working face are boring faces, and the coal seam has a tendency to deform under the pressure of the roof plate. To study the stress change after the roadway excavation and the influence of faults on the stress distribution, the DC method measuring line was arranged and tested on site.

3.2. Test Program

To test the distribution range of the three belts in the roadway, we started to arrange the survey line after we had entered the lower 21103 and upper 21104 alleys for 10 m. The survey line arrangement is shown in Figure 5. The height of a single electrode arrangement was 1.4 m, the diameter of the drill hole was more than 27 mm, the depth of the drill hole was 0.2 m, and the angle of the drill hole was horizontal. Thirty-two electrodes were arranged in the alleys, the spacing of the arrangement was set at 4 m, and the lengths of the single lower and upper lines were 128 m and 140 m, respectively.

4. Test Results

4.1. Site Monitoring

Figure 6a,b show the 21103 lower lane and 21104 upper lane of the coal seam “three bands” test results. As shown in Figure 6a, the resistivity distribution shows an uneven distribution, where there were localized obvious high-resistance areas and local low-resistance areas, and the visual resistivity value varied greatly. The variation in the resistivity values was more obvious in the region close to the survey line, while the variation in the resistivity values in the deep region was more uniform. In the 0–9 m area, the horizontal direction of the line was light green in the range of 0–50 m, and the resistance value was small. This part of the area was in a broken state due to the impact of mining stress, the area had more water content, and the fissures in the coal rock body caused water accumulation, which led to the smaller resistance value in this area. Then, 50 m later the height of the line reached about 6 m, and the trend was the same as the previous one. The range below 9 m is the red area, where the resistance value was larger; the deep coal rock body was not affected by the damage; the rock body was relatively intact; and there was less porosity, less moisture, a lower degree of fragmentation, and no obvious loosening or crushing area.
From Figure 6b, the resistivity distribution in the area of the upper lane of 21104 showed obvious inhomogeneity, and there was significant zoning of localized high resistance and low resistance. The high-resistance area was about 9 m deep, which showed that the rocky alley was more stable and structurally intact. In the range of 54–84 m in front of the survey line, there were rocky alleys, so the resistance value was larger than that at the two ends of the survey line. The change in the resistance value of the rock tunnel was relatively small, which was close to the deep resistivity. In front of the 100–140 m line, there was a significant low-resistivity area in the range of 0–9 m deep. This part of the area was a coal tunnel, the degree of fragmentation was larger, and it was coupled with more water content, which, in turn, led to a smaller resistance value in this area.
Therefore, it can be inferred from the cloud map of electric detection that the loose circle size of the area in the lower 21,103 lane was about 6–9 m, and the loose circle size of the upper 21,104 lane was about 9 m. The rock body of the low-resistance area was relatively fragmented, the interior affected by the roadway environment was more water-rich, and the stability around the roadway was relatively poor; further support measures are needed to prevent the collapse of or damage to the surrounding rock.

4.2. Detection of Small Faults in the Working Face

To further analyze the inhomogeneous characteristics of the electroprocessing data, the electroprocessing data of the lower 21,103 and upper 21,104 lanes were indexed and compared with the fault structures around the lanes, and the results are shown in Figure 7. The area with large changes in the resistivity gradient was partitioned to make the electroprocessing results easier to be displayed in a partitioned manner. From Figure 7a, it can be seen that the loose broken zone of the coal seam was the side close to the measuring line about 7–20 m below the measuring line, which had a small resistivity due to water enrichment. The color is orange-red and the stress was larger, which was the stress concentration zone of the coal seam. And 20 m below the measuring line was the stress zone of the original rock, which was dominated by the red high-resistance zone, indicating that the deep coal rock body had not been damaged by mining. Comparing the geology of the roadway, it was found that there was no fault in the test area, indicating that this roadway was more significantly affected by mining stress, but there was no obvious tectonic damage. From the test results, the shallow coal rock body of the 21,103 lower roadway was more significantly crushed by mining stress, and the accumulation of water content led to the decrease in the resistance value. The deep coal rock body maintained its integrity and had a higher resistance value, which was in obvious contrast with the crushed area.
In the 21,104 upper lane test results, Figure 7b shows that near the side of the roadway for the loose crushing zone of the coal seam, this part of the overall seam below about 0–8 m had different locations with different distributions. This part of the low-resistance area indicates that this part of the coal rock body crushing degree was larger, but the high water content caused the small resistivity. The higher resistivity of the test line below 8 m corresponded to the stress concentration area and the original rock stress area, which shows that the stability of the coal rock body was better and the rock body structure was more complete. In the loose broken zone in the test area, the resistivity of the area about 40–75 m in front of the test line was found to be higher than that of the surrounding area, which was a relatively high-resistivity area. This indicates that the structure of the coal body in this area was tight after being broken and extruded by stress, which resulted in the increase in resistivity, and it was inferred that faults may exist in this area. After comparing with the geological structure map of the upper lane of 21104, it was found that there was a fault F21102–1 in this area, which proved the reasonableness of the test results.
Resistivity, as an important physical parameter reflecting the electrical conductivity of coal and rock media, is closely related to the structural integrity of the coal body, the degree of fissure development, and the water content status, which, in turn, has a significant correlation with the stability of the coal seam. Generally speaking, a low-resistivity area often corresponds to an area with a broken coal body, fissure development, and high water content, which indicates that the area is disturbed by mining, the structure is loose, the stability is poor, and it is a potential damage area. Meanwhile, a high-resistivity area usually represents an area with an intact coal body, low porosity, and low water content; the structure of the coal and rock is relatively stable; and the risk of damage is small. In addition, local anomalous high-resistivity zones may reflect the effect of fracture closure or compaction caused by stress concentration, and such zones have the risk of sudden damage under certain conditions, which should be paid attention to. Therefore, through the analysis of the spatial distribution characteristics of resistivity, the unstable zone of the coal seam and the stress anomaly zone under the influence of mining can be effectively identified, which can provide a physical basis for disaster prevention and control.

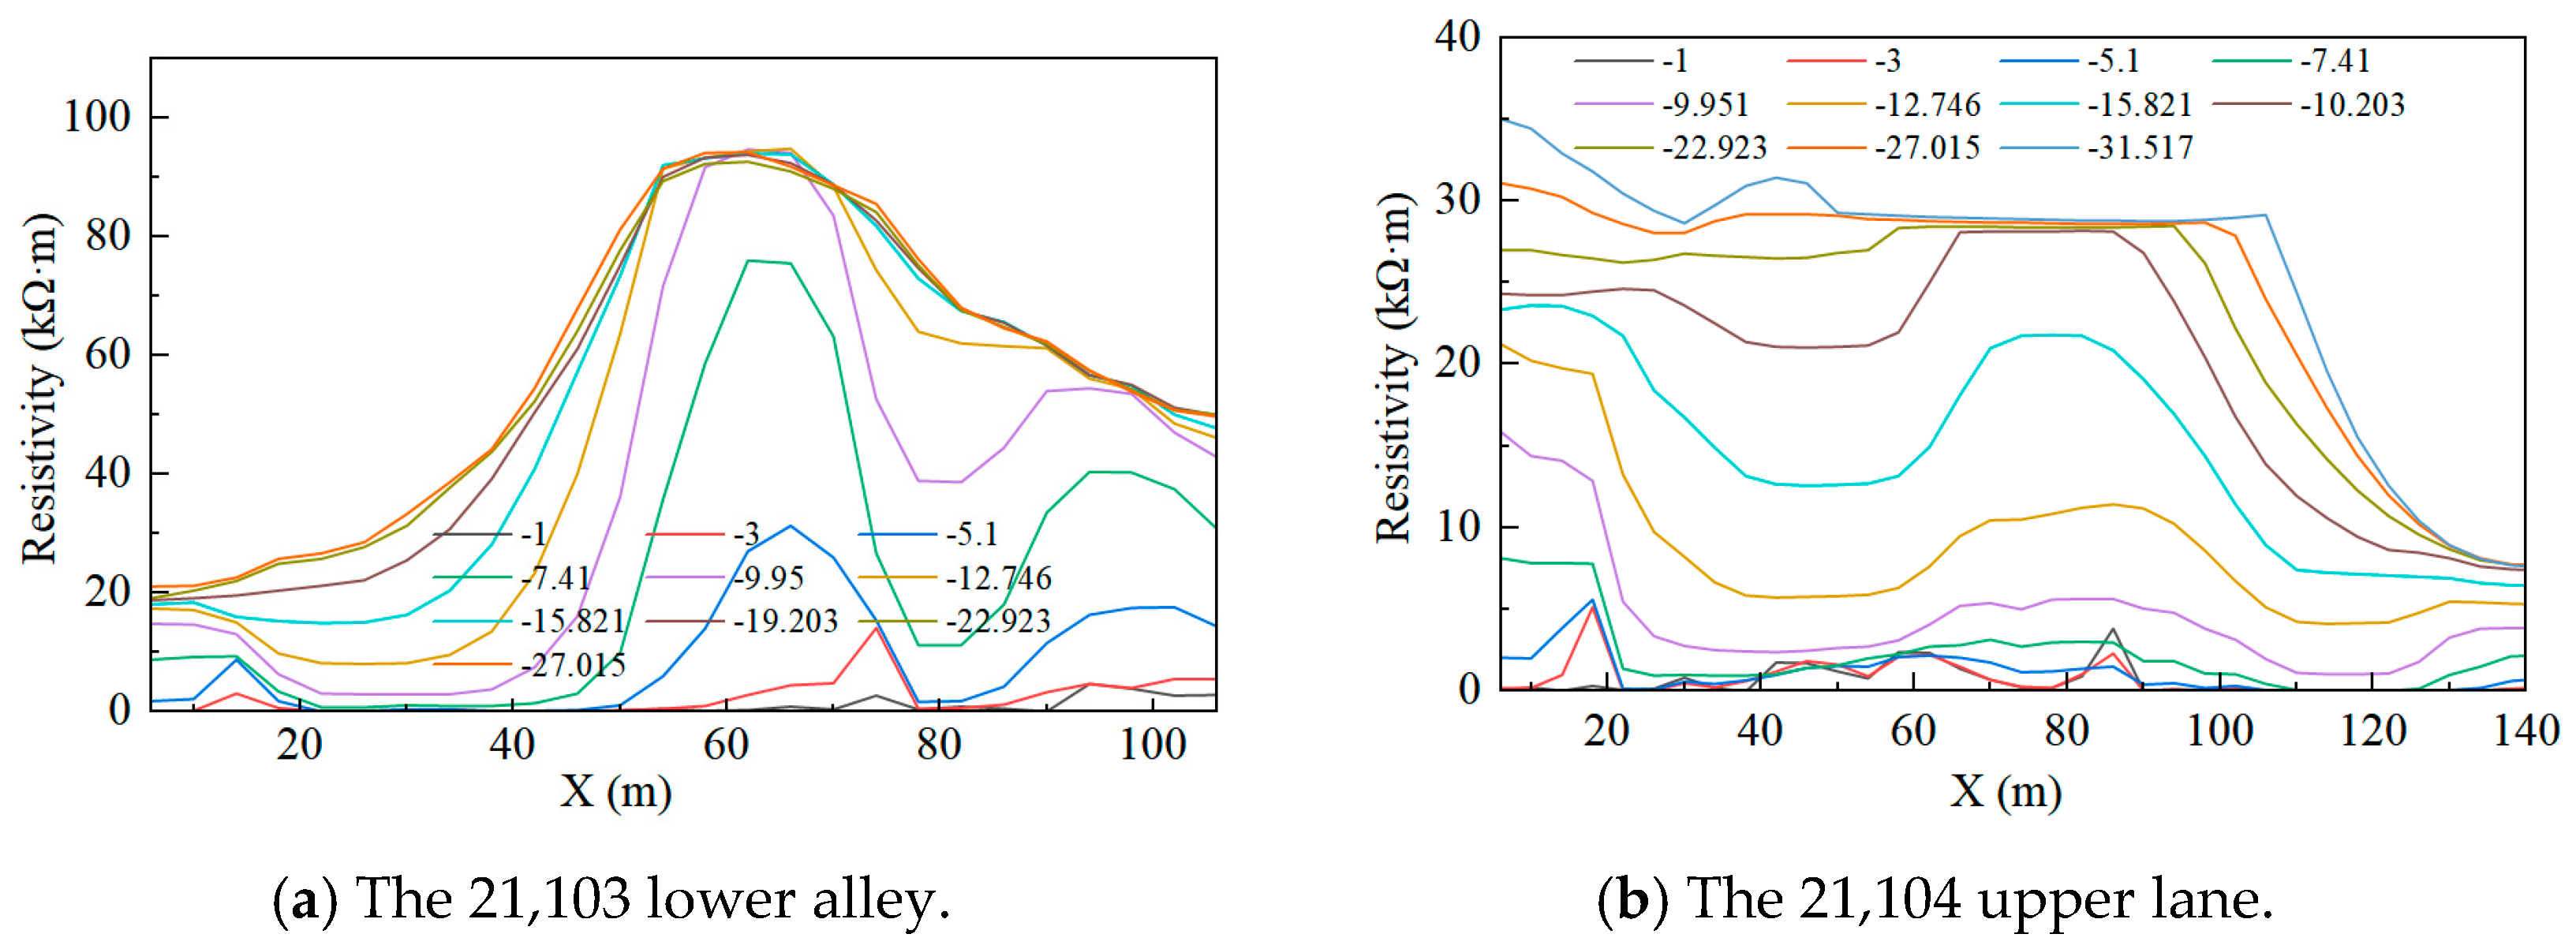
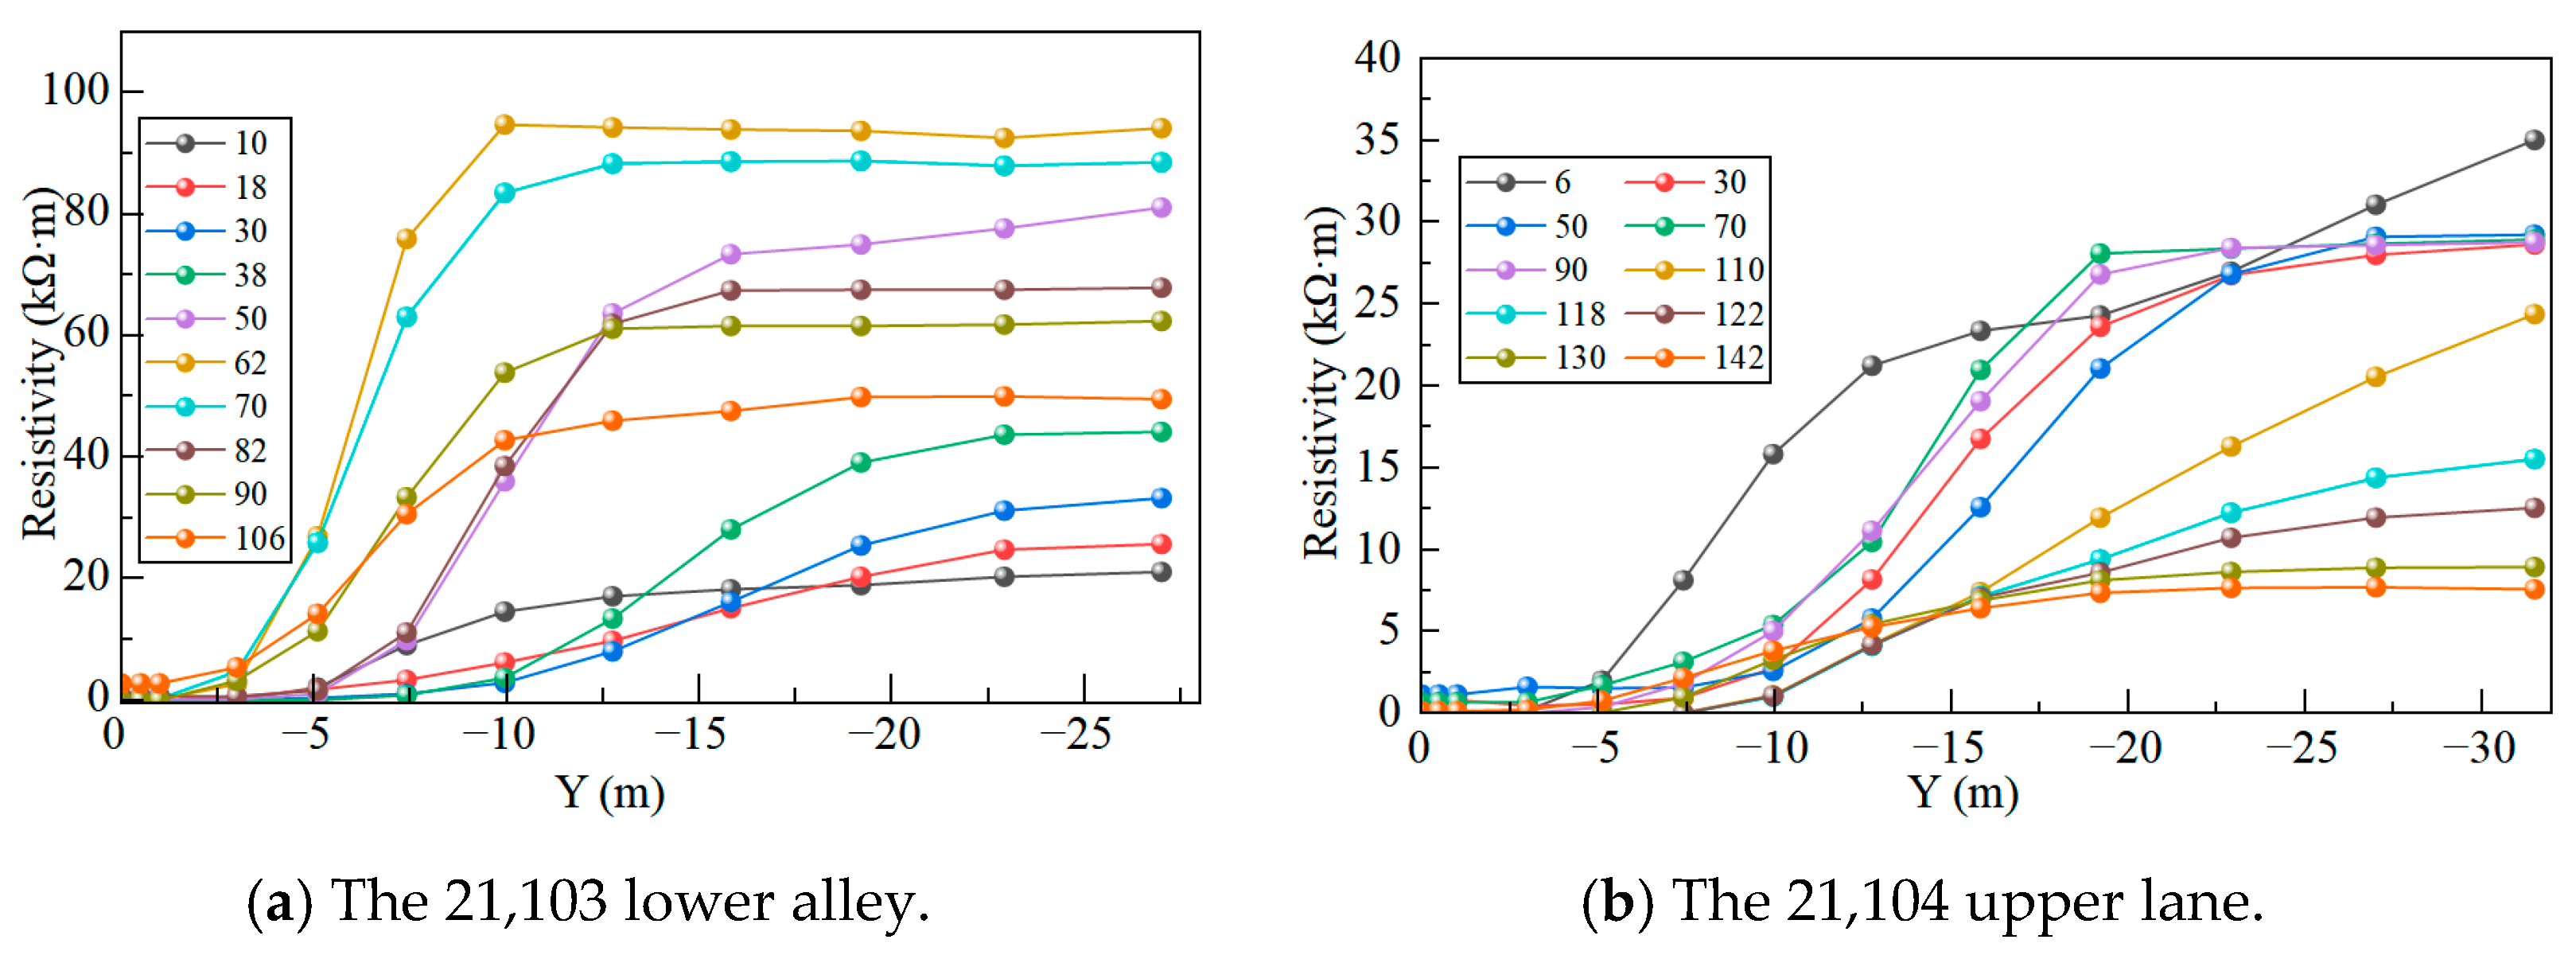
4.3. Characterization of Apparent Resistivity at Different Locations

Figure 8 shows the variation rule of apparent resistivity with horizontal distance at different depths. Observing Figure 8a, the apparent resistivity at −9.951 m had the largest volatility, which fluctuated around 2899.8 Ω-m to 94,700 Ω-m. The apparent resistivity at −1 m was the smallest, and the resistivity was basically around 100 Ω-m without much obvious change. The apparent resistivity at −1 mm had the smallest volatility, and the resistivity was basically around 100 Ω-m without much obvious change. This was consistent with the test results of the upper lane of 2715, where the volatility of apparent resistivity gradually decreased with the increase in depth. In Figure 8b, on the other hand, the volatility at −1 m was the largest, and the maximum apparent resistivity fluctuated around 5.3336 Ω-m to 26,129 Ω-m. The volatility at −27.015 m was the smallest, and the resistivity was basically around 20,000 Ω-m with no obvious change. This indicates that the damage pattern of the rock around the roadway had randomness, while the deep stress had consistency, which was similar to the simulation results of discrete elements [30]. This randomness was consistent with the Weibull distribution [31].
The resistivity distribution in the shallow area usually showed obvious spatial fluctuation, with frequent changes of high and low resistivity locally, which reflected the non-homogeneity and randomness of the destruction of the coal body under mining disturbance. This fluctuation mainly came from the irregular development of coal rock fissures, non-uniformity of the moisture distribution, and differences in the degree of stress relaxation, which reflected the spatial discontinuity and uncertainty of the damage process. In contrast, the resistivity distribution in the deep region was relatively stable, with a gentle trend of change, indicating that the region was less affected by mining, and the stress field structure was relatively intact, with a high degree of consistency and integrity. It can be seen that the larger fluctuation of resistivity tended to predict the more unstable local coal body structure and the more random destructive behavior, while the more continuous and uniform resistivity distribution indicates that the stress distribution in the region was stable and structurally complete, with a high mechanical consistency.
Figure 9 shows the characteristics of “three zones” of apparent resistivity distribution at different levels in the exploration area. It can be observed that the water-rich nature of the lower 21,103 and upper 21,104 alleys caused the resistivities of their loose fracture zones to always increase first and then decrease. The apparent resistivity was basically the same in the original rock stress zone. The results of multiple curves correspond to Figure 3, where the laboratory-scale resistivity change corresponded to the engineering-scale apparent resistivity change. It is worth noting that most of the recent studies mainly focused on analyzing the stress changes in a two-dimensional cross-section of the roadway [5,26]. In fact, due to the influence of tectonic and fracture inhomogeneities of the coal rock of the roadway, the distribution of the three bands in each area were not completely consistent. In the field test, to consider the arrangement of the roadway gas extraction drilling holes, the maximum value of these distributions was usually taken as the range of the loosening circle. The 2715 upper coal seam roadway loosening and crushing zone range was 6 m, and the stress concentration zone range was 6–17.5 m; for the 21,103 lower coal seam roadway, the whole loosening circle was about 8 m in size, and the stress concentration zone range was 8–15 m; for the 21,104 upper coal seam roadway, the whole loosening circle was about 8 m, and the stress concentration zone range was 8–15 m. For the 21,104 upper roadway coal seam, the loose circle size was about 9 m, and the stress concentration zone range was 6–15 m. The loose circle of the 21,103 lower roadway coal seam was about 8 m, and the stress concentration zone range was 8–15 m.

5. Discussion

5.1. Comparison with Theoretical Calculations

According to the “Regulations on Prevention and Control of Coal and Gas Outbursts”, the sealing depth of the drilling holes in this coal seam was set at 8 m. Considering the mining conditions of each mine, the depth of the working face, the structure of the coal and rock body, the tectonic conditions, and other factors, the sealing depth needs to be further determined for each mine according to its own actual situation. The development of fissures inside the loose fracture zone will easily lead to the leakage of gas, which will cause the gas inside the drill hole to form a circuit with the roadway air to reduce the negative pressure of extraction; therefore, the minimum sealing depth of the drill hole should be greater than the range of the loose fracture zone.
Xu et al. [2] established a theoretical formula for the sealing depth of coal seam drill holes based on the D-P criterion as follows:
R s = a ( σ R P + Q ) [ D 1 ( 1 + ξ s ) D 2 ( ξ s ξ p ) ] 1 1 + ξ p 1 M s , φ Q + T p i + T 1 M p . φ 1
where a is the equivalent radius of the roadway after excavation, m; σ R P is the radial contact force at the elastic–plastic junction, N; Q = N p , φ M p , φ 1 , N p , φ , and MP,α are parameters related to the angle of internal friction φ and viscous cohesion c; D1 and D2 are the coefficients related to the plastic zone and the crushing zone, respectively; ξS is the dilation coefficient of the rupture zone; ξP is the dilation coefficient of the plastic zone; and T is the coefficient of the rupture zone related to the stresses and strains.
The working face approximated a circular roadway with a radius of 2.5 m, the buried depth was 710 m, the initial ground stress was 19.17 MPa, the measured coal solidity coefficient was 0.3, and an anchor network support was used with a support stress of 0.25 MPa; by substituting the relevant parameters, the sealing depth of the hole could be obtained from Equation (4), which was 6.58 m. The result corresponded to the result of the DC method, which shows the truthfulness of the data of the DC method.

5.2. Recommendations for Borehole Placement

The range of the crushing zone was from 0 to 6 m, which was more consistent with the results of the theoretical calculations. To ensure the effectiveness of the sealing hole, based on the redundant design of the test and calculation results, a sealing depth of 9 m was determined. Therefore, the shortest sealing depth of this coal seam extraction drilling hole was 9.0 m. At the same time, it was noted that in the tectonic area, such as faults and other tectonic areas, due to more damage to the coal rock body, the stress concentration of the coal rock was larger. It is recommended to increase the sealing depth to more than 15 m in this part of the area and increase the sealing depth for the drill holes within 30 m before and after the tectonic structure.

6. Conclusions

Based on the basic principle of high-density DC method, this study analyzed the change rule of resistivity after the secondary stress disturbance of the roadway, tested the distribution of the roadway stress field in the Juji Mine, and obtained the following main conclusions:
(1)
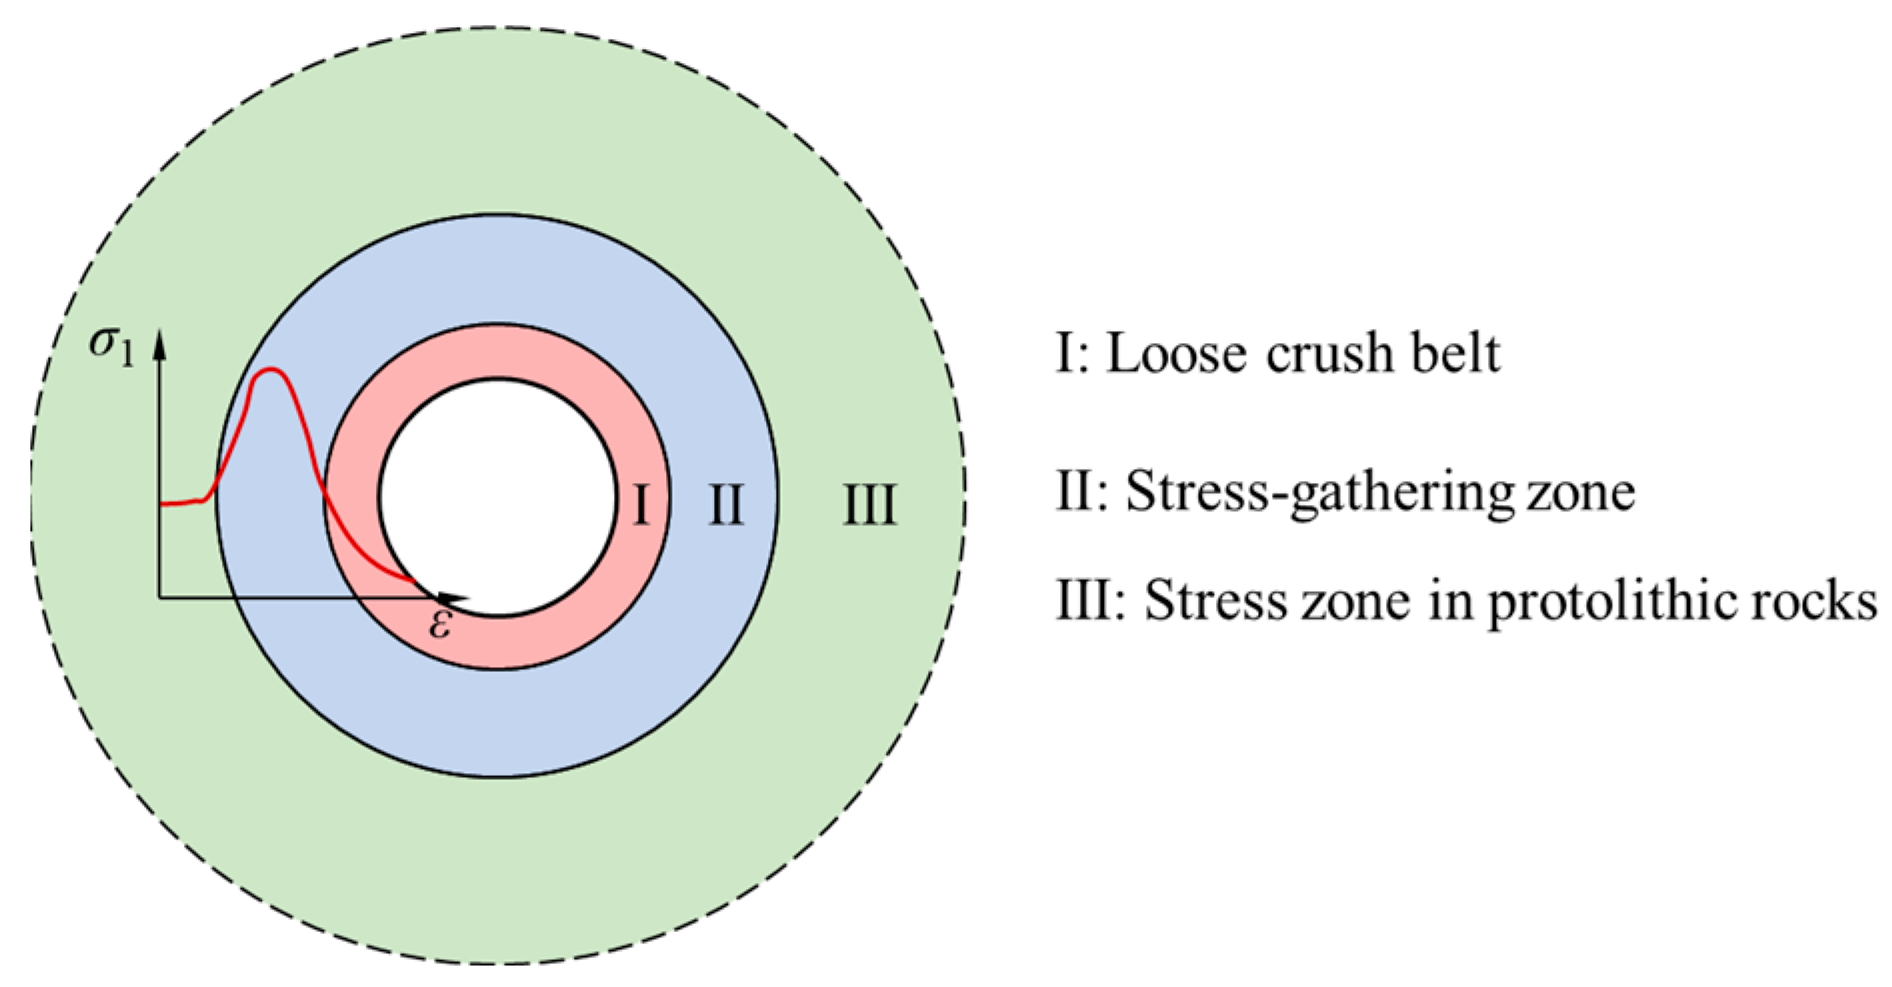
The roadway was divided into a loose crushing zone, stress concentration zone, and original rock stress zone after the disturbing stress. When the degree of water enrichment was small, the resistivity of the loose crushing zone corresponded to the stage of plasticity and destruction of the coal body and the resistivity was larger compared with the original rock stress zone. The stress concentration zone corresponded to the compression stage of the coal and rock state, which was less destructive, and at this time, the resistivity was smaller compared with that of the original rock stress zone.
(2)
The DC method measured that the loose broken zone of the 2715 lower coal seam roadway was 6 m, and the stress concentration zone was 6–17.5 m. The loose whole circle of the 21,103 lower coal seam roadway was 8 m, and the stress concentration zone was 8–15 m. The loose whole circle of the 21,104 upper coal seam roadway was 9 m, and the stress concentration zone was 6–15 m. The resistivity of the loose broken zone varied greatly, which indicates that the damage pattern of the rocks around the roadway was random, while the stress concentration zone was basically consistent with the range of apparent resistivity. The lower resistivity of the loosely fractured zone compared with the original rock stress zone was due to the lower resistivity caused by the fractured coal–rock structure filled with water.
(3)
The DC method test results were consistent with the theoretical test results of the roadway loosening circle. Considering the redundant design of the mine’s current coal seam, a drilling sealing depth of 9 m was determined, which should be increased to more than 15 m after encountering faults.

Author Contributions

Conceptualization, C.W., Q.L., H.L. and L.Q.; Methodology, Q.L. and Z.L.; Software, J.D.; Formal analysis, Q.L., J.D. and J.W.; Writing—original draft, C.W. and Q.L.; Writing—review and editing, Q.L.; Funding acquisition, L.Q. and Z.L. All authors have read and agreed to the published version of this manuscript.

Funding

This research was funded by the National Natural Science Foundation grant number [No. 52474204] and the Science and Technology Support Plan Project of Guizhou Province grant number [No. [2023]380].

Data Availability Statement

The processed data cannot be shared at this time as the data also form part of an ongoing study.

Acknowledgments

This work was supported by the National Natural Science Foundation (No. 52474204) and the Science and Technology Support Plan Project of Guizhou Province (No. [2023]380).

Conflicts of Interest

Authors Chunguang Wang, Liming Qiu and Zhenlei Li were employed by the company Yongcheng Coal Power Holding Group Co., Ltd. Author Hairui Liu was employed by the company Juji Coal Mine of Henan Longyu Energy Co., Ltd. The remaining authors declare that the research was conducted in the absence of any commercial or financial relationships that could be construed as a potential conflict of interest.

References

  1. Zhang, C.; Wang, E.; Wang, Y.; Zhou, X. Spatial-Temporal Distribution of Outburst Accidents from 2001 to 2020 in China and suggestions for prevention and control. Coal Geol. Explor. 2021, 49, 134–141. [Google Scholar]
  2. Xu, K.; Wang, B.; Zhu, J.; Zheng, L. Analysis on sealing depth of borehole in coal seam based on D - P criterion. J. Saf. Sci. Technol. 2017, 13, 111–117. [Google Scholar]
  3. Xu, L. Study on improving the sealing effect of CMM drainage boreholes and its application. China Coalbed Methane 2008, 5, 23–24. [Google Scholar]
  4. Han, Y.; Zhang, F.; Cheng, H. Research on main controlling factors of effective radius for gas extraction using hole drilled along seam based on grey relational analysis. J. Saf. Sci. Technol. 2015, 11, 44–49. [Google Scholar]
  5. Huang, Q.; Wang, X.; Chen, X.; Qin, D.; Zhang, J.; Cheng, H. Evolution of interior and exterior bearing structures of the deep-soft-rock roadway: From theory to field test in the Pingdingshan Mining area. Energies 2020, 13, 4357. [Google Scholar] [CrossRef]
  6. Jiang, B.; Zhang, Q.; He, Y.; Han, L. Elastoplastic analysis of cracked surrounding rocks in deep circular openings. Chin. J. Rock Mech. Eng. 2007, 26, 982–986. [Google Scholar]
  7. Wu, W.; Wang, Z. Numerical simulation study on grouting pressure and borehole sealing depth of borehole sealing. Coal Sci. Technol. 2015, 43, 68–72. [Google Scholar]
  8. Zhao, C.; Yang, X.; Zhang, C.; Li, Y.; Wang, E. Investigation on applicability of common failure criteria considering intermediate principal stress. Chin. J. Rock Mech. Eng. 2011, 30, 327–334. [Google Scholar]
  9. Qiu, L.; Shen, R.; Song, D.; Li, W. Non-destructive testing principles and accurate evaluation of the hydraulic measure impact range using the DC method. J. Geophys. Eng. 2017, 14, 1521–1534. [Google Scholar] [CrossRef]
  10. Wang, G.; Qin, Y.; Shen, J.; Liu, Z. Resistivity response to the porosity and permeability of low rank coal. Int. J. Min. Sci. Technol. 2016, 26, 339–344. [Google Scholar] [CrossRef]
  11. Chen, P.; Wang, E.; Chen, X.; Zhang, H. Regularity and mechanism of coal resistivity response with different conductive characteristics in complete stress -strain process. Int. J. Min. Sci. Technol. 2015, 25, 779–786. [Google Scholar] [CrossRef]
  12. Chen, G.; Lin, Y. Stress-strain-electrical resistance effects and associated state equations for uniaxial rock compression. Int. J. Rock Mech. Min. Sci. 2004, 41, 223–236. [Google Scholar] [CrossRef]
  13. Li, N.; Zhao, H.; Yan, M.; Liu, Z.; Chen, P.; Cai, C.; Lan, X.; Huang, B. Temporal and spatial distribution characteristics of hydraulic crack propagation under true triaxial loading using the direct current method. Int. J. Rock Mech. Min. Sci. 2023, 168. [Google Scholar] [CrossRef]
  14. Song, D.; Liu, Z.; Wang, E.; Qiu, L.; Gao, Q.; Xu, Z. Evaluation of coal seam hydraulic fracturing using the direct current method. Int. J. Rock Mech. Min. Sci. 2015, 78, 230–239. [Google Scholar] [CrossRef]
  15. Liu, Q.; Song, D.; Qiu, L.; Xiao, Y.; Yin, S.; Peng, Y.; Cao, Y.; Wang, H.; Gao, L. An experimental study of the resistivity response on fracture process of sandstone with pre-existing flaw. Theor. Appl. Fract. Mech. 2022, 121, 103487. [Google Scholar] [CrossRef]
  16. Chen, P.; Wang, E.; Zhu, Y. Experimental study on resistivity variation regularities of loading coal. J. China Coal Soc. 2013, 38, 548–553. [Google Scholar]
  17. Qiu, L.; Dang, J.; Zhang, J.; Wang, M.; Liu, Q.; Si, L.; Jiang, Z.; Khan, M. Investigating nonlinear resistivity characteristics and mechanisms of coal during various loading stages. J. Appl. Geophys. 2025, 238, 105705. [Google Scholar] [CrossRef]
  18. Guo, H.; Qiu, L.; Liu, Q.; Yang, C. Research on visualization detection method of overlying strata three zones in thin coal seam mining. Saf. Coal Mines 2023, 54, 73–80. [Google Scholar]
  19. Wu, R.; Zhang, W.; Zhang, P. Exploration of parallel electrical technology for the dynamic variation of caving zone strata in coal face. J. China Coal Soc. 2012, 37, 571–577. [Google Scholar]
  20. Liu, S.; Wu, R.; Zhang, P.; Sun, X.; Xu, Z. High-density resistivity method for observing the destruction of overlying rock strata in coal seams. Coal Sci. Technol. 2001, 29, 18–19. [Google Scholar]
  21. Zhang, P.; Liu, S.; Wu, R.; Wu, R.X. Dynamic detection of overburden deformation and failure in mining workface by 3D resistivity method. Chin. J. Rock Mech. Eng. 2009, 28, 1870–1875. [Google Scholar]
  22. Li, J.; Xie, H.; Sun, Z. Response characteristics of direct current method advanced exploration in mine with water rich structural geological anomaly. China Energy Environ. Prot. 2021, 43, 51–56. [Google Scholar]
  23. Gao, W.; Wang, L.; Zi, J.; Han, T.; Guo, Y.; Wang, N. Simulation and application research on the advanced detection by the dipole-dipole device of the DC method in the excavation roadway. Prog. Geophys. 2024, 39, 412–420. [Google Scholar]
  24. Zhang, Y. Study on the Application of Mine DC Electric In-Advance Detection in Coal Mine Goaf. Master’s Thesis, Xi’an University of Science and Technology, Xi’an, China, 2015. [Google Scholar]
  25. Leucci, G.; Giorgi, D.L.; Scardozzi, G. Geophysical prospecting and remote sensing for the study of the San Rossore area in Pisa (Tuscany, Italy). J. Archaeol. Sci. 2014, 52, 256–276. [Google Scholar] [CrossRef]
  26. Zhou, K.; Yu, F.; Tan, Y.; Zhao, T.; Guo, W. In-situ investigation on fractured evolution law of surrounding rock in weakly cemented soft rock roadway. Energy Sources: Part A, Recovery, utilization, and environmental effects. 2021, 47, 1–13. [Google Scholar] [CrossRef]
  27. Li, G.; Ma, F.; Guo, J.; Zhao, H. Experimental research on deformation failure process of roadway tunnel in fractured rock mass induced by mining excavation. Environ. Earth Sci. 2022, 81, 243. [Google Scholar] [CrossRef]
  28. Wang, E.; Chen, P.; Li, Z.; Shen, R.-X.; Xu, J.-K.; Zhu, J.-F. Resistivity response in complete stress-strain process of loaded coal. J. China Coal Soc. 2014, 39, 2220–2225. [Google Scholar]
  29. Jolfaei, S.; Lakirouhani, A. Sensitivity Analysis of Effective Parameters in Borehole Failure, Using Neural Network. Adv. Civ. Eng. 2022, 1, 4958004. [Google Scholar] [CrossRef]
  30. Shen, B. Coal mine roadway stability in soft rock: A case study. Rock Mech. Rock Eng. 2014, 47, 2225–2238. [Google Scholar] [CrossRef]
  31. Liang, Z.; Tang, C.; Zhang, Y.; Ma, T. On probability model of physico-mechanical parameters of quasi-brittle materials and associated mechanical failure behaviors. Chin. J. Rock Mech. Eng. 2008, 27, 718–727. [Google Scholar]
Figure 1. YBD-16 type mine DC method tester.
Processes 13 01743 g001
Figure 2. Non-uniform geoelectric model.
Processes 13 01743 g002
Figure 3. Resistivity changes of typical coal samples under load damage.
Processes 13 01743 g003
Figure 4. Schematic diagram of “three zones” and principal stress distribution around the underground roadway.
Processes 13 01743 g004
Figure 5. Methods of laying out survey lines.
Processes 13 01743 g005
Figure 6. Results of the DC method test.
Processes 13 01743 g006aProcesses 13 01743 g006b
Figure 7. Comparison of the DCE test results with the geology around the roadway.
Processes 13 01743 g007aProcesses 13 01743 g007b
Figure 8. Law of variation of apparent resistivity with horizontal distance at different depths.
Processes 13 01743 g008
Figure 9. The “three bands” characterizing the distribution of apparent resistivity at different levels.
Processes 13 01743 g009
Disclaimer/Publisher’s Note: The statements, opinions and data contained in all publications are solely those of the individual author(s) and contributor(s) and not of MDPI and/or the editor(s). MDPI and/or the editor(s) disclaim responsibility for any injury to people or property resulting from any ideas, methods, instructions or products referred to in the content.

