1. Introduction
With the large-scale integration of a high proportion of renewable energy, mainly wind and photovoltaic power, the new power system is experiencing a paradigm shift from a centralized to a diversified structure [
1]. Driven by the “dual carbon” target, China’s installed capacity of renewable energy has exceeded 1.2 billion kilowatts, with wind and solar installations accounting for over 35%. However, the inherent intermittency and volatility of wind and solar power generation result in a significant mismatch between the system’s regulation capacity and the demand for renewable energy consumption. In 2024, the national average wind and solar power curtailment rate reached 3.1% and 2.0%, respectively [
2]. Meanwhile, the issue of grid stability caused by the strong dependence of the distributed generation systems on the distribution network is becoming increasingly prominent. Differently from the traditional power grid, which relies on centralized power generation and long-distance power transmission, the microgrid takes distributed energy sources and intelligent control as its core and enables flexible switching between grid-connected and islanded operation modes. By means of multi-energy collaboration, it improves the power supply reliability and the consumption capacity of renewable energy sources. It also combines economic efficiency with high operational efficiency. In this context, energy storage technology, which serves as a key support for achieving source–grid–load synergy, has become a crucial research direction in new power systems [
3,
4].
In the field of optimizing the capacity of wind and solar energy storage systems, scholars at home and abroad have made a series of breakthroughs. Reference [
5] constructs a PVE direct coupling system model, considering the dynamic adjustment characteristics of the electrolytic cell, and uses the traversal search method to achieve the optimal capacity configuration of the electrolytic cell. Reference [
6] uses auxiliary services that include peak shaving and flexible backup for electrical hydrogen capacity configuration. Reference [
7] proposes a strategy for coordinating the operation of multiple electrolytic cells to extend their service life and reduce economic costs, considering the economic feasibility of transporting hydrogen mixed into natural gas pipelines. Reference [
8] considers the low-carbon potential of virtual power plants and constructs an electric hydrogen capacity configuration model with system operating costs and carbon emissions as objectives. Reference [
9] clusters data into four scenarios, one for each season, for capacity configuration, and compares the economic benefits of the configured battery and P2H. Reference [
10] adopts a regional shared energy storage scheme and constructs a two-layer optimization model for multi-user groups in decentralized wind-power generation. Reference [
11] analyzes the levelized cost of hydrogen production and optimized capacity allocation considering fluctuating factors such as photovoltaic output, green certificate prices, and hydrogen demand. The above literature uses multi-objective optimization to configure capacity from the perspective of system configuration cost or benefit, so that the system can meet engineering requirements while maximizing economic benefits. Reference [
12] establishes an off-grid wind–solar combined hydrogen production system, considering the coordinated operation of electrolytic cells and energy storage modules for capacity configuration optimization. Reference [
13] establishes a framework for an electric thermal gas hydrogen integrated energy system, achieving energy coupling between electricity, heat, gas, and hydrogen. Reference [
14] uses fuzzy chance constrained programming to configure capacity by selecting appropriate confidence levels. Reference [
15] uses a two-layer optimization model to configure the capacity of a multi-energy complementary power generation system that includes electrochemical energy storage and pumped storage. Reference [
16] proposes a coordinated optimization method for electric–thermal–hydrogen energy storage capacity based on time-series production simulation for multi energy complementary power generation systems. The above literature provides multidimensional theoretical support for system capacity configuration based on aspects such as levelized cost analysis, multi energy complementary optimization, and confidence level selection.
However, the following key issues can still be found in the existing research: firstly, in terms of technical path, existing achievements generally focus on the traditional “source following load” mode for capacity optimization, which fails to effectively improve the autonomous operation capability of distributed systems and lacks breakthrough methods in reducing the dependence of distribution networks. Secondly, in terms of modeling dimensions, most studies default to wind and solar installed capacity as the known parameters, and do not establish a load-demand-driven wind and solar capacity collaborative configuration mechanism. Finally, in terms of system architecture, existing electric–hydrogen coupling systems mostly adopt a unidirectional energy conversion mode, which fails to fully utilize the flexible load bidirectional regulation characteristics of electrolytic cells and fuel cells. These limitations make it difficult for the existing capacity allocation methods to meet the urgent needs of new power systems for autonomous operation and flexible regulation of distributed energy. A comparison of the model proposed in this paper with recent research models is shown in the following
Table 1:
In response to the above issues, this article proposes an optimization configuration method for electric–hydrogen coupling capacity for grid connected distributed generation systems. Firstly, a distributed power generation system model for electric–hydrogen coupling is established. Based on the characteristics of combining electrolytic cells and fuel cells as flexible loads, a two-layer optimization model is constructed with the goal of minimizing the total lifecycle cost and operating process cost of the system. The capacity configuration of modules such as wind, solar, electrolytic cells, fuel cells, and hydrogen storage tanks is reasonably carried out. Based on meeting the load demand, the capacity of wind, solar, fuel cells, and hydrogen storage tanks is configured for electrolytic cells of different capacities. Finally, the grid-connected electricity and economic indicators of wind and solar power generation systems, before and after connecting to electrolytic hydrogen production with different capacities, are analyzed and compared through numerical examples, and the feasibility of the model is verified. The simulation results show that after adding the hydrogen production system, the peak value of electricity purchase and sale cost decreases, the income from electricity purchases and sales increases, and the level of wind and solar energy consumption in the system improves. This article’s research on the electric–hydrogen-coupled distributed power generation system is helpful in promoting the development of wind and solar power consumption, grid connection of distributed power generation systems, and application of hydrogen energy storage technology.
2. Electric–Hydrogen-Coupled Distributed Power Generation System
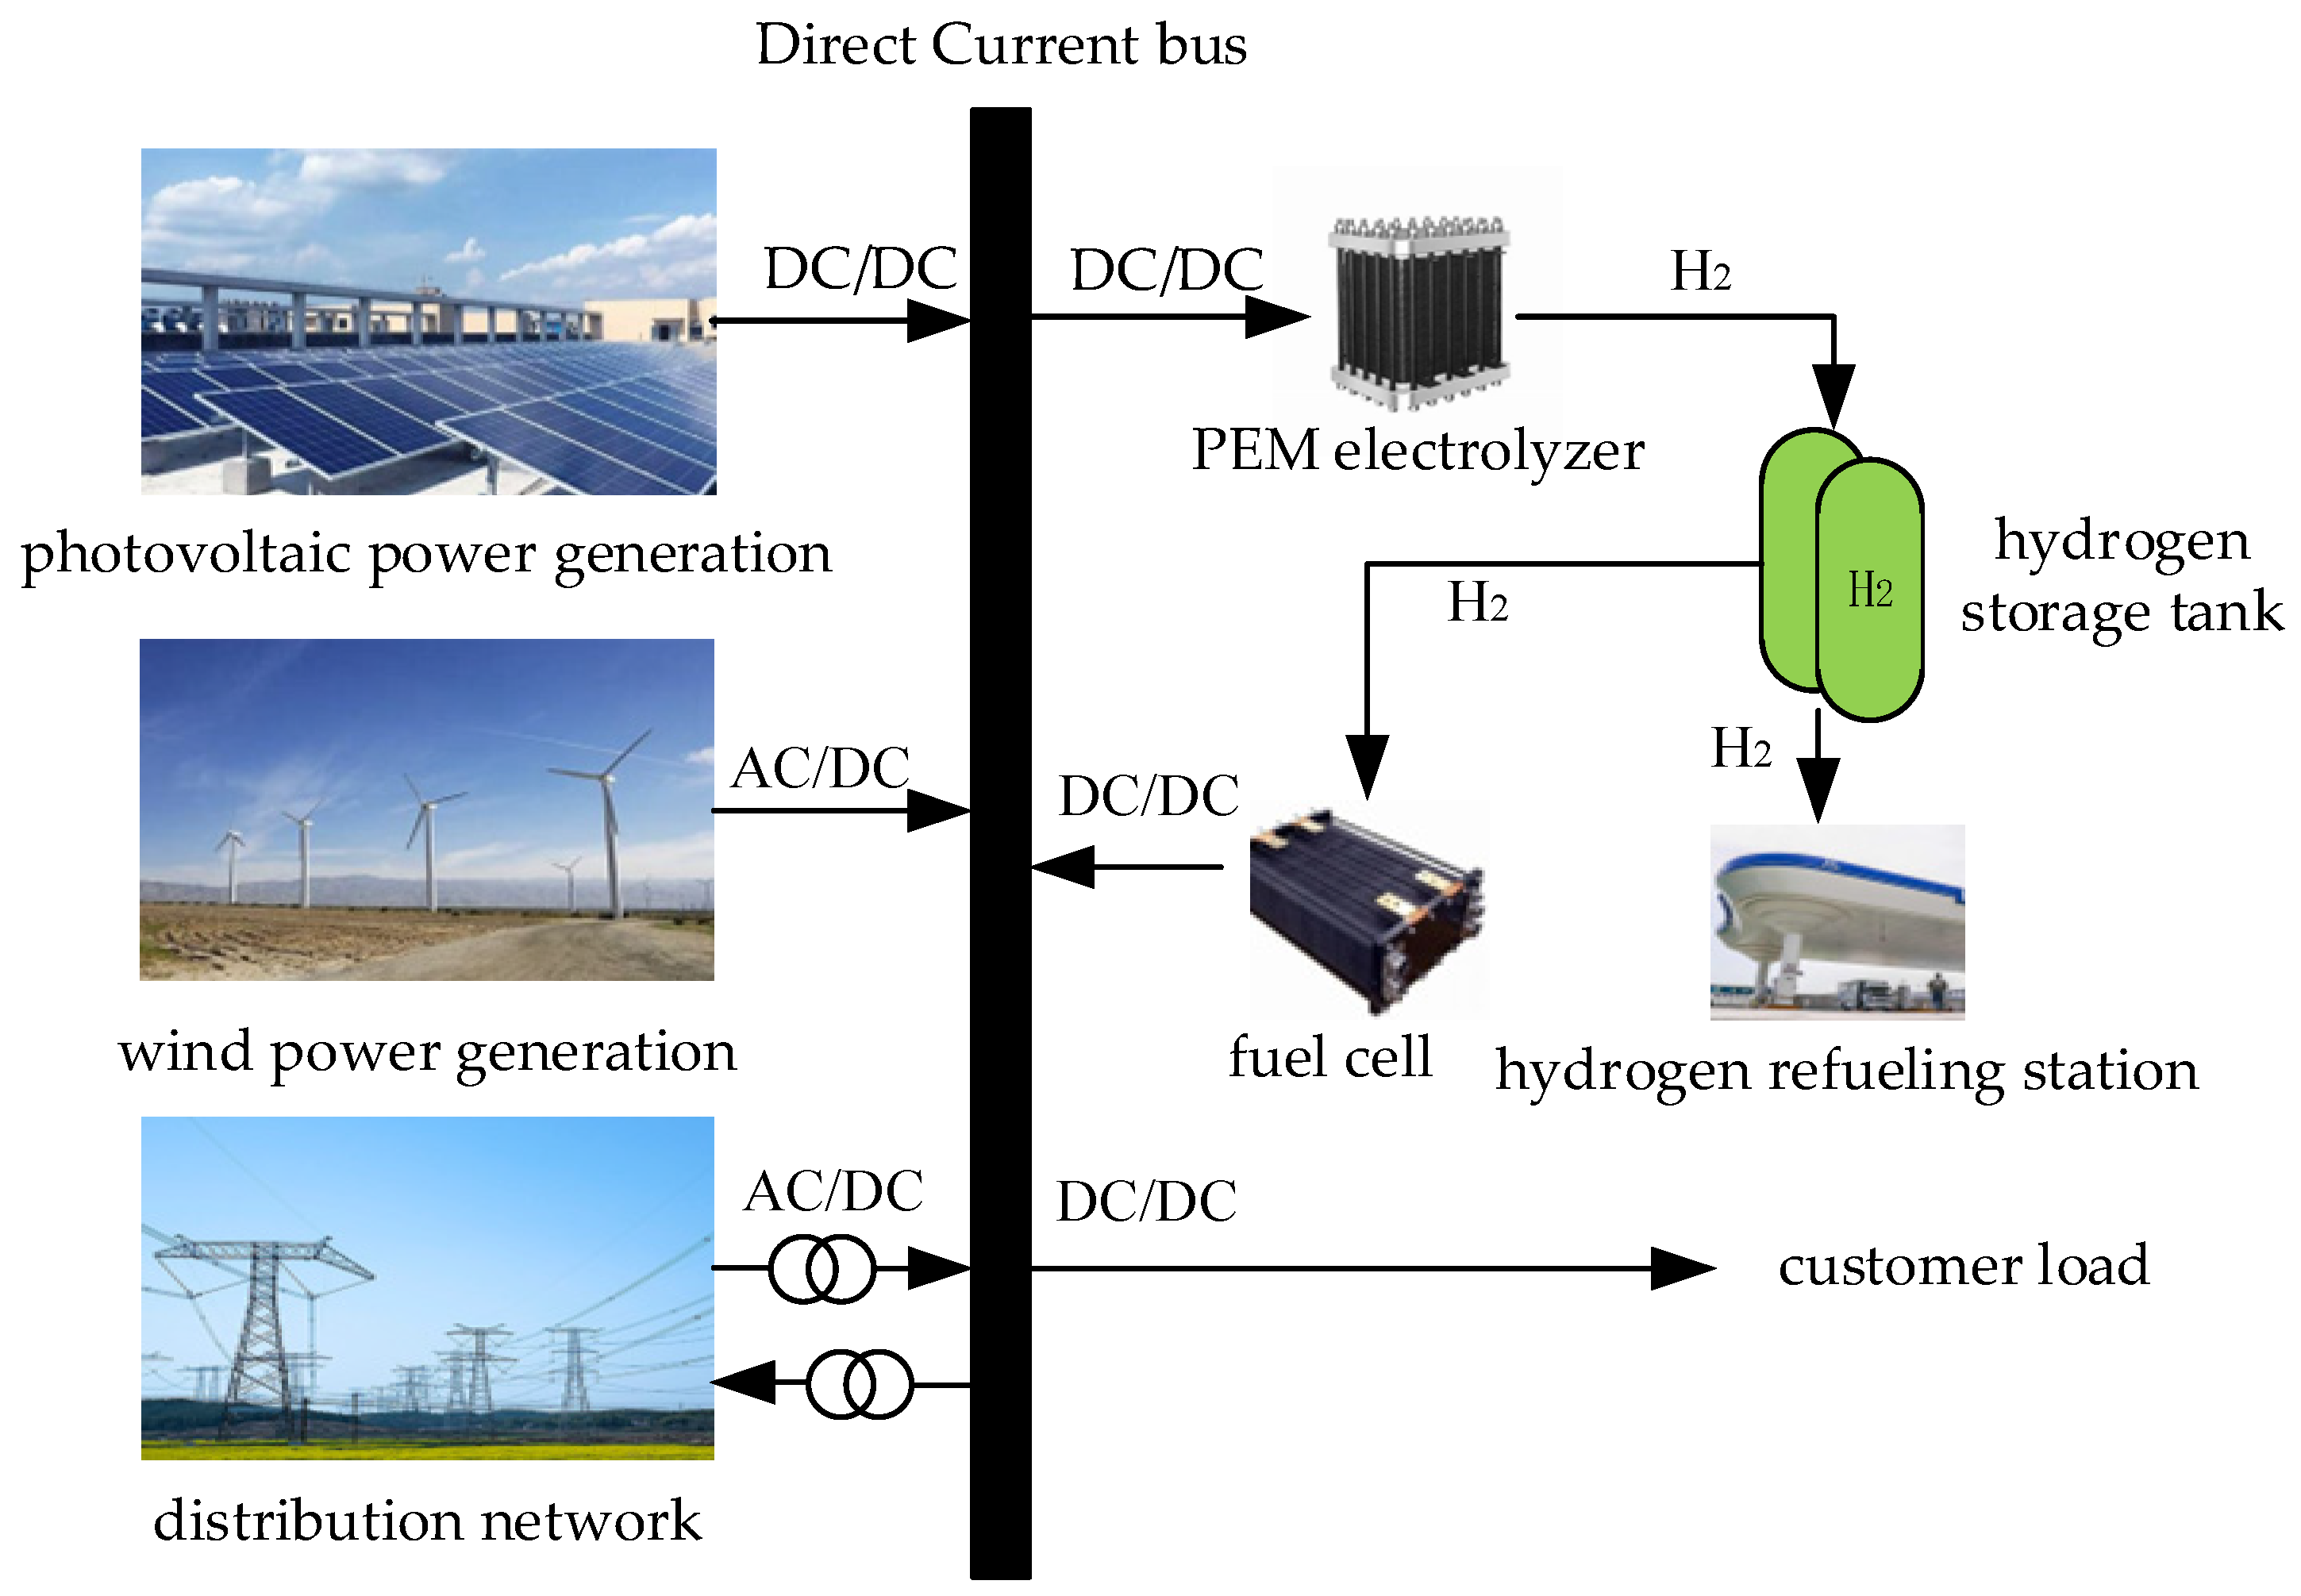
The electric–hydrogen-coupled distributed power generation system combines renewable new energy with electrolytic water hydrogen production technology, and addresses the mismatch between electricity supply and user load through grid connection, mainly including the wind-power generation system, photovoltaic power generation system, electrolytic water hydrogen production system, and fuel cell system. Among them, wind-power generation and photovoltaic power generation systems are influenced by the complementary characteristics of wind and solar energy resources in terms of time and season. The combination of the two ensures the continuity and stability of power supply [
17,
18]. The wind-power and photovoltaic-power generation systems are connected to the distribution network and jointly supply power to user loads and PEM electrolysis cells. The electrolytic water hydrogen production system consists of an electrolytic cell and a hydrogen storage tank. The system is combined with a fuel cell system and serves as a load during peak power generation periods and as a power source during low power generation periods, achieving peak shaving and valley filling of load energy demand and reducing the impact of random load fluctuations on the power grid. When the power generation system cannot meet the load demand, the output of fuel cells fills the gap in electricity, but still cannot partially supplement the electricity purchased from the grid; when the power generation system fully meets the load demand, the PEM electrolysis tank consumes excess electricity, and the generated hydrogen gas is compressed and stored in hydrogen storage tanks to provide fuel for fuel cells or for sale. The remaining electricity is sold to the power grid. In summary, the electric–hydrogen coupled distributed generation system not only achieves the maximization of wind and solar power consumption and economic benefits, but also plays a certain role in improving load demand fluctuations [
19], promoting the stability of system power supply (
Figure 1).
The output power of wind-power generation is related to wind speed and the radius of the wind turbine. The simplified equivalent model of wind-power generation can be expressed as
In the formula, is the density of air; S is the area swept by the turbine blades; is the wind speed; is the power coefficient, which represents the efficiency of the turbine in extracting energy from the wind, with an ideal value of 16/27.
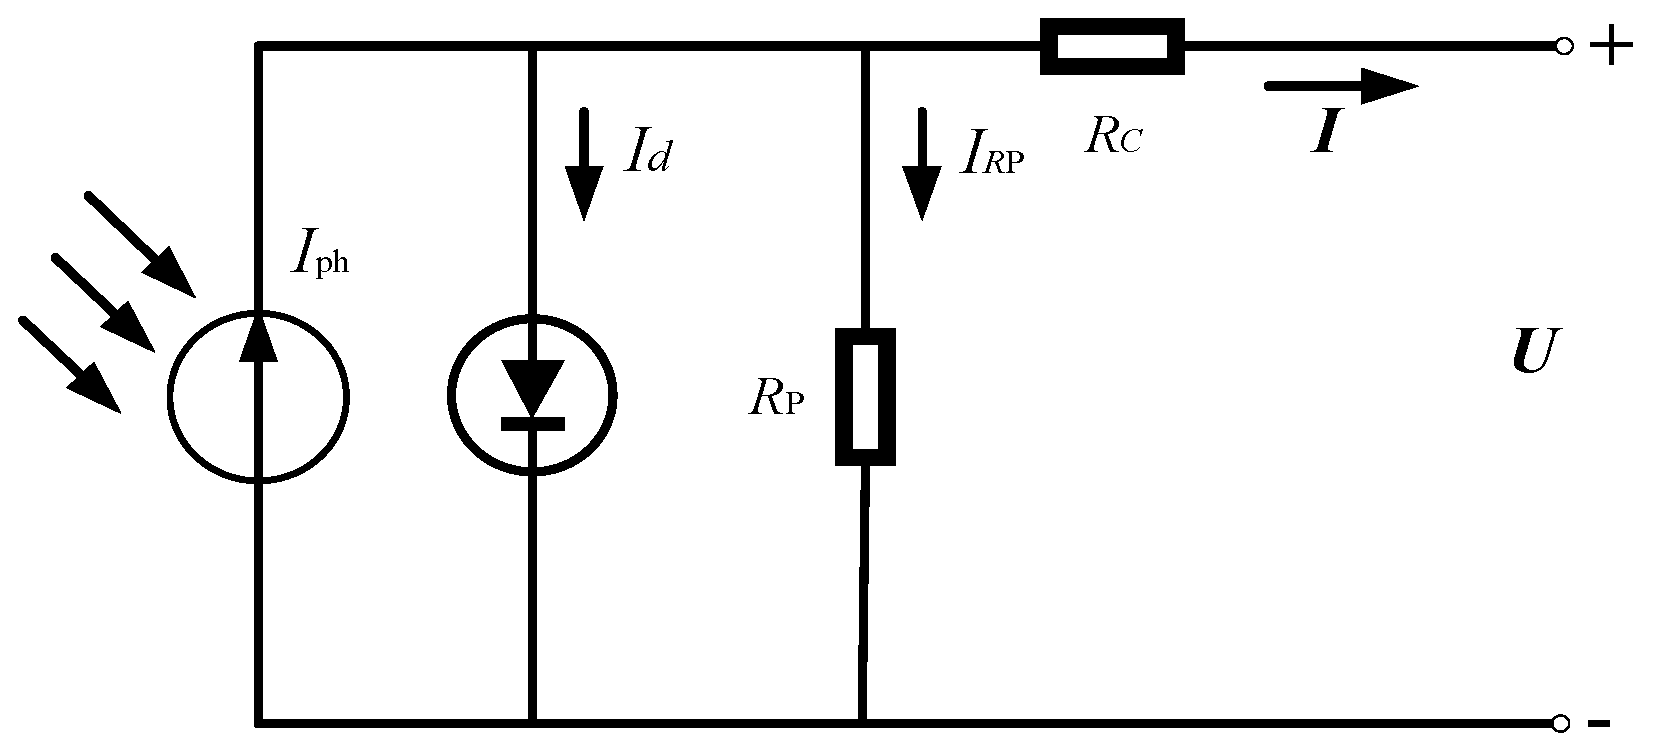
The electricity generated by photovoltaic output systems can be used to integrate into the grid, user loads, or electrolytic cells. The equivalent schematic diagram and corresponding theoretical formula obtained from the photovoltaic output characteristics are as follows in
Figure 2:
In the formula,
is the photo generated current;
is the diode current;
is the short circuit current of photovoltaic cells for solar panels under reference light intensity and temperature;
is the temperature coefficient;
is the temperature at which the solar panel operates;
is the temperature of solar panels under reference conditions;
is the reverse saturation current for diodes;
is the charge of an electron, with a value of
;
is the quality factor of the diode;
is the Boltzmann constant, with a value of
;
is the energy difference between the conduction band and valence band in semiconductor materials.
is the equivalent parallel resistance and
is the equivalent series resistance; in practical applications, the former usually has a large resistance value and the latter is usually very small [
20]. The simplified corresponding formula is as follows:
At present, the main technologies for hydrogen production through electrolysis of water in China include alkaline water electrolysis (AWE) and proton exchange membrane (PEM) electrolysis. The current density of PEM electrolysis cells is more than four times that of alkaline electrolysis cells, with advantages such as higher energy conversion efficiency, fast response speed, small size, and flexible operation [
21]. It also has great development prospects. A large electrolytic cell is composed of multiple small chambers, each of which includes a proton exchange membrane, a cathode plate, and an anode plate [
22]. The formula for calculating the power of an electrolytic cell is as follows:
In the formula, is the equivalent internal resistance of the electrolytic cell; is the leakage resistance of the electrolytic cell, which is affected by components such as the electrolyte, electrode materials, and the diaphragm separating the cathode and anode chambers; is the minimum voltage required for electrolysis of water, with a theoretical value of 1.23 V; 1.229 represents the theoretical decomposition voltage of water under standard conditions; represents the change in voltage when the temperature deviates from the reference temperature by 1 °C; represents the thermodynamic correction term coefficient in the Nernst equation, which reflects the thermodynamic influence of temperature and gas partial pressure on the electrolysis voltage. is the concentration overvoltage of the electrolytic cell, which is caused by the voltage loss due to the concentration gradient of reactants or products in the electrolyte. is the activation overvoltage, which represents the additional energy overcome during the electrochemical reaction process; is Ohmic overvoltage, which is the voltage loss caused by the internal resistance of the electrolyte, that is, the Ohmic loss generated when current passes through the electrolyte. and are, respectively, the working current and working voltage of the electrolytic cell; is represent the current density; is indicates the effective area of the electrode in the electrolytic cell. is the operating temperature of the electrolytic cell; is the ambient temperature, and , , are the partial pressures of hydrogen, oxygen, and water.
Fuel cells consume hydrogen to generate electricity, supplementing the user’s shortfall in electrical energy [
23]. The calculation formula for fuel cell voltage is shown in Equation (12)
In the equation, is the gas constant; is the environmental temperature; is the number of electron transfers, in hydrogen fuel cells is 2; is faraday’s constant; is the partial pressure of hydrogen in fuel cells; is the partial pressure of oxygen in fuel cells. In practical engineering, the operating voltage of fuel cells is lower than the ideal voltage, is the activation overvoltage of fuel cells; is the ohmic overvoltage for fuel cells; is the concentration overvoltage.
3. Double-Layer Capacity Configuration Optimization Model for Electric–Hydrogen Coupled Distributed Power Generation System
This article establishes a dual layer capacity configuration optimization model for an electric–hydrogen coupled distributed power generation system. The upper-level optimization model mainly takes into account configuration and operation costs, and its objective function is to minimize the total life-cycle cost. Intelligent algorithms are used to solve the optimal capacity configuration for wind–solar–hydrogen power storage; the lower level is based on the solution results of the upper level, mainly considering the costs of wind, solar, and hydrogen abandonment, and electricity purchase and sale during the system operation process. With the objective function of maximizing the system operation process benefits, the upper level solution results are optimized through the commercial solver CPELX 2022b for scheduling.
3.1. Upper-Level Capacity Configuration Optimization Model
The upper-level optimization model combines the full lifecycle configuration cost of the system and the operation and maintenance cost during the system operation process, involving the average annual investment cost and operation and maintenance cost of each module, as well as equipment disposal cost. The objective function is shown in Equation (14)
In the formula,
represents the annual average configuration cost,
represents the cost of equipment, and
represents the operational costs.
In the formula, , , , , and represent the unit investment costs of photovoltaic modules, wind-power modules, electrolytic cell modules, fuel cell modules, and hydrogen storage tank modules; , , , and represent disposal costs per unit capacity for photovoltaic modules, wind-power modules, electrolytic cell modules, fuel cell modules, and hydrogen storage tank modules, respectively; , , , , are the installed capacity of photovoltaic modules, wind-power generation, electrolytic cells, fuel cells, and hydrogen storage tanks; N represents the last year of device usage, with a value of 25 in this article; representing the benchmark discount rate, for which this article assumes 3%. is the operating and maintenance cost for the nth year; is the nth year interest, and r is the annual interest rate.
3.2. Lower-Level Capacity Configuration Optimization Model
The objective function of the lower-level model is to minimize the system’s operating cost. In order to reduce the occurrence of hydrogen and power shortages, penalty costs are also introduced for hydrogen production and power shortages. Based on the capacity configuration results of the upper-level objective function, the lower level calculates the system’s operating process benefits and feeds them back to the upper level for further optimal capacity configuration.
In the formula, represents the cost of hydrogen abandonment; represents the cost of energy abandonment; represents the cost of purchasing electricity , , represents the amount of abandoned hydrogen, abandoned energy, and purchased electricity at time t , , represents the costs of hydrogen abandonment, energy abandonment, and electricity purchase at time t, respectively.
3.3. Mathematical Model of Constraints
In the formula, , , , , and respectively represent wind-power output, photovoltaic-power output, fuel cell output, electrolytic cell output, purchased and sold electricity, and load demand.
- 2.
Constraints on the Installed Capacity of Each Module
The power generation output of wind turbines is affected by climate, wind speed, and other conditions. This article constrains the installed capacity of wind turbines based on their typical output curves.
In the formula, represents the minimum output of the fan; represents the maximum output of the fan.
The output of photovoltaic power generation is affected by conditions such as solar radiation intensity, tilt angle of photovoltaic modules, and temperature. This article constrains the photovoltaic installed capacity and its typical output curve.
In the formula, represents the minimum output of photovoltaics; represents the maximize the output of photovoltaics.
Electrolytic cells and fuel cells cannot operate simultaneously, and start–stop constraints are imposed through start stop signs while meeting output constraints.
- 3.
In the formula, represents the maximum output of the electrolytic cell; represents maximum output of fuel cells , represents the start stop signs for the electrolytic cell and fuel cell which are set to 1 for starting and 0 for stopping. Adding less than 1 means that both are not allowed to be in the startup state at the same time.
- 4.
Other constraints
In the formula, represents the hydrogen consumption of the user at time t; represents the amount of hydrogen gas flowing into the hydrogen storage tank at time t; represents the output of electrolytic cell at time t; represents the hydrogen consumption of fuel cells; represents the amount of abandoned hydrogen; represents the amount of hydrogen stored in the hydrogen storage tank per unit time; represents the amount of hydrogen flowing out of the hydrogen storage tank per unit time; and represents the initial hydrogen storage capacity of the hydrogen storage tank. represents the amount of hydrogen in the hydrogen storage tank at time t is constrained by the remaining amount of hydrogen at time t – 1 and the amount of hydrogen flowing into and out of the electrolytic cell at time t. The capacity of the hydrogen storage tank is constrained by the initial capacity and maximum capacity of the hydrogen storage tank.
3.4. Optimize the Overall Structure of the Model
The capacity configuration optimization model of the electric–hydrogen coupled distributed power generation system constructed in this article is a two-layer model, which is solved through upper and lower layer coupling calculations. The upper layer solves the problem through intelligent algorithms and passes the obtained capacity configuration to the lower layer. The lower level model contains numerous constraints and variables, forming a composite nonlinear structure. Based on the constraints, the lower layer optimizes the scheduling using the YALMIP toolkit in MATLAB 2022b and Cplex 2022b solver. The calculated system operating costs are fed back to the upper layer for iterative optimization, ultimately obtaining the optimal capacity configuration for the electric–hydrogen coupled distributed generation system. The schematic diagram of the double-layer optimization model in this article is shown in
Figure 3.
4. Case Study Simulation Analysis
4.1. Data Introduction
This paper takes the annual solar irradiance and wind—speed data of a certain region in northern China as an example. The sampling interval is 1 h, as shown in
Figure 4. Considering the impact of the volatility of wind and solar power generation on the system, a comparative analysis of the comprehensive operation cost and economic benefits of the system is carried out. The model predicts the output of wind and solar power based on wind speed data and solar radiation intensity data, and realizes the hourly matching between power generation and load through optimal capacity configuration. To facilitate the calculation, the wind and solar power output data of a typical 24 h day are selected for wind and solar power output prediction. In the case study, the peak load of the region is 3 MW, which meets the daily electricity load demand of users.
The equipment costs mentioned in the article include investment costs, operation and maintenance costs, disposal costs, and on grid electricity prices. Among them, the initial investment cost of the hydrogen storage tank is about 35,000 CNY/kg, the average annual operation and maintenance cost is about 150 CNY/(kg × year), and the disposal cost is about 700 CNY/kg. The hydrogen gas generated by the electrolytic cell is stored in a hydrogen storage tank for fuel cell power generation, and the excess hydrogen gas is sold for a profit of 35 CNY/kg [
24]. The costs of other equipment are shown in
Table 2.
To verify the feasibility of the configuration-optimization model for the electricity–hydrogen coupled distributed power generation system constructed in this paper, this paper optimizes the capacity configuration of modules such as wind-power, photovoltaic, fuel cells, and hydrogen storage tanks according to the different capacities of the electrolytic cell, while satisfying the load demand, and sets up the following schemes for comparative analysis.
Option 1: Only consider wind- and solar-power generation and the power grid to supply power to users.
Option 2: Connect electrolytic cells of different capacities, hydrogen storage tanks, and fuel cell modules on the basis of wind and solar power generation and grid power supply for users.
Compare the capacity configuration and economic benefits of wind-power, photovoltaic, electrolytic cell, fuel cell, and hydrogen storage tank modules under different schemes [
25].
In the formula, represents the revenue from selling hydrogen , , represents the sales revenue of wind-power, photovoltaics, and fuel cells, respectively; represents the cost of energy abandonment.
4.2. Analysis of Capacity Configuration Results
The capacity-configuration optimization model of the electricity–hydrogen coupled distributed power generation system constructed in this paper is a two-layer model used to simulate the above-mentioned scheme. The capacity configuration results are shown in
Table 3.
- (1)
Option 1: Only consider wind- and solar-power generation and the power grid to supply power to users
Figure 5 shows the capacity configuration results without adding a hydrogen production module. During the daytime, from 10:00 to 17:00, wind- and solar-power generation fully meets the load, and excess electricity is sold to the grid. At night, if the wind- and solar-power generation is insufficient, electricity can be purchased from the grid to supplement the user’s electricity shortage. From 20:00 to 24:00, the user load is relatively high, but wind and photovoltaic power generation are low, and the peak purchased electricity reaches about 2000 kW. The photovoltaic output reached its peak from 13:00 to 16:00, and the peak electricity sales reached about 4000 kW, causing a great impact on the power grid.
From
Figure 5, it can be observed that during the period of sudden increase in wind-power output (14:00–16:00), there is a delay of about 15 min in the power response of the grid, resulting in a wind curtailment rate of 15.4% (427 kWh), exposing the dynamic response defect of one-way regulation. The overall efficiency of the system significantly decreases with running time, with an initial efficiency of 82% dropping to 68% after 6 h. The net power curve shows severe fluctuations within the day, with a standard deviation of 1.74 MW, exceeding the safety threshold of the power grid by 83%. Especially during peak load periods, an additional 1.8 MW of electricity needs to be purchased, highlighting the problem of high dependence on the power grid.
- (2)
Option 2: Connect different electrolytic cells, hydrogen storage tanks, and fuel cell modules
Figure 6 shows the output power status of each unit after adding the hydrogen production module for capacity configuration. The main power supply is provided by wind-power generation and photovoltaic power generation. At night, from 19:00 to 7:00, there is no sunlight, and wind-power alone is not enough to meet the load demand. Hydrogen energy is consumed by fuel cell output, and the part that still cannot meet the power supply needs is purchased from the grid, with a peak purchase power of about 1600 kW; During the daytime, from 9:00 to 18:00, wind and photovoltaic power generation fully meet the load demand. At this time, the electrolytic cell outputs electricity and consumes surplus electricity through hydrogen production. The electricity is converted into hydrogen energy and compressed and stored in hydrogen storage tanks to provide energy for fuel cells. If there is still surplus electricity, it is sold through the power grid, with a peak sales power of only 2300 kW.
Figure 6 verifies the technological breakthrough of the bidirectional regulation system in this article. During the same period of fluctuation in wind and solar power, the electrolytic cell and fuel cell responded synergistically, reducing the wind curtailment rate to 3.1% and shortening the power tracking delay to within 3 min. The system efficiency remains stable within the range of 79–83%, with a significant reduction in the standard deviation of net power fluctuations to 0.62 MW. During the midday wind-power ramp up period, the fluctuation amplitude is compressed by 62%, and during the evening peak period, hydrogen energy is released to reduce the power purchase demand by 66.7%, achieving an autonomous operation mode of “high consumption low dependence”.
When comparing
Figure 5 and
Figure 6, it can be seen that the addition of flexible loads consisting of electrolytic cells, hydrogen storage tanks, and fuel cells in the system promotes the level of wind and solar power consumption, reduces peak electricity purchases and sales, and plays a key role in balancing user load fluctuations. Comparing the configuration results of different capacity electrolytic cell scenarios, it can be seen that as the electrolytic cell capacity increases, the hydrogen production also increases, and the wind and solar capacities also increase accordingly. At the same time, the configuration cost also increases, and the hydrogen consumption of fuel cells increases. When connecting to a 5 MW electrolytic cell, there is a phenomenon of energy abandonment, resulting in a decrease in the economic coefficient. The configuration results indicate that the region has the best economic benefits when connected to a 4 MW electrolytic cell. The specific optimization effects are shown in
Table 4.
Comparing the two schemes, it can be found that Scheme 2 outperforms conventional systems in terms of core performance: wind-power consumption rate increases by 51.4%, efficiency stability increases by 73.4%, and grid dependence index decreases by 69.1%. At the 15:00 wind-power mutation moment, Scheme 2 absorbed 2.4 MW of fluctuating energy through bidirectional power balance within 5 min, while Scheme 1 only processed 0.9 MW, exposing a 1.5 MW regulation gap. In addition, Plan 2 provides an advantage that traditional systems cannot achieve by endowing the system with new capabilities to cope with weekly/monthly fluctuations while ensuring intraday adjustments.


