Abstract
This study investigated the combustion profiles and oxidation mechanisms of coke on spent FCC catalysts from two Sinopec refineries and compared the effects of O2/N2 and O2/CO2 atmospheres. Using the Coats–Redfern method combined with nonlinear regression, the kinetics of coke oxidation were analyzed for the activation energies derived from the modified D3 and F2 models. Both these models yielded results that agreed with the previous reports. Selection of the suitable kinetic model was significantly influenced by specific properties of the coke on spent FCC catalysts. Furthermore, a computational model revealed that on an industrial scale, external mass transfer predominated the intrinsic kinetics; the differences observed in the O2/N2 and O2/CO2 environments were primarily due to variations in oxygen diffusion. These findings highlight the potential of optimizing FCC catalyst regeneration processes through alternative oxidation environments and the use of catalytic additives.
1. Introduction
The kinetics of coke oxidation has been a longstanding subject of scientific investigation, particularly in the context of combustion profiles for materials with distinct structural properties, such as zeolites, coal, and various biomass materials. Coke oxidation plays a pivotal role in industries involving cement production, power generation, and fluid catalytic cracking (FCC). Globally, 4–6% of total CO2 emissions can be attributed to oil refineries, with FCC units contributing 20–35% of these emissions [1]. In FCC units, the regenerator is the largest source of CO2 emissions primarily because of combustion reactions.
To address environmental concerns related to excess CO2 emissions, there is increasing interest in studying coke oxidation kinetics in alternative environments such as dry/wet O2/CO2, O2/He, and pure CO2. These alternative atmospheres have demonstrated significant potential to mitigate CO2 emissions and improve the overall environmental impact of coke oxidation. Replacing N2 with CO2 in the regeneration process influences combustion behavior owing to differences in heat capacity and reactivity, potentially leading to more sustainable oxidation processes [2]. Furthermore, CO2 can actively contribute to coke removal through the Boudouard reaction. Recent techno-economic evaluations by Tang et al. [3] suggest that implementing oxy–fuel combustion strategies could revolutionize the refinery industry. Complementary studies, such as those by Erdoğan and Güleç [4] on oxy–fuel hydrodynamics in FCC regenerators and by de Mello et al. [5] on tuning operating conditions for oxy–fuel modes, further confirm the feasibility of these approaches for improvement of FCC regeneration processes. Additionally, studies on FCC catalyst regeneration under oxy–fuel combustion conditions have demonstrated promising structural stability in relation to that achieved via conventional air-firing processes [6].
Conventional FCC regeneration involves an exothermic environment, which can cause catalyst deactivation after repeated cycles. Implementing O2/CO2 environments offers the potential to control catalyst temperature profiles, mitigating the risk of deactivation temperatures due to the endothermic contribution of the Boudouard reaction [7]. Selecting appropriate regeneration environments can therefore extend the lifespan of FCC catalysts and enhance their thermal stability.
Several studies have sought to elucidate the kinetics of coke oxidation and gasification over FCC catalysts by analyzing combustion profiles. Minh et al. and Li et al. [8,9] investigated FCC catalysts under O2/N2 conditions, verifying H/C ratios and detailing the kinetics of coke oxidation steps. Similarly, Kanervo et al. [10] compared three different kinetic models, all of which effectively described their experimental data. More recently, research on the regeneration kinetics of reforming catalysts reported activation energies of 52.61 and 128.62 kJ/mol for soft and hard coke, respectively [11].
Laboratory-scale experiments conducted by Santos et al. [12] on oxy-firing regeneration under O2/CO2 conditions demonstrated the occurrence of the Boudouard reaction in the presence of O2, depending on the coke functionality. They successfully modeled the reaction using a first-order kinetic approach. Pereira et al. [13] explored the effect of metals on oxy-firing regeneration, showing that V promotes the Boudouard reaction within a temperature range of 600–800 °C, reducing the activation energy from 242 to 193 kJ/mol. The addition of alkaline-earth metals alongside V further decreased activation energy, indicating enhanced reaction activity. Li et al. [14] analyzed the structural changes in coke during O2/CO2 combustion (0–10% O2 in CO2, 510–1000 °C), demonstrating that CO2 reactivity correlates with temperature, with high-temperature CO2 effectively reacting with lighter coke. Furthermore, Tang et al. [15] explored coke evolution during the air- and oxy-firing regeneration of a spent Ni/ZnO sulfur adsorbent, showing that more effective conversion can be achieved upon O2/CO2 combustion, possibly owing to the gasification reaction.
The Coats–Redfern method has proven to be a reliable approach for investigating kinetics in various environments, providing critical insights into the influence of O2/N2 and O2/CO2 atmospheres on coke combustion and CO2 emissions. Nonlinear regression is also widely employed as a complementary technique to the Coats–Redfern method [16,17,18]. Additionally, theoretical modeling and computational simulations offer valuable insights into reaction pathways, contributing to the optimization of alternative oxidation processes [19,20,21,22,23,24,25,26,27]. Chang et al. [20] examined regenerator performance under air-firing conditions by assuming the external diffusion neglection. More recently, Tang et al. [22] conducted an industrial-scale computational fluid dynamics (CFD) modeling study of oxy–fuel combustion in an FCC regenerator that considered external diffusion; however, the model omitted the complete oxidation step. Furthermore, they did not report the oxygen consumption and coke oxidation rate, which would have elucidated the significance of the external diffusion assumption.
Despite this previous research, the kinetics of coke oxidation in O2/CO2 environments—particularly the mechanisms influencing the structural properties of FCC catalysts—remain unclear. Although previous studies typically determined the reaction mechanisms and rate constants at various temperatures and gas compositions through experimental studies, computational analyses have been rarely conducted to support the experimental findings.
In this study, both the Coats–Redfern method and nonlinear regression were utilized to compare the kinetics of coke oxidation in different regeneration environments and to identify the most suitable kinetic model for FCC catalyst regeneration. Given the low coke content of spent FCC (SFCC) catalysts and their complex porous structure, this study aimed to elucidate the most reliable reaction mechanism for coke oxidation over FCC catalysts. Moreover, our study conducted computational analysis to assess the influence of external mass transfer limitations. This integrated approach aimed to address the abovementioned knowledge gaps, ultimately guiding future in-depth analyses of FCC regeneration in oxy–fuel combustion modes.
2. Materials and Methods
2.1. Characterization Techniques
Two distinct industrial spent catalysts were acquired from different Sinopec refineries in China, each utilized under the varying operating conditions outlined in Table 1. Materials acquired from the industry, which are exposed to real FCC conditions, are expected to produce more reliable results, including an authentic residue content, than those synthesized in the laboratory, which may not undergo the industrially relevant coke oxidation mechanism. Typically FCC catalysts consist of an aluminum silicate zeolite matrix with an average size of 75–90 µm, which imparts a porous structure to the catalyst that is essential for the FCC process. In this study, the following characterization techniques were used to investigate coke deposition over FCC catalyst surfaces:

Table 1.
Operating conditions of the catalyst refineries [28].
- Elemental analysis (EA): EA was used to determine the elemental content of the catalysts, including their C, N, H, and S content ratios.
- X-ray fluorescence (XRF): XRF analysis was used to investigate the metallic and nonmetallic elements in the catalysts. Several key catalyst components, such as aluminum oxide (Al2O3), silicon dioxide (SiO2), iron (III) oxide (Fe2O3), nickel oxide (NiO), lanthanum oxide (La2O3), and cerium oxide (CeO2), were identified by this method.
- X-ray photoelectron spectroscopy (XPS): XPS was used to analyze the chemical states of the elements on the catalyst surface. By deconvoluting the C 1s profile, different types of carbon species bonded to various elements (such as H, N, O, and S) were identified.
The aforementioned characterization techniques were used to comprehensively analyze the catalyst properties and understand the combustion dynamics and coke deposition under different operating conditions. Subsequent sections discuss the methods used in this study and their findings.
2.2. Experimental Setup
The temperature-programmed oxidation method was used to investigate the oxidation kinetics of CO and CO2 during coke combustion. Various experimental parameters were carefully considered to ensure compatibility with kinetic modeling techniques:
- Sample preparation: FCC catalyst (2 g) was introduced into the reactor with no pre-treatment to record the full combustion profile considering various coke contents.
- Heating procedure: The sample was gradually heated up to 1000 °C at a rate of 10 °C/min.
- Gas flow: The experiments were conducted under O2/N2 or O2/10% CO2/N2 flow at the rate of 200 mL/min; the gas compositions used are listed in Table 2.
Table 2. Operating conditions for combustion.
- Oxygen partial pressures: Different oxygen partial pressures were applied and balanced with the predominant gas (N2).
Table 2 summarizes the combustion operating conditions used in this study, and Figure 1 shows a schematic of the combustion experiments.
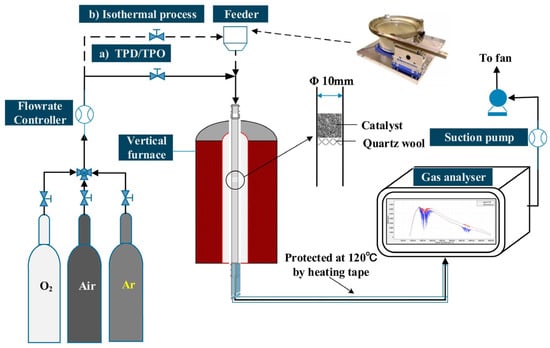
Figure 1.
Schematic of the combustion experiment (adapted from Li et al. [28]).
2.3. Computational Setup and Assumptions
The geometry of our model was adopted from prior studies employing similar dimensions, which in turn adopted the dimensions from [20,22]. Ansys Fluent 2022 R1, CFD modeling software, was used to generate an industrial fluidized-bed regenerator with a capacity of 70,000 tons year−1, as illustrated in Figure 2. Our case model is adapted from the recent study by Tang et al. [22], using their modeling approach and operating conditions and a comparable testing grid, as described in detail in Notes S.1.1–S.1.3.
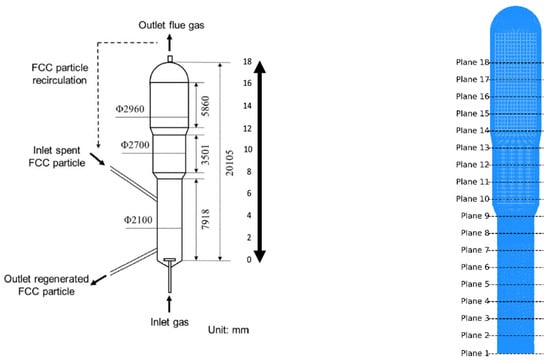
Figure 2.
Schematic of the FCC regenerator (adapted from Tang et al. [22]).
To model the regeneration kinetics, the heterogeneous combustion of both coke and hydrogen must be considered, as these processes are pivotal in both combustion environments. Furthermore, coke gasification reactions with CO2 and H2O also occur within the model. FCC regeneration may be carried out in either partial or full regeneration modes. In partial regeneration, only CO participates in the combustion process, following the approach proposed by Tang et al. [22]. However, the present study includes both CO and CO2 to capture the full scope of the regeneration process, particularly when CO promoters are present, which is now a common practice in modern FCC regenerators [19], whereas Tang et al. assumed the absence of these promoters. All kinetics equations and assumptions are provided in Note S.1.4.
3. Results and Discussion
3.1. Overview of the Combustion Process and Data Processing Approach
The combustion mechanisms in both environments used in this study exhibit similar reaction pathways. In an O2/N2 atmosphere, the coke oxidation mechanism can be expressed by Equations (1) and (2). On introducing CO2, the Boudouard reaction, expressed by Equation (3), is integrated into the mechanism. The Boudouard reaction represented by Equation (3) is an endothermic process that occurs at temperatures exceeding 800 °C [29]. Despite its endothermic nature, this reaction exhibits high potential to contribute toward coke oxidation by facilitating coke removal owing to the higher reactivity of CO2 with carbon particles than N2. However, the progress of this reaction remains uncertain because O2 reacts faster with carbon than with CO2, particularly upon introducing Pt into the system:
C(s) + O2(g) → CO2(g) − 395.4 kJ/mol,
C(s) + ½O2(g) → CO(g) − 110.4 kJ/mol,
C(s) + CO2(g) → 2CO(g) + 172 kJ/mol.
To investigate the kinetics, the conversion rate of the solid material was determined using Equation (4). This equation utilizes the conversion term derived from Equation (5), assuming the complete elimination of coke during the combustion test. This assumption was applied to the datasets in this study according to a previously published study [30]:
The various reaction models shown by F(X) are summarized in Table 3, providing a comprehensive framework for understanding the kinetics of the process under investigation [31]. The kinetic parameters, including the activation energy (Ea) and pre-exponential factor (A), are denoted as k(T) in Equation (6), and the gas constant R is 8.314 J/mol, which provides an essential context for the calculations. The integration of Equation (7) at a constant heating rate yields Equation (8), which comprises an integral component of the analytical framework used for assessing the system kinetics. This integration enables an in-depth analysis of the temperature–reaction rate relationship, providing insight into the underlying mechanisms governing the combustion process. The Coats–Redfern method, which is discussed later, is based on Equation (8), while nonlinear modeling is based on Equation (7) [32]:
Table 3.
Classification of model-fitting kinetic expressions for reaction mechanisms [31].
The Coats–Redfern technique can be used to determine the kinetic parameters of single heating experiments. Widely used in elucidating the kinetics of the thermal decomposition of biomass, this method utilizes models from the literature that delineate the diverse reaction mechanisms inherent in heterogeneous gas–solid reactions. Therefore, the Coats–Redfern technique was used to elucidate the kinetic triplet governing the reaction under investigation. Equation (9) represents the Coats–Redfern equation; the slope of the ln g(X) versus 1/T curve can be used to calculate the activation energy at a single heating rate, while the pre-exponential factor can be calculated from the y-intercept. Here, the determination coefficient R2 was used to assess the efficacy of model fitting.
In addition to the Coats–Redfern method, this study employed another fitting approach involving nonlinear fitting supported by the THINKS software reported by Nikita [33]. This approach used the Runge–Kutta method for minimization and recommends the use of multiple heating rate experiments to ensure reliable results. However, owing to constraints related to the limited availability of spent catalyst samples, single-heating-rate experiments were conducted in this study using the flexible model represented by Equation (10) and various diffusion models:
The kinetic model provides preliminary insights into identifying the most suitable reaction mechanism, as summarized in Table 3. A key advantage of the nonlinear method is that it avoids the linearization steps. Equation (10) provides a generalized kinetic model that represents various established kinetic control models. The parameters q, n, and m are highly dependent on the reaction mechanism. For instance, the nth-order model is a candidate for the kinetic modeling in our study, where n would approach a value close to 1,2, or 3, while m and q would be zero because the autocatalytic process is neglected in the coke oxidation process. Diffusion models differ slightly, as they account for the geometrical assumptions. For instance, the Jander model, D3, describes the diffusion in three-dimensional spherical geometry, where the reaction progresses inward as a shrinking core within a sphere. Thus, this establishes the parameters q, n, and m for the D3 model as 1, 2/3, and −1/3, respectively. In this study, we have introduced a slight modification to the D3 model by introducing variability to the parameter n while keeping the other parameters the same.
The efficacy of this approach was validated by minimizing the residual standard error (RSE) and comparing it with the Coats–Redfern method, which requires only a single heating rate. This comparison ensured consistency and reliability in the results.
3.2. Material Characterization
The FCC catalysts obtained from Sinopec refineries were analyzed by various material characterization techniques. As shown in Table 4, the coke content of the FCC catalysts used in this study was consistent with the typical coke content of SFCC catalysts (0.5–2%) [34]. Furthermore, SFCC-4 showed a higher H/C ratio than SFCC-2, potentially leading to slight variations in the combustion profile. However, the differences between the two catalysts were not considered significant because their combustion profiles and kinetics were comparable. The FCC catalysts can constitute either soft coke or hard coke. Based on our TPO and Figure 3, it was observed that only hard coke was present as oxidation occurred above 300 °C. This observation will help in the kinetic comparison in the subsequent sections.
Table 4.
CHNS and oxide contents determined via EA and XRF, respectively.
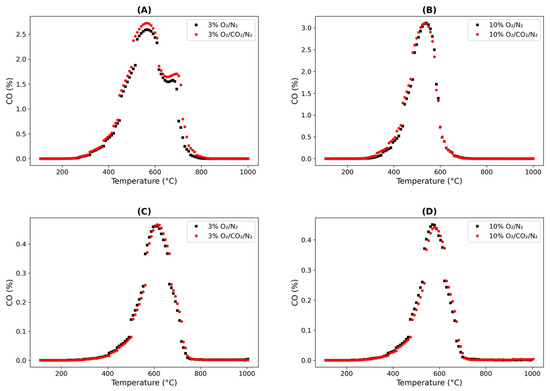
Figure 3.
Combustion profile of CO under O2/N2 and O2/CO2/N2 with two different spent fluid catalytic cracking (SFCC) catalysts: SFCC-2 (A) 3% O2 and (B) 10% O2; SFCC-4 (C) 3% O2 and (D) 10% O2.
The variations in the coke content and elemental analyses results of the two samples can be attributed to the different operating conditions and feedstocks of the two originating refinery units. The carbon content in SFCC-2 (1.14 wt.%) was slightly higher than that in SFCC-4 (1.08 wt.%). However, in H/C analysis of SFCC-2 and SFCC-4, the latter showed a higher H/C ratio. Moreover, in both SFCC-2 and SFCC-4, aliphatic coke was shown to be the dominant catalyst due to the high H/C ratio.
XPS was utilized to analyze the surface characteristics of coke in FCC catalysts. The observation on the SFCC-2 spectrum showed two distinct carbon species. The first peak at 284.8 eV reflected carbon bonded to C or H atoms; this observation corresponds to graphitic or aliphatic carbon structures consisting of 86.2 at.%. The second peak represented minor functionalized components accounting for 13.8 at% in heteroatoms such as oxygen, nitrogen, and sulfur (C–O, C–N, C–S). SFCC-4 also exhibited an initial peak at 284.65 eV, reflecting lower graphitic content at 73.8 at.%. However, the second peak in SFCC-4 at 285.82 eV showed a greater portion of the heteroatom-bound carbon of 26.2 at.%, compared to SFCC-2. This variation between the two spent catalysts shows the significance of refining and reaction conditions on coke deposition behavior (All XPS fitting results are provided in Note S3).
3.3. Combustion Profiles
The combustion profiles of coke under O2/N2 and O2/CO2/N2 conditions were evaluated as outlined in Table 2. Although N2 and CO2 have different thermophysical properties, which could theoretically influence the combustion profile of coke owing to variations in heat capacity, the SFCC-4 and SFCC-2 catalysts exhibited similar temperature profiles under both combustion atmosphere conditions. A slight delay in coke oxidation was observed in the oxy-firing (O2/CO2/N2) mode, as shown in Figure 3, which could be neglected. Notably, both catalysts produced equivalent amounts of CO in both media, suggesting that N2 and CO2 functioned as inert gases in the analyzed combustion system. The results under the conditions tested support this conclusion, as the Boudouard reaction either did not occur or was negligible in relation to the primary coke oxidation reaction.
The peak temperatures observed for the SFCC-2 and SFCC-4 catalyst under O2/N2 and O2/CO2/N2 conditions showed minimal differences, as summarized in Table 5 and Table 6, respectively.
Table 5.
Combustion characteristics of reaction C+ 0.5O2 → CO (SFCC-2).
Table 6.
Combustion characteristics of reaction C + O2 → CO (SFCC-4).
These results align with findings reported by Pereira et al. [10], which demonstrated the limited direct reactivity of CO2. Their study indicated that CO2 enhances coke oxidation only in the presence of specific additives, such as V–Li alumina. Similarly, the present study revealed that the absence of such additives led to CO2 behaving inertly in the O2/CO2 regeneration system, with no significant impact observed on the combustion profiles.
Adding CO2 to the combustion environment did not affect the peak temperature or the reaction pathway, further reinforcing the conclusion that CO2 is inert during combustion under these conditions and that the Boudouard reaction remains inactive in the presence of oxygen. However, a slight delay in coke oxidation was observed in the oxy-firing mode, suggesting that the kinetic differences between O2/CO2 and O2/N2 environments primarily arise from physical effects, such as oxygen diffusion rates, rather than from fundamental changes in chemical interactions.
The similar combustion profiles observed under O2/N2 and O2/CO2/N2 conditions indicate that the kinetics of coke oxidation remain comparable in the presence of CO2 and N2. These findings help clarify the roles of CO2 and N2 in the combustion process and offer insights for optimizing coke oxidation conditions to reduce CO2 emissions.
3.4. Kinetic Analysis
3.4.1. Coats–Redfern Linear Modeling
The reported kinetic triplets assume lumped kinetics, where Equations (1) and (2) are combined. A limitation of this approach is that oxygen concentration may influence the kinetic parameters. Specifically, a low oxygen content tends to reduce activation energy owing to incomplete combustion, whereas higher oxygen concentrations can increase activation energy to a certain extent as incomplete combustion becomes harder to achieve. Despite this limitation, lumped kinetics are widely used in simulations, with parameters for CO and CO2 often introduced in studies to distinguish between these equations. For simplicity, comprehensive kinetics were not examined in this study.
The Coats–Redfern technique was utilized to estimate the kinetic parameters governing coke oxidation. A thorough analysis of the combustion profiles of both catalysts indicated that the highest conversion rates occurred within the temperature range of 600–1000 K. In this range, the kinetics of coke oxidation exhibited an excellent fit, as summarized in Table 7 and Table 8 for SFCC-2 and SFCC-4, respectively. The reaction rates within this temperature range were relatively high, yielding reliable kinetic data in relation to those at lower temperatures, where reaction rates may be slower. Notably, the temperature range selected for the Coats–Redfern method aligns with the findings of several studies.
Table 7.
Oxidation kinetics data for SFCC-2 determined by the Coats–Redfern (CF) method.
Table 8.
Oxidation kinetics data for SFCC-4 determined by the Coats–Redfern method.
In the linear kinetic analysis, two temperature regions were evaluated: region 1 (600–1000 K) and region 2 (1000–1200 K). Kinetic parameters were assessed based on the coefficient of determination (R2) and comparisons with literature values. Initially, the power law model was tested and showed a reasonable fit; however, it yielded an activation energy of 50 kJ/mol, which represents the lower limit of reported activation energies for coke oxidation in the literature. Furthermore, the power law model failed to produce realistic activation energies in region 2 and was therefore excluded from further analysis.
The first-order reaction model demonstrated the best fit, making it a suitable candidate for describing coke oxidation kinetics. In region 1, the first-order model produced slightly higher activation energy than the power law model, with a very good fit. However, in region 2, the first-order model was unable to accurately capture the reaction kinetics.
Diffusion models were also tested and demonstrated a good fit. This result may be attributed to the structural properties of the FCC catalysts, which likely facilitate a diffusion-controlled mechanism. All diffusion models tested performed well in region 1; however, none of them were able to describe the kinetics in region 2. This suggests that the reaction may become inactive at temperatures above 1000 K, possibly owing to the depletion of coke in this region. Both SFCC-2 and SFCC-4 exhibited similar behavior, indicating that their structural properties are likely comparable. Utilizing the Coats–Redfern, kinetic parameters were extracted; however, identifying the optimum reaction mechanism was challenging as all models showed a good fit in the linear modeling. Other kinetic models were tested, but none was able to capture the data trendline. This highlights the fact that only pure kinetic models and diffusion models are suitable candidates for fitting coke oxidation kinetics. By employing these selected models, nonlinear modeling is expected to provide a comprehensive and robust overview, which will be compared to literature values.
3.4.2. Nonlinear Modeling
This study employed a nonlinear regression using the models established in Table 3 to analyze the kinetics of coke combustion. To identify suitable candidate models, the performance of all available models was evaluated. Among the ordered models for the chemical reaction, the first-order model showed promise for SFCC-2, whereas the D3 model performed best among the diffusion models. For SFCC-4, the second-order chemical reaction model exhibited superior performance, with the D3 model remaining the only diffusion model under consideration, as illustrated in Figure 4 at 3% O2 combustion for both SFCC-2 and SFCC-4. To ensure the robustness of the kinetic outcomes, results obtained from both the Coats–Redfern and nonlinear regression methods were compared with literature values (Table 9), revealing a high degree of consistency in terms of activation energies.
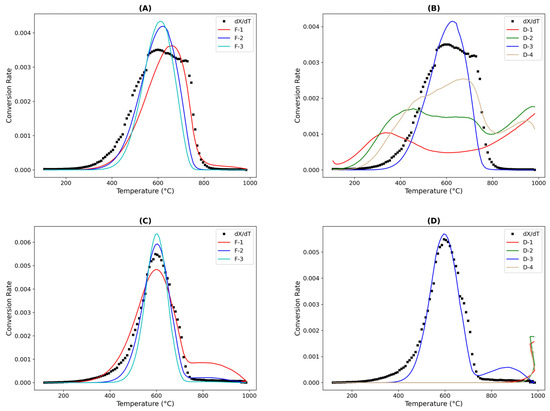
Figure 4.
Nonlinear fittings of coke conversion rates over (A,B) SFCC-2 and (C,D) SFCC-4 with respect to temperature at oxygen partial pressures of 3% O2/N2 using various models.
Table 9.
Oxidation kinetics results of this study and those reported in the literature.
The results for the first-order, D3, and modified D3 models, which are summarized in Table 10 for SFCC-2, show that although the first-order model provided a reasonable fit in some regions, it was inadequate in others, as shown in Figure 5. At the temperatures at which the first-order model was applicable, coke oxidation may have been governed by a single-step reaction. Notably, the ordered reaction models yielded lower activation energies, possibly because of their simplified approach considering only kinetic control and disregarding geometric effects. Nevertheless, when compared with the values from the literature on coke oxidation kinetics in FCC catalysts, the activation energies derived from ordered chemical reaction models appeared somewhat low. This discrepancy may indicate that a portion of the coke in SFCC-2 resided within the catalyst pores, making an ordered model based purely on a chemical reaction less suitable. In contrast, the D3 model provided the best fit among diffusion models, suggesting that a three-dimensional spherical geometry is appropriate for modeling coke oxidation. The D3 model also yielded higher activation energies than the other tested models, likely reflecting geometric constraints that must be overcome during the reaction. This finding underscores the importance of porosity in spent catalysts, where internal diffusion can significantly affect the reaction rate; this is based on the shrinking core model where the reaction occurs at the interface, which moves inward, as the outer layer is consumed. Moreover, the modified D3 model, derived by incorporating parameters from Equation (10), offered an even better fit than the classical version. The kinetic parameters obtained from this modified D3 model were consistent with literature values, affirming its suitability. The modified D3 model adopted a variable n parameter, which was found to range between 0.8 and 1.4. It is important to recognize that each SFCC catalyst possesses distinct coke properties, which may necessitate different models.
Table 10.
Oxidation kinetics data for SFCC-2 determined using nonlinear modeling.
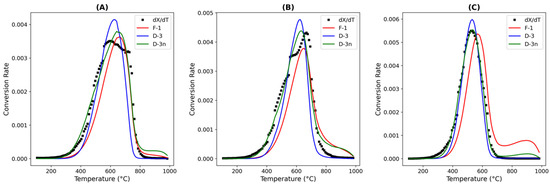
Figure 5.
Nonlinear fitting of coke conversion rates for SFCC-2 with respect to temperature at oxygen partial pressures of (A) 3% O2/N2, (B) 7% O2/N2, and (C) 10% O2/N2.
A similar analysis was performed for SFCC-4; based on the coke characterization data, SFCC-4 had a higher fraction of oxidized or functionalized carbon species, suggesting that SFCC-4 coke contained more surface-bound heteroatoms. In contrast, SFCC-2 exhibited more graphitic or aliphatic coke, which may have obstructed pores and intensified diffusional limitations. Hence, for SFCC-4, the second-order chemical reaction model provided a good fit among the ordered chemical reaction models. Moreover, although the second-order model produced realistic kinetic parameters for SFCC-4, it failed to do so for SFCC-2, which further confirms that structural differences influenced the choice of the kinetic models. In addition, the D3 model fitted the results for SFCC-4, indicating that internal diffusion may have been taking place. As both second-order and D3 models attained a good fit and reasonable kinetic parameters in general (Figure 6 and Table 11, respectively), both models were suitable for SFCC-4. In SFCC-2 and SFCC-4, the D3 model could be incorporated since the catalyst consisted of a large amount of non-combustible zeolitic material; a shrinking-core combustion model is suitable for the coke on its surface.
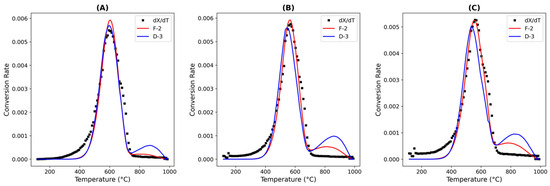
Figure 6.
Nonlinear fitting of coke conversion rates for SFCC-4 with respect to temperature at oxygen partial pressures of (A) 3% O2/N2, (B) 7% O2/N2, and (C) 10% O2/N2.
Table 11.
Oxidation kinetics data for SFCC-4 determined using nonlinear modelling.
The differences between the methods can be attributed to the flexibility of the approaches. The Coats–Redfern method, while reliable, identified fixed reaction orders that limited its adaptability, besides the linearization steps, which simplified the fitting approach. In contrast, the nonlinear method, using various mechanism models, provided a significant result, resulting in a more comprehensive representation of the system that considers a nonlinear environment, especially in geometry where internal diffusion becomes a significant factor. The selected models produced activation energy values close to those derived from the literature, suggesting that coke deposition is a significant step in the process. Furthermore, the coke oxidation in both catalysts occurred at higher temperatures, implying that coke consisted of hard coke only, and soft coke was not present, especially where most profiles showed just one peak, except for one condition. Based on the hard coke activation energies, higher energy barriers, which match the selected models’ kinetic parameters, were exhibited. In the next sections, the more suitable model for each catalyst will be used in order to accurately capture the kinetics.
3.4.3. Coke Oxidation Kinetics Under O2/CO2/N2
In this study, kinetic analysis under O2/CO2/N2 conditions highlighted the negligible role of CO2 gasification in coke removal kinetics, indicating that the Boudouard reaction was either inactive or exhibited very low activity. Furthermore, the coke oxidation kinetics in O2/CO2/N2 and O2/N2 environments were found to be similar. Although oxygen diffusion is faster in O2/N2 than in O2/CO2/N2, the coke oxidation kinetics in both environments are comparable, which indicates that the external mass transfer limitation was negligible under the experimental conditions. The comparative analysis of the incomplete combustion kinetics presented in Figure 7 and Table 12 and Table 13 confirm that coke oxidation kinetics remained consistent between the two environments. Although various models used in this study successfully captured similar kinetics for coke oxidation under both O2/N2 and O2/CO2/N2 conditions, a limitation of the experimental approach was its inability to account for diffusion effects. Therefore, supplementing these results with a computational analysis was concluded to be essential for evaluating the intraparticle effects of CO2, as presented in Section 3.5.
Figure 7.
Nonlinear fitting of coke conversion data using the 3D Jander diffusion model. (A,B) SFCC-2 under 3% O2/N2 and 3% O2/CO2/N2, respectively; (C,D) SFCC-4 under the same conditions.
Table 12.
Oxidation kinetics data of incomplete combustion for SFCC-2 estimated by nonlinear modeling under 3% O2/N2 and 3% O2/CO2/N2.
Table 13.
Oxidation kinetics data of incomplete combustion for SFCC-4 estimated by nonlinear modeling under 3% O2/N2 and 3% O2/CO2/N2.
3.5. Computational Analysis
In the experimental studies described in Section 3.4, the most significant reactions kinetics parameters were extracted, suggesting that two major fundamental but related topics should be subsequently examined: (1) the inertness of CO2 and its negligible influence on the reaction pathways; and (2) the comparable kinetics in both combustion modes that were extracted using the diffusion model that considers only internal diffusion phenomena. Thus, to evaluate the external diffusion behavior, a computational analysis was utilized. Furthermore, the results obtained using the selected kinetic model were compared with the industrial data.
In their computational analysis of an FCC regenerator, Chang et al. [21] proposed a complete reaction kinetics scheme but neglected the external diffusion effects, and they validated their model under specific conditions. Diffusion effects, however, become more significant when CO2 replaces N2. In contrast, Tang et al. [23] accounted for diffusion effects with an incomplete reaction scheme that assumed the absence of Pt. Because Pt is commonly used in modern FCC regenerators, extending their approach to include a complete reaction scheme would be more comprehensive, as described in our kinetic model in Note S.1.4.
3.5.1. Model Validation Under D3 and 2nd Order Model
In the analysis presented in Section 3.4, CO2 is treated as inert when external diffusion is neglected, which was the case in our experimental approach. To investigate the external diffusion effect, CFD modeling was utilized to determine the differences in the reaction rates and species profiles. Furthermore, we concluded that the intrinsic kinetics of coke oxidation were comparable in both environments. Therefore, the kinetics revealed by our modified D3 model under 3% O2 and 7% O2 were selected because the difference between these two conditions was negligible. The partial pressure analysis provided in Note S2 shows that the partial pressure order was 0.12, thereby minimizing the oxygen effect; hence, this was selected to serve as the main kinetics for the CFD modeling. However, as we further modified the kinetic model to encompass the entire complete reaction scheme, the model required further validation, which was achieved under both D3 and 2nd order models. Chang et al. [21] validated a lumped kinetic model of coke oxidation without gasification reactions, and Tang et al. [23] similarly validated an incomplete oxidation scheme; meanwhile, our validation employed a comprehensive kinetic framework that included distinct coke oxidation steps, external diffusion considerations, and gasification reactions utilizing the heterogenous models selected from our experimental study that validated the kinetic parameters utilized. The similarity in the CFD predictions while using both D3 and 2nd order models could be due to the predominance of the external mass transfer affect. Although both models explain distinct theoretical fundamentals, the overall reactor performance was dependent on the oxygen diffusion at the active sites in the coke. Industrial operating conditions, such as rapid intrinsic reaction, resulted in fast chemical kinetics, causing the oxygen diffusion to limit the performance of the system. As summarized in Table 14, the relative errors for the dilute and dense phase temperatures were 0.23–0.44% and 0.66–0.76%, respectively, demonstrating acceptable agreement with industrial data. Furthermore, the outlet gas compositions closely matched industrial measurements, affirming the robustness of our model.
Table 14.
Model validation against industrial data [21]. (A) D3 model and (B) second order model.
3.5.2. Coke Oxidation and Species Profile
This study focused on external diffusion effects rather than hydrodynamics or in-depth regenerator performance, which we will examine in future work. Since the intrinsic reaction pathways were identical in both combustion modes, coke oxidation rates and oxygen consumption directly revealed the influence of mass transport. Because the binary diffusivity of O2–N2 exceeded that of O2–CO2, oxygen was depleted much more rapidly under air-firing than oxy-firing (Figure 8). Specifically, O2 fell from ~0.21 mol frac at Plane 1 to ~0.022 mol frac by Plane 6 in air, whereas under oxy-firing it dropped more gently—from ~0.21 to ~0.036 mol frac—allowing O2 to penetrate deeper into the bed and resulting in a slightly higher and more uniform outlet concentration (Figure 9). Moreover, slower diffusion in the CO2 environment lowered the local coke oxidation rate: we measured plane-wise reductions of 5.4% (Plane 2), 16.8% (Plane 4), and 6.3% (Plane 6) when comparing oxy-firing to air-firing (Figure 10). These findings underscore the need to couple intrinsic kinetics with mass-transfer models.
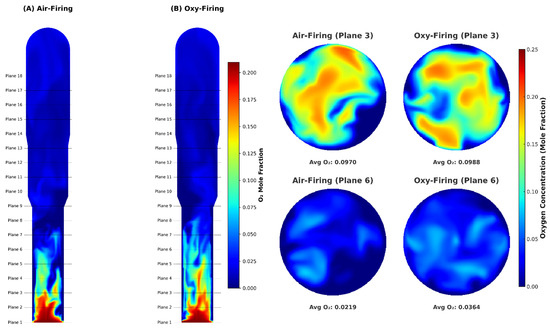
Figure 8.
Oxygen consumption contour conditions for O2/N2 and O2/CO2.
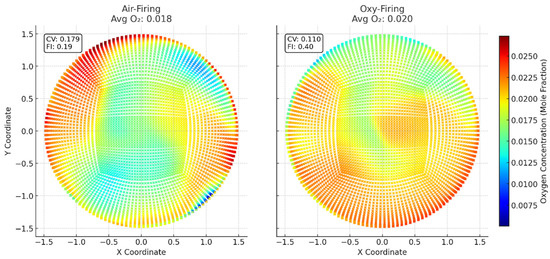
Figure 9.
Outlet oxygen consumption contours in industrial conditions for O2/N2 and O2/CO2.
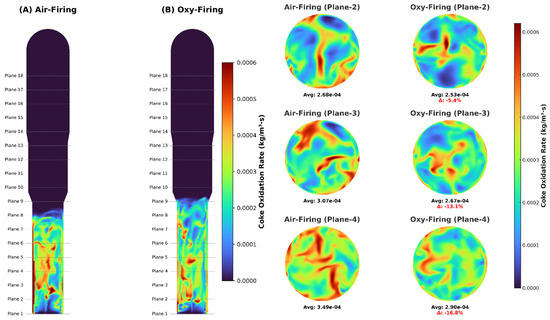
Figure 10.
Coke oxidation rates under industrial conditions for O2/N2 and O2/CO2.
4. Conclusions
This study provides valuable insights into the kinetics of coke oxidation under O2/N2 and O2/CO2/N2, with a specific focus on the regeneration of FCC catalysts. The results underscore the role of different gases in coke combustion. Under the tested conditions, we found the following.
- (1)
- Kinetic analysis confirmed the potential applicability of diffusion models, particularly the D3 model, which successfully integrated both regimes for analyzing coke oxidation kinetics on FCC catalysts and for considering the internal diffusion phenomena. The activation energies derived from these models were consistent with those from the literature, thereby confirming the reliability of the modeling strategies. Furthermore, adopting the flexible kinetic model and D3 model, the modified D3 model was introduced, which provided the best kinetic parameters for catalysts. Furthermore, all catalysts could be modeled by the D3 model due to the shrinking core model applied to the coke on the catalyst surface.
- (2)
- Our validation employed a comprehensive kinetic framework that included distinct coke oxidation steps and considered external diffusion and gasification reactions. Validation against industrial data confirmed its applicability using the D3 and second order model, since mass transfer was predominant in the industrial FCC regenerator.
- (3)
- The binary diffusion coefficient for the O2–N2 pair was higher than that for O2–CO2. This difference was attributed to the significance of external mass transfer, which caused oxygen to be consumed more rapidly under O2/N2 conditions because external diffusion was considered. Conversely, the slower diffusion of oxygen in a CO2-rich environment led to a marginally lower coke oxidation rate.
Future research should integrate these conclusions and investigate the O2/CO2 regeneration mode, considering the comprehensive kinetic model and real operating conditions while accounting for the steam content. This approach will enable more accurate predictions of the reactor hydrodynamics and a deeper analysis of FCC catalyst regeneration performance.
Supplementary Materials
The following supporting information can be downloaded at: https://www.mdpi.com/article/10.3390/pr13061718/s1, Supplementary Study Note S1: CFD Modeling Analysis; Supplementary Study Note S2: Partial Pressure Order Analysis; Note S3: XPS Fitting.
Author Contributions
Methodology, A.A, S.Y., A.B.A. and J.N.V.S.; formal analysis, A.A.; investigation, A.A.; writing—original draft preparation, A.A.; writing—review and editing, A.A., N.A., H.S., Q.L., F.R., Z.C., S.K. and L.Z.; supervision, S.K. and L.Z. All authors have read and agreed to the published version of the manuscript.
Funding
This research was funded by the United Arab Emirates University National Teaching Assistant Program.
Data Availability Statement
The raw data supporting the conclusions of this article will be made available by the authors on request.
Acknowledgments
The authors are grateful to the Sinopec Research Institute of Petroleum Processing for providing references on FCC regeneration and FCC catalyst samples. During the preparation of this work, the authors used ChatGPT (https://chat.openai.com/ (1 April 2024)) to refine the academic language and accuracy of their work. On 1 April 2024, we submitted our writing with the instruction to “Improve the academic tone and accuracy of language, including grammatical structures, punctuation and vocabulary”. The text was then further modified to better reflect our own tone and style of writing.
Conflicts of Interest
Authors Haitao Song, Qianqian Liu, Fei Ren and Zhenyu Chen were employed by the company SINOPEC. The authors declare no conflicts of interest. The funder had no role in the design of the study; in the collection, analyses, or interpretation of data; in the writing of the manuscript; or in the decision to publish the results.
Abbreviations
The following abbreviations are used in this manuscript:
| CF | Coats–Redfern |
| EA | elemental analysis |
| FCC | fluid catalytic cracking |
| RSE | residual standard error |
| SFCC | spent fluid catalytic cracking |
| XPS | X-ray photoelectron spectroscopy |
| XRF | X-ray fluorescence |
References
- Güleç, F.; Meredith, W.; Snape, C.E. Progress in the CO2 capture technologies for fluid catalytic cracking (FCC) units: A review. Front. Energy Res. 2020, 8, 62. [Google Scholar] [CrossRef]
- Hu, Y.; Yan, J. Oxyfuel combustion for CO2 capture. In Handbook of Clean Energy Systems; Yan, J., Ed.; John Wiley & Sons: Chichester, UK, 2015; pp. 1–29. [Google Scholar] [CrossRef]
- Tang, Y.; Li, S.; Liu, C.; Qi, Y.; Yu, Y.; Zhang, K.; Su, B.; Yu, J.; Zhang, L.; Dai, B. Process simulation and techno-economic analysis on novel CO2 capture technologies for fluid catalytic cracking units. Fuel Process. Technol. 2023, 249, 107855. [Google Scholar] [CrossRef]
- Erdogan, A. A three-dimensional CFD study on multiphase flow in an FCC regenerator integrated with oxy-combustion. J. Appl. Fluid Mech. 2024, 17, 398–409. [Google Scholar] [CrossRef]
- de Mello, L.F.; Gobbo, R.; Moure, G.T.; Miracca, I. Oxy-combustion technology development for fluid catalytic crackers (FCC) — Large pilot scale demonstration. Energy Procedia 2013, 37, 7815–7824. [Google Scholar] [CrossRef]
- Zhang, H.; Shen, Z.; Gong, J.; Liu, H. Influences of regeneration atmospheres on structural transformation and renderability of fluidized catalytic cracking catalyst. Chin. J. Chem. Eng. 2023, 63, 71–80. [Google Scholar] [CrossRef]
- Zhou, J.; Zhao, J.; Zhang, J.; Zhang, T.; Ye, M.; Liu, Z. Regeneration of catalysts deactivated by coke deposition: A review. Chin. J. Catal. 2020, 41, 1048–1061. [Google Scholar] [CrossRef]
- Le Minh, C.L.; Jones, R.A.; Craven, I.E.; Brown, T.C. Temperature-programmed oxidation of coke deposited on cracking catalysts: Combustion mechanism dependence. Energy Fuels 1997, 11, 463–469. [Google Scholar] [CrossRef]
- Li, C.; Minh, C.L.; Brown, T.C. Kinetics of CO and CO2 evolution during the temperature-programmed oxidation of coke deposited on cracking catalysts. J. Catal. 1998, 178, 275–283. [Google Scholar] [CrossRef]
- Kanervo, J.M.; Krause, A.O.I.; Aittamaa, J.R.; Hagelberg, P.H.; Lipiäinen, K.J.T.; Eilos, I.H.; Hiltunen, J.S.; Niemi, V.M. Kinetics of the regeneration of a cracking catalyst derived from TPO measurements. Chem. Eng. Sci. 2001, 56, 1221–1227. [Google Scholar] [CrossRef]
- Shakor, Z.; Alasseel, A.; Al-Shafei, E. The structure of deposited coke on hydrocracking and reforming catalysts: Coke deactivation and kinetics. Can. J. Chem. Eng. 2024, 102, 2876–2891. [Google Scholar] [CrossRef]
- dos Santos, L.T.; Santos, F.M.; Silva, R.S.; Gomes, T.S.; Esteves, P.M.; Pimenta, R.D.M.; Menezes, S.M.C.; Chamberlain, O.R.; Lam, Y.L.; Pereira, M.M. Mechanistic insights of CO2-coke reaction during the regeneration step of the fluid cracking catalyst. Appl. Catal. A 2008, 336, 40–47. [Google Scholar] [CrossRef]
- Pereira, S.C.; Ribeiro, M.F.; Batalha, N.; Pereira, M.M. Catalyst regeneration using CO2 as reactant through reverse-Boudouard reaction with coke. Greenh. Gases Sci. Technol. 2017, 7, 843–851. [Google Scholar] [CrossRef]
- Li, S.; Qi, Y.; Tang, Y.; Jubaer, H.; Dai, B.; Zhou, S.; Liu, Q.; Chen, Z.; Zhu, Y.; Song, H.; et al. Non-destructive characterisation of coke deposit on FCC catalyst and its transient evolution upon air-firing and oxy-fuel regeneration. Chem. Eng. J. 2022, 430, 132998. [Google Scholar] [CrossRef]
- Tang, Y.; Li, S.; Qi, Y.; Yang, S.; Zhou, Q.; Zhang, R.; Qian, B.; Su, B.; Zhang, L.; Dai, B. Coke evolution during the air- and oxy-firing regeneration of a spent Ni/ZnO sulfur adsorbent. J. Environ. Chem. Eng. 2023, 11, 109455. [Google Scholar] [CrossRef]
- Zaidi, A.A.; Khan, A.; AlMohamadi, H.; Anjum, M.W.; Ali, I.; Naqvi, S.R.; Kokuryo, S.; Miyake, K.; Nishiyama, N. Catalytic pyrolysis of rice husk over defect-rich beta zeolites for biofuel production. Fuel 2023, 348, 128624. [Google Scholar] [CrossRef]
- Koga, N.; Vyazovkin, S.; Burnham, A.K.; Favergeon, L.; Muravyev, N.V.; Pérez-Maqueda, L.A.; Saggese, C.; Sánchez-Jiménez, P.E. ICTAC Kinetics Committee recommendations for analysis of thermal decomposition kinetics. Thermochim. Acta 2023, 719, 179384. [Google Scholar] [CrossRef]
- Yang, Y.; Lu, X.; Wang, Q. Investigation on the co-combustion of low calorific oil shale and its semi-coke by using thermogravimetric analysis. Energy Convers. Manag. 2017, 136, 99–107. [Google Scholar] [CrossRef]
- Amblard, B.; Singh, R.; Gbordzoe, E.; Raynal, L. CFD modeling of the coke combustion in an industrial FCC regenerator. Chem. Eng. Sci. 2017, 170, 731–742. [Google Scholar] [CrossRef]
- Chang, J.; Wang, G.; Lan, X.; Gao, J.; Zhang, K. Computational Investigation of a Turbulent Fluidized-bed FCC Regenerator. Ind. Eng. Chem. Res. 2013, 52, 4000–4010. [Google Scholar] [CrossRef]
- Tang, G.; Silaen, A.; Wu, B.; Fu, D.; Agnello-Dean, D.; Wilson, J.; Meng, Q.; Khanna, S.; Zhou, C.Q. Numerical study of a fluid catalytic cracking regenerator hydrodynamics. Powder Technol. 2017, 305, 662–672. [Google Scholar] [CrossRef]
- Tang, Y.; Liu, C.; Kuang, S.; Liu, Q.; Chen, Z.; Song, H.; Su, B.; Yu, J.; Zhang, L.; Dai, B. CFD modeling investigation of oxy-fuel combustion application in an industrial-scale FCC regenerator. J. Energy Inst. 2024, 117, 101796. [Google Scholar] [CrossRef]
- Oloruntoba, A.; Zhang, Y.; Hsu, C.S. State-of-the-art review of fluid catalytic cracking (FCC) catalyst regeneration intensification technologies. Energies 2022, 15, 2061. [Google Scholar] [CrossRef]
- Erdoğan, A.; Güleç, F. A CFD study on the start-up hydrodynamics of fluid catalytic cracking regenerator integrated with chemical looping combustion. Energy Sources A 2024, 46, 2941–2956. [Google Scholar] [CrossRef]
- Oloruntoba, A.; Zhang, Y.; Xiao, H. Study on effect of gas distributor in fluidized bed reactors by hydrodynamics-reaction-coupled simulations. Chem. Eng. Res. Des. 2022, 177, 431–447. [Google Scholar] [CrossRef]
- Yang, Z.; Zhang, Y.; Oloruntoba, A.; Yue, J. MP-PIC simulation of the effects of spent catalyst distribution and horizontal baffle in an industrial FCC regenerator. Part I: Effects on hydrodynamics. Chem. Eng. J. 2021, 412, 128634. [Google Scholar] [CrossRef]
- Zhong, H.; Chen, J.; Gao, F.; Zhang, J.; Zhu, Y.; Niu, B. 3D virtual full-loop CFD simulation of industrial two-stage FCC reaction–regeneration system. Int. J. Chem. React. Eng. 2022, 20, 1179–1191. [Google Scholar] [CrossRef]
- Li, S.; Jiang, Q.; Qi, Y.; Zhao, D.; Tang, Y.; Liu, Q.; Chen, Z.; Zhu, Y.; Dai, B.; Song, H.; et al. Influence of coke heterogeneity and the interaction between different coke species on the emission of toxic HCN and NOx from FCC spent catalyst regeneration. J. Hazard. Mater. 2022, 436, 129187. [Google Scholar] [CrossRef]
- Zou, J.H.; Zhou, Z.J.; Wang, F.C.; Zhang, W.; Dai, Z.H.; Liu, H.F.; Yu, Z.H. Modeling reaction kinetics of petroleum coke gasification with CO2. Chem. Eng. Process. Process Intensif. 2007, 46, 630–636. [Google Scholar] [CrossRef]
- Zhang, Y.; Sun, G.; Gao, S.; Xu, G. Regeneration kinetics of spent FCC catalyst via coke gasification in a micro fluidized bed. Procedia Eng. 2015, 102, 1758–1765. [Google Scholar] [CrossRef]
- Vyazovkin, S.; Burnham, A.K.; Criado, J.M.; Pérez-Maqueda, L.A.; Popescu, C.; Sbirrazzuoli, N. ICTAC Kinetics Committee recommendations for performing kinetic computations on thermal analysis data. Thermochim. Acta 2011, 520, 1–19. [Google Scholar] [CrossRef]
- Ebrahimi-Kahrizsangi, R.; Abbasi, M.H. Evaluation of reliability of Coats-Redfern method for kinetic analysis of non-isothermal TGA. Trans. Nonferrous Met. Soc. China 2008, 18, 217–221. [Google Scholar] [CrossRef]
- Muravyev, N.V.; Melnikov, I.N.; Monogarov, K.A.; Kuchurov, I.V.; Pivkina, A.N. The power of model-fitting kinetic analysis applied to complex thermal decomposition of explosives: Reconciling the kinetics of bicyclo-HMX thermolysis in solid state and solution. J. Therm. Anal. Calorim. 2022, 147, 3195–3206. [Google Scholar] [CrossRef]
- Cerqueira, H.S.; Sievers, C.; Joly, G.; Magnoux, P.; Lercher, J.A. Multitechnique characterization of coke produced during commercial resid FCC operation. Ind. Eng. Chem. Res. 2005, 44, 2069–2077. [Google Scholar] [CrossRef]
- Hano, T.; Nakashio, F.; Kusunoki, K. The burning rate of coke deposited on zeolite catalyst. J. Chem. Eng. Jpn. 1975, 8, 127–130. [Google Scholar] [CrossRef]
- Weisz, P.B.; Goodwin, R.B. Combustion of carbonaceous deposits within porous catalyst particles: II. Intrinsic burning rate. J. Catal. 1966, 6, 227–236. [Google Scholar] [CrossRef]
Disclaimer/Publisher’s Note: The statements, opinions and data contained in all publications are solely those of the individual author(s) and contributor(s) and not of MDPI and/or the editor(s). MDPI and/or the editor(s) disclaim responsibility for any injury to people or property resulting from any ideas, methods, instructions or products referred to in the content. |
© 2025 by the authors. Licensee MDPI, Basel, Switzerland. This article is an open access article distributed under the terms and conditions of the Creative Commons Attribution (CC BY) license (https://creativecommons.org/licenses/by/4.0/).