Abstract
Apricot kernel shells were evaluated as a sustainable activated carbon precursor for wastewater treatment using experimental and theoretical methods. Two adsorbents were synthesized: physically activated with CO2 (AKS-CO2) and chemically activated with H3PO4 (AKS-H3PO4). Comprehensive materials characterization and adsorption tests using Pb2+ ions and Rhodamine B dye (RhB) as model pollutants revealed that AKS-H3PO4 significantly outperformed its physically activated counterpart. With an exceptionally high specific surface area (1159.4 m2/g) enriched with phosphorus-containing functional groups, the chemically activated carbon demonstrated outstanding removal efficiencies of 85.1% for Pb2+ and 80.3% for RhB. Kinetic studies showed Pb2+ adsorption followed pseudo-second-order kinetics, indicating chemisorption, while RhB adsorption fitted pseudo-first-order kinetics, suggesting intra-particle diffusion control. The thermodynamic analysis confirmed the spontaneity of both processes: Pb2+ adsorption was exothermic under standard conditions with positive isosteric heat at higher concentrations, reinforcing its chemisorption nature, whereas RhB adsorption was endothermic, consistent with physisorption. Density Functional Theory (DFT) calculations further elucidated the mechanisms, revealing that Pb2+ preferentially binds to oxygen-containing functional groups, while RhB interacts through hydrogen bonding and π–π stacking. These findings establish chemically activated apricot kernel shell carbon as a high-performance adsorbent, exhibiting exceptional removal capacity for both ionic and molecular contaminants through distinct adsorption mechanisms.
Keywords:
Pb2+ ions; Rhodamine B; acid-treated carbon; adsorption; kinetics; thermodynamics; DFT calculations 1. Introduction
Due to increasing industrialization and urbanization, widespread contamination of water resources with toxic pollutants has created an urgent need for sustainable and cost-effective solutions to mitigate risks to human health and the environment. The dual challenges of increasing industrial production and the depletion of finite energy resources have driven the development of innovative technologies that leverage renewable, easily accessible waste materials. These technologies aim to address two critical environmental issues: reducing pollution caused by industrial activities and harnessing energy from sustainable sources. Among the various types of waste materials, lignocellulosic (LC) biomass has garnered significant attention due to its abundance, low cost, and versatile physicochemical properties. LC biomass, generated in large quantities across industries such as agriculture, forestry, and food processing, represents a valuable resource that can be revalorized for multiple purposes. One promising application is the use of LC waste as a precursor for bio-adsorbents, with biochar emerging as a sustainable and versatile material for environmental applications [1].
Biochar is a carbonaceous material produced through the thermochemical conversion of biomass under oxygen-limited conditions, typically at temperatures ranging from 300 °C to 1000 °C [2]. Defined as a carbon-neutral or even carbon-negative product (International Biochar Initiative, 2012) [3], biochar has demonstrated high efficiency in removing various contaminants from wastewater, making it a cost-effective and environmentally friendly adsorbent [4,5,6]. Biochar production by pyrolysis or carbonization offers significant environmental advantages, primarily by enabling the long-term sequestration of carbon in a stable form. This process effectively mitigates CO2 emissions that would otherwise be released during the decomposition of natural biomass [7].
Apricot (Prunus armeniaca L.), a member of the Rosaceae family, is widely cultivated in regions such as North Africa, Asia, and Europe [8]. The fruit is renowned for its nutritional value, containing natural acids, vitamins, carbohydrates, phenolic compounds, and minerals. However, the apricot kernel, a by-product of fruit processing, is equally valuable, being a rich source of proteins, vitamins, and carbohydrates [9]. Apricot kernel shells (AKS), as LC waste, consist primarily of acid and neutral detergent fibers, including hemicellulose, cellulose, and lignin [10]. Despite their limited sorption capacity in their raw form [11], through thermochemical conversion [12] and subsequent activation, the AKS can be transformed into effective activated carbons (ACs), suitable for removing inorganic and organic contaminants from water [13]. AKS is a common waste in food production and processing. There are many pores on the surface and interior of apricot shells, which have a wood structure, and they are an excellent porous biomass material. AKS are often discarded or incinerated as garbage. At present, most research focuses on the preparation technology and the pore structure of the walnut shell AC [14], while research on the micro-morphology, phases, and pore structure of AKS-activated carbon is rarely reported. It should be noted that the United Nations (UNs) projects that by 2050, provide that there will be 9.7 billion people on the planet, up from 7.7 billion in 2019 [15]. This possibility presents a number of concerns regarding the expected two-fold increase in the consumption of fuels, fossil metals, biomass, and minerals, as well as the projected 70% increase in annual waste production if the current trends continue for the next 40 years [16]. These ideas contradict the trend toward a circular economy and more sustainable development. The circular economy is a production and consumption model that promotes the life span of the products by advocating for practices such as recycling, leasing, repairing, sharing, re-furbishing, and re-using existing materials and products. A crucial element of the proposed circular bio-based economy involves the conversion of biomass wastes and residues into valuable commodities. It means cutting waste to a minimum. Upon reaching the end of its functional lifespan, every effort is made to retain the materials of a product within the economic system, and these have the potential to be productively utilized repeatedly, adding more value to the waste [17]. In alignment with the objective of the circular economy and enhanced resource efficiency, the transition involves the incorporation of new inputs and resources, coupled with the conversion of waste into valuable resources. Keeping all this in mind, AKS presents the ideal ‘based’ biomass waste candidate for the production and consumption of “green” adsorbents in their application in wastewater treatment industries.
The transformation of biochar into activated carbons through physical or chemical activation has been widely studied, with each method imparting distinct properties to the resulting adsorbents [18,19]. Physical activation, typically involving CO2 or steam, creates a highly porous structure by gasifying the carbon matrix at high temperatures. This process often results in activated carbons with a well-developed microporous structure, ideal for adsorbing small molecules such as heavy metal ions [20]. In contrast, chemical activation, using agents such as H3PO4, KOH, or ZnCl2, not only enhances porosity but also introduces functional groups on the carbon surface, which can improve adsorption capacity for both organic and inorganic contaminants [21,22]. Chemical activation is particularly effective in enhancing the yield of activated carbons during the carbonization process, as it dehydrates the feedstock and inhibits the formation of tar and volatile compounds [23].
A comparison of physically and chemically activated carbons derived from AKS reveals distinct advantages and limitations [24]. Physically activated carbons, such as those produced using CO2, often exhibit higher thermal stability and a more uniform pore size distribution, making them suitable for applications requiring precise control over adsorption kinetics [25]. However, chemically activated carbons, particularly those activated with H3PO4, tend to have higher surface areas and superior adsorption capacities for dyes and heavy metals compared to their physically activated counterparts [26,27], owing to the synergistic effects of increased porosity and surface chemistry [28,29].
The study also investigated the adsorption performance of the produced ACs for two highly toxic pollutants: lead (in the form of Pb2+ ions) and Rhodamine B dye (RhB). Lead, ranked as the second most toxic element by the Agency for Toxic Substances and Disease Registry [30], poses significant risks to human health and the environment. RhB, a widely used dye in the textile industry, is known for its toxic effects on aquatic life and potential carcinogenic and neurotoxic effects on humans [31]. Contaminant removal efficiency was evaluated using Inductively Coupled Plasma Optical Emission Spectroscopy (ICP-OES) for Pb2+ and Ultraviolet-Visible (UV-Vis) spectroscopy for RhB. The adsorption mechanisms, kinetics, and thermodynamics of these contaminants onto the AKS-H3PO4 were explored, supported by Density Functional Theory (DFT) computations to model interaction scenarios and adsorption energies.
By combining experimental and theoretical approaches, this study provides a comprehensive understanding of the adsorption process. The detailed kinetic and thermodynamic analysis, supported by DFT calculations, provides a deeper understanding of the interaction mechanisms between the adsorbents and contaminants. This dual approach not only enhances the scientific understanding of the adsorption process but also offers practical insights for optimizing the design and application of carbon-based adsorbents in wastewater treatment. By leveraging the unique properties of AKS-derived ACs and employing a combination of experimental and theoretical methods, this study contributes to the development of sustainable and efficient solutions for water decontamination.
2. Materials and Methods
2.1. Preparation of Activated Carbons
In this study, AKS was used as a precursor for the production of biochar through carbonization at 800 °C for 1 h, followed by physical activation using CO2 (Messer Tehnogas, Belgrade, Serbia), and chemical activation using H3PO4 (Sigma-Aldrich, St. Louis, MO, USA). The raw apricot kernel shells (AKS) were initially washed with water, dried (naturally for two days, followed by oven drying at 105 °C for two hours), and then crushed using a heavy-duty electrical grinder (Pulverisette 15, Laval Lab, Laval, QC, Canada). The crushed material was sieved (304 Stainless Steel Mesh Lab Sieve 60 Mesh, Xinxiang Dahan Vibrating Machinery Co., Ltd., Xinxiang, China) to obtain AKS precursor particles with a diameter of 0.3 mm for subsequent activation. For physical activation, the AKS precursor was carbonized in a CO2 stream (gas flow rate of 200 cm3/min) at 800 °C for 1 h, with a heating rate of 3 °C/min, using a horizontal tube electric furnace (PZF Series, Protherm, Ankara, Turkey). The resulting activated carbon was labeled as AKS-CO2. For chemical activation, the AKS precursor was impregnated in a 30% H3PO4 solution (25 mL per 10 g of AKS, corresponding to a biomass-to-acid ratio of ≈1:3) for 2 h, soaked in water for 24 h, and dried at 100 °C for 1 h. The dried material was then carbonized under the same conditions as physical activation, but in an N2 (nitrogen) atmosphere to ensure an oxygen-free environment. The chemically activated carbon, labeled AKS-H3PO4, was washed twice with hot distilled water and dried at 105 ± 5 °C in an oven (ELP-32, ELEKTRON, Banja Koviljača, Serbia).
2.2. Structural Analysis of Activated Carbons
The synthesized ACs (AKS-CO2 and AKS-H3PO4) were characterized using advanced analytical techniques: Fourier Transform Infrared (FTIR) spectroscopy, X-ray diffraction (XRD), Scanning Electron Microscopy (SEM), and Brunauer–Emmett–Teller (BET) analysis for nitrogen adsorption–desorption isotherms. Detailed descriptions of the instruments and measurement conditions are provided in Text S1 (Supplementary Materials). The precursor material (non-activated carbonized AKS) has been comprehensively characterized in our previous work [12], with full physicochemical properties reported therein.
2.3. Adsorption Experiments
2.3.1. Preparation of Stock Solutions of Inorganic and Organic Contaminants
Stock solutions of the desired concentrations for adsorption studies were prepared by dissolving an appropriate mass of each contaminant in distilled water. For the inorganic contaminant, lead(II) chloride (PbCl2) (Sigma Aldrich, St. Louis, MO, USA; purity ≥ 98%, molar mass = 278.11 g/mol) was used as the starting compound to prepare solutions of Pb2+ ions. For the organic contaminant, Rhodamine B (RhB) dye (molecular formula: C28H31ClN2O3, the molar mass = 479.02 g/mol, purity ≥ 97.0%) was obtained from Sigma Aldrich (St. Louis, MO, USA).
2.3.2. Adsorption Optimizations in the Experimental Procedure
Adsorption experiments were carried out in 25 mL flasks with agitators to ensure thorough mixing. A fixed mass of 0.01 g of ACs (AKS-CO2 or AKS-H3PO4) was added to 10 mL of adsorbate solutions containing Pb2+ ions or RhB dye at known initial concentrations (c0). The experiments were conducted at the natural pH conditions resulting from contaminant dissolution and adsorbent addition, which typically ranged between pH ≈ 5–6 for both Pb2+ and RhB systems. Adsorption equilibrium was studied by exposing adsorbents to solutions with initial concentrations of 50, 75, 100, 125, and 150 mg/L for 24 h at 25 °C, 35 °C, and 45 °C. For adsorption kinetics, solutions with an initial concentration of 100 mg/L were stirred for varying durations (0.083, 0.25, 0.5, 1, 2, 3, 6, and 24 h). Based on preliminary adsorption isotherm results, kinetic experiments for Pb2+ were conducted at 25 °C (room temperature), while RhB kinetics was examined at 35 °C. After adsorption, mixtures were filtered, and equilibrium concentrations (ce) were measured. Pb2+ concentrations were determined using Inductively Coupled Plasma Optical Emission Spectrometry—ICP-OES (Thermo Scientific iCAP 7000 Series, Waltham, MA, USA), while RhB concentrations were quantified using a UV-Vis spectrophotometer (Lambda 35, PerkinElmer, Waltham, MA, USA) on a wavelength of 554 nm. All aliquots were diluted 20-fold to comply with the Lambert-Beer law. The adsorption capacity (amount of adsorbate adsorbed) and removal efficiency were calculated using Equations (S2)–(S4) provided in Text S2 of the Supplementary Materials.
2.4. Adsorption Kinetics and the Equilibrium Models
To describe the equilibrium during the adsorption process, various isotherm models have been developed, including two- and three-parameter models [32]. In this study, Langmuir, Freundlich, Temkin, and Dubinin–Radushkevich (D–R) models were used to interpret the experimental data. To explore the adsorption mechanism and identify rate-controlling steps, eight kinetic models were evaluated, categorized into: (1) adsorption-reaction models (pseudo-first-order (PFO), pseudo-second-order (PSO), Avrami, and Elovich) and (2) adsorption-diffusion models (Boyd, intra-particle diffusion (IP), diffusion-chemisorption (DC), and Bangham). Theoretical details of these models, along with the procedure for estimating their parameters, are provided in Text S3 (Supplementary Materials). Model selection was performed through comprehensive statistical analysis, including Pearson correlation coefficient, sample correlation coefficient, coefficient of determination (R2), adjusted coefficient of determination, root mean square error, residual sum of squares (RSS), norm of residuals, and Fisher’s F-test (F-value), with additional validation via comparison between model predictions and experimental data.
2.5. Thermodynamic Analysis
Thermodynamic considerations of the adsorption process are necessary to determine the nature of the process itself, consider the influence of physical operating parameters, and define optimal conditions for practical implementation. The complete thermodynamic theory with the equations used in determining important thermodynamic quantities related to the observed adsorption processes, is presented in Text S4 (Supplementary Materials).
2.6. DFT Computations—Methodology
DFT calculations were performed using the pwscf code within the Quantum ESPRESSO package version 7.2 [33], an open-source software package for first-principles calculations based on plane-wave basis sets and pseudopotentials. Calculation details, including the assumptions of the models, geometry, and parameters, are provided in Text S5 (Supplementary Materials).
The visualization of structures was carried out using the XcrySDen software, version 1.6.2 [34]. Adsorption energies (ΔEads) were calculated as the difference between the total energy of the optimized slab–adsorbate system (Eslab+ads) and the sum of the total energies of the isolated adsorbate (Etot,isol) and the bare surface slab (Etot,slab):
Defined like this, a more negative ΔEads value indicates a stronger surface-adsorbate interaction, with negative values signifying favorable adsorption (either physisorption or chemisorption).
3. Results
3.1. FTIR Analysis of Functional Groups in Prepared Activated Carbons
The FTIR spectra of AKS-CO2 and AKS-H3PO4 samples are presented in Figure S1 (Supplementary Materials). As summarized in Table 1, both samples exhibit several common spectral features: a three-finger band at 3551 cm−1, ≈3479 cm−1, and ≈3414 cm−1 [35]; a band at 3234 cm−1 [36]; a doublet at 1636 cm−1 and 1618 cm−1 [37,38,39]; phenolic OH deformation at 1370 cm−1 [40]; and bands at 618 cm−1 and 480 cm−1 [41]. However, their spectral profiles diverge significantly, revealing distinct functional groups.

Table 1.
Characteristic FTIR vibration frequencies, allocations, and origins for AKS-CO2 and AKS-H3PO4 activated carbons.
AKS-CO2 spectrum is characterized by a band at 3120 cm−1, indicative of the aromatic C–H stretching in polynuclear systems, and a band at 2027 cm−1, assigned to C–H stretching in aromatic compounds [42]. In contrast, the AKS-H3PO4 spectrum displays a distinct peak at 2348 cm−1, attributed to P–H stretching in esters [43], and a smaller peak at 1797 cm−1, corresponding to carbonyl (C = O) vibrations in esters [44], highlighting the influence of chemical activation. A strong peak at 1383 cm−1, assigned to C = O symmetric stretching in deprotonated COO− groups, further underscores the prevalence of oxygen-containing functionalities [45] in AKS-H3PO4. Additionally, a band at 754 cm−1, attributed to aromatic C–H stretching, confirms the presence of aromatic structures [46,47].
These differences in the spectral features arise from the distinct chemical environments and functional groups introduced by CO2 and H3PO4 activation. Notably, AKS-H3PO4 exhibits phosphorus-specific functionalities and a higher abundance of oxygen-containing groups, highlighting the advantages of chemical activation over physical activation.
3.2. Results of the XRD Analysis
The XRD patterns of the synthesized ACs, AKS-CO2 and AKS-H3PO4, are shown in Figure S2 (Supplementary Materials). Both samples exhibit two broad diffraction peaks at 2θ ≈ 26° and 2θ ≈ 45°, corresponding to (002) and (100) planes, respectively. These peaks indicate the presence of graphite crystallites and amorphous regions, though their broad and overlapping nature makes them difficult to resolve. The AKS-H3PO4 shows broader peaks, suggesting reduced graphite crystallite size and increased structural disorder, which likely enhances its specific surface area. In contrast, the sharper and more intense peak at 2θ ≈ 26.7° for AKS-CO2 indicates higher crystallinity. This is confirmed by the crystallinity index (CrI) calculated using Equation (S1) (Supplementary Materials): 44.37% for AKS-CO2 and 16.73% for AKS-H3PO4, demonstrating that AKS-CO2 is approximately 2.5 times more crystalline than AKS-H3PO4. These differences arise from the distinct activation agents used, which significantly influence the structural properties of the ACs. The peak at 2θ ≈ 45.6° in AKS-H3PO4, associated with the (100) plane, reflects the role of H3PO4 in promoting pore formation through carbon breakdown along graphitic structures. This suggests an optimized activation process, yielding a well-organized aromatic carbon structure with a highly developed pore system [48,49]. Additionally, the peak at 2θ ≈ 12.9° in AKS-H3PO4 indicates increased interlayer spacing (up to ~0.72–0.73 nm; [50]), consistent with the formation of a graphene oxide structure due to the introduction of oxygen functionalities. This is attributed to the oxidizing properties of H3PO4 at high temperatures (800 °C), which facilitate the formation of C = O, C–H, COOH, and C–O–C bonds within the graphite layers, as supported by FTIR results. In contrast, AKS-CO2 lacks such features, aligning with its lower oxygen content. Both samples exhibit peaks at 2θ ≈ 22.2° (AKS-H3PO4) and 2θ ≈ 23.5° (AKS-CO2), attributed to amorphous silica within the 2θ range of 22–27° [51,52,53]. The AKS-H3PO4 also shows a sharp peak at 2θ ≈ 31.8°, indicative of crystalline quartz [54]. These findings underscore the influence of activation temperature on graphitic structure size and silica crystallization.
3.3. Morphological Comparison of Activated Carbons (SEM Analysis)
Morphological features of activated carbons derived from AKS—physically activated AKS-CO2 and chemically activated AKS-H3PO4—were compared by analyzing representative SEM images of the two samples (Figure 1). These images highlight distinct morphological differences resulting from their respective activation methods.
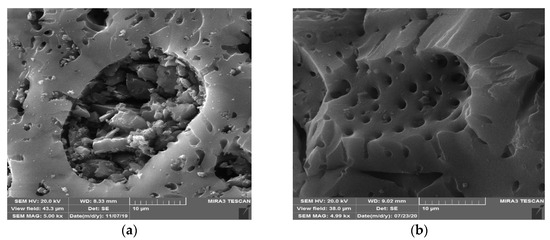
Figure 1.
SEM images (with magnification of 5.00 kx) of activated carbons (ACs) derived from apricot kernel shells (AKS): (a) AKS-CO2 (physical activation) and (b) AKS-H3PO4 (chemical activation).
AKS-CO2 exhibits a layered structure (Figure 1a), indicative of the increased graphitization and crystallinity, as supported by earlier XRD findings. This sample features a relatively smooth surface with narrow pores, small pores distributed across flat regions, and random depressions surrounded by additional small pores. In contrast, the AKS-H3PO4 displays a spongy-like morphology (Figure 1b), with well-defined, uniformly distributed pores arranged in hollow spherical or elliptical shapes. The pore walls in AKS-H3PO4 are smoother and exhibit sharper edges, suggesting structural reorganization during chemical activation. White spots observed on the AKS-H3PO4 surface are likely due to the incorporation of phosphorus into the carbon matrix, which is consistent with previous studies [55,56]. Additionally, AKS-CO2 contains miscellaneous inorganic particles on its surface, while AKS-H3PO4 shows minimal inorganic content, primarily silica. These morphological differences—including pore volume, shape, size, and arrangement—are a result of the activation methods used and are expected to affect the material’s performance in removing contaminants from aqueous solutions by adsorption.
3.4. Textural Properties of Activated Carbons (BET Analysis)
Textural properties of AKS-CO2 and AKS-H3PO4 samples were evaluated through nitrogen (N2) adsorption–desorption isotherms at 77 K (Figure 2). Both isotherms exhibit plateaus, with key differences observed at low relative pressures (up to ≈P/p0 = 0.04). AKS-CO2 isotherm (Figure 2a) corresponds to a Type I (a) isotherm (IUPAC classification), indicative of narrow microporous materials with pore widths <~1 nm. This isotherm shows a rapid increase in adsorption at low pressures, followed by a horizontal plateau, suggesting a predominantly microporous structure with limited mesoporosity [57,58,59]. In contrast, AKS-H3PO4 isotherm (Figure 2b) aligns with a Type I (b) isotherm, characterized by continuous adsorption uptake until saturation. This behavior reflects a broader pore size distribution, including wider micropores and narrow mesopores (<~2.5 nm). A sharp rise in adsorption near p/p0 = 1 for AKS-CO2, indicates condensation in inter-particle voids [60].
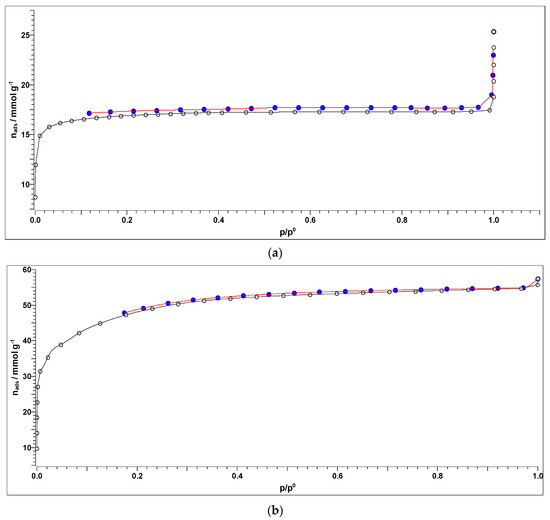
Figure 2.
N2 adsorption (-○-) — desorption (-●-) isotherm at 77 K, for: (a) AKS-CO2 (physically activated carbon), and (b) AKS-H3PO4 (chemically activated carbon).
Table 2 summarizes the textural parameters of considered samples. The AKS-H3PO4 sample exhibits a significantly higher specific surface area (1159.4 m2/g) compared to AKS-CO2 (378.08 m2/g), along with a larger mesopore surface area and micropore volume. Furthermore, AKS-H3PO4 demonstrates a broader pore size distribution, with slightly wider micropores, and the presence of narrow mesopores, as confirmed by the morphological analysis (Figure 1).
Table 2.
Textural properties of synthesized activated carbons (AKS-CO2 and AKS-H3PO4): BET surface area (SBET), micropore volume (Vmicro), mesopore surface area (Smeso), and pore size distributions—median and maximum pore radius and the cumulative pore volume (rm, rmax and Vp) calculated using Horvath–Kawazoe (H-K), Brunauer–Joyner–Halenda (BJH), Cranston–Inkley (C-I), and Dollimore–Heal (D-H) methods.
In summary, the AKS-H3PO4 exhibits superior textural properties, including an exceptionally very high specific surface area (>1000 m2/g), a combination of micropores (<1 nm) and narrow mesopores (1–2 nm), and a well-defined pore structure. In contrast, AKS-CO2 shows limited mesoporosity, and a less uniform pore network, with surface irregularities rather than geometrically consistent pores (Figure 1). These differences suggest that the AKS-H3PO4, as an engineering-manufactured activated carbon, is better suited for adsorption applications compared to AKS-CO2.
3.5. Removal Efficiency, Equilibrium and Kinetics of Adsorption Process
3.5.1. Removal Efficiency of Pb2+ and RhB Using AKS-CO2 and AKS-H3PO4 Adsorbents
The adsorption performance of AKS-CO2 and AKS-H3PO4 was evaluated for the removal of Pb2+ and RhB from aqueous solutions (initial concentration, c0 = 100 mg/L, adsorbent dose of 1 g/L). Under applied experimental conditions, determined removal efficiencies are numerically equivalent to the adsorption capacity in mg/g. As shown in Figure 3, the removal efficiency of both contaminants was significantly higher for chemically activated carbon (AKS-H3PO4) compared to physically activated carbon (AKS-CO2). After 24 h, AKS-H3PO4 achieved 80.5% removal for Pb2+ at 25 °C (Figure 3a), with the highest removal efficiency (85.1%) observed at 45 °C. In contrast, AKS-CO2 reached only 34% Pb2+ removal. For RhB, AKS-H3PO4 achieved a maximum removal efficiency of 80.3% at 35 °C, while AKS-CO2 reached approximately 20% (Figure 3b).
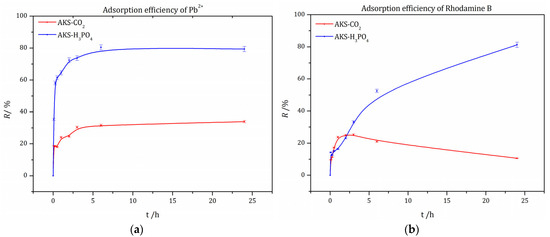
Figure 3.
Removal efficiency (R, %) of (a) Pb2+ at 25 °C and (b) RhB at 35 °C, from aqueous solutions (c0 = 100 mg/L) using AKS-CO2 and AKS-H3PO4 activated carbons. Error bars represent the standard deviation of the measurements.
The superior performance of AKS-H3PO4 is attributed to its enriched surface functional groups, particularly oxygen-containing groups, and its well-developed porous structure, as evidenced by SEM images (Figure 1). Due to the low efficiency of AKS-CO2, further analyses focused exclusively on AKS-H3PO4 for adsorption equilibrium and kinetics.
3.5.2. Adsorption Isotherms for Pb2+ and RhB onto AKS-H3PO4
Adsorption isotherms were analyzed using linearized models (Equations (S6), (S9), (S11) and (S14), Supplementary Materials), with results illustrated in Figures S3 and S4 for Pb2+ and RhB, respectively. A comparison between the experimental data and model predictions is presented in Figures S5 and S6 (Supplementary Materials), for Pb2+ and RhB, respectively. For both contaminants, the Langmuir model provided the best fit across all temperatures, indicating monolayer adsorption onto energetically equivalent sites (fit statistics summarized in Table 3; complete data in Tables S1 and S2 for Pb2+ and RhB, respectively, in Supplementary Materials).
Table 3.
Langmuir model fit statistics (coefficient of determination, R2; residual sum of squares, RSS; Fisher’s F-test, F-value) and derived adsorption parameters (separation factor, RL; average adsorption energy, E (kJ/mol); removal efficiency, R (%)) for Pb2+ and RhB.
The separation factor (RL), calculated via Equation (S7) (Supplementary Materials), consistently yielded values below 1, confirming thermodynamically favorable adsorption (RL < 1). Average adsorption energy (E, kJ/mol) values derived from Equation (S15) (Supplementary Materials) suggest physisorption with moderately strong interactions or weak chemisorption (potentially via ion-exchange mechanisms) [61,62,63]. Notably, Pb2+ removal efficiency (R, %) exceeded 80% at 25 °C, justifying subsequent kinetic studies at this temperature. For RhB, optimal adsorption occurred at 35 °C, which guided our investigation of its adsorption dynamics under these conditions.
3.5.3. Adsorption-Reaction Kinetics of Pb2+ and RhB onto AKS-H3PO4
Model parameters for the adsorption-reaction models were estimated using their non-linear forms (Equations (S17), (S22), (S24), and (S28), as provided in the Supplementary Materials). Estimated parameters and goodness-of-fit measures are summarized in Tables S3 and S4, while experimental data and model predictions are compared in Figures S7 and S8 (Supplementary Materials) for Pb2+ and RhB, respectively.
For Pb2+, the PSO model provided the best fit (R2 > 0.985) at 25 °C, consistent with a second-order ion exchange mechanism dependent on temperature and initial contaminant concentration (Table S3). Adsorption was rapid within the first six hours, followed by a decline in rate and a saturation plateau (Figure S7). This behavior is attributed to the initial availability of adsorption sites and a high concentration gradient, followed by site occupation as Pb2+ accumulated on the adsorbent surface. The Langmuir isotherm and PSO kinetics provide a robust framework for describing the adsorption of Pb2+ onto AKS-H3PO4.
For RhB, the Avrami model provided the best fit (R2 > 0.970) at 35 °C, though PFO and PSO models were also predictive (Table S4). The Avrami model’s fractal-like behavior, characterized by a time-dependent adsorption rate coefficient [64], suggests potential for future studies on multi-step adsorption processes. As shown in Figure S8, the RhB adsorption was slower than Pb2+ adsorption, likely due to RhB’s larger molecular volume, which hinders diffusion into the adsorbent’s pores.
3.5.4. Adsorption-Diffusion Kinetics of Pb2+ and RhB onto AKS-H3PO4
The experimental data were fitted linearly using adsorption-diffusion models (Equations (S34), (S35), (S36) and (S40)), as respectively illustrated in Figures S9 and S10 (Supplementary Materials) for Pb2+ and RhB, with models’ predictions compared to experimental results in Figure S11 and S12 (Supplementary Materials).
Multi-linear segments in Figure S9a and the parameters C for the IP model suggest that both film diffusion and surface-controlled reactions influence Pb2+ adsorption. The adsorption is not solely limited by intra-particle diffusion but is also controlled by a combination of diffusion and chemisorption, a common mechanism for heavy metal adsorption on heterogeneous surfaces [65]. It should be noted that, from a closer look at the results shown in Figure S9a, we can see that the arrangement of experimental points forms three well-defined diffusion zones. The first zone (Zone I) consists of the first three points from the coordinate origin, the second zone (Zone II) consists of a pair of points in the range approximately between t0.5 = 0.5 and t0.5 = 1.75, while the last, third zone (Zone III) is made up of the last three points. In accordance with Módenes et al. [66], Zone I is attributed to the adsorption, which takes place on the surface layer of the adsorbent, Zone II is attributed to the adsorption in macropores of the adsorbent, while Zone III can be attributed to the adsorption on micropores of the adsorbent. A longer period of time is attributed to Zone III compared to the other stages (see Figure S9a), thus indicating the limiting step of the considered process, where the metal ion adsorption primarily takes place in the micropores of the adsorbent. For Pb2+, the Boyd diffusion plot (Figure S9c) did not intersect the origin, also indicating multiple adsorption mechanisms. The diffusion-chemisorption (DC) model provided the best fit, with a high coefficient of determination (R2 > 0.997; Table S5, Supplementary Materials). The high diffusion-chemisorption constant (KDC, Table S5) reflects a strong concentration gradient between the adsorbent’s inner and outer regions, consistent with the high sorption capacity of AKS-H3PO4. This capacity is attributed to its large specific surface area, pore volume, and the prevalence of micropores (<2 nm) (Table 2), which facilitates Pb2+ adsorption due to the ion’s small ionic radius (0.119 nm–0.24 nm diameter).
For RhB, the adsorption data were most effectively fitted using the IP and Boyd diffusion models (Figure S10), both of which exhibited high accuracy (R2 > 0.970; Table S6, Supplementary Materials). The fitted lines suggest multiple adsorption mechanisms, though the minimal deviations and high linearity indicate that intra-particle diffusion is the dominant rate-limiting step. Unlike Pb2+ adsorption, RhB adsorption showed two linear sections in Figure S10a and a small boundary layer thickness (parameter C, Table S6), implying negligible film diffusion. Instead, intra-particle diffusion dominates, facilitated by the larger micropore diameter of AKS-H3PO4, which allows RhB molecules to penetrate and diffuse through the pores. Considering the positions of the experimental points in Figure S10a (Supplementary Materials), it can be concluded that dye adsorption occurs both on the surface of the adsorbent and in its pores of a larger radius [66]. This behavior is different from that shown in Figure S9a. Therefore, the adsorption occurs after dye molecules are transported to active sites, driven by the concentration gradient across the adsorbent surface. The IP model accounts for RhB adsorption across pores of varying sizes, linking it to adsorption at internal sites within AKS-H3PO4. A comparison of experimental data and model predictions (Figure S12) revealed that the IP model fits the data better than the Boyd model. Although the DC model showed a low residual sum of squares (indicating good agreement with experimental data), its poor linear fit statistics (adjusted R2 and F-value, Table S6) indicate a weak fit. The KDC value for RhB adsorption was over twelve times smaller than that for Pb2+ (Tables S5 and S6), confirming distinct adsorption mechanisms for the two contaminants. These differences highlight the role of AKS-H3PO4’s pore structure and the molecular characteristics of adsorbates in governing adsorption kinetics.
3.6. Thermodynamic Study of Pb2+ and RhB Adsorption onto AKS-H3PO4
Adsorption equilibrium of Pb2+ and RhB onto AKS-H3PO4 was best described by the Langmuir model, as evidenced by isotherm analysis (Tables S1 and S2, Supplementary Materials). Although, the Langmuir model assumes temperature independence of maximum adsorption capacity (qm) [67,68], attempts to fit the isotherms nonlinearly under the condition qm = const. were unsuccessful. However, the best nonlinear fits (Figure 4) yielded parameters consistent with those obtained from linear fitting (Tables S1, S2, and S7, Supplementary Materials).
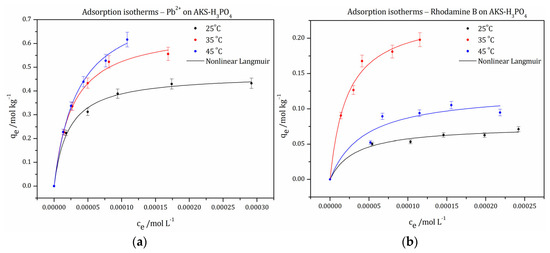
Figure 4.
Adsorption isotherms of (a) Pb2+ and (b) RhB, at 25 °C (black), 35 °C (red), and 45 °C (blue); dots—the experimental data, line—nonlinear Langmuir fits.
Given this inconsistency, the use of the Langmuir model to derive was reconsidered (Text S4, Supplementary Materials). Instead, the partitioning model was employed to estimate thermodynamic parameters (Equation (S42), Supplementary Materials). Values of as were determined from the intercept of ln() versus plots (Figure S13, Supplementary Materials). Subsequently, values were derived by fitting the data to the nonlinear Van’t Hoff equation (Equation (S46), Supplementary Materials) using plots of versus 1/T.
3.6.1. Standard Thermodynamic Parameters
For Pb2+ (Figure S13a), surface coverage significantly influenced , with the relationship becoming nonlinear at higher . To determine at , only data points corresponding to low concentrations, where linearity was observed, were used for fitting. For RhB (Figure S13b), a linear dependence of ln() on was only evident at 35 °C. Despite this, the data were processed to gain insights into the adsorption phenomenology of RhB onto AKS-H3PO4. Linear fit statistics are provided in Table S8 (Supplementary Materials).
Van’t Hoff plots (Figure S14, Supplementary Materials) were used to determine the standard thermodynamic parameters for Pb2+ and RhB adsorption. The appropriate fit statistics are presented in Tables S9 and S10 (Supplementary Materials).
For Pb2+, = –10.54 kJ/mol, and = –2.95 J/(mol·K) were calculated, indicating an exothermic process (< 0) with a decrease in randomness at the solid/solution interface (< 0). The small absolute value of suggests the process is primarily “enthalpy-driven”, with minimal structural changes in the adsorbate or adsorbent [69]. Consequently, was nearly temperature-independent, with values of –9.66 kJ/mol, –9.63 kJ/mol, and –9.60 kJ/mol at 25 °C, 35 °C, and 45 °C, respectively.
For RhB, it was found = 17.47 kJ/mol and = 78.86 J/(mol·K), indicating an endothermic process (> 0) with increased disorder at the solid/solution interface (> 0). This suggests potential structural changes in both the adsorbate and adsorbent during RhB adsorption. The process was more temperature-sensitive compared to Pb2+ adsorption, with values of –6.04 kJ/mol, –6.82 kJ/mol, and –7.61 kJ/mol at 25 °C, 35 °C, and 45 °C, respectively. The negative values for both Pb2+ and RhB confirm the spontaneity and feasibility of the adsorption process.
3.6.2. Isosteric Heat of Adsorption
The isosteric heat of adsorption () was calculated by estimating , for specific values using the nonlinear Langmuir model (Figure 4 and Table S7), which provided excellent agreement with experimental data. Figure S15 (Supplementary Materials) shows the estimated values for selected , fitted exponentially according to Equation (S48) (Supplementary Materials). Fit statistics are provided in Tables S11 and S12 (Supplementary Materials). As expected, higher adsorbent loading resulted in more nonlinear versus temperature dependencies, raising uncertainties about the Langmuir model’s applicability. Figure 5 shows distinct versus relationships for Pb2+ and RhB, respectively. Linear fit statistics are provided in Tables S13 and S14 (Supplementary Materials). Although versus dependencies are complex, they were assumed linear within the studied temperature and concentration ranges.
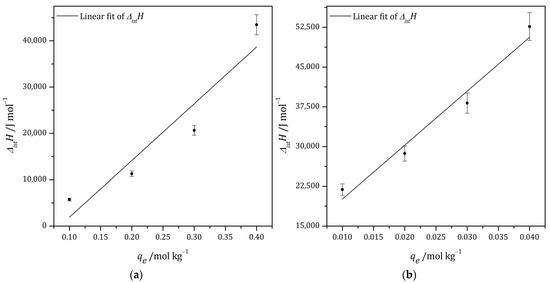
Figure 5.
Dependencies of ΔistH vs. qe, for (a) Pb2+ and (b) RhB adsorption on AKS-H3PO4.
For Pb2+ (Figure 5a), two possibilities emerge: (a) the adsorbent surface may be energetically heterogeneous, or (b) adsorbate molecules may interact, with interactions strengthening at higher concentrations. Extrapolating to yielded a value of –10.37 kJ/mol, consistent with within experimental error, suggesting physical interactions dominate Pb2+ adsorption. However, within the operational concentration range, ranged from 5.7 kJ/mol to 43.5 kJ/mol, indicating the presence of hydrogen bonding (≈2 kJ/mol – 40 kJ/mol), dentate interactions (≈40 kJ/mol), or dipole–dipole forces (≈2 kJ/mol – 29 kJ/mol) [70,71]. While Pb2+ adsorption is inherently exothermic under standard conditions, it becomes more favorable with increasing temperature () within operational ranges of concentrations, likely due to enhanced interaction frequencies and Pb2+ complex formation, highlighting the chemical nature of the process. In other words, energy input is necessary to facilitate bond formation, as the process involves overcoming repulsive forces between ions at short distances. Due to the proximity of the ions during bonding, an external energy source, such as heat, is required to drive the endothermic reaction and enable the adsorbent to effectively bind the ions.
As for Pb2+, for RhB (Figure 5b), exhibited a strong dependence on qe, suggesting an energetically heterogeneous AKS-H3PO4 surface, but unlike Pb2+, RhB molecules do not interact during adsorption. Extrapolating to yielded a value of 9.91 kJ/mol, deviating from , but confirming the endothermic nature of the process. Within the studied concentration range, ranged from 21.9 kJ/mol to 52.6 kJ/mol, comparable to Pb2+ but at tenfold lower qe values. This variation may also be attributed to lateral interactions between adsorbed Pb2+ ions.
3.7. Summary Regarding Thermodynamics and Mechanisms of Adsorption Processes onto AKS-H3PO4
The adsorption processes of Pb2+ and RhB onto AKS-H3PO4 exhibit distinct energetic behaviors, as reflected by the opposite signs of their standard enthalpy changes (). This difference arises from the adsorption mechanism, which involves the displacement of pre-adsorbed water molecules by the adsorbate species. In endothermic processes, such as RhB adsorption, the adsorbate species replaces multiple water molecules, resulting in energy-requiring adsorption. Conversely, in exothermic processes like Pb2+ adsorption, the energy released during bond formation between the adsorbate and adsorbent exceeds the energy required for bond breaking, leading to heat release [69].
The size disparity between RhB and Pb2+ further influences their adsorption behavior. RhB, with an effective diameter of ~1.3 nm, is approximately five times larger than Pb2+ (~0.24 nm). This size difference also explains the lower saturation capacity of AKS-H3PO4 for RhB, despite similar enthalpy changes () for both adsorbates. The comparable values suggest that similar bonding forces govern the adsorption of both species, indicating a physicochemical nature of the processes within the observed concentration range. The standard entropy change () also differs significantly between the two adsorbates, reflecting their structural and size differences. Pb2+ adsorption is associated with < 0, indicating minimal structural changes in the adsorbent and adsorbate. In contrast, RhB adsorption exhibits > 0, suggesting significant structural rearrangements, likely due to RhB’s ability to exist in multiple forms (cationic or zwitterionic) depending on the pH [72,73,74]. This structural variability may explain why the RhB removal is most efficient at 35 °C.
The activation agent for biomass precursor, particularly at high temperatures (>550 °C), significantly influences on adsorption capacity of ACs by increasing mesopore width and creating new micropores. This structural adaptation is crucial for efficient contaminant removal, as evidenced by the superior performance of chemically activated carbon — AKS-H3PO4, compared to physically activated carbon-AKS-CO2, which experiences reduced pore volume and surface area, under similar carbonization conditions. It should be noted that a higher gas flow rate of the CO2 activating agent may result in activated carbon with a smaller specific surface area [75]. At lower temperatures (e.g., 25 °C), Pb2+ adsorption is primarily driven by oxygen-containing functional groups and smaller micropores. However, at elevated temperatures (e.g., 45 °C), AKS-H3PO4 demonstrates enhanced Pb2+ adsorption capacity. In contrast, RhB adsorption is more temperature-sensitive, with optimal removal achieved at 35 °C, likely due to the restructuring of the solid/solution interface and the occupation of diverse adsorption sites. Figure 6 provides a schematic representation of the proposed adsorption mechanisms for Pb2+ and RhB onto AKS-H3PO4, highlighting the distinct processes involved.
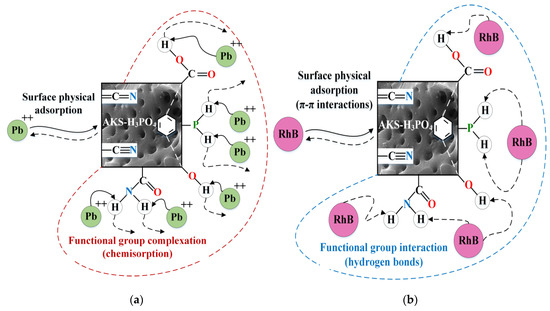
Figure 6.
Schematic representation of the potential adsorption mechanisms onto the AKS-H3PO4 adsorbent-specimen: (a) Pb2+, and (b) RhB.
Table 4 compares the performance of AKS-H3PO4 with other agricultural waste-derived adsorbents in removing Pb2+ and RhB. It underscores the effectiveness of agricultural waste (husks, hulls, and stones/shells) as a precursor for adsorbent preparation, with performance influenced by solution conditions, such as pH, temperature, and adsorbate concentration.
Table 4.
Comparison of agricultural waste/by-product-based adsorbents for Pb2+ and RhB removal: maximum adsorption capacity (qm, mg/g), maximum removal efficiency (R, %), pH, dose (D, g/L), concentration (C, mg/L), and temperature (T, °C).
The results presented in Table 4 demonstrate that agricultural waste and by-products serve as excellent carbon precursors for synthesizing effective adsorbents capable of removing both inorganic and organic contaminants, such as heavy metal ions (e.g., Pb2+) and dyes (e.g., RhB). The performance of adsorbents is influenced not only by the experimental conditions but also by the chemical nature of the biomass precursor, which collectively determine the optimal adsorption efficiency. Transport phenomena also play a critical role in adsorption processes. Factors such as mixing intensity, adsorbate concentration (dilute or non-dilute), particle size, and the affinity of the adsorbate for the adsorbent determine whether external transport or intra-particle diffusion limits the process. The degree of pore development in the adsorbent is particularly important in regulating the adsorption mechanism [113], especially for achieving maximum RhB removal, as shown in Table 4. In the context of activated carbons–liquid phase interactions, the maximum sorption capacity is influenced by: (a) the physical properties of the adsorbent, such as pore structure, inorganic content, and functional groups; (b) the properties of the adsorbate, including functional groups, polarity, molecular weight, and size; and (c) solution conditions, such as temperature, pH, adsorbate concentration, ionic strength, and adsorbent dose. The pH of the solution, in particular, profoundly affects RhB adsorption. At pH < 4, RhB exists in a cationic, monomeric form, facilitating its entry into the adsorbent pores. However, at pH > 4, RhB adopts a zwitterionic form, leading to molecular aggregation and reduced pore accessibility due to strong electrostatic interactions [114,115,116]. The maximum adsorption capacity of AKS-H3PO4 for RhB (Table 4), far exceeds that of many other agricultural waste-derived adsorbents, such as banana bark carbon, nano-porous Jack fruit peel carbon, palm kernel shell adsorbent, sugarcane fiber, microwave-activated rice husk ash, animal bone meal, oil palm empty fruit bunch AC, and ZnCl2-activated wood apple carbon [117]. This superior performance of AKS-H3PO4, coupled with its physicochemical properties that facilitate easy regeneration [118,119], highlights its potential for further optimization and application in water treatment processes.
3.8. Results of DFT Computations
3.8.1. The Estimation of AKS-H3PO4 Surface Coverage
To estimate the equilibrium surface coverage from adsorption experiments, the adsorption sites were modeled as boxes with dimensions approximating the size of the adsorbate species: 11 × 17 Å2 for RhB and 3 × 3 Å2 for Pb2+ ions. The total number of adsorption sites was calculated by dividing the total surface area obtained from BET experiments (Table 2) by the area of a single adsorption site. The AKS-H3PO4 surface coverage, expressed as a percentage of occupied sites, was determined by dividing the equilibrium amount of adsorbed moles of adsorbate by the total number of moles of adsorption sites in an experimental setup. The dependence of equilibrium adsorbate coverage on the initial concentrations of Pb2+ and RhB is illustrated in Figure 7.
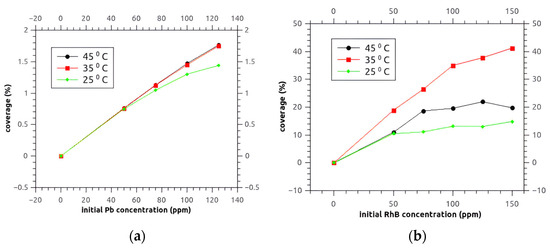
Figure 7.
Dependence of equilibrium adsorbate coverage on the initial concentrations of (a) Pb2+ and (b) RhB, at different temperatures.
For Pb2+, equilibrium coverage did not exceed 2% of total adsorption sites across all temperatures. At 25 °C, the saturation coverage of 1.45% was achieved at 120 ppm. At the higher temperatures (at 35 °C and 45 °C), saturation was not reached within the tested concentration range, indicating that Pb2+ adsorption becomes “more efficient” with increasing temperature, and the adsorbent seems able to collect more Pb2+ ions at higher temperatures (Figure 7a). These results suggest that Pb2+ adsorption is dominated by chemisorption at sites activated by functional groups on the adsorbent surface. On the other hand, the equilibrium coverage of RhB ranged from 5% to 20%, depending on temperature (Figure 7b). This indicates that RhB adsorption, at least within the studied concentration range, is less chemically sensitive compared to Pb2+ adsorption, and occupies a wider variety of adsorption sites. These findings align well with the assumptions and conclusions drawn earlier in this study.
3.8.2. Model Surfaces for Adsorption of Pb2+ and RhB
The surface models were created to match the experimental data from the surface characterization as much as possible. AKS-H3PO4 surface was considered to include bare graphene, graphene edges (modeled as an H-saturated mono-vacancy), oxygen (modeled as a mono-vacancy-MV with a bound OH-group, and phosphorus (modeled as a mono-vacancy with a bound PH2 group) (see Figure S16, Supplementary Materials). Model surfaces are created for the most functionalized graphene-oxide adsorbent material, in the case of conventional wastewater treatments [120,121].
3.8.3. Adsorption of Pb2+ Ions
Adsorption of Pb2+ ions (represented as PbCl2 in a gas phase) was calculated on the appropriate model surfaces. The results are presented in Table 5.
Table 5.
Surface models, optimized geometry of adsorbed PbCl2 and the corresponding adsorption energies. “n.s.” stands for “not stable”. Color code: carbon—black, oxygen—dark red, phosphorus—dark yellow, hydrogen—light blue, Pb—grey, chlorine—green.
Oxygen-rich defects represent the sites of strong PbCl2 binding, being in good agreement with the proposition that Pb2+ binds chemically on the adsorbent surface, occupying exactly the particular oxygen-rich active sites. Interestingly, PbCl2 is thermodynamically stable even on bare graphene, suggesting that “perfect” carbon sites could also be occupied by Pb2+. Moreover, a site with the PH2 group also exhibits affinity to bind PbCl2. On the other hand, PbCl2 is not stable on the H-saturated MV surfaces, suggesting that edges probably do not have any significant share in the adsorption of Pb2+. These results align with published DFT studies demonstrating that carboxyl and hydroxyl groups significantly enhance Pb2+ adsorption through strong electrostatic interactions and complexation, facilitated by coordination bond formation [122].
3.8.4. Adsorption of RhB Dye
Adsorption of the RhB molecule is more complex, due to the size of the considered molecule. The optimized adsorption geometries and the calculated adsorption energies of the RhB molecule are represented in Table 6.
Table 6.
Adsorption of RhB on the selected model surfaces—the optimized geometries and adsorption energies. Color code: carbon—black, oxygen—dark red, phosphorus—dark yellow, hydrogen—light blue, nitrogen—purple.
Different from PbCl2, the obtained adsorption geometries for bare graphene and surface groups do not suggest any formation of a real chemical bond between the adsorbate and the substrate. However, the RhB is in all cases stabilized about 3 Å (~0.3 nm) above the surface, similar to the distance between layers in graphite, suggesting the probable existence of π–π interactions between the graphene and RhB [123]. In the previous work [124], the contribution of Van-der-Waals interactions to the adsorption of RhB on the bare graphene was discussed. When a defect is introduced to provoke the formation of a real chemical bond between surface and adsorbate (H-saturated MV, simple MV with OH and PH2 groups), a transfer of the proton occurs from the surface group (PH2 or OH) to the negatively charged carboxyl group of RhB. In this case, the interaction energy between the surface and the adsorbate increases, due to the redistribution of the bonds in the gas phase. However, the high interaction energies still do not originate from the formation of a chemical surface–adsorbate bond. In the case of simple MV with PH2 group, the distance between carboxyl oxygen and the surface hydrogen of PH2 is 2.5 Å (~0.25 nm), implying that the formation of hydrogen bonds is also possible between the adsorbate and the surface functional group. Overall, the obtained results in this contribution pointed out that the physisorption based on hydrogen bonds with functional groups, and π–π interactions with bare carbon surface dominate, while covalent binding hardly contributes to the adsorption of RhB on the investigated surfaces. The consistencies between these results, the mechanistic insights from Section 3.7, and the established literature [125,126] strongly support the validity of our conclusions.
4. Discussion
Activated carbons derived from lignocellulosic biomass, such as AKS, exhibit excellent physicochemical properties, making them highly effective for the removal of contaminants from water [127,128,129,130,131,132,133]. In this study, novel types of activated carbon were synthesized from AKS, an agricultural waste material, using both physical and chemical activation methods. Physical activation was achieved using CO2 gas, while chemical activation employed phosphoric acid (H3PO4), resulting in the production of AKS-CO2 and AKS-H3PO4 activated carbons, respectively. The physicochemical properties of the synthesized materials were characterized using advanced analytical techniques, including FTIR, XRD, SEM, and BET analysis.
The characterization of AKS-CO2 and AKS-H3PO4 revealed significant differences in their structural and functional properties. The chemically activated AKS-H3PO4 demonstrated an exceptionally large specific surface area (SBET = 1159.4 m2/g), placing it within the range of commercial engineering adsorbents. Its N2 adsorption–desorption isotherm, classified as Type I(b), indicated a broad pore size distribution, including wider micropores and potential narrow mesopores, which significantly enhanced its adsorption capabilities. AKS-H3PO4 exhibited phosphorus-specific functionalities and a higher abundance of oxygen-containing groups, underscoring the advantages of chemical activation over physical activation. In contrast, AKS-CO2 adsorbent had a much lower specific surface area and a narrower pore size distribution, which limited its adsorption capacity, compared to AKS-H3PO4 adsorbent.
To evaluate the application potential of these carbon materials in wastewater treatment, adsorption experiments were conducted using aqueous solutions contaminated with Pb2+ ions and RhB dye. The results demonstrated that the ACs derived from chemically activated AKS exhibited high adsorption capacities for both contaminants. Moreover, AKS-H3PO4 proved to be a far superior adsorbent compared to AKS-CO2. Consequently, further detailed analyses were performed exclusively on AKS-H3PO4. A detailed kinetic and thermodynamic analysis of the adsorption process was performed, revealing that RhB adsorption is more temperature-dependent yet less chemically sensitive than the Pb2+ adsorption, while also providing insights into the most probable adsorption mechanisms and the spontaneity of the process.
Removal efficiencies for Pb2+ ions and RhB dye were 85.1% and 80.3%, respectively, with maximum adsorption observed at 45 °C for Pb2+ and 35 °C for RhB. The adsorption equilibrium for both contaminants was well-described by the Langmuir isotherm, suggesting monolayer adsorption on a homogeneous surface. However, further analysis revealed structural changes and interactions within adsorbent–adsorbate system, raising questions about the applicability of the Langmuir model for evaluating thermodynamic parameters. Kinetic analyses revealed that the adsorption of Pb2+ was most closely aligned with the pseudo-second-order model, suggesting film diffusion and surface chemisorption as the dominant mechanisms. In contrast, RhB adsorption was best described by the pseudo-first-order model, with intra-particle diffusion playing a primary role. Thermodynamic analysis confirmed the spontaneous nature of both adsorption processes. However, enthalpy changes revealed distinct differences between the two contaminants: Pb2+ adsorption was exothermic under standard conditions () yet exhibited positive values of the isosteric heat of adsorption () within the studied concentration and temperature ranges, consistent with chemisorption. In contrast, for RhB dye, both and values were positive, but for lower adsorption loadings (qe) associated with , emphasizing the predominance of physisorption mechanisms. Furthermore, DFT computations provided atomic-level insights into adsorption mechanisms. For Pb2+ ions, chemisorption dominated, occurring primarily at functional group-activated sites, with minimal contribution from bare graphene edges. In contrast, RhB adsorption was governed by physisorption, driven by hydrogen bonding with functional groups and π–π interactions with the carbon surface, while covalent binding played a negligible role. These DFT findings fully supported the proposed adsorption mechanisms for both contaminants onto AKS-H3PO4 surface.
5. Conclusions
In summary, this study highlights the potential of AKS-derived activated carbons, particularly AKS-H3PO4, as highly efficient and sustainable adsorbents for the removal of inorganic and organic contaminants from wastewater. The prepared activated carbons were characterized using advanced analytical techniques that offered comprehensive insights into the structural, chemical, and surface properties of the adsorbents. The analysis revealed critical information about the microstructure and functional groups of the produced ACs, confirming their formation and the underlying reaction mechanisms. Such insights are essential for classifying the materials and determining their suitability for practical applications. The combination of experimental characterization, detailed kinetic and thermodynamic analyses, and DFT modeling provides a comprehensive understanding of the adsorption processes, supporting the rational design and optimization of biochar-based adsorbents for environmental applications.
Supplementary Materials
The following supporting information can be downloaded at: https://www.mdpi.com/article/10.3390/pr13061715/s1, Text S1: Analytical techniques used for structural characterization of activated carbons; Text S2: Methods used to calculate the adsorption capacity of the AKS-CO2 or AKS-H3PO4; Text S3: Adsorption equilibrium and kinetics; Text S4: Thermodynamic study; Text S5: DFT computations—methodology; Figure S1: FTIR spectra for: (a) AKS-CO2, and (b) AKS-H3PO4 samples. The main vibrational bands are marked in all FTIR spectra; Figure S2: The XRD patterns of AKS-CO2 and AKS-H3PO4 samples; Figure S3: Fitting linearly Pb2+ adsorption isotherms regarding AKS-H3PO4 adsorbent (black—at 25 °C, red—at 35 °C, and blue—at 45 °C): (a) Langmuir, (b) Freundlich, (c) Temkin, and (d) Dubinin–Radushkevich (D–R), respectively. Error bars represent the standard deviation of the measurements; Figure S4: Fitting linearly Rhodamine B (RhB) adsorption isotherms (black—at 25 °C, red—at 35 °C, and blue—at 45 °C): (a) Langmuir, (b) Freundlich, (c) Temkin, and (d) Dubinin–Radushkevich (D–R), respectively. Error bars represent the standard deviation of the measurements; Figure S5: Isotherms of Pb2+ during adsorption from aqueous solutions, using synthesized carbon adsorbent AKS-H3PO4 ((a)—at 25 °C, (b)—at 35 °C, and (c)—at 45 °C): Experimental data (scatter circles) vs. model predictions: Langmuir isotherm (solid line), Freundlich isotherm (dash line), Temkin isotherm (dot line), and D–R—Dubinin–Radushkevich isotherm (dash-dot line). Error bars represent 5% of the measured data; Figure S6: Isotherms of RhB during adsorption from aqueous solutions, using synthesized carbon adsorbent AKS-H3PO4 ((a)—at 25 °C, (b)—at 35 °C, and (c)—at 45 °C): Experimental data (scatter circles) vs. model predictions: Langmuir isotherm (solid line), Freundlich isotherm (dash line), Temkin isotherm (dot line), and D–R—Dubinin–Radushkevich isotherm (dash-dot line). Error bars represent 5% of the measured data; Figure S7: Adsorptive uptake per unit mass of the AKS-H3PO4, at 25 °C for 24 h of Pb2+ removal from aqueous solutions of initial concentration of 100 mg/L—Experimental data (scatter circles) vs. model predictions: solid line—pseudo-first order (PFO) model, dash line—pseudo-second order (PSO) model, dot line—Elovich model, and dash dot line—Avrami model; Figure S8: Adsorptive uptake per unit mass of AKS-H3PO4, at 35 °C for 24 h of Rhodamine B (RhB) removal from aqueous solutions of initial concentration of 100 mg/L—Experimental data (scatter circles) vs. model predictions: solid line—pseudo-first order (PFO) model, dash line—pseudo-second order (PSO) model, dot line—Elovich model, and dash dot line—Avrami model; Figure S9: Pb2+—Fitting linearly the adsorption-diffusion models: (a) Intra-particle (IP) diffusion model (b) Diffusion-chemisorption (DC) model, (c) Boyd model, and (d) Bangham’s model; Figure S10: Rhodamine B (RhB)—Fitting linearly the adsorption-diffusion models: (a) Intra-particle (IP) diffusion model, (b) Diffusion-chemisorption (DC) model, (c) Boyd model, and (d) Bangham’s model; Figure S11: Adsorptive uptake per unit mass of AKS-H3PO4, at 25 °C for 24 h of Pb2+ removal from aqueous solutions of initial concentration of 100 mg/L—Experimental data (scatter circles) vs. model predictions: solid line—intra-particle (IP) diffusion model, dash line—diffusion-chemisorption (DC) model, dot line—Boyd model, and dash dot line—Bangham’s model. Error bars represent 5% of data; Figure S12: Adsorptive uptake per unit mass of AKS-H3PO4, at 35 °C for 24 h of Rhodamine B (RhB) removal from aqueous solutions of initial concentration of 100 mg/L—Experimental data (scatter circles) vs. model predictions: solid line—intra-particle (IP) diffusion model, dash line—diffusion-chemisorption (DC) model, dot line—Boyd model, and dash-dot line—Bangham’s model. Error bars represent 5% of data; Figure S13: Dependencies of ln() against , constructed from the adsorption isotherms of (a) Pb2+ and (b) RhB (25 °C, 35 °C, and 45 °C); Figure S14: Van’t Hoff plots for (a) Pb2+ and (b) RhB; Figure S15:Exponential fitting of vs. 1/T for (a) Pb2+ and (b) RhB adsorption on AKS-H3PO4; Figure S16: Model surfaces for adsorption of RhB and Pb2+: (a) bare graphene, (b) H-saturated MV, (c) H-saturated MV with OH group, (d) H-saturated MV with COOH group, (e) simple MV with OH group, (f) simple MV with PH2 group. Color code: carbon-black, oxygen-dark red, phosphorus-dark yellow, hydrogen-light blue; Table S1: Adsorption isotherms of Pb2+—estimated model parameters and calculated measures of goodness of fit; Table S2: Adsorption isotherms of Rhodamine B—Estimated model parameters, and the calculated measures of goodness of fit; Table S3: Estimated model parameters of adsorption-reaction models, and the calculated measures of goodness of fit, for Pb2+; Table S4: Estimated model parameters of adsorption-reaction models, and the calculated measures of goodness of fit, for Rhodamine B (RhB); Table S5: Pb2+—Estimated model parameters for adsorption-diffusion models, and the calculated measures of goodness of fit; Table S6: Rhodamine B—Estimated model parameters for adsorption-diffusion models, and the calculated measures of goodness of fit; Table S7: Results of qm and KL values for the adsorption of Pb2+ and RhB onto the AKS-H3PO4, at the different temperatures (25 °C, 35 °C and 45 °C)—nonlinear Langmuir; Table S8: The statistical evaluation related to Van’t Hoff equation analysis under the limiting value for the adsorption process of Pb2+ and RhB onto the AKS-H3PO4, at different temperatures (25 °C, 35 °C, and 45 °C); Table S9: The statistical evaluation of the proposed model in estimation of ΔH° and ΔS° quantities, for Pb2+ adsorption onto the AKS-H3PO4; Table S10: The statistical evaluation of the proposed model in estimation of ΔH° and ΔS° quantities, for RhB adsorption onto the AKS-H3PO4; Table S11: The statistical evaluation of the dependency ce vs. 1/T, for Pb2+ adsorption onto AKS-H3PO4; Table S12: The statistical evaluation of the dependency ce vs. 1/T, for RhB adsorption onto AKS-H3PO4; Table S13: The statistical evaluation of the dependency ΔistH vs. qe, for Pb2+ adsorption onto AKS-H3PO4; Table S14: The statistical evaluation of the dependency ΔistH vs. qe, for RhB adsorption onto AKS-H3PO4. References cited in Supplementary Materials [134,135,136,137,138,139,140,141,142,143,144,145,146,147,148,149,150,151,152,153,154,155,156,157,158,159,160,161,162,163,164,165,166,167,168,169,170,171,172,173,174,175,176,177,178,179,180,181,182,183,184,185,186,187,188,189,190,191,192].
Author Contributions
Conceptualization, M.J.D., D.V.A. and B.J.; methodology, M.P.R., M.J.D., D.V.A. and B.J.; validation, V.D., S.Ž. and V.P.; formal analysis, M.P.R., M.J.D. and D.V.A.; investigation, M.P.R. and M.J.D.; resources, V.D., S.Ž. and B.J.; data curation, M.P.R. and D.V.A.; writing—original draft preparation, M.P.R., M.J.D., D.V.A. and B.J.; writing—review and editing, V.D., S.Ž., V.P. and B.J.; visualization, V.D., S.Ž. and B.J.; supervision, V.P. and B.J.; project administration, V.P. and B.J.; funding acquisition, B.J. All authors have read and agreed to the published version of the manuscript.
Funding
This research was funded by Ministry of Science, Technological Development, and Innovation of the Republic of Serbia, grant numbers 451-03-136/2025-03/200017 and 451-03-136/2025-03/200135.
Data Availability Statement
The original contributions presented in this study are included in the article/Supplementary Material. Further inquiries can be directed to the corresponding authors.
Conflicts of Interest
The authors declare no conflicts of interest. The funders had no role in the design of the study; in the collection, analyses, or interpretation of data; in the writing of the manuscript; or in the decision to publish the results.
Abbreviations
The following abbreviations are used in this manuscript:
| Letter designations | |
| LC | Lignocellulose |
| AKS | Apricot kernel shells |
| ACs | Activated carbons |
| AKS-CO2 | Physically activated carbon (originated from AKS biomass precursor) |
| AKS-H3PO4 | Chemically activated carbon (originated from AKS biomass precursor) |
| RhB | Rhodamine B |
| PFO | Pseudo-first order |
| PSO | Pseudo-second order |
| IP | Intra-particle |
| DC | Diffusion-chemisorption |
| MV | Mono-vacancy |
| Physical Quantities | |
| CrI | Crystallinity index (%) |
| R2 | Coefficient of determination (dimensionless) |
| RL | The separation factor (dimensionless) |
| E | The average adsorption energy (kJ/mol) |
| C | Boundary layer thickness (mg/g) |
| KDC | Diffusion-chemisorption constant [mg·g−1·h−0.5] |
| T | Temperature (K or °C) |
| t | Time (h) |
| θ | Bragg angle (°) |
| qe | The equilibrium adsorption capacity of the adsorbent (mg/g) |
| ce | The equilibrium adsorbate concentration (mg/L) |
| co | The initial adsorbate concentration in the bulk liquid (mg/L) |
| qm | The maximum adsorption capacity (mg/g) |
| K° | The standard equilibrium constant (dimensionless) |
| ΔH° | The standard enthalpy change (kJ/mol) |
| ΔS° | The standard entropy change (J/(mol·K)) |
| ΔG° | The standard Gibbs free energy change (kJ/mol) |
| ΔistH | The isosteric heat of adsorption (kJ/mol) |
| ΔEads | Adsorption energy (eV) |
| Eslab+ads | Total energy of the optimized slab–adsorbate system (eV) |
| Etot,isol | Total energy of the isolated adsorbate (eV) |
| Etot,slab | Total energy of the bare surface slab (eV) |
| nads | The adsorption amount (mmol/g) |
| p/po | The relative pressure (dimensionless) |
| SBET | The BET specific surface area (m2/g) |
| Smeso | The meso-pores surface area (m2/g) |
| Vp(H-K) | The cumulative pore volume determined by Horvath–Kawazoe (cm3/g) |
| rm(H-K) | Median pore radius determined by Horvath–Kawazoe (nm) |
| rmax(H-K) | Maximum pore radius determined by Horvath–Kawazoe (nm) |
| Vmicro | The micro-pore volume (cm3/g) |
| Vp(B.J.H.) | The cumulative pore volume determined by Barrett–Joyner–Halenda (cm3/g) |
| rm(B.J.H.) | Median pore radius determined by Barrett–Joyner–Halenda (nm) |
| rmax(B.J.H.) | Maximum pore radius determined by Barrett–Joyner–Halenda (nm) |
| Vp(C-I) | The cumulative pore volume determined by Cranston–Inkley (cm3/g) |
| rm(C-I) | Median pore radius determined by Cranston–Inkley (nm) |
| rmax(C-I) | Maximum pore radius determined by Cranston–Inkley (nm) |
| Vp(D-H) | The cumulative pore volume determined by Dollimore–Heal (cm3/g) |
| rm(D-H) | Median pore radius determined by Dollimore–Heal (nm) |
| rmax(D-H) | Maximum pore radius determined by Dollimore–Heal (nm) |
References
- Noor, A.; Khan, S.A. Agricultural Wastes as Renewable Biomass to Remediate Water Pollution. Sustainability 2023, 15, 4246. [Google Scholar] [CrossRef]
- Rajput, V.; Saini, I.; Parmar, S.; Pundir, V.; Kumar, V.; Kumar, V.; Naik, B.; Rustagi, S. Biochar Production Methods and Their Transformative Potential for Environmental Remediation. Discov. Appl. Sci. 2024, 6, 408. [Google Scholar] [CrossRef]
- Biochar Standards. Available online: https://biochar-international.org/biochar-standards/ (accessed on 18 February 2025).
- Yaashikaa, P.R.; Kumar, P.S.; Varjani, S.; Saravanan, A. A Critical Review on the Biochar Production Techniques, Characterization, Stability and Applications for Circular Bioeconomy. Biotechnol. Rep. 2020, 28, e00570. [Google Scholar] [CrossRef]
- Qiu, B.; Shao, Q.; Shi, J.; Yang, C.; Chu, H. Application of Biochar for the Adsorption of Organic Pollutants from Wastewater: Modification Strategies, Mechanisms and Challenges. Sep. Purif. Technol. 2022, 300, 121925. [Google Scholar] [CrossRef]
- Biswal, B.K.; Balasubramanian, R. Use of Biochar as a Low-Cost Adsorbent for Removal of Heavy Metals from Water and Wastewater: A Review. J. Environ. Chem. Eng. 2023, 11, 110986. [Google Scholar] [CrossRef]
- Kobyłecki, R.; Ścisłowska, M.; Bis, Z. Carbonization of Biomass—An Efficient Tool to Decrease the Emission of CO2. Arch. Thermodyn. 2013, 34, 185–195. [Google Scholar] [CrossRef]
- Rampáčková, E.; Mrázová, M.; Čížková, J.; Nečas, T. Pomological Traits and Genome Size of Prunus armeniaca L. Considering to Geographical Origin. Horticulturae 2022, 8, 199. [Google Scholar] [CrossRef]
- Akhone, M.A.; Bains, A.; Tosif, M.M.; Chawla, P.; Fogarasi, M.; Fogarasi, S. Apricot Kernel: Bioactivity, Characterization, Applications, and Health Attributes. Foods 2022, 11, 2184. [Google Scholar] [CrossRef] [PubMed]
- Cañellas, J.; Femenia, A.; Rosselló, C.; Soler, L. Chemical Composition of the Shell of Apricot Seeds. J. Sci. Food Agric. 1992, 59, 269–271. [Google Scholar] [CrossRef]
- Shaikhiev, I.; Shaykhieva, K.; Sverguzova, S.; Fomina, E.; Vinogradenko, Y.; Fediuk, R.; Amran, M.; Svintsov, A.P.; de Azevedo, A.R.G.; Gunasekaran, M. Removing Pollutants from Sewage Waters with Ground Apricot Kernel Shell Material. Materials 2022, 15, 3428. [Google Scholar] [CrossRef]
- Janković, B.; Manić, N.; Dodevski, V.; Radović, I.; Pijović, M.; Katnić, Đ.; Tasić, G. Physico-Chemical Characterization of Carbonized Apricot Kernel Shell as Precursor for Activated Carbon Preparation in Clean Technology Utilization. J. Clean. Prod. 2019, 236, 117614. [Google Scholar] [CrossRef]
- Okoro, H.K.; Pandey, S.; Ogunkunle, C.O.; Ngila, C.J.; Zvinowanda, C.; Jimoh, I.; Lawal, I.A.; Orosun, M.M.; Adeniyi, A.G. Nanomaterial-Based Biosorbents: Adsorbent for Efficient Removal of Selected Organic Pollutants from Industrial Wastewater. Emerg. Contam. 2022, 8, 46–58. [Google Scholar] [CrossRef]
- Kang, C.; Zhu, L.; Wang, Y.; Wang, Y.; Xiao, K.; Tian, T. Adsorption of Basic Dyes Using Walnut Shell-Based Biochar Produced by Hydrothermal Carbonization. Chem. Res. Chin. Univ. 2018, 34, 622–627. [Google Scholar] [CrossRef]
- World Population Prospects. Available online: https://population.un.org/wpp/ (accessed on 22 May 2025).
- Kaza, S.; Yao, L.; Bhada-Tata, P.; Woerden, F.V. What a Waste 2.0: A Global Snapshot of Solid Waste Management to 2050; World Bank: Washington, DC, USA, 2018; ISBN 978-1-4648-1347-4. [Google Scholar]
- Circular Economy: Definition, Importance and Benefits. Available online: https://www.europarl.europa.eu/topics/en/article/20151201STO05603/circular-economy-definition-importance-and-benefits (accessed on 22 May 2025).
- Sajjadi, B.; Zubatiuk, T.; Leszczynska, D.; Leszczynski, J.; Chen, W.Y. Chemical Activation of Biochar for Energy and Environmental Applications: A Comprehensive Review. Rev. Chem. Eng. 2019, 35, 777–815. [Google Scholar] [CrossRef]
- Ukanwa, K.S.; Patchigolla, K.; Sakrabani, R.; Anthony, E.; Mandavgane, S. A Review of Chemicals to Produce Activated Carbon from Agricultural Waste Biomass. Sustainability 2019, 11, 6204. [Google Scholar] [CrossRef]
- Heidarinejad, Z.; Dehghani, M.H.; Heidari, M.; Javedan, G.; Ali, I.; Sillanpää, M. Methods for Preparation and Activation of Activated Carbon: A Review. Environ. Chem. Lett. 2020, 18, 393–415. [Google Scholar] [CrossRef]
- Jagtoyen, M.; Derbyshire, F. Activated Carbons from Yellow Poplar and White Oak by H3PO4 Activation. Carbon 1998, 36, 1085–1097. [Google Scholar] [CrossRef]
- Neme, I.; Gonfa, G.; Masi, C. Preparation and Characterization of Activated Carbon from Castor Seed Hull by Chemical Activation with H3PO4. Results Mater. 2022, 15, 100304. [Google Scholar] [CrossRef]
- El-Hendawy, A.-N.A. An Insight into the KOH Activation Mechanism through the Production of Microporous Activated Carbon for the Removal of Pb2+ Cations. Appl. Surf. Sci. 2009, 255, 3723–3730. [Google Scholar] [CrossRef]
- Satayev, M.I.; Alibekov, R.S.; Satayeva, L.M.; Baiysbay, O.P.; Mutaliyeva, B.Z. Characteristics of Activated Carbons Prepared from Apricot Kernel Shells by Mechanical, Chemical and Thermal Activations. Mod. Appl. Sci. 2015, 9, p104. [Google Scholar] [CrossRef]
- Pet, I.; Sanad, M.N.; Farouz, M.; ElFaham, M.M.; El-Hussein, A.; El-sadek, M.S.A.; Althobiti, R.A.; Ioanid, A. Review: Recent Developments in the Implementation of Activated Carbon as Heavy Metal Removal Management. Water Conserv. Sci. Eng. 2024, 9, 62. [Google Scholar] [CrossRef]
- Natrayan, L.; Kaliappan, S.; Dheeraj Kumar Reddy, C.N.; Karthick, M.; Sivakumar, N.s.; Patil, P.P.; Sekar, S.; Thanappan, S. Development and Characterization of Carbon-Based Adsorbents Derived from Agricultural Wastes and Their Effectiveness in Adsorption of Heavy Metals in Waste Water. Bioinorg. Chem. Appl. 2022, 2022, 1659855. [Google Scholar] [CrossRef] [PubMed]
- Vashchynskyi, V.; Okhay, O.; Boychuk, T. Chemical Activation of Apricot Pit-Derived Carbon Sorbents for the Effective Removal of Dyes in Environmental Remediation. C 2023, 9, 93. [Google Scholar] [CrossRef]
- Erdoğan, S.; Önal, Y.; Akmil-Başar, C.; Bilmez-Erdemoğlu, S.; Sarıcı-Özdemir, Ç.; Köseoğlu, E.; İçduygu, G. Optimization of Nickel Adsorption from Aqueous Solution by Using Activated Carbon Prepared from Waste Apricot by Chemical Activation. Appl. Surf. Sci. 2005, 252, 1324–1331. [Google Scholar] [CrossRef]
- Adhami, S.; Ghorbanpoor, H.; Azak, B.; Kapucu, S.; Nurbas, M.; Avcı, H. A novel approach for water treatment by using activated carbon: Apricot kernel shell. Eskişeh. Osman. Üniversitesi Mühendis. Ve Mimar. Fakültesi Derg. 2018, 26, 1–7. [Google Scholar] [CrossRef]
- CDC Substance Priority List. Available online: https://www.atsdr.cdc.gov/programs/substance-priority-list.html (accessed on 18 February 2025).
- Behera, A.K.; Shadangi, K.P.; Sarangi, P.K. Efficient Removal of Rhodamine B Dye Using Biochar as an Adsorbent: Study the Performance, Kinetics, Thermodynamics, Adsorption Isotherms and Its Reusability. Chemosphere 2024, 354, 141702. [Google Scholar] [CrossRef]
- Al-Ghouti, M.A.; Da’ana, D.A. Guidelines for the Use and Interpretation of Adsorption Isotherm Models: A Review. J. Hazard. Mater. 2020, 393, 122383. [Google Scholar] [CrossRef]
- Giannozzi, P.; Baroni, S.; Bonini, N.; Calandra, M.; Car, R.; Cavazzoni, C.; Ceresoli, D.; Chiarotti, G.L.; Cococcioni, M.; Dabo, I.; et al. QUANTUM ESPRESSO: A Modular and Open-Source Software Project for Quantum Simulations of Materials. J. Phys. Condens. Matter 2009, 21, 395502. [Google Scholar] [CrossRef]
- Kokalj, A. XCrySDen—A New Program for Displaying Crystalline Structures and Electron Densities. J. Mol. Graph. Model. 1999, 17, 176–179. [Google Scholar] [CrossRef]
- Kuyanov-Prozument, K.; Choi, M.Y.; Vilesov, A.F. Spectrum and Infrared Intensities of OH-Stretching Bands of Water Dimers. J. Chem. Phys. 2010, 132, 014304. [Google Scholar] [CrossRef]
- Sufian, J.; Babaakbari Sari, M.; Marchelli, F.; Fiori, L.; Avanes, A.; Moradi, S. An Analysis of the Factors Influencing Cadmium Removal in Aquatic Environments by Chlorella Vulgaris-Derived Solids. C 2024, 10, 2. [Google Scholar] [CrossRef]
- Haris, M.R.H.M.; Sathasivam, K. The Removal of Methyl Red from Aqueous Solutions Using Banana Pseudostem Fibers. Am. J. Appl. Sci. 2009, 6, 1690–1700. [Google Scholar] [CrossRef]
- Saka, C. BET, TG–DTG, FT-IR, SEM, Iodine Number Analysis and Preparation of Activated Carbon from Acorn Shell by Chemical Activation with ZnCl2. J. Anal. Appl. Pyrolysis 2012, 95, 21–24. [Google Scholar] [CrossRef]
- Al-rawi, M.; Tomma, J. Synthesis of New 1,2,4-Triazole Derivatives with Expected Biological Activities. Chem. Methodol. 2021, 6, 59–66. [Google Scholar] [CrossRef]
- Ilić, M.; Haegel, F.-H.; Lolić, A.; Nedić, Z.; Tosti, T.; Ignjatović, I.S.; Linden, A.; Jablonowski, N.D.; Hartmann, H. Surface Functional Groups and Degree of Carbonization of Selected Chars from Different Processes and Feedstock. PLoS ONE 2022, 17, e0277365. [Google Scholar] [CrossRef]
- Liu, H.; Kaya, H.; Lin, Y.-T.; Ogrinc, A.; Kim, S.H. Vibrational Spectroscopy Analysis of Silica and Silicate Glass Networks. J. Am. Ceram. Soc. 2022, 105, 2355–2384. [Google Scholar] [CrossRef]
- Aldahasi, R.M.; Shami, A.; Mohammed, A.E. Bimetallic Nanoparticles and Biochar Produced by Adansonia Digitata Shell and Their Effect against Tomato Pathogenic Fungi. PeerJ 2024, 12, e17023. [Google Scholar] [CrossRef]
- Nguyen, L.X.; Do, P.T.M.; Nguyen, C.H.; Kose, R.; Okayama, T.; Pham, T.N.; Nguyen, P.D.; Miyanishi, T. Properties of Biochars Prepared from Local Biomass in the Mekong Delta, Vietnam. BioResources 2018, 13, 7325–7344. [Google Scholar] [CrossRef]
- Adeniyi, A.; Ighalo, J.O.; Onifade, D.; Popoola, A. Production of Hybrid Biochar by Retort-Heating of Elephant Grass (Pennisetum purpureum) and Low Density Polyethylene (LDPE) for Waste Management and Product Development. J. Mater. Environ. Sci. 2020, 11, 1940–1952. [Google Scholar]
- Samsonowicz, M.; Hrynaszkiewicz, T.; Świsłocka, R.; Regulska, E.; Lewandowski, W. Experimental and Theoretical IR, Raman, NMR Spectra of 2-, 3- and 4-Aminobenzoic Acids. J. Mol. Struct. 2005, 744–747, 345–352. [Google Scholar] [CrossRef]
- Guo, Y.; Bustin, R.M. FTIR Spectroscopy and Reflectance of Modern Charcoals and Fungal Decayed Woods: Implications for Studies of Inertinite in Coals. Int. J. Coal Geol. 1998, 37, 29–53. [Google Scholar] [CrossRef]
- Ramola, S.; Mishra, T.; Rana, G.; Srivastava, R.K. Characterization and Pollutant Removal Efficiency of Biochar Derived from Baggase, Bamboo and Tyre. Environ. Monit. Assess. 2014, 186, 9023–9039. [Google Scholar] [CrossRef]
- Maguana, Y.E.; Elhadiri, N.; Bouchdoug, M.; Benchanaa, M. Optimization of Preparation Conditions of Activated Carbon from Nut Oil Cake Using Response Surface Methodology. Moroc. J. Chem. 2018, 6, 92–105. [Google Scholar] [CrossRef]
- Ahmad, A.; Jini, D.; Aravind, M.; Parvathiraja, C.; Ali, R.; Kiyani, M.Z.; Alothman, A. A Novel Study on Synthesis of Egg Shell Based Activated Carbon for Degradation of Methylene Blue via Photocatalysis. Arab. J. Chem. 2020, 13, 8717–8722. [Google Scholar] [CrossRef]
- Gupta, V.; Sharma, N.; Singh, U.; Arif, M.; Singh, A. Higher Oxidation Level in Graphene Oxide. Optik 2017, 143, 115–124. [Google Scholar] [CrossRef]
- Mopoung, S.; Amornsakchai, P. Production of KMnO4 Modified Activated Carbon Fiber Filter from Pineapple Leaf Carbon Fiber for Fe3+ and Ca2+ Ions Adsorption. Indian J. Sci. Technol. 2017, 10, 1–14. [Google Scholar] [CrossRef]
- Dutournié, P.; Bruneau, M.; Brendlé, J.; Limousy, L.; Pluchon, S. Mass transfer modelling in clay-based material: Estimation of apparent diffusivity of a molecule of interest. Comptes Rendus Chim. 2019, 22, 250–257. [Google Scholar] [CrossRef]
- Jiao, W.; Liu, Z.; Huang, T.; Tan, L.; Hao, Y.; Wang, Y.; Lin, T.; Yang, H.; Sai, H. Fabrication of Hydrophilic Cellulose Graft Copolymer/SiO2 Coated Mesh for Efficient Oil-Water Separation. Colloids Surf. Physicochem. Eng. Asp. 2024, 696, 134333. [Google Scholar] [CrossRef]
- Nelson, E.S.; Iyuke, S.; Daramola, M.O.; Okewale, A. Extraction and Characterization of Silica from Empty Palm Fruit Bunch (EPFB) Ash. Processes 2023, 11, 1684. [Google Scholar] [CrossRef]
- Hulicova-Jurcakova, D.; Seredych, M.; Lu, G.Q.; Kodiweera, N.K.A.C.; Stallworth, P.E.; Greenbaum, S.; Bandosz, T.J. Effect of Surface Phosphorus Functionalities of Activated Carbons Containing Oxygen and Nitrogen on Electrochemical Capacitance. Carbon 2009, 47, 1576–1584. [Google Scholar] [CrossRef]
- Ruiz-Rosas, R.; García-Mateos, F.J.; Gutiérrez, M.d.C.; Rodríguez-Mirasol, J.; Cordero, T. About the Role of Porosity and Surface Chemistry of Phosphorus-Containing Activated Carbons in the Removal of Micropollutants. Front. Mater. 2019, 6, e00134. [Google Scholar] [CrossRef]
- Sing, K.S.W. Reporting Physisorption Data for Gas/Solid Systems with Special Reference to the Determination of Surface Area and Porosity (Recommendations 1984). Pure Appl. Chem. 1985, 57, 603–619. [Google Scholar] [CrossRef]
- Thommes, M.; Kaneko, K.; Neimark, A.V.; Olivier, J.P.; Rodriguez-Reinoso, F.; Rouquerol, J.; Sing, K.S.W. Physisorption of Gases, with Special Reference to the Evaluation of Surface Area and Pore Size Distribution (IUPAC Technical Report). Pure Appl. Chem. 2015, 87, 1051–1069. [Google Scholar] [CrossRef]
- Elmouwahidi, A.; Bailón-García, E.; Pérez-Cadenas, A.F.; Maldonado-Hódar, F.J.; Carrasco-Marín, F. Activated Carbons from KOH and H3PO4-Activation of Olive Residues and Its Application as Supercapacitor Electrodes. Electrochim. Acta 2017, 229, 219–228. [Google Scholar] [CrossRef]
- Horikawa, T.; Do, D.D.; Nicholson, D. Capillary Condensation of Adsorbates in Porous Materials. Adv. Colloid Interface Sci. 2011, 169, 40–58. [Google Scholar] [CrossRef]
- Inglezakis, V.J.; Zorpas, A.A. Heat of Adsorption, Adsorption Energy and Activation Energy in Adsorption and Ion Exchange Systems. Desalination Water Treat. 2012, 39, 149–157. [Google Scholar] [CrossRef]
- Suter, E.; Rutto, H.; Kohitlhetse, I. Adsorptive Removal of Pb2+ from Aqueous Solution by Magnetic Biodegradable and Polymeric Cellulose/Nylon 6 @Fe3O4 Nanocomposite Encapsulated with Chitosan. Desalination Water Treat. 2024, 320, 100782. [Google Scholar] [CrossRef]
- Kamal, M.H.M.A.; Azira, W.M.K.W.K.; Kasmawati, M.; Haslizaidi, Z.; Saime, W.N.W. Sequestration of Toxic Pb(II) Ions by Chemically Treated Rubber (Hevea brasiliensis) Leaf Powder. J. Environ. Sci. 2010, 22, 248–256. [Google Scholar] [CrossRef]
- El Bardiji, N.; Ziat, K.; Naji, A.; Saidi, M. Fractal-Like Kinetics of Adsorption Applied to the Solid/Solution Interface. ACS Omega 2020, 5, 5105–5115. [Google Scholar] [CrossRef]
- Youssif, M.M.; El-Attar, H.G.; Hessel, V.; Wojnicki, M. Recent Developments in the Adsorption of Heavy Metal Ions from Aqueous Solutions Using Various Nanomaterials. Materials 2024, 17, 5141. [Google Scholar] [CrossRef]
- Módenes, A.N.; Hinterholz, C.L.; Neves, C.V.; Sanderson, K.; Trigueros, D.E.G.; Espinoza-Quiñones, F.R.; Borba, C.E.; Steffen, V.; Scheufele, F.B.; Kroumov, A.D. A New Alternative to Use Soybean Hulls on the Adsorptive Removal of Aqueous Dyestuff. Bioresour. Technol. Rep. 2019, 6, 175–182. [Google Scholar] [CrossRef]
- Rouquerol, J.; Rouquerol, F.; Llewellyn, P.; Maurin, G.; Sing, K. Adsorption by Powders and Porous Solids: Principles, Methodology and Applications; Academic Press: Cambridge, MA, USA, 2013; ISBN 978-0-08-097036-3. [Google Scholar]
- Salvestrini, S.; Leone, V.; Iovino, P.; Canzano, S.; Capasso, S. Considerations about the Correct Evaluation of Sorption Thermodynamic Parameters from Equilibrium Isotherms. J. Chem. Thermodyn. 2014, 68, 310–316. [Google Scholar] [CrossRef]
- Saha, P.; Chowdhury, S. Insight Into Adsorption Thermodynamics. In Thermodynamics; Tadashi, M., Ed.; InTech: London, UK, 2011; ISBN 978-953-307-544-0. [Google Scholar]
- Pourhakkak, P.; Taghizadeh, A.; Taghizadeh, M.; Ghaedi, M.; Haghdoust, S. Chapter 1—Fundamentals of Adsorption Technology. In Interface Science and Technology; Ghaedi, M., Ed.; Adsorption: Fundamental Processes and Applications; Elsevier: Amsterdam, The Netherlands, 2021; Volume 33, pp. 1–70. [Google Scholar]
- Gökırmak Söğüt, E.; Gülcan, M. Chapter 1—Adsorption: Basics, Properties, and Classification. In Adsorption Through Advanced Nanoscale Materials; Verma, C., Aslam, J., Khan, M.E., Eds.; Micro and Nano Technologies; Elsevier: Amsterdam, The Netherlands, 2023; pp. 3–21. ISBN 978-0-443-18456-7. [Google Scholar]
- Hoenke, S.; Serbian, I.; Deigner, P.; Csuk, R. Mitocanic Di- and Triterpenoid Rhodamine B Conjugates. Molecules 2020, 25, 5443. [Google Scholar] [CrossRef]
- Jinendra, U.; Bilehal, D.; Nagabhushana, B.M.; Kumar, A.P. Adsorptive Removal of Rhodamine B Dye from Aqueous Solution by Using Graphene–Based Nickel Nanocomposite. Heliyon 2021, 7, e06851. [Google Scholar] [CrossRef]
- Adeola, A.O.; Cui, M.; Naccache, R. Rhodamine B Sequestration Using Acid-Precipitated and Microwave-Treated Softwood Lignin: Comparative Isotherm, Kinetics and Thermodynamic Studies. Environ. Technol. Innov. 2023, 32, 103419. [Google Scholar] [CrossRef]
- Shoaib, M.; Al-Swaidan, H.M. Effect of CO2 Flow Rate on the Synthesis of Sliced Activated Carbon from Date Palm Tree Fronds (Agro Waste) by Physical Activation. Asian J. Chem. 2014, 26, 7025–7028. [Google Scholar] [CrossRef]
- Abdel-Ghani, N.T.; Elchaghaby, G.A. Influence of Operating Conditions on the Removal of Cu, Zn, Cd and Pb Ions from Wastewater by Adsorption. Int. J. Environ. Sci. Technol. 2007, 4, 451–456. [Google Scholar] [CrossRef]
- Amen, R.; Yaseen, M.; Mukhtar, A.; Klemeš, J.J.; Saqib, S.; Ullah, S.; Al-Sehemi, A.G.; Rafiq, S.; Babar, M.; Fatt, C.L.; et al. Lead and Cadmium Removal from Wastewater Using Eco-Friendly Biochar Adsorbent Derived from Rice Husk, Wheat Straw, and Corncob. Clean. Eng. Technol. 2020, 1, 100006. [Google Scholar] [CrossRef]
- Arabahmadi, V.; Ghorbani, M. Pb (II) Removal from Water Using Surface-Modified Polythiophene-Coated Rice Husk Ash Nanocomposite. Inorg. Nano-Met. Chem. 2017, 47, 1614–1624. [Google Scholar] [CrossRef]
- Basu, M.; Guha, A.K.; Ray, L. Biosorptive Removal of Lead by Lentil Husk. J. Environ. Chem. Eng. 2015, 3, 1088–1095. [Google Scholar] [CrossRef]
- Çelebi, H.; Gök, O. Evaluation of Lead Adsorption Kinetics and Isotherms from Aqueous Solution Using Natural Walnut Shell. Int. J. Environ. Res. 2017, 11, 83–90. [Google Scholar] [CrossRef]
- Chaduka, M.; Guyo, U.; Zinyama, N.P.; Tshuma, P.; Matsinha, L.C. Modeling and Optimization of Lead (II) Adsorption by a Novel Peanut Hull-g-Methyl Methacrylate Biopolymer Using Response Surface Methodology (RSM). Anal. Lett. 2020, 53, 1294–1311. [Google Scholar] [CrossRef]
- Chamarthy, S.; Seo, C.W.; Marshall, W.E. Adsorption of Selected Toxic Metals by Modified Peanut Shells. J. Chem. Technol. Biotechnol. 2001, 76, 593–597. [Google Scholar] [CrossRef]
- Fooladgar, S.; Teimouri, A.; Ghanavati Nasab, S. Highly Efficient Removal of Lead Ions from Aqueous Solutions Using Chitosan/Rice Husk Ash/Nano Alumina with a Focus on Optimization by Response Surface Methodology: Isotherm, Kinetic, and Thermodynamic Studies. J. Polym. Environ. 2019, 27, 1025–1042. [Google Scholar] [CrossRef]
- Gupta, S.; Kumar, D.; Gaur, J.P. Kinetic and Isotherm Modeling of Lead(II) Sorption onto Some Waste Plant Materials. Chem. Eng. J. 2009, 148, 226–233. [Google Scholar] [CrossRef]
- Imamoglu, M.; Tekir, O. Removal of Copper (II) and Lead (II) Ions from Aqueous Solutions by Adsorption on Activated Carbon from a New Precursor Hazelnut Husks. Desalination 2008, 228, 108–113. [Google Scholar] [CrossRef]
- Iyagba, E.T.; Opete, O.S.E. Removal of Chromium and Lead from Drill Cuttings Using Activated Palm Kernel Shell and Husk. Afr. J. Environ. Sci. Technol. 2009, 3, 171–179. [Google Scholar]
- Janyasuthiwong, S.; Phiri, S.M.; Kijjanapanich, P.; Rene, E.R.; Esposito, G.; Lens, P.N.L. Copper, Lead and Zinc Removal from Metal-Contaminated Wastewater by Adsorption onto Agricultural Wastes. Environ. Technol. 2015, 36, 3071–3083. [Google Scholar] [CrossRef] [PubMed]
- Kamari, S.; Ghorbani, F.; Sanati, A.M. Adsorptive Removal of Lead from Aqueous Solutions by Amine–Functionalized magMCM-41 as a Low–Cost Nanocomposite Prepared from Rice Husk: Modeling and Optimization by Response Surface Methodology. Sustain. Chem. Pharm. 2019, 13, 100153. [Google Scholar] [CrossRef]
- Kazemipour, M.; Ansari, M.; Tajrobehkar, S.; Majdzadeh, M.; Kermani, H.R. Removal of Lead, Cadmium, Zinc, and Copper from Industrial Wastewater by Carbon Developed from Walnut, Hazelnut, Almond, Pistachio Shell, and Apricot Stone. J. Hazard. Mater. 2008, 150, 322–327. [Google Scholar] [CrossRef]
- Mahmoud, M.E.; Fekry, N.A.; Abdelfattah, A.M. A Novel Nanobiosorbent of Functionalized Graphene Quantum Dots from Rice Husk with Barium Hydroxide for Microwave Enhanced Removal of Lead (II) and Lanthanum (III). Bioresour. Technol. 2020, 298, 122514. [Google Scholar] [CrossRef]
- Masoumi, A.; Hemmati, K.; Ghaemy, M. Low-Cost Nanoparticles Sorbent from Modified Rice Husk and a Copolymer for Efficient Removal of Pb(II) and Crystal Violet from Water. Chemosphere 2016, 146, 253–262. [Google Scholar] [CrossRef]
- Meena, A.K.; Kadirvelu, K.; Mishraa, G.K.; Rajagopal, C.; Nagar, P.N. Adsorption of Pb(II) and Cd(II) Metal Ions from Aqueous Solutions by Mustard Husk. J. Hazard. Mater. 2008, 150, 619–625. [Google Scholar] [CrossRef]
- Li, Y.; Zhang, X.; Zhang, P.; Liu, X.; Han, L. Facile Fabrication of Magnetic Bio-Derived Chars by Co-Mixing with Fe3O4 Nanoparticles for Effective Pb2+ Adsorption: Properties and Mechanism. J. Clean. Prod. 2020, 262, 121350. [Google Scholar] [CrossRef]
- Meunier, N.; Laroulandie, J.; Blais, J.F.; Tyagi, R.D. Cocoa Shells for Heavy Metal Removal from Acidic Solutions. Bioresour. Technol. 2003, 90, 255–263. [Google Scholar] [CrossRef] [PubMed]
- Rashed, M.N. Fruit Stones from Industrial Waste for the Removal of Lead Ions from Polluted Water. Environ. Monit. Assess. 2006, 119, 31–41. [Google Scholar] [CrossRef] [PubMed]
- Sekar, M.; Sakthi, V.; Rengaraj, S. Kinetics and Equilibrium Adsorption Study of Lead(II) onto Activated Carbon Prepared from Coconut Shell. J. Colloid Interface Sci. 2004, 279, 307–313. [Google Scholar] [CrossRef] [PubMed]
- Shukla, S.; Pai, R.S. Removal of Pb(II) from Solution Using Cellulose-Containing Materials. J. Chem. Technol. Biotechnol. 2005, 80, 176–183. [Google Scholar] [CrossRef]
- Sun, C.; Chen, T.; Huang, Q.; Wang, J.; Lu, S.; Yan, J. Enhanced Adsorption for Pb(II) and Cd(II) of Magnetic Rice Husk Biochar by KMnO4 Modification. Environ. Sci. Pollut. Res. 2019, 26, 8902–8913. [Google Scholar] [CrossRef]
- Zulkali, M.M.D.; Ahmad, A.L.; Norulakmal, N.H.; Sharifah, N.S. Comparative Studies of Oryza sativa L. Husk and Chitosan as Lead Adsorbent. J. Chem. Technol. Biotechnol. 2006, 81, 1324–1327. [Google Scholar] [CrossRef]
- Yan, J.; Lan, G.; Qiu, H.; Chen, C.; Liu, Y.; Du, G.; Zhang, J. Adsorption of Heavy Metals and Methylene Blue from Aqueous Solution with Citric Acid Modified Peach Stone. Sep. Sci. Technol. 2018, 53, 1678–1688. [Google Scholar] [CrossRef]
- Bello, O.S.; Adegoke, K.A.; Fagbenro, S.O.; Lameed, O.S. Functionalized Coconut Husks for Rhodamine-B Dye Sequestration. Appl. Water Sci. 2019, 9, 189. [Google Scholar] [CrossRef]
- Mohammadi, M.; Hassani, A.J.; Mohamed, A.R.; Najafpour, G.D. Removal of Rhodamine B from Aqueous Solution Using Palm Shell-Based Activated Carbon: Adsorption and Kinetic Studies. J. Chem. Eng. Data 2010, 55, 5777–5785. [Google Scholar] [CrossRef]
- Sureshkumar, M.V.; Namasivayam, C. Adsorption Behavior of Direct Red 12B and Rhodamine B from Water onto Surfactant-Modified Coconut Coir Pith. Colloids Surf. Physicochem. Eng. Asp. 2008, 317, 277–283. [Google Scholar] [CrossRef]
- Atalay, E.H.; Kadıoğlu, E.N.; Akbal, F. High-Efficiency Removal of Rhodamine B Using Modified Biochar from Agricultural Waste Pine Nut Shell: Investigation of Kinetics, Isotherms, and Artificial Neural Network Modeling. Biomass Convers. Biorefinery 2024, 15, 12137–12150. [Google Scholar] [CrossRef]
- Tsamo, C.; Kidwang, G.D.; Dahaina, D.C. Removal of Rhodamine B from Aqueous Solution Using Silica Extracted from Rice Husk. SN Appl. Sci. 2020, 2, 256. [Google Scholar] [CrossRef]
- da Silva Lacerda, V.; López-Sotelo, J.B.; Correa-Guimarães, A.; Hernández-Navarro, S.; Sánchez-Báscones, M.; Navas-Gracia, L.M.; Martín-Ramos, P.; Martín-Gil, J. Rhodamine B Removal with Activated Carbons Obtained from Lignocellulosic Waste. J. Environ. Manag. 2015, 155, 67–76. [Google Scholar] [CrossRef]
- Bello, O.S.; Adegoke, K.A.; Sarumi, O.O.; Lameed, O.S. Functionalized Locust Bean Pod (Parkia biglobosa) Activated Carbon for Rhodamine B Dye Removal. Heliyon 2019, 5, e02323. [Google Scholar] [CrossRef]
- Periasamy, K. Efficient Usage of Rice Husk Carbon and Chitosan Composite for Adsorption of Rhodamine B from Waste Water. J. Pharm. Chem. Biol. Sci. 2018, 6, 107–121. [Google Scholar]
- Chebbi, M.; Youcef, S.; Youcef, L.; Soudani, A.; Dridi, C.; Sahli, A.; Houchet, A.; Deroues, C. Single and Combined Treatment Processes for Rhodamine B Removal by Coagulation–Flocculation and Adsorption. RSC Adv. 2024, 14, 37833–37845. [Google Scholar] [CrossRef]
- Namasivayam, C.; Radhika, R.; Suba, S. Uptake of Dyes by a Promising Locally Available Agricultural Solid Waste: Coir Pith. Waste Manag. 2001, 21, 381–387. [Google Scholar] [CrossRef]
- Ding, L.; Zou, B.; Gao, W.; Liu, Q.; Wang, Z.; Guo, Y.; Wang, X.; Liu, Y. Adsorption of Rhodamine-B from Aqueous Solution Using Treated Rice Husk-Based Activated Carbon. Colloids Surf. Physicochem. Eng. Asp. 2014, 446, 1–7. [Google Scholar] [CrossRef]
- Gad, H.M.H.; El-Sayed, A.A. Activated Carbon from Agricultural By-Products for the Removal of Rhodamine-B from Aqueous Solution. J. Hazard. Mater. 2009, 168, 1070–1081. [Google Scholar] [CrossRef] [PubMed]
- Bharathi, K.S.; Ramesh, S.T. Removal of Dyes Using Agricultural Waste as Low-Cost Adsorbents: A Review. Appl. Water Sci. 2013, 3, 773–790. [Google Scholar] [CrossRef]
- Doğan, M.; Abak, H.; Alkan, M. Adsorption of Methylene Blue onto Hazelnut Shell: Kinetics, Mechanism and Activation Parameters. J. Hazard. Mater. 2009, 164, 172–181. [Google Scholar] [CrossRef]
- Porselvi, E.; Krishnamoorthy, P. Removal of Acid Yellow by Agricultural Waste. J. Mater. Environ. Sci. 2014, 5, 408–415. [Google Scholar]
- Walhout, P.K.; He, Z.; Dutagaci, B.; Nawrocki, G.; Feig, M. Molecular Dynamics Simulations of Rhodamine B Zwitterion Diffusion in Polyelectrolyte Solutions. J. Phys. Chem. B 2022, 126, 10256–10272. [Google Scholar] [CrossRef] [PubMed]
- Imam, S.S.; Babamale, H.F. A Short Review on the Removal of Rhodamine B Dye Using Agricultural Waste-Based Adsorbents. Asian J. Chem. Sci. 2020, 25–37. [Google Scholar] [CrossRef]
- Kainth, S.; Sharma, P.; Pandey, O.P. Green Sorbents from Agricultural Wastes: A Review of Sustainable Adsorption Materials. Appl. Surf. Sci. Adv. 2024, 19, 100562. [Google Scholar] [CrossRef]
- Wang, Y.; Wu, G.; Zhang, Y.; Su, Y.; Zhang, H. The Deactivation Mechanisms, Regeneration Methods and Devices of Activated Carbon in Applications. J. Clean. Prod. 2024, 476, 143751. [Google Scholar] [CrossRef]
- Wambu, E.W. The Graphene Surface Chemistry and Adsorption Science. In Chemistry of Graphene—Synthesis, Reactivity, Applications and Toxicities; IntechOpen: London, UK, 2024; ISBN 978-1-83769-283-5. [Google Scholar]
- Tsubouchi, L.M.S.; de Almeida, E.A.; Santo, D.E.; Bona, E.; Pereira, G.L.D.; Jegatheesan, V.; Cardozo-Filho, L.; Peron, A.P.; Junior, O.V. Production and Characterization of Graphene Oxide for Adsorption Analysis of the Emerging Pollutant Butylparaben. Water 2024, 16, 3703. [Google Scholar] [CrossRef]
- Lombardo, C.; Varrica, G.; Forte, G. Computational Study on Thiolated and Functionalized Graphene Oxide for Heavy Metal Recovery. Comput. Theor. Chem. 2025, 1248, 115211. [Google Scholar] [CrossRef]
- Raza, S.A.; Naqvi, S.Q.; Usman, A.; Jennings, J.R.; Soon, Y.W. Spectroscopic Study of the Interaction between Rhodamine B and Graphene. J. Photochem. Photobiol. Chem. 2021, 418, 113417. [Google Scholar] [CrossRef]
- Pijović, M.; Manić, N.; Anićijević, D.V.; Krstić, A.; Mitrić, M.; Matić, T.; Janković, B. Simple and Effective One-Step Production of High-Quality Mesoporous Pyrolytic Char from Waste Tires: Rhodamine B Adsorption Kinetics and Density Functional Theory (DFT) Study. Diam. Relat. Mater. 2022, 121, 108768. [Google Scholar] [CrossRef]
- Guo, S.; Zou, Z.; Chen, Y.; Long, X.; Liu, M.; Li, X.; Tan, J.; Chen, R. Synergistic Effect of Hydrogen Bonding and π-π Interaction for Enhanced Adsorption of Rhodamine B from Water Using Corn Straw Biochar. Environ. Pollut. 2023, 320, 121060. [Google Scholar] [CrossRef]
- Şenol, Z.M.; Messaoudi, N.E.; Fernine, Y.; Keskin, Z.S. Bioremoval of Rhodamine B Dye from Aqueous Solution by Using Agricultural Solid Waste (Almond Shell): Experimental and DFT Modeling Studies. Biomass Convers. Biorefinery 2024, 14, 17927–17940. [Google Scholar] [CrossRef]
- Aygün, A.; Yenisoy-Karakaş, S.; Duman, I. Production of Granular Activated Carbon from Fruit Stones and Nutshells and Evaluation of Their Physical, Chemical and Adsorption Properties. Microporous Mesoporous Mater. 2003, 66, 189–195. [Google Scholar] [CrossRef]
- Turk Sekulić, M.; Pap, S.; Stojanović, Z.; Bošković, N.; Radonić, J.; Šolević Knudsen, T. Efficient Removal of Priority, Hazardous Priority and Emerging Pollutants with Prunus armeniaca Functionalized Biochar from Aqueous Wastes: Experimental Optimization and Modeling. Sci. Total Environ. 2018, 613–614, 736–750. [Google Scholar] [CrossRef]
- Zhang, Z.; Zhou, C.; Yang, J.; Yan, B.; Liu, J.; Wang, S.; Li, Q.; Zhou, M. Preparation and Characterization of Apricot Kernel Shell Biochar and Its Adsorption Mechanism for Atrazine. Sustainability 2022, 14, 4082. [Google Scholar] [CrossRef]
- Pap, S.; Paunovic, O.; Prosen, H.; Kraševec, I.; Trebše, P.; Niemi, L.; Taggart, M.A.; Turk Sekulic, M. Removal of Benzotriazole Derivatives by Biochar: Potential Environmental Applications. Environ. Pollut. 2023, 334, 122205. [Google Scholar] [CrossRef]
- Sklivaniotis, L.N.; Economou, P.; Karapanagioti, H.K.; Manariotis, I.D. Chlorine Removal from Water by Biochar Derived from Various Food Waste Natural Materials. Environ. Process. 2022, 10, 4. [Google Scholar] [CrossRef]
- Abdel-Raouf, M.E. Chapter 5—Fruit Stones as Green Materials for Wastewater Remediation. In Emerging Techniques for Treatment of Toxic Metals from Wastewater; Ahmad, A., Kumar, R., Jawaid, M., Eds.; Elsevier: Amsterdam, The Netherlands, 2023; pp. 83–101. ISBN 978-0-12-822880-7. [Google Scholar]
- Sharififard, H.; Sharififard, I. Removal of Reactive Red Dye 198 by Modified Apricot Kernel Shell Derived-Activated Carbon Bio-Composite: Kinetics, Equilibrium, and Thermodynamics. J. Text. Sci. Technol. 2024, 12, 1–17. [Google Scholar] [CrossRef]
- Nam, S.; French, A.D.; Condon, B.D.; Concha, M. Segal Crystallinity Index Revisited by the Simulation of X-Ray Diffraction Patterns of Cotton Cellulose Iβ and Cellulose II. Carbohydr. Polym. 2016, 135, 1–9. [Google Scholar] [CrossRef] [PubMed]
- Nam, S.; Liu, Y.; He, Z.; Hinchliffe, D.J.; Fang, D. Assessment of Segal Method for Identifying Crystallinity Evolution in Developing Cotton Fibers. Agric. Environ. Lett. 2024, 9, e20138. [Google Scholar] [CrossRef]
- Brunauer, S.; Emmett, P.H.; Teller, E. Adsorption of Gases in Multimolecular Layers. J. Am. Chem. Soc. 1938, 60, 309–319. [Google Scholar] [CrossRef]
- Barrett, E.P.; Joyner, L.G.; Halenda, P.P. The Determination of Pore Volume and Area Distributions in Porous Substances. I. Computations from Nitrogen Isotherms. J. Am. Chem. Soc. 1951, 73, 373–380. [Google Scholar] [CrossRef]
- Cranston, R.W.; Inkley, F.A. 17 The Determination of Pore Structures from Nitrogen Adsorption Isotherms. In Advances in Catalysis; Farkas, A., Ed.; Proceedings of the International Congress on Catalysis; Academic Press: Cambridge, MA, USA, 1957; Volume 9, pp. 143–154. [Google Scholar] [CrossRef]
- Dollimore, D.; Heal, G.R. Pore-Size Distribution in Typical Adsorbent Systems. J. Colloid Interface Sci. 1970, 33, 508–519. [Google Scholar] [CrossRef]
- Galarneau, A.; Villemot, F.; Rodriguez, J.; Fajula, F.; Coasne, B. Validity of the T-Plot Method to Assess Microporosity in Hierarchical Micro/Mesoporous Materials. Langmuir 2014, 30, 13266–13274. [Google Scholar] [CrossRef]
- Horváth, G.; Kawazoe, K. Method for the Calculation of Effective Pore Size Distribution in Molecular Sieve Carbon. J. Chem. Eng. Jpn. 1983, 16, 470–475. [Google Scholar] [CrossRef]
- Zamri, N.I.I.; Zulmajdi, S.L.N.; Daud, N.Z.A.; Mahadi, A.H.; Kusrini, E.; Usman, A. Insight into the Adsorption Kinetics, Mechanism, and Thermodynamics of Methylene Blue from Aqueous Solution onto Pectin-Alginate-Titania Composite Microparticles. SN Appl. Sci. 2021, 3, 222. [Google Scholar] [CrossRef]
- Feng, Y.; Li, Y.; Xu, M.; Liu, S.; Yao, J. Fast Adsorption of Methyl Blue on Zeolitic Imidazolate Framework-8 and Its Adsorption Mechanism. RSC Adv. 2016, 6, 109608–109612. [Google Scholar] [CrossRef]
- Ediati, R.; Putra Hidayat, A.R.; Syukrie, T.D.; Zulfa, L.L.; Jannah, M.; Harmami, H.; Fansuri, H.; Ibnu Ali, B.T. Investigation the Adsorption Kinetic and Isotherm Studies of Remazol Red 5B Dye on Benzoic Acid Modified Al2O3/UiO-66 Composite. Arab. J. Chem. 2025, 18, 106078. [Google Scholar] [CrossRef]
- Maccarino, L.; Miglio, V.; Paul, G.; Golemme, G.; Bisio, C.; Marchese, L. Swellable Hybrid Silicas for the Removal of Rhodamine B Dye from Aqueous Phase. Microporous Mesoporous Mater. 2024, 375, 113178. [Google Scholar] [CrossRef]
- Abdel Salam, O.E.; Reiad, N.A.; ElShafei, M.M. A Study of the Removal Characteristics of Heavy Metals from Wastewater by Low-Cost Adsorbents. J. Adv. Res. 2011, 2, 297–303. [Google Scholar] [CrossRef]
- Sadeek, S.A.; Negm, N.A.; Hefni, H.H.H.; Wahab, M.M.A. Metal Adsorption by Agricultural Biosorbents: Adsorption Isotherm, Kinetic and Biosorbents Chemical Structures. Int. J. Biol. Macromol. 2015, 81, 400–409. [Google Scholar] [CrossRef]
- Humelnicu, I.; Băiceanu, A.; Ignat, M.-E.; Dulman, V. The Removal of Basic Blue 41 Textile Dye from Aqueous Solution by Adsorption onto Natural Zeolitic Tuff: Kinetics and Thermodynamics. Process Saf. Environ. Prot. 2017, 105, 274–287. [Google Scholar] [CrossRef]
- Vijayaraghavan, K.; Padmesh, T.V.N.; Palanivelu, K.; Velan, M. Biosorption of Nickel(II) Ions onto Sargassum Wightii: Application of Two-Parameter and Three-Parameter Isotherm Models. J. Hazard. Mater. 2006, 133, 304–308. [Google Scholar] [CrossRef]
- Ghasemi, M.; Javadian, H.; Ghasemi, N.; Agarwal, S.; Gupta, V.K. Microporous Nanocrystalline NaA Zeolite Prepared by Microwave Assisted Hydrothermal Method and Determination of Kinetic, Isotherm and Thermodynamic Parameters of the Batch Sorption of Ni (II). J. Mol. Liq. 2016, 215, 161–169. [Google Scholar] [CrossRef]
- Arshadi, M.; Amiri, M.J.; Mousavi, S. Kinetic, Equilibrium and Thermodynamic Investigations of Ni(II), Cd(II), Cu(II) and Co(II) Adsorption on Barley Straw Ash. Water Resour. Ind. 2014, 6, 1–17. [Google Scholar] [CrossRef]
- Angin, D. Utilization of Activated Carbon Produced from Fruit Juice Industry Solid Waste for the Adsorption of Yellow 18 from Aqueous Solutions. Bioresour. Technol. 2014, 168, 259–266. [Google Scholar] [CrossRef]
- Demiral, H.; Güngör, C. Adsorption of Copper(II) from Aqueous Solutions on Activated Carbon Prepared from Grape Bagasse. J. Clean. Prod. 2016, 124, 103–113. [Google Scholar] [CrossRef]
- Ben-Ali, S.; Jaouali, I.; Souissi-Najar, S.; Ouederni, A. Characterization and Adsorption Capacity of Raw Pomegranate Peel Biosorbent for Copper Removal. J. Clean. Prod. 2017, 142, 3809–3821. [Google Scholar] [CrossRef]
- Yang, C. Statistical Mechanical Aspects of Adsorption Systems Obeying the Temkin Isotherm. J. Phys. Chem. 1993, 97, 7097–7101. [Google Scholar] [CrossRef]
- Tran, H.N.; You, S.-J.; Chao, H.-P. Thermodynamic Parameters of Cadmium Adsorption onto Orange Peel Calculated from Various Methods: A Comparison Study. J. Environ. Chem. Eng. 2016, 4, 2671–2682. [Google Scholar] [CrossRef]
- Januszewicz, K.; Kazimierski, P.; Cymann-Sachajdak, A.; Hercel, P.; Barczak, B.; Wilamowska-Zawłocka, M.; Kardaś, D.; Łuczak, J. Conversion of Waste Biomass to Designed and Tailored Activated Chars with Valuable Properties for Adsorption and Electrochemical Applications. Environ. Sci. Pollut. Res. 2023, 30, 96977–96992. [Google Scholar] [CrossRef]
- Tseng, R.-L.; Wu, F.-C.; Juang, R.-S. Characteristics and Applications of the Lagergren’s First-Order Equation for Adsorption Kinetics. J. Taiwan Inst. Chem. Eng. 2010, 41, 661–669. [Google Scholar] [CrossRef]
- Naushad, M.; ALOthman, Z.A.; Inamuddin; Javadian, H. Removal of Pb(II) from Aqueous Solution Using Ethylene Diamine Tetra Acetic Acid-Zr(IV) Iodate Composite Cation Exchanger: Kinetics, Isotherms and Thermodynamic Studies. J. Ind. Eng. Chem. 2015, 25, 35–41. [Google Scholar] [CrossRef]
- Chinoune, K.; Bentaleb, K.; Bouberka, Z.; Nadim, A.; Maschke, U. Adsorption of Reactive Dyes from Aqueous Solution by Dirty Bentonite. Appl. Clay Sci. 2016, 123, 64–75. [Google Scholar] [CrossRef]
- McKay, G.; Ho, Y.S.; Ng, J.C.Y. Biosorption of Copper from Waste Waters: A Review. Sep. Purif. Methods 1999, 28, 87–125. [Google Scholar] [CrossRef]
- El-Khaiary, M.I.; Malash, G.F. Common Data Analysis Errors in Batch Adsorption Studies. Hydrometallurgy 2011, 105, 314–320. [Google Scholar] [CrossRef]
- Tan, K.L.; Hameed, B.H. Insight into the Adsorption Kinetics Models for the Removal of Contaminants from Aqueous Solutions. J. Taiwan Inst. Chem. Eng. 2017, 74, 25–48. [Google Scholar] [CrossRef]
- Ho, Y.S.; McKay, G. Pseudo-Second Order Model for Sorption Processes. Process Biochem. 1999, 34, 451–465. [Google Scholar] [CrossRef]
- Azizian, S. Kinetic Models of Sorption: A Theoretical Analysis. J. Colloid Interface Sci. 2004, 276, 47–52. [Google Scholar] [CrossRef] [PubMed]
- Al-Odayni, A.-B.; Alsubaie, F.S.; Saeed, W.S. Nitrogen-Rich Polyaniline-Based Activated Carbon for Water Treatment: Adsorption Kinetics of Anionic Dye Methyl Orange. Polymers 2023, 15, 806. [Google Scholar] [CrossRef]
- Lopes, E.C.N.; dos Anjos, F.S.C.; Vieira, E.F.S.; Cestari, A.R. An Alternative Avrami Equation to Evaluate Kinetic Parameters of the Interaction of Hg(II) with Thin Chitosan Membranes. J. Colloid Interface Sci. 2003, 263, 542–547. [Google Scholar] [CrossRef]
- Cestari, A.R.; Vieira, E.F.S.; Lopes, E.C.N.; da Silva, R.G. Kinetics and Equilibrium Parameters of Hg(II) Adsorption on Silica–Dithizone. J. Colloid Interface Sci. 2004, 272, 271–276. [Google Scholar] [CrossRef]
- Heydari-Gorji, A.; Sayari, A. CO2 Capture on Polyethylenimine-Impregnated Hydrophobic Mesoporous Silica: Experimental and Kinetic Modeling. Chem. Eng. J. 2011, 173, 72–79. [Google Scholar] [CrossRef]
- Weber, W.J.; Morris, J.C. Kinetics of Adsorption on Carbon from Solution. J. Sanit. Eng. Div. 1963, 89, 31–59. [Google Scholar] [CrossRef]
- Tran, H.N.; You, S.-J.; Hosseini-Bandegharaei, A.; Chao, H.-P. Mistakes and Inconsistencies Regarding Adsorption of Contaminants from Aqueous Solutions: A Critical Review. Water Res. 2017, 120, 88–116. [Google Scholar] [CrossRef]
- Hameed, B.H.; El-Khaiary, M.I. Equilibrium, Kinetics and Mechanism of Malachite Green Adsorption on Activated Carbon Prepared from Bamboo by K2CO3 Activation and Subsequent Gasification with CO2. J. Hazard. Mater. 2008, 157, 344–351. [Google Scholar] [CrossRef]
- Boyd, G.E.; Adamson, A.W.; Myers, L.S., Jr. The Exchange Adsorption of Ions from Aqueous Solutions by Organic Zeolites. II. Kinetics1. J. Am. Chem. Soc. 1947, 69, 2836–2848. [Google Scholar] [CrossRef] [PubMed]
- Kajjumba, G.W.; Aydın, S.; Güneysu, S. Adsorption Isotherms and Kinetics of Vanadium by Shale and Coal Waste. Adsorpt. Sci. Technol. 2018, 36, 936–952. [Google Scholar] [CrossRef]
- Gupta, V.K.; Gupta, B.; Rastogi, A.; Agarwal, S.; Nayak, A. Pesticides Removal from Waste Water by Activated Carbon Prepared from Waste Rubber Tire. Water Res. 2011, 45, 4047–4055. [Google Scholar] [CrossRef]
- Little, J.; Moler, C. MATLAB; MathWorks: Natick, MA, USA, 2023. [Google Scholar]
- Kaushal, A.; Singh, S.K. Critical Analysis of Adsorption Data Statistically. Appl. Water Sci. 2017, 7, 3191–3196. [Google Scholar] [CrossRef]
- Peng, M.; Nguyen, A.V.; Wang, J.; Miller, R. A Critical Review of the Model Fitting Quality and Parameter Stability of Equilibrium Adsorption Models. Adv. Colloid Interface Sci. 2018, 262, 50–68. [Google Scholar] [CrossRef] [PubMed]
- Rajahmundry, G.K.; Garlapati, C.; Kumar, P.S.; Alwi, R.S.; Vo, D.-V.N. Statistical Analysis of Adsorption Isotherm Models and Its Appropriate Selection. Chemosphere 2021, 276, 130176. [Google Scholar] [CrossRef]
- Andreu-Vilarroig, C.; Cortés, J.-C.; Navarro-Quiles, A.; Sferle, S.-M. Statistical Analysis of a General Adsorption Kinetic Model with Randomness in Its Formulation. An Application to Real Data. Match-Commun. Math. Comput. Chem. 2023, 90, 19–51. [Google Scholar] [CrossRef]
- Liu, Y. Is the Free Energy Change of Adsorption Correctly Calculated? J. Chem. Eng. Data 2009, 54, 1981–1985. [Google Scholar] [CrossRef]
- Hai, T.N. Comments on “Effect of Temperature on the Adsorption of Methylene Blue Dye onto Sulfuric Acid–Treated Orange Peel". Chem. Eng. Commun. 2017, 204, 134–139. [Google Scholar] [CrossRef]
- Zhou, X. Comment on the Thermodynamic Calculation Using the Non-Standard Equilibrium Constant Re Jemutai-Kimosop et al. (2020) and Conde-Cid et al. (2019). Environ. Res. 2020, 187, 109610. [Google Scholar] [CrossRef]
- Hiemenz, P.C.; Rajagopalan, R. Principles of Colloid and Surface Chemistry, Revised and Expanded, 3rd ed.; CRC Press: Boca Raton, FL, USA, 2016; ISBN 978-1-315-27428-7. [Google Scholar]
- Atkins, P.W.; Paula, J.D.; Keeler, J. Atkins’ Physical Chemistry; Oxford University Press: Oxford, UK, 2018; ISBN 978-0-19-876986-6. [Google Scholar]
- Biggar, J.W.; Cheung, M.W. Adsorption of Picloram (4-Amino-3,5,6-Trichloropicolinic Acid) on Panoche, Ephrata, and Palouse Soils: A Thermodynamic Approach to the Adsorption Mechanism. Soil Sci. Soc. Am. J. 1973, 37, 863–868. [Google Scholar] [CrossRef]
- Khan, A.A.; Singh, R.P. Adsorption Thermodynamics of Carbofuran on Sn (IV) Arsenosilicate in H+, Na+ and Ca2+ Forms. Colloids Surf. 1987, 24, 33–42. [Google Scholar] [CrossRef]
- Tran, H.N.; Lima, E.C.; Juang, R.-S.; Bollinger, J.-C.; Chao, H.-P. Thermodynamic Parameters of Liquid–Phase Adsorption Process Calculated from Different Equilibrium Constants Related to Adsorption Isotherms: A Comparison Study. J. Environ. Chem. Eng. 2021, 9, 106674. [Google Scholar] [CrossRef]
- Rawajfih, Z.; Mohammad, H.A.; Nsour, N.; Ibrahim, K. Study of Equilibrium and Thermodynamic Adsorption of α-Picoline, β-Picoline, and γ-Picoline by Jordanian Zeolites: Phillipsite and Faujasite. Microporous Mesoporous Mater. 2010, 132, 401–408. [Google Scholar] [CrossRef]
- Perdew, J.P.; Burke, K.; Ernzerhof, M. Generalized Gradient Approximation Made Simple. Phys. Rev. Lett. 1996, 77, 3865–3868. [Google Scholar] [CrossRef]
- Monkhorst, H.J.; Pack, J.D. Special Points for Brillouin-Zone Integrations. Phys. Rev. B 1976, 13, 5188–5192. [Google Scholar] [CrossRef]
- Martyna, G.J.; Tuckerman, M.E. A Reciprocal Space Based Method for Treating Long Range Interactions in Ab Initio and Force-Field-Based Calculations in Clusters. J. Chem. Phys. 1999, 110, 2810–2821. [Google Scholar] [CrossRef]
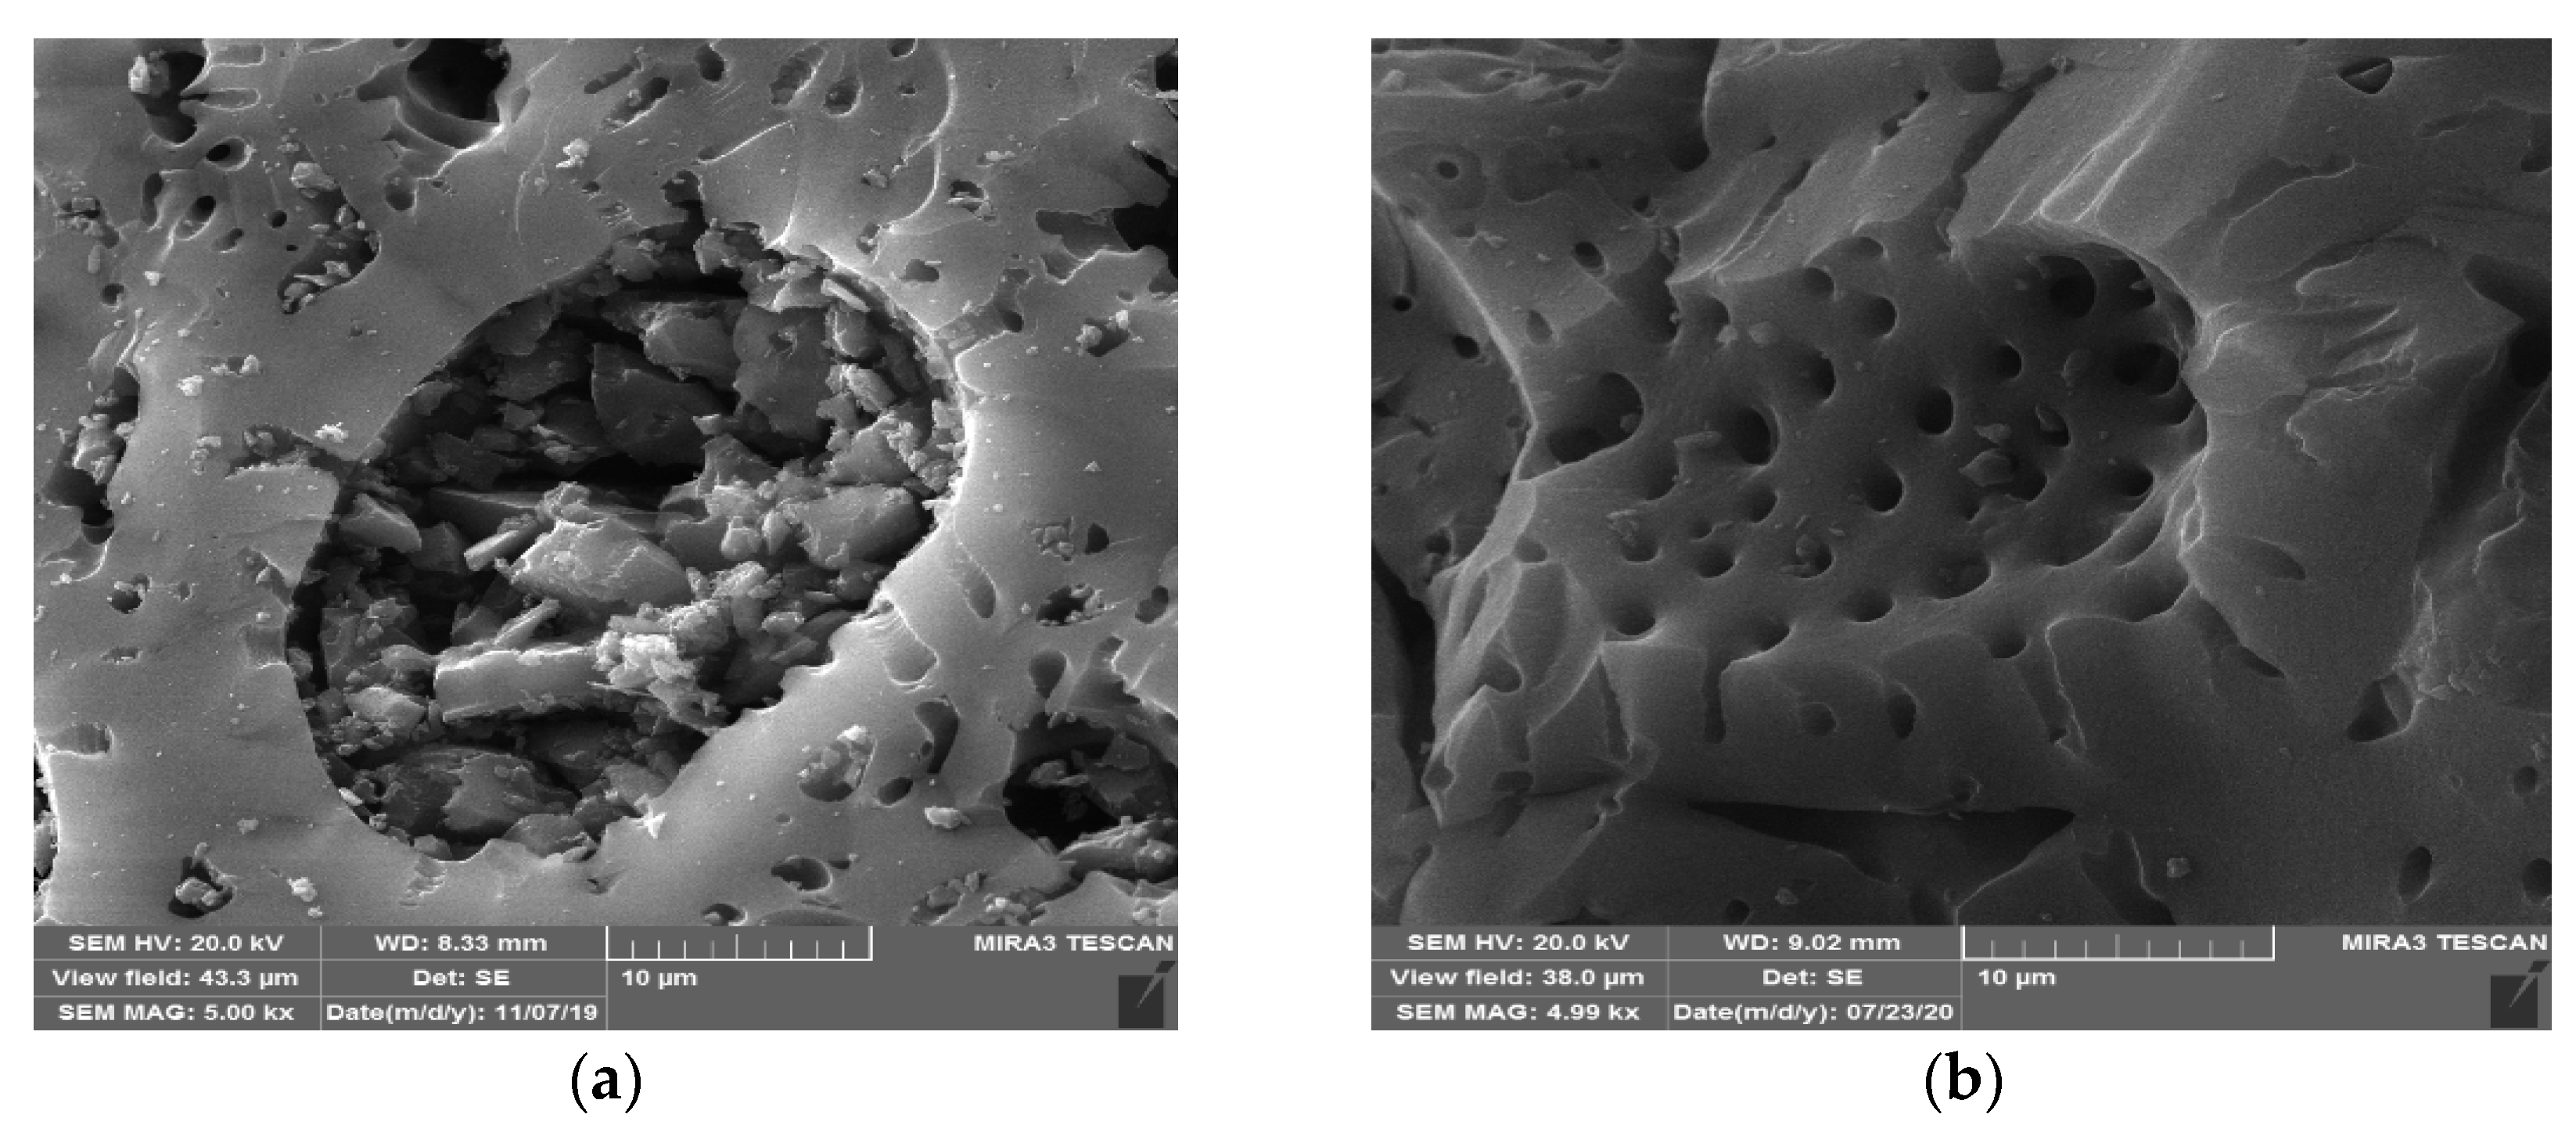
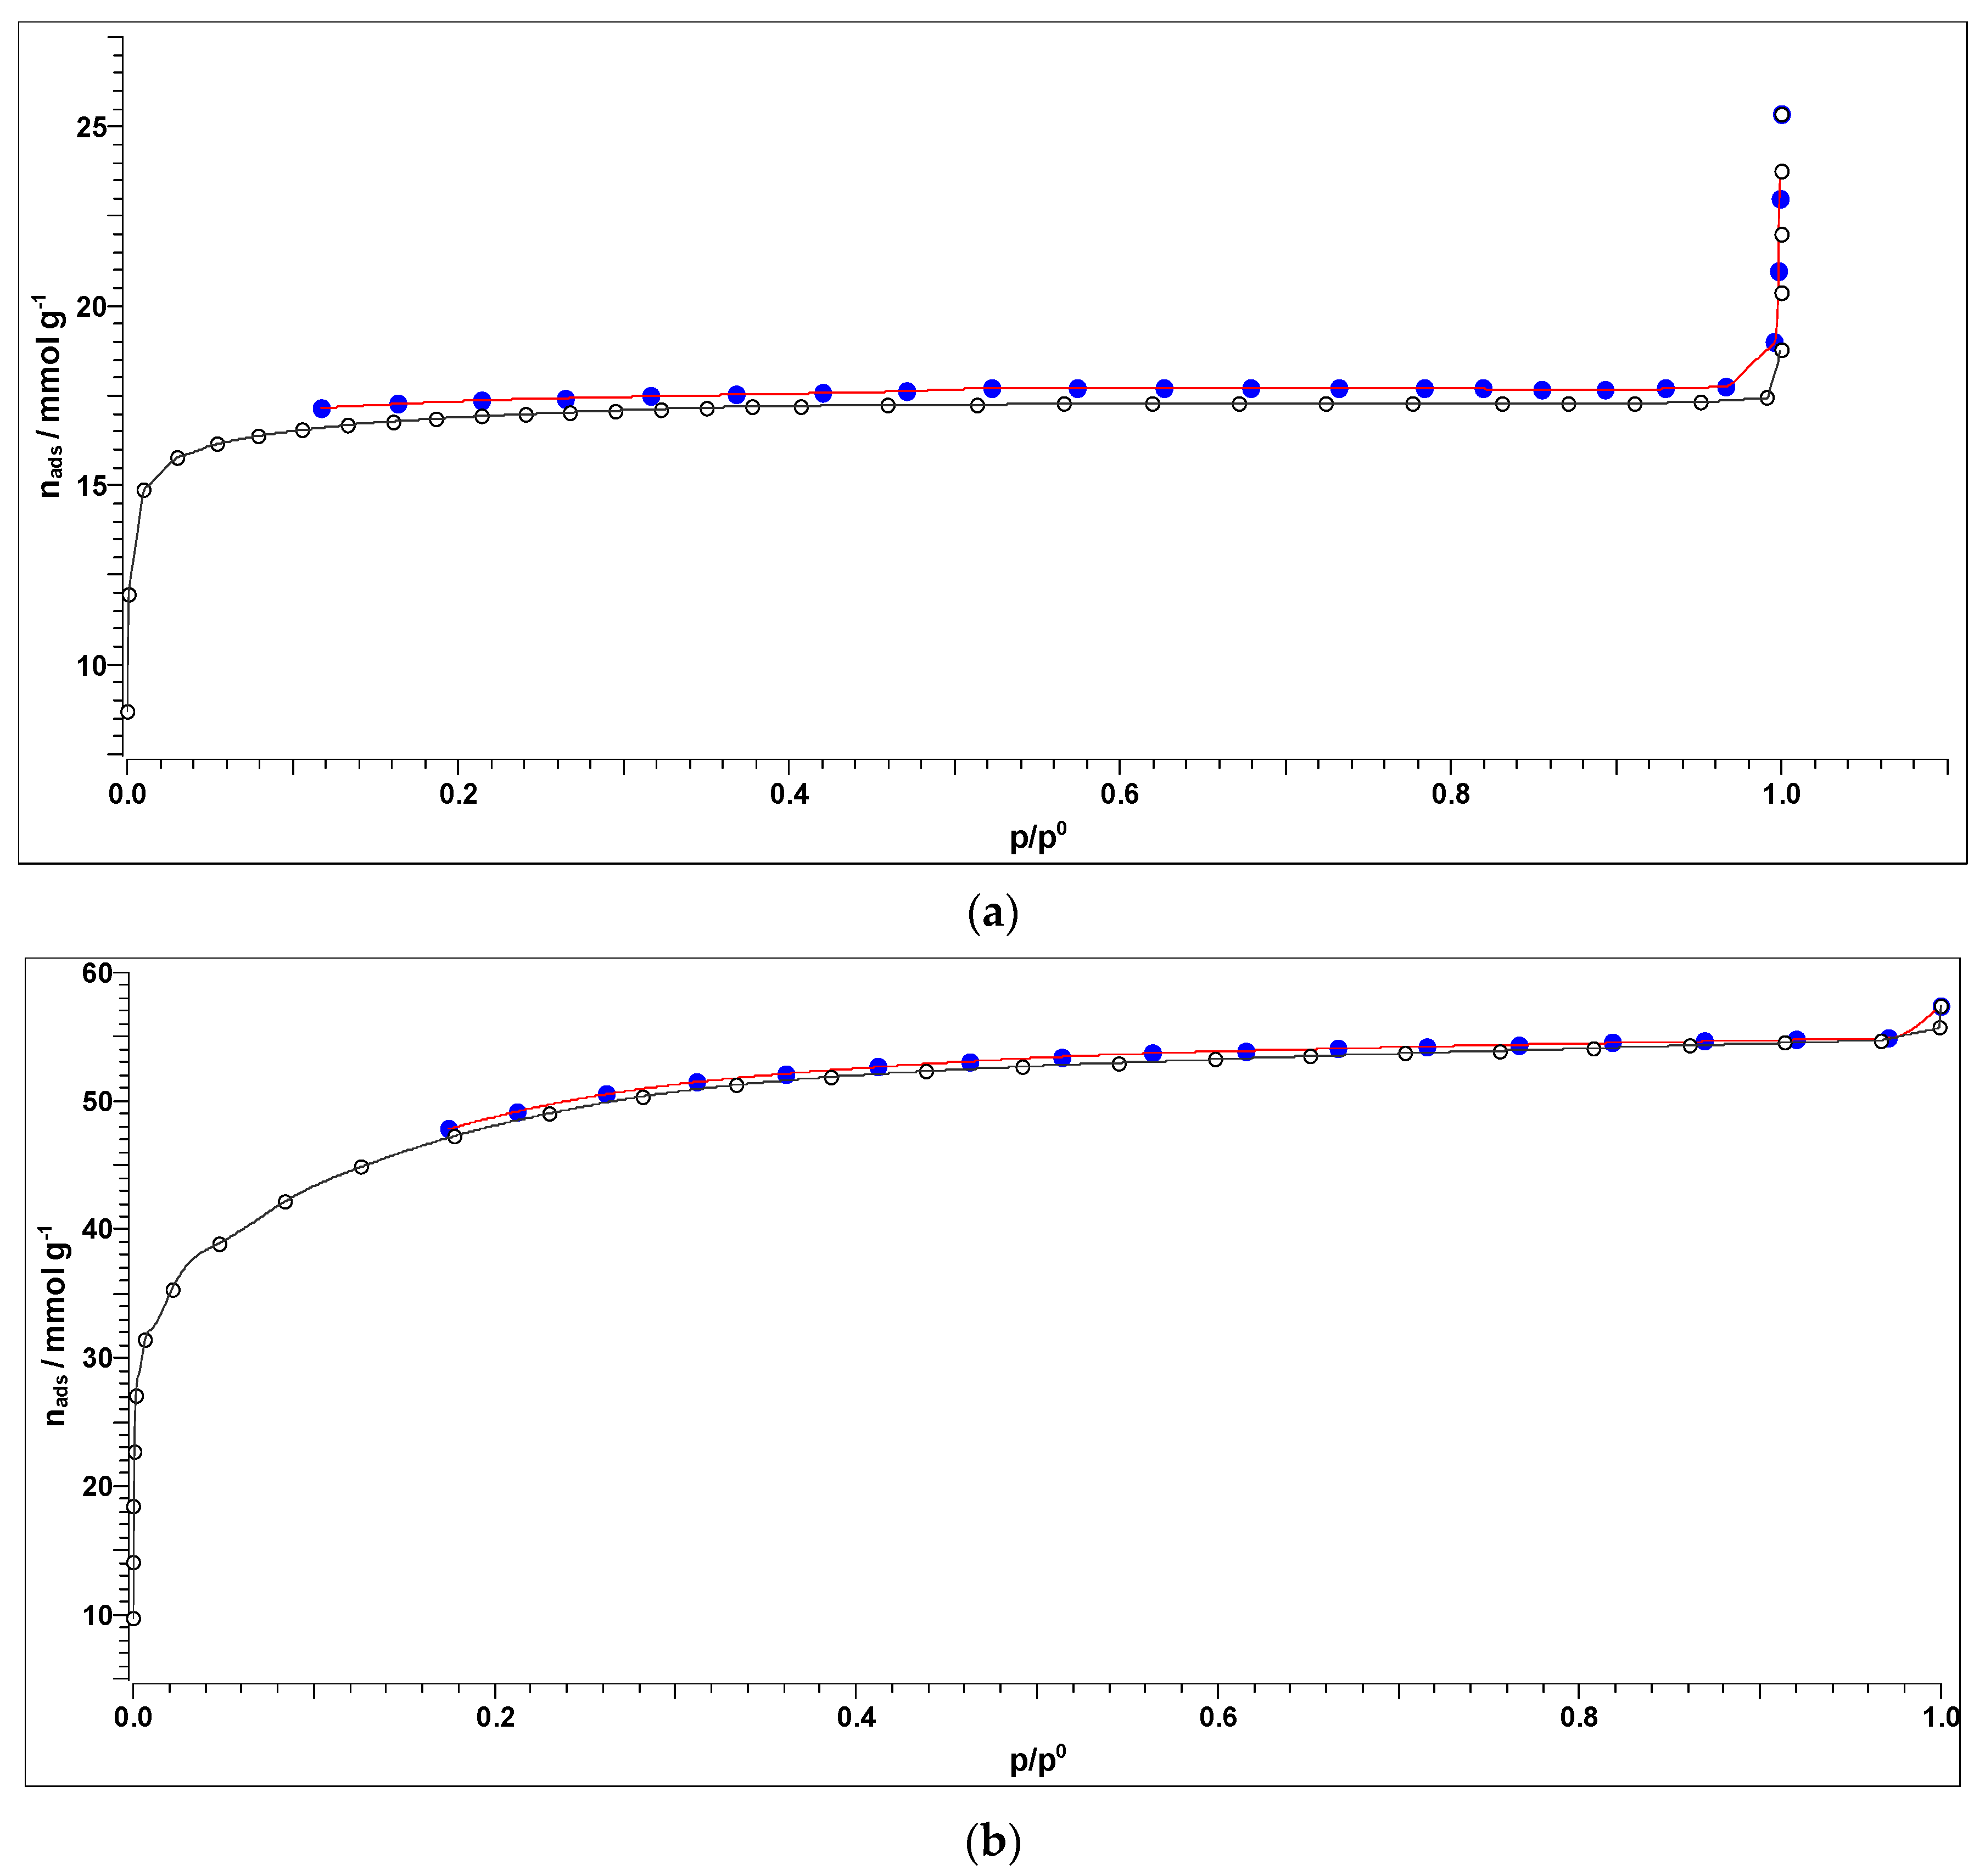
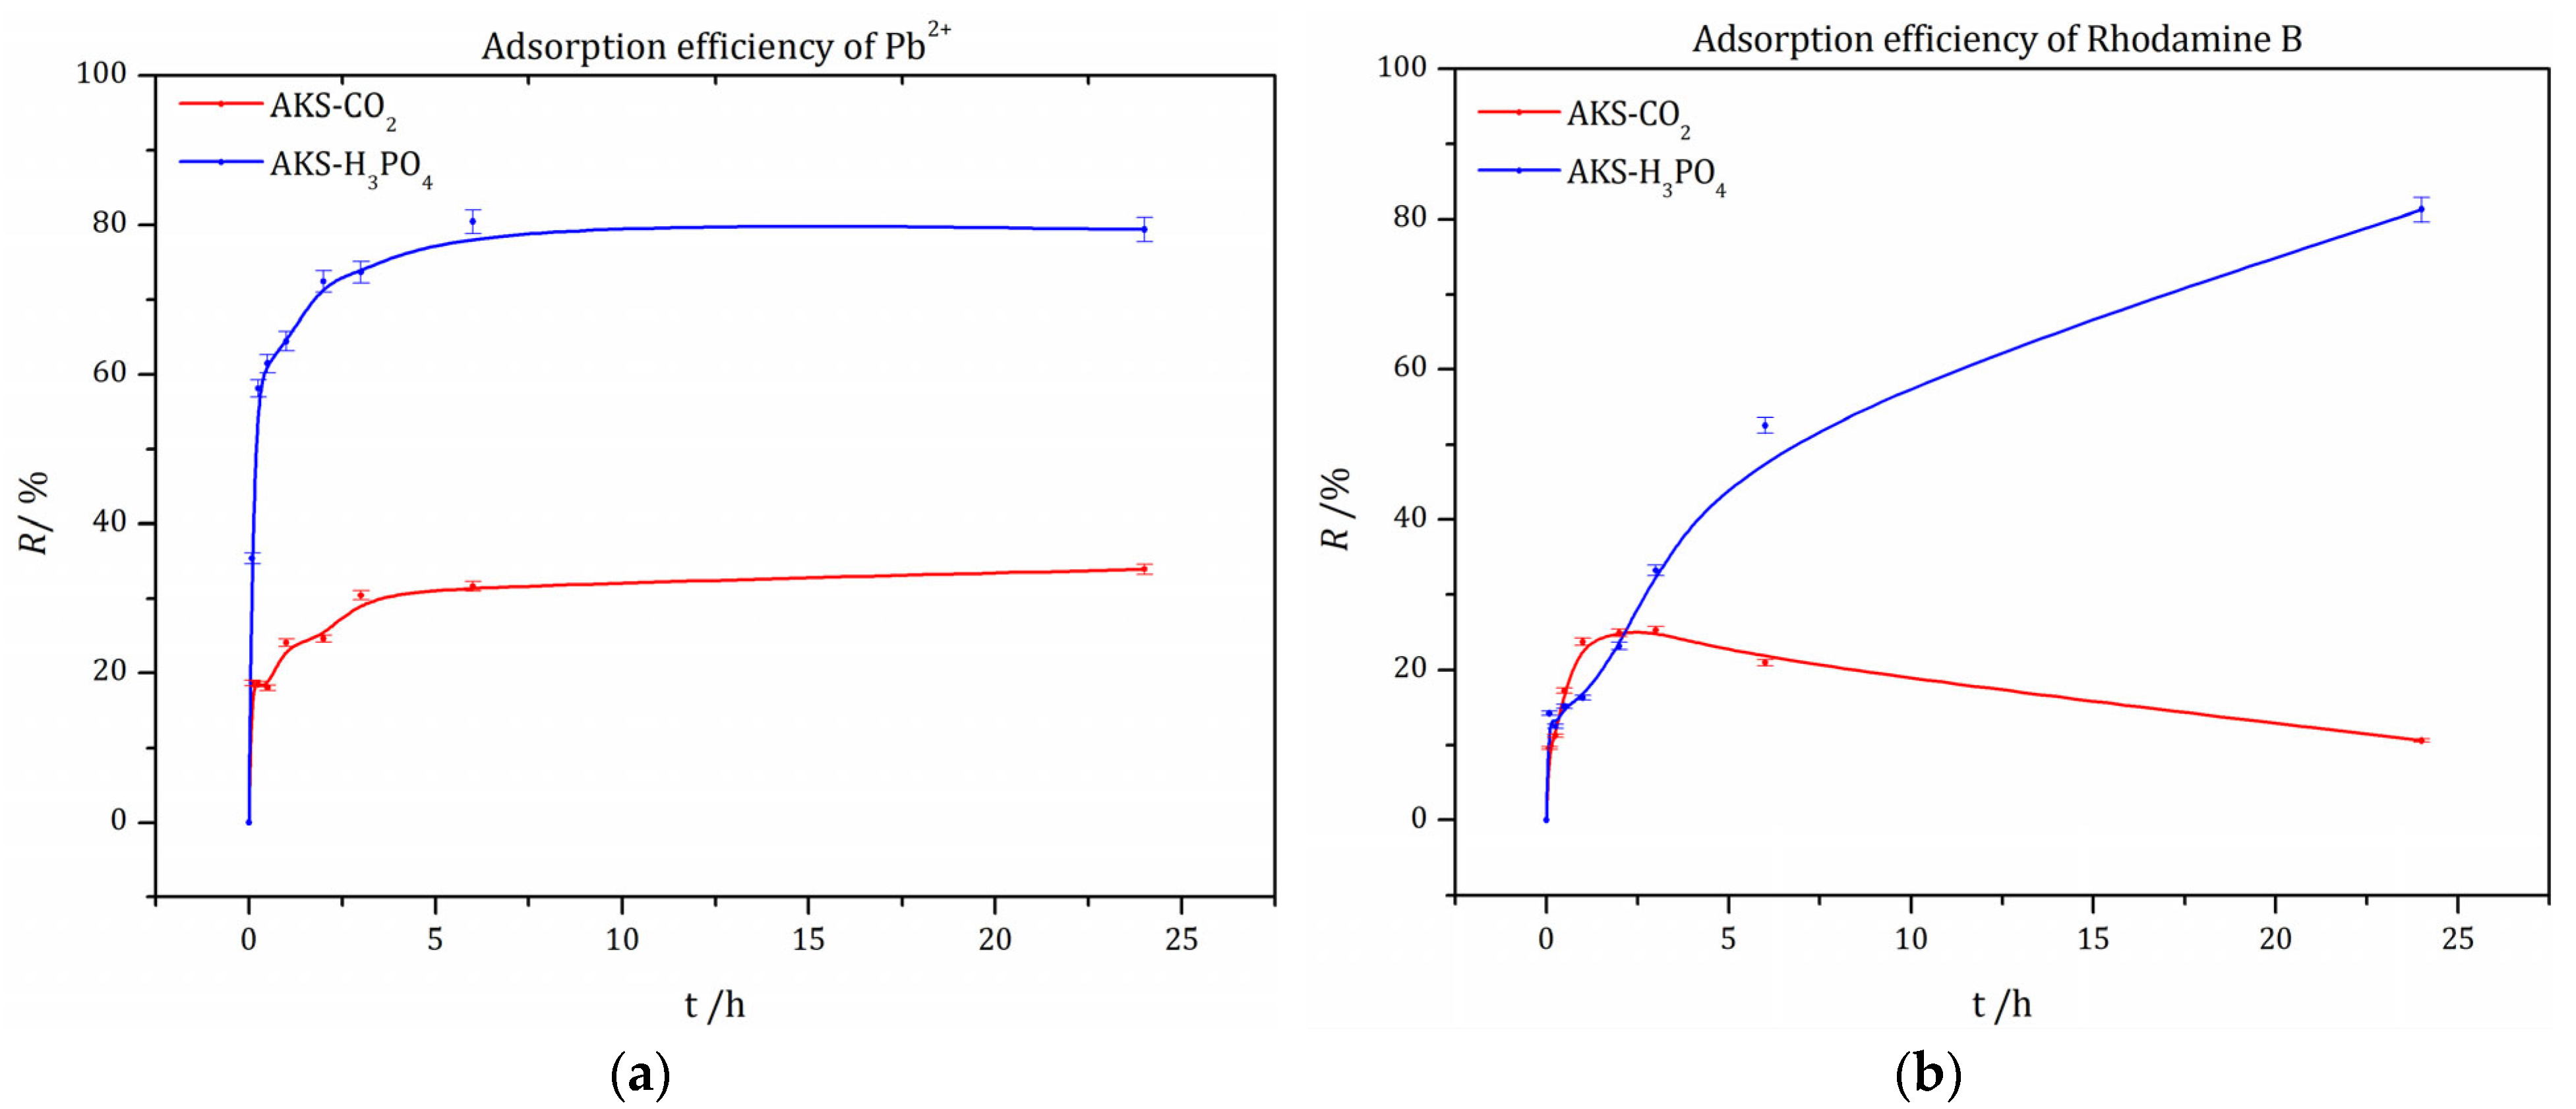
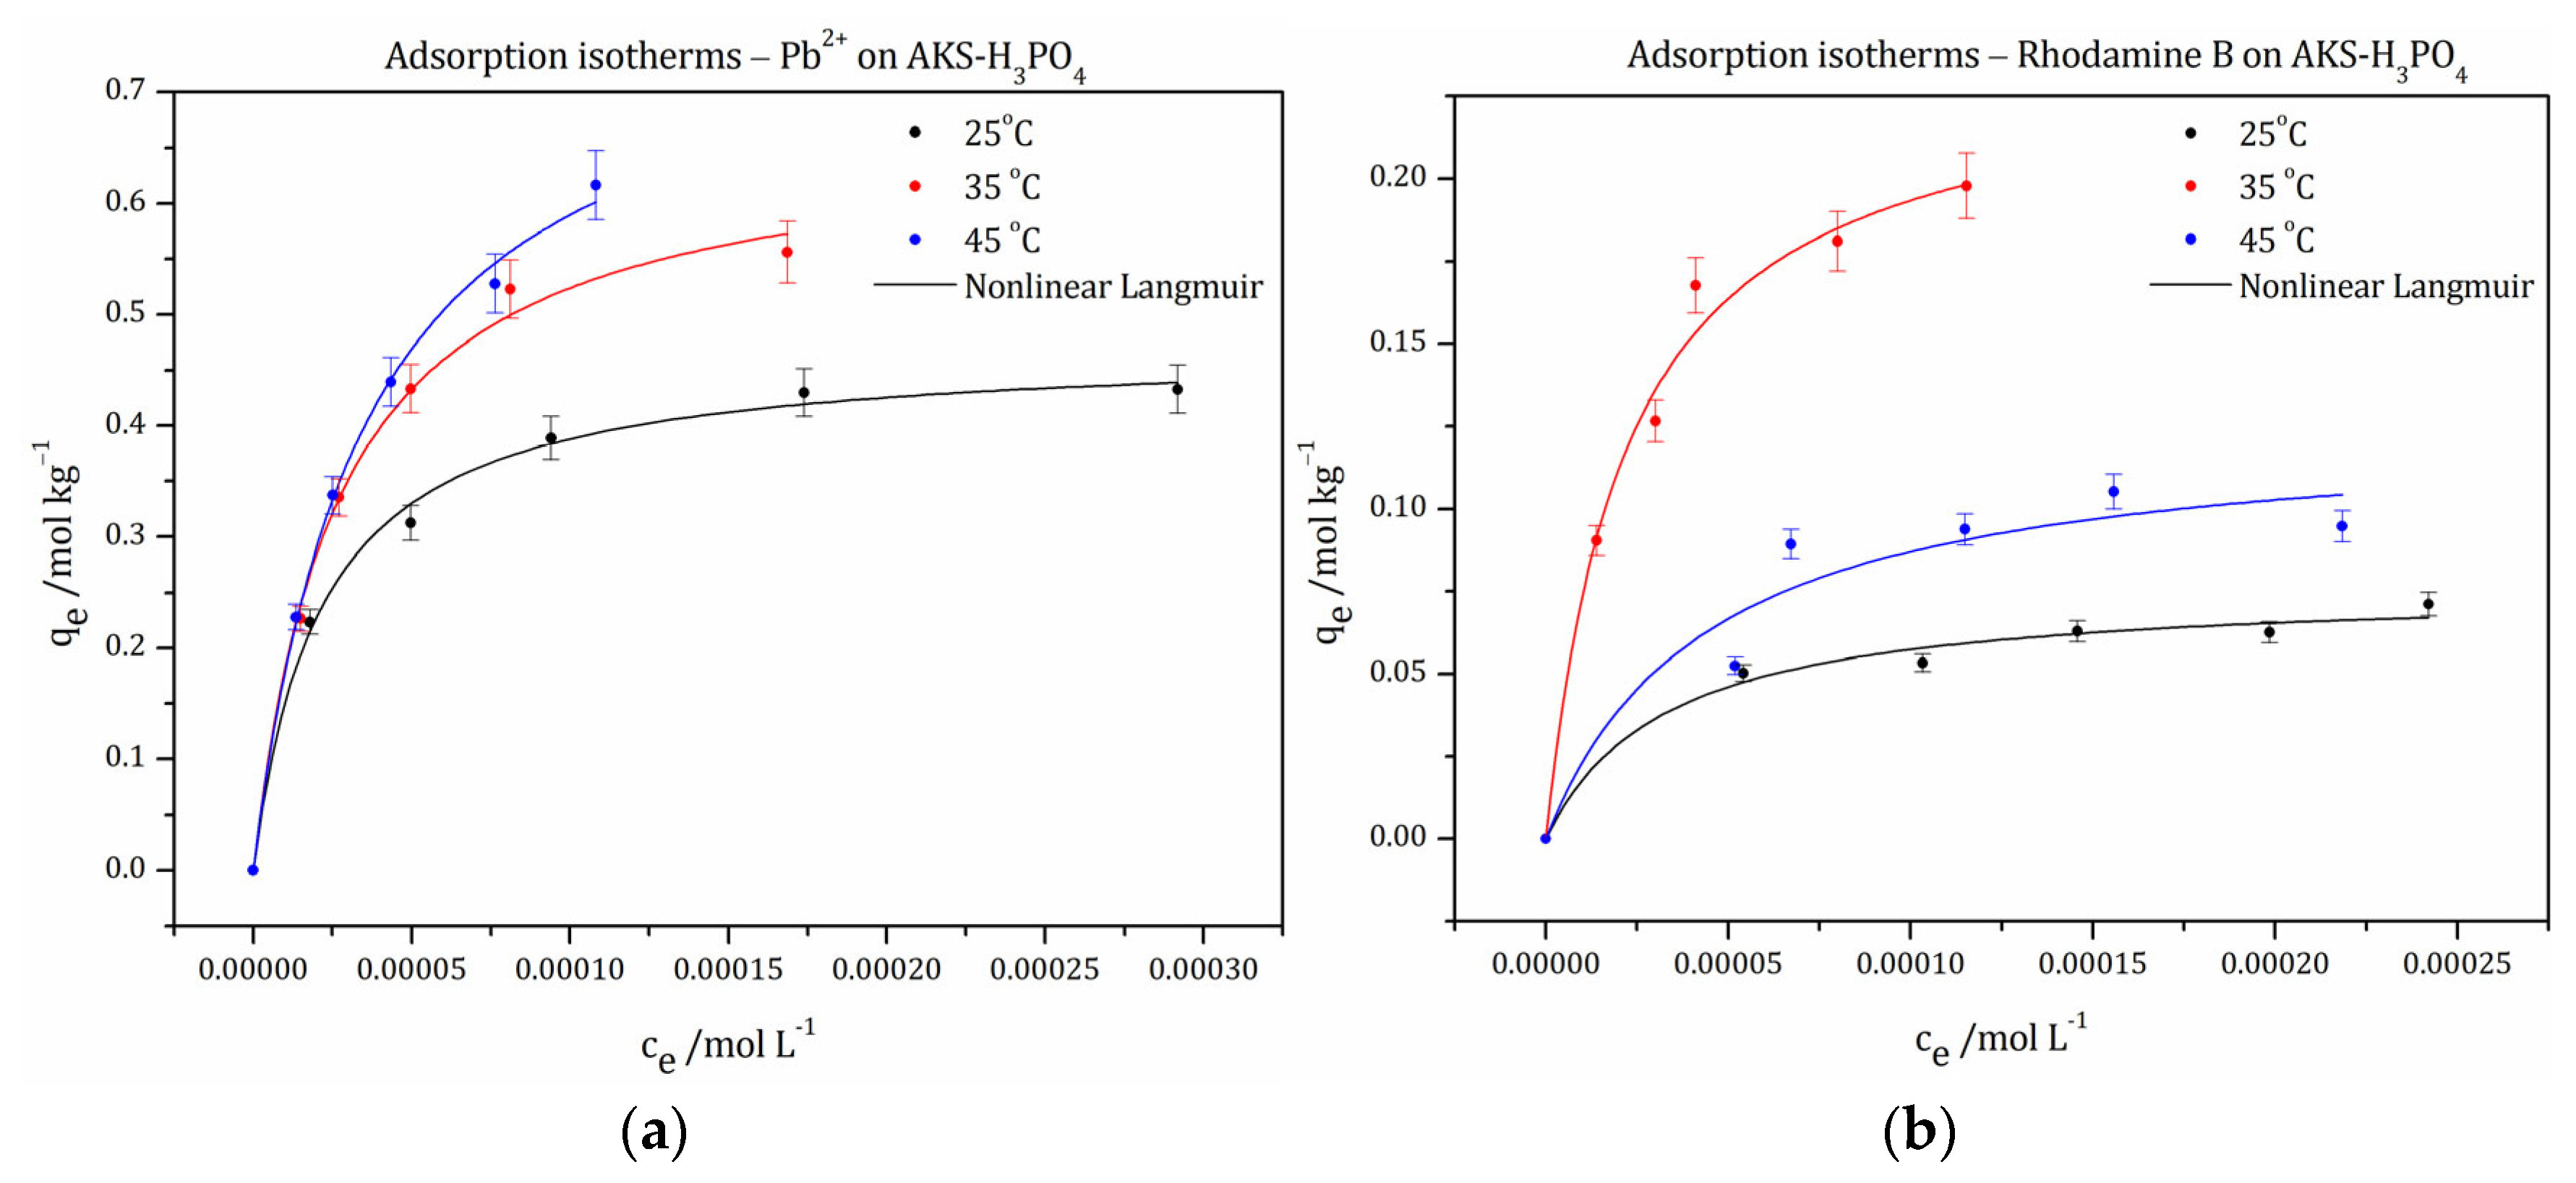
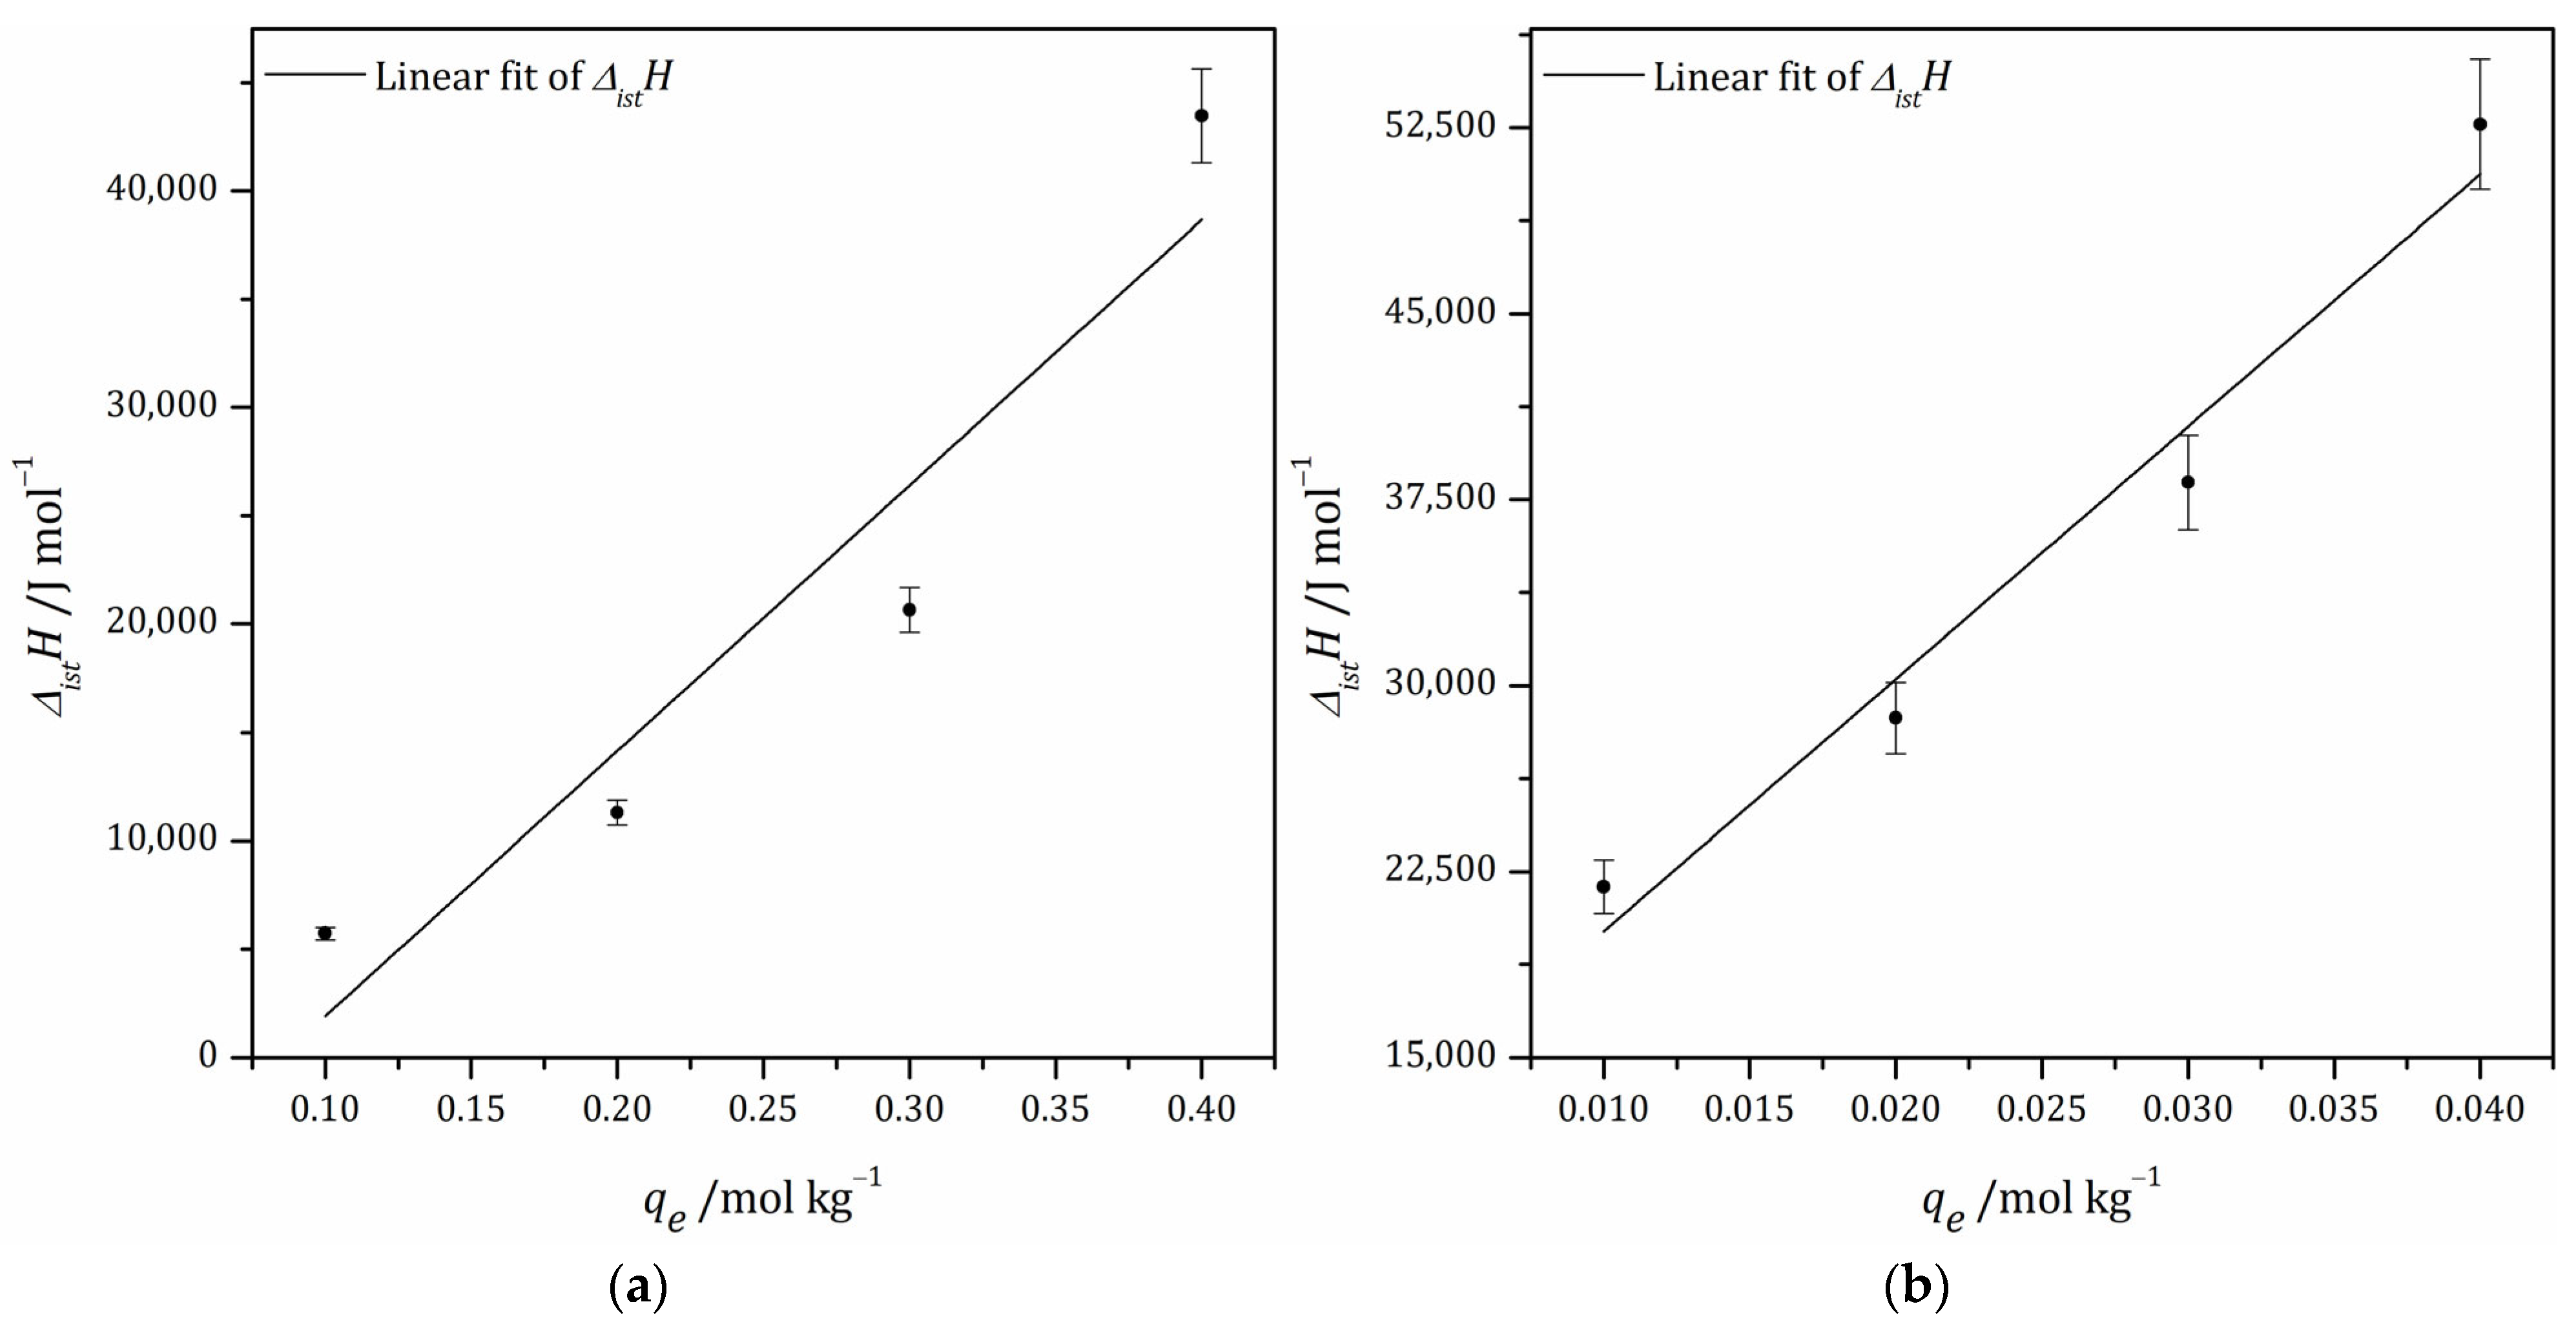

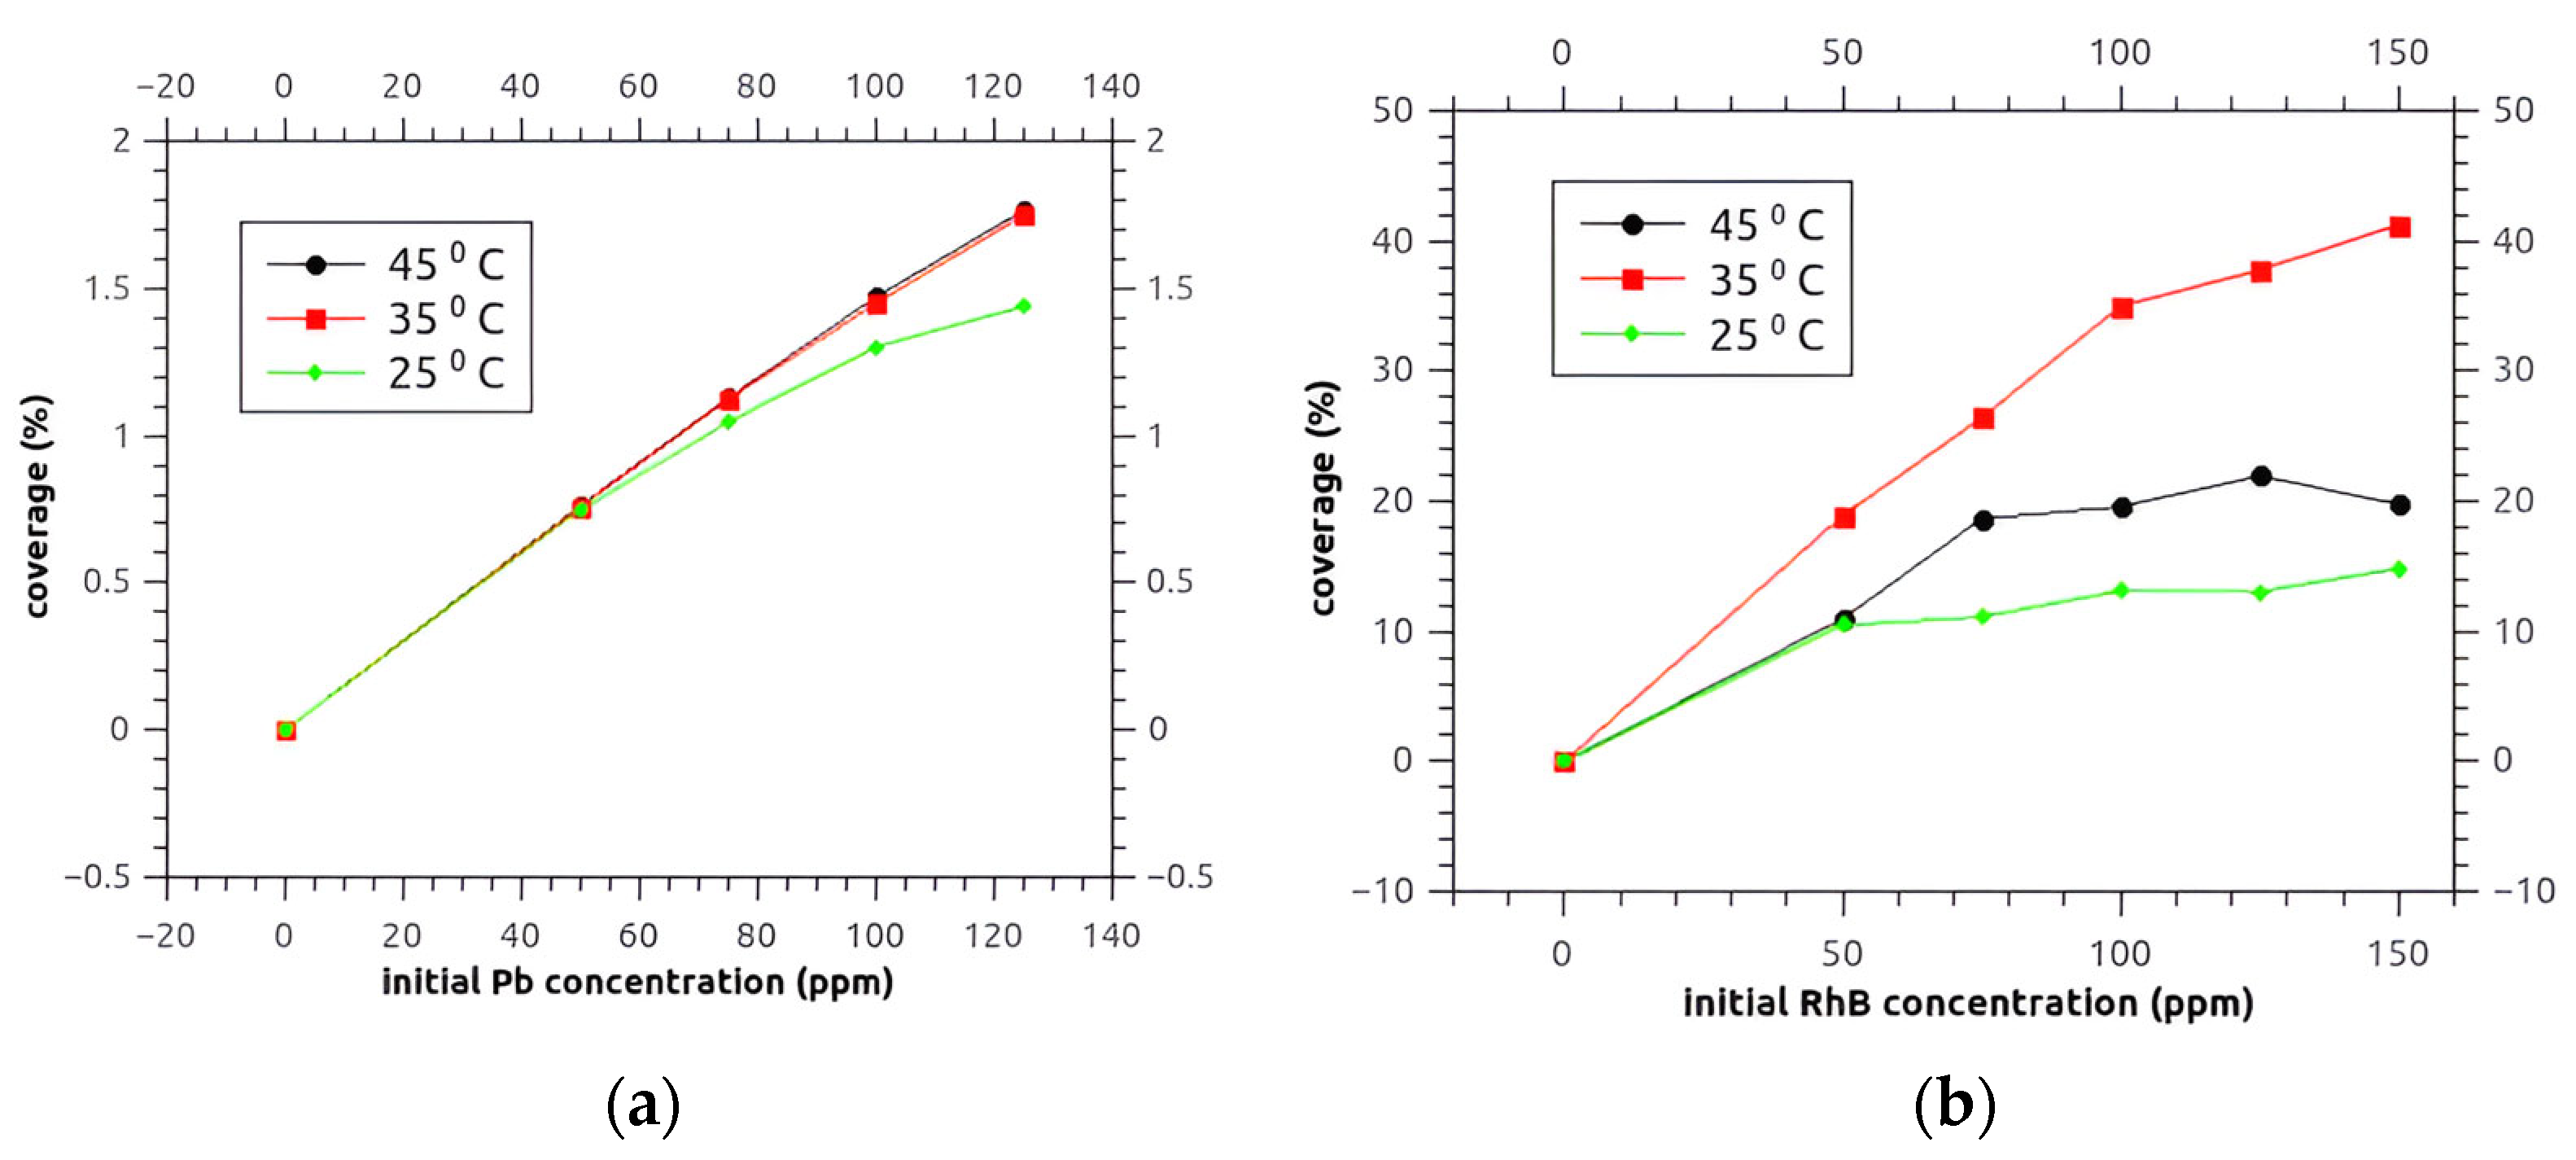
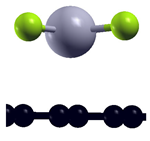
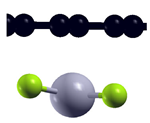
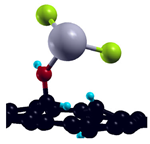
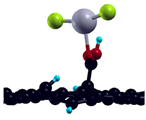
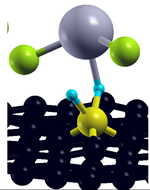
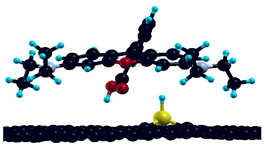
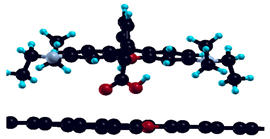
Disclaimer/Publisher’s Note: The statements, opinions and data contained in all publications are solely those of the individual author(s) and contributor(s) and not of MDPI and/or the editor(s). MDPI and/or the editor(s) disclaim responsibility for any injury to people or property resulting from any ideas, methods, instructions or products referred to in the content. |
© 2025 by the authors. Licensee MDPI, Basel, Switzerland. This article is an open access article distributed under the terms and conditions of the Creative Commons Attribution (CC BY) license (https://creativecommons.org/licenses/by/4.0/).