Abstract
Hydraulic fracturing significantly impacts water production. This makes it crucial to determine whether its effects on formation water production are beneficial or detrimental in complex reservoir stimulations. This paper gives the influence that acts on pore structure variations and irreducible water transformation by hydraulic fracturing; by using NMR and Micro-CT, pore-throat reconfiguration in core samples induced fracturing. Two main pore variation types were identified from CT images. To analyze the gas–water flow mechanisms in pre-fracturing and post-fracturing reservoir conditions, we tested quantifying changes in irreducible water transforms into movable water saturation by using a triaxial in situ flow system, thereby elucidating the impact of the hydraulic fracture on irreducible water saturation. The experiments demonstrate that pore structures are significantly modified in terms of connectivity and diameter through hydraulic fracturing. During damage zone formation, 12.4–19.2% of small pores coalesce into larger pores through integration of isolated spaces. This variation enhances fluid mobility, transforms 1.38–11.61% of irreducible water, and decreases starting pressure gradients by 1 MPa/100 m to 0.1 MPa/100 m. Modified pore structure leads to the iso-permeability point shifting toward higher water saturation. The gas-phase relative permeability at irreducible water saturation is two times as high as that of the matrix sample. Fractured zones show a 20–23% conversion efficiency of irreducible to movable water. In addition, based on the results of experimental data, hydraulic fracturing increased water production by 3607 to 9163 m3. However, this effect is only maintained during the first 3 to 6 months post-fracture. These results quantify the transformation of irreducible water into movable water in hydraulic fracturing. This study provides key performance indicators for gas reservoir applications.
1. Introduction
In unconventional gas development, the exploration and development of water-bearing tight sandstone gas reservoirs face multiple challenges [1,2,3]. The formation water occupies a substantial portion of the pore space within the rock matrix, which effectively diminishes the storage capacity available for the gaseous component [4,5]. Hydraulic fracturing stimulation triggers alterations in pore networks and enables the mobilization of water that was previously considered nonrecoverable. By reducing capillary pressure, this process not only enhances water-phase relative permeability but also diminishes gas-phase relative permeability. Thus, it is reasonable to observe that the interactions between similarity gas–water phases affect gas flow pathways, ultimately limiting gas well productivity [6,7,8,9]. Additionally, for gas field equipment, more water production may lead to corrosion of the pipeline. The presence of formation water has added to the complexity of gas production in water-bearing tight sandstone gas reservoirs, and there is also the danger of corrosion-driven mineral dissolution and surface alteration [10]. It is essential for the analysis of pore structure alterations of post-fracture to understand irreducible water phase mobility mechanisms in water-bearing tight sandstone gas reservoirs.
The reservoir pore-throat structure determines its physical properties. Pore connectivity is an indicator that reflects structural characteristics of the pore-throat network [11,12,13,14]. Various characterization methods have been employed to study these features by researchers globally in unconventional reservoirs. These methodologies involve fluid-intrusion techniques and noninvasive techniques. Herein, fluid-intrusion techniques include low-pressure gas adsorption using N2 or CO2, mercury intrusion porosimetry (MIP), and nuclear magnetic resonance (NMR). Noninvasive techniques contain cast thin section (CTS) analysis and computed tomography at both microscales and nanoscales [15,16,17].
Among fluid intrusion methods, most methods are destructive. Wang et al. [18] and Ning et al. [19] experimentally studied the pore size distribution in tight gas reservoirs by low-pressure gas adsorption, and found that the method fails to consider limitation of scale and does not apply to tight sandstone. MIP includes rate-controlled mercury injection (RCMI) and high-pressure mercury injection (HPMI). RCMI can assess pore-throat connectivity by regulating mercury injection rates, but it cannot detect pores smaller than 120 nm [20]. In contrast, MICP can quantify micropores, but for pore deformation owing to high pressure, the instrument’s measuring accuracy is not guaranteed [21]. NMR is a fast and accurate yet nondestructive technique used to characterize pore-throat size. However, Lai et al. [22] and Zhao et al. [23] consider that there are limits to identifying submicron pore distributions. The noninvasive fluid method can indirectly characterize pore-throat distribution through a multiphysics system. CTS is becoming a routine analytical tool in pore structure due to its intuitive microscopy [24], while micro/nano-CT provides three-dimensional scanned images of pore-throat connectivity [13]. As described, the existing technologies still have limitations in terms of sample handling, detection accuracy, and equipment availability. In this paper, we introduce a proposed methodology of pore structures in tight sandstone reservoirs as a summary of the results of several research groups. The integrated method requires a comprehensive analysis of experimental results based on NMR and micro-CT techniques. It aims to quantitatively describe the mechanism of irreducible water transforming into movable water by pore structure variation. In addition, the method provides a new idea for studying the pore structure variation of tight sandstone at the micro- and nanoscale.
Compared to conventional gas, unconventional gas is regarded as an easy-to-tap resource due to its complex pore structure characteristics, pore-throat narrowing, complex gas–water distributions, and high irreducible water [25,26,27,28,29]. The previous research indicated that the start of irreducible water flow occurs for the following three reasons. (1) Pressure depletion: With the development of gas reservoirs, reservoir pressure has gradually declined. Because the rate of movable water saturation increasing in the porous medium is lower than that of irreducible water saturation [30,31,32], it can lead to irreducible water transfer into movable water. (2) Flow velocity sensitivity: Because the irreducible water has velocity sensitivity, it must be displaced with a large pressure difference. When the gas flow velocity is larger than the given value, in this case, the drag force of the water film on the pore wall is larger than its frictional resistance [33,34]. It leads the irreducible water to start flowing. (3) Water film expansion: With the original pressure decreased, it could also facilitate the irreducible water film to expand and thicken [35,36]. The irreducible water becomes movable water under differential pressure. In summary, the existing irreducible water production mechanism of water-bearing tight sandstone gas reservoirs mainly focuses on pressure depletion, velocity sensitivity, and water film expansion. The existing mechanism solution is the irreducible water remobilization with formation pressure in gas reservoirs. The importance of the irreducible water cannot be ignored in long-term dynamics gas well production. But it overlooks the matrix-damage-fracture zone produced by hydraulic fracturing, which has fundamentally changed the spatial scale (pore structures) and temporal characteristics (short-term production) of the irreducible water variation. Hydraulic fracturing is mainly responsible for the rapid release of irreducible water at first, but afterward, the pressure in the reservoir determines the long-term effects.
This study aims to clarify whether hydraulic fracturing is the mechanism by which irreducible water is transformed into movable water. Firstly, we quantitatively analyze how CT scanning and NMR spectroscopy are used to identify pore structure variation. We present two pore structure variants: increasing the diameter of the pore-throat connections and establishing links between isolated and connected pores. This study compares seepage flow variations between the pre-fractured matrix sample and the post-fractured damaged sample in four aspects: pore structure modification, irreducible water saturation variation, initiation pressure threshold, and gas–water relative permeability. Then, we use a custom true-triaxial in situ seepage system for experimental work that simulates a real gas reservoir. We also conduct a series of gas drive experiments on the pressure-dependent water saturation evolution. An example of irreducible water transformant rate on a large scales (10 cm × 10 cm × 10 cm) is discussed, and the pre-fractured matrix rock is compared with the post-fractured damaged rock. Lastly, we calculate the maximum recoverable water increasing value from a horizontal well’s hydraulic fracture for experimental data. The calculation result provides a theoretical basis for optimizing the water–gas ratio in tight gas reservoir development.
2. Experimental and Stimulation
2.1. Physical Modeling of Fractures in Tight Gas Reservoirs
2.1.1. Similarity Criteria Parameters
It is critical to improve exploration and development for tight sandstone gas reservoirs using physical stimulation experiments. Tight reservoirs have complex pore structures, reservoir heterogeneity, and high irreducible water saturation. These will result in the flow of gas and water in a real geological environment. Low gas well production caused by high water production is becoming more severe, as studying the transition from irreducible water to removable water after hydraulic fracturing is a challenge for gas reservoirs in well production [37,38].
Then, through the dimensional analysis of similarity criteria, gas reservoir models can be created down to the laboratory scale. By comparing dimensionless numbers, we can ensure consistency of seepage regime, pressure drop, and gas–water flow behavior between the laboratory scale and the reservoir scale. When dimensionless groups (derived from single-value boundary conditions) are matched between the model and the reservoir, dynamic similarity is achieved [39,40]. Based on how the principle was obtained, it can be easily determined that the tight sandstone gas reservoir behavior can be studied through a physical stimulation experiment under fracturing conditions.
The similarity criterion derivation is based on six fundamental postulates [41]:
- (1)
- A normal-pressure and isothermal system;
- (2)
- Immiscible gas–water flow governed by Darcy’s law;
- (3)
- Uniform thickness and homogeneous formation;
- (4)
- Isotropic porous medium exhibiting permeability;
- (5)
- Constant fluid viscosities under reservoir temperature;
- (6)
- Uniform initial saturation distribution.
2.1.2. Fractured Modeling
The Dongsheng Gas Field is a representative tight sandstone gas reservoir in the Ordos Basin in which the water-bearing zones are widely distributed. The diminished mobility should disadvantage natural production under ambient temperature-pressure conditions. To attain commercial productivity, hydraulic fracturing stimulation must precede production commencement. Based on reservoir data, the fractures are created perpendicular to the horizontal wellbore with the fracture half-length of 100–150 m [42]. The stimulated reservoir’s volume included the fractured network and the damage zone. The fractured network refers to interconnected cracks created by hydraulic fracturing. When the rock mass reaches its maximum capability (point D in Figure 1), the inside of the rock is damaged, and fast-growing cracks appear, merging and covering a wide surface. The damage zone refers to the stimulated reservoir’s volume without fracturing fluids or clay swelling invasion. The damage zone is caused by plastic deformation of the matrix which changes the size of pores (stage BC in Figure 1), improves fluid flow, and loosens the connection between fractures in the rock without using proppants. The pore structures suffer irreversible destruction. The artificial fractures in stimulated reservoir volume show typical linear seepage characteristics, which are manifested as a one-dimensional flow of fluid along the direction of the main fracture.
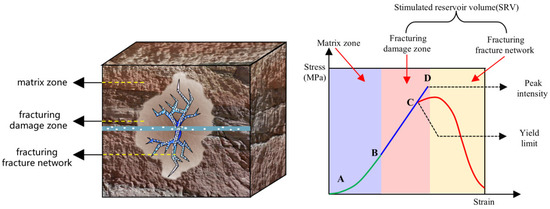
Figure 1.
The schematic diagram of hydraulic fractured zoning formation mechanism in tight sandstone gas reservoirs. Stage AB represents elastic deformation (matrix zone), Stage BD represents plastic deformation (damage zone), point D represents breakdown pressure (fracture network).
Dimensional analysis incorporating geometric, kinematic, and dynamic parameters is derived. Similarity criteria also have a favorable transforming effect between the laboratory scale and the reservoir scale. In physical stimulation experiments, the similarity criteria are an efficient tool for fluid flow mechanisms in porous materials. This methodology has rigorous parametric similarity conditions within the model and formulates the conversion criteria of different scales.
To construct a similar physical model with the π theorem in the laboratory, the general approach is selected, using four fundamental quantities: length, mass, time, and temperature, to build a system of dimensionless equations. By solving this linear system via matrix theory, 10 independent fundamental solutions can be derived, corresponding to the generation of 10 key similarity criteria (as shown in Table 1). Through normalization, we examined the precise conversion between physical model parameters and gas reservoir scale parameters, namely, we established the relationship between experimental data and gas well data. Each similarity parameter requires an in-depth analysis of its physical mechanisms in reservoir conditions [43]. According to the derived conclusion, we can effectively guide horizontal well development.

Table 1.
Similarity criterion numbers of the gas-reservoir physical stimulation [41].
In conducting physical stimulation experiments to establish similarity with actual tight gas reservoirs, ten dimensionless similarity criteria were derived through porous media flow theory and similarity criteria calculation methods. The corresponding π parameters (π1–π10) were quantitatively matched with the target reservoir prototype characteristics. Firstly, based on the relationship between laboratory-scale experiments and reservoir-scale applications, core dimensions, porosity, gas saturation, initial formation pressure, temperature, and bottomhole pressure were determined as model parameters of π1, π3, π5, π6, π7, and π9 by dimensional analysis. Subsequently, gas compressibility factor (Z-factor), viscosity, and similarity coefficient π2 were calculated using the gas equation of state under the reservoir temperature–pressure conditions [44,45]. Finally, according to the preceding parameters, similar quasi-numbers π4 and π8 of the gas reservoir scale can be determined to calculate the gas recovery rate and gas production time [46]. In general, model-scale discrepancies are limited to less than 5% by the Buckingham π theorem to ensure method validity, particularly in non-Darcy flow regimes.
When the physical stimulation experiment is conducted to study the similarity with the gas reservoir, the ten similar parameters are first calculated according to the seepage theory related to the tight gas reservoir and the specific similarity quasi-counting method, and the ten similarity quasi-counts corresponding to the gas reservoir prototype are calculated. Then, according to π1, π3, π5, π6, π7, and π9 of the similar quasi-numbers of the gas reservoir prototype, the values of core size, porosity, gas saturation, initial formation pressure, temperature, and bottomhole pressure of the physical model are determined. Subsequently, the deviation factor of the experimental gas, the model similarity coefficient π2, and the viscosity of the gas are obtained based on the determined experimental temperatures and initial formation pressures of the model. Finally, based on the reservoir prototype similarity coefficients π4 and π8 and the physical modeling experiment parameters determined in the previous steps, the gas recovery rate and the gas production time of the physical modeling experiment are calculated.
Based on the similarity coefficients π10 and gas production time of the experiment to calculate the gas well production time of gas reservoirs,
where a is seepage length, m; b is width of seepage surface, m; h is thicknesses, m; ϕ is porosity, %; Sg is water saturation, %; Tsc is critical temperature, k; pi is pressure, MPa; q is absolute open flow potential, mL/min; Z is compressibility factor, %; T is temperature, k; psc is critical pressure, MPa; m is laboratory conditions.
The production time of the gas wells calculated according to Equation (1) and Table 2 is 12 years. The conclusion of calculation simulation and 10–15 years of gas well production life is accordant. It shows that the similarity criterion of the similarity quasi-criteria for low-permeability tight gas reservoirs is reliable. The corresponding physical stimulation experiments for gas reservoir development can be carried out based on the similarity quasi-criteria to predict the development dynamics of gas reservoirs.
Table 2.
Basic data of gas reservoirs and block sample.
2.2. Waterflooding Experimental
2.2.1. Experimental Material
To study the variation rate between the irreducible water and movable water on hydraulic fracturing, core samples were obtained from the Box-I Member of the lower Shihezi Formation (Fugu Tianshengqiao field, eastern Ordos Basin; shown in Figure 2). We targeted the Tianshengqiao outcrop in Fugu county in the eastern Ordos Basin, which similar to the eastern Dongsheng region in provenance and sedimentary setting, and can take critical information for the establishment of physical models of Dongsheng gas reservoirs in the northern Ordos Basin [47,48]. In the Dongsheng Gas Field, the He1 Member is dominated by medium–coarse-grained detritus quartz sandstone and quartz sandstone. Statistical analysis of the lithology shows that the reservoir contains primarily quartz (exceeding 80%). The average porosity values range from 5% to 18.2% (average = 8.32%), while the permeability values range from 0.2 mD to 3.99 mD (mean = 0.58 mD) for 710 samples.
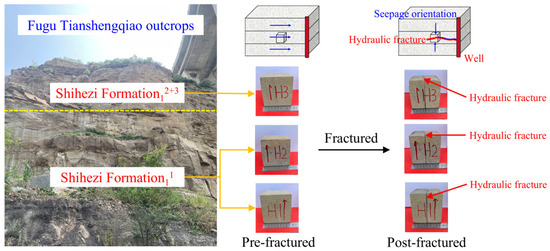
Figure 2.
The sampling location and outcrop section in the lower Shihezi Formation (H1 member) at the Fugu Tianshengqiao section.
Nitrogen was used as the experimental gas, with formation water (salinity: 46,885.09 mg/L TDS) as the aqueous phase. Three outcrop samples (H1, H2, H3) were collected from Section 1 of the Shihezi Formation: H1 originated from the second and third sub-layers, while H2 and H3 were obtained from the first sub-layer. These cores were machined into 10 cm edge-length cubic blocks. A typical three-class outcrop core from a tight sandstone gas reservoir was selected for porosity and permeability measurements. Core porosity was measured using helium injection porosity, and permeability was measured using the steady-state nitrogen injection method. Finally, the following core basic physical parameters were obtained (as shown in Table 3).
Table 3.
Basic parameters of core samples.
To establish similar characteristics of different physical properties between outcrop analogs and underground tight gas reservoirs, we selected three vertically cored plugs from the target stratigraphic formation, which are 2.54 cm in diameter and 7 cm long. The MICP test was conducted in the outcrop core using the GB/T 21650.1-2008 standard [21,49,50]. It aims to obtain pore-throat size distributions. Figure 3 shows that the pore-throat size distribution curves between the reservoir core samples and the surface outcrop sample have high similarity.
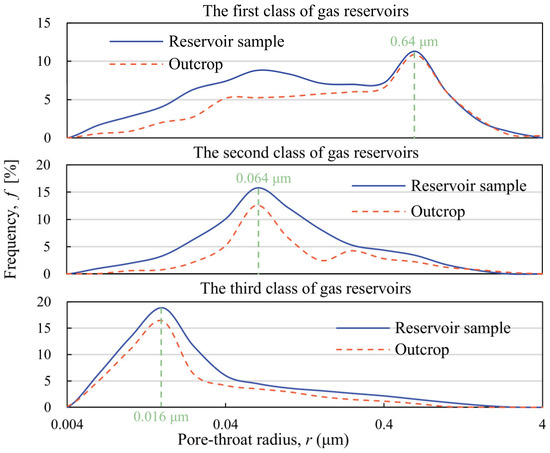
Figure 3.
Comparison of pore size distribution curves for core and outcrops.
Moreover, the MICP data reveal that the corresponding pore radii of their peaks corresponding to H1, H2, and H3 are 0.64 μm, 0.064 μm, and 0.016 μm, respectively. Based on the three classes of formation of the Dongsheng Gas Field, we compared the physical properties of rocks between the outcrop samples and the reservoir core [51,52]. These findings provide similar observations among the three rock samples with different pore structures: the outcrop samples are similar to the reservoir core in the corresponding pore radii of their peaks. Therefore, H1, H2, and H3 can be used to represent the three classes of gas reservoirs.
2.2.2. Experimental Method
As shown in Figure 4, three specimens from three reservoir outcrops were selected to conduct three-dimensional seepage experiments. The block is a cube of approximately 10 cm, and cylindrical core specimens (7 cm length × 2.54 cm diameter) were extracted from the same outcrops. Subsequently, the cylindrical cores were used to perform nuclear magnetic resonance (NMR) analysis, micro-CT imaging, and gas–water displacement experiments. We aimed to observe the influence that acts on pore structure variations and irreducible water transformation from matrix samples to damage samples by hydraulic fracturing. Lastly, the blocks were used to perform the gas drive experiments. We aimed to analyze the gas–water flow mechanisms in pre-fracturing and post-fracturing reservoir condition, and we tested quantifying changes in irreducible water transforms into movable water saturation. Noteworthy, all core samples were tested for porosity and permeability in order to complete standardized screening and pre-processing before the experiment.
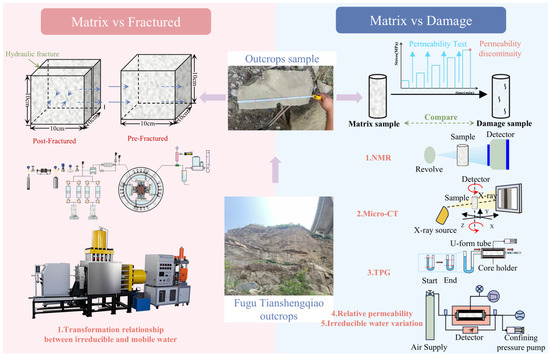
Figure 4.
The graphical schematic of the gas drive experiments.
- (1)
- Micro-CT test
Micro-CT scanning is a nondestructive imaging technique that can use X-rays to generate samples’ internal and external three-dimensional (3D) reconstructions at micron-level resolution [53]. We used a nanoVoxel-4000 3D X-ray microscope from Sanying Precision Instruments Co., Ltd, Tianjin, China, to study the pore structure of pre-fractured matrix samples and post-fractured damage samples in water-bearing tight sandstone gas reservoirs. The scanning system rapidly reconstructs high-resolution CT images with a voltage of 200 kV and a current of 200.0 μA. The pixel size in the cross-sectional images was 9.5 × 9.5 μm2, with reconstructed dimensions of 2300 × 2300 pixels.
- (2)
- NMR test
NMR is a nondestructive technique that is usually employed to characterize pore structure and analyze fluid state [54]. The MesoMR12-060H-I MRI system, developed by the State Key Laboratory of Reservoir Geology and Development Engineering at Chengdu University of Technology, provides high accuracy in NMR apparatus. The parameters we used were echo interval = 0.3 ms, delay time = 6 s, and 128 scans. The variation of pore structure and water saturation on three outcrop samples was analyzed. In porous materials, hydrogen nuclei have primarily undergone surface-induced diffusive relaxation due to their interactions with pore walls. The relaxation time depends on the surface relaxation rate (ρ) of the rock and the ratio of pore volume to surface area, where the V/S ratio is proportional to the pore radius (r). Therefore, the transverse relaxation time can be expressed as follows:
where T2 is orthogonal relaxation time, ms; ρ is surface relaxation rate, dimensionless; V is pore volume, mL/g; S is surface area, μm2; r is pore radius, μm; c is pore shape factor, dimensionless.
Based on Equation (2), the pore size distribution can be derived directly from the spectrum when the relaxation rate P and pore-shape factor c are known.
- (3)
- Threshold pressure gradient test
Threshold pressure gradients reveal a significant correlation with water saturation in tight sandstone gas reservoirs [55,56]. In an experimental study, H1, H2, and H3 formation reservoirs were utilized in gas-driven water displacement experiments under different water saturation conditions. A threshold pressure gradient test was conducted using the unsteady-state method. The core sample and connected pipelines were initially saturated with formation water. The method begins by connecting one end of the U-tube to the core gripper, gradually increasing the system pressure after connection (as shown in Figure 5). The U-tube creates a liquid level difference. The gas and water phases will then be brought into two-phase equilibrium within 24 h. Based on Equation (3), the U-form tube elevation difference at this point is the threshold pressure.
where Pt is threshold pressure, Pa; ρw is density of water, kg/m3, normally takes the value 1000; g is gravity acceleration, m/s2, normally takes the value 9.81; h is height differential of level, m.
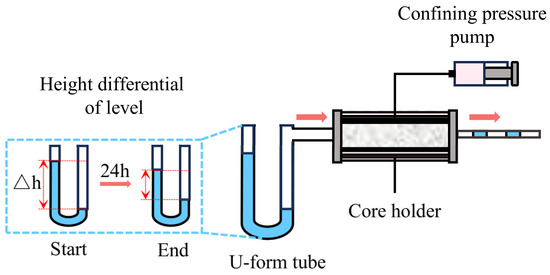
Figure 5.
U-form tube determination of the threshold pressure gradient device.
- (4)
- Irreducible water saturation at different pressure tests
From a seepage perspective, bound water saturation refers to immobile water, whereas in production scenarios, it is defined as water remaining nonflowing under specific pressure differentials [24]. The core experiment sample was extracted from H1, H2, and H3 outcrops. First, the core was fully saturated with formation water at 20 MPa under laboratory conditions. Then, we measured the water at continuously increasing differential displacement pressures. Lastly, as compared with pre-fractured matrix cores, the post-fracturing damaged specimens were analyzed for irreducible water saturation between pressure difference effects.
- (5)
- Gas–water relative permeability test
The relative permeability of gas and water is the basis for determining the characteristics of two-phase seepage, which is essential for dynamic production analysis and development planning in gas fields [57,58,59]. Following industry standard SY/T 5345-2007 [60], a gas–water relative permeability apparatus from the State Key Laboratory of Reservoir Geology and Development Engineering, Chengdu University of Technology, was utilized to measure the gas–water phase permeability of tight sandstone reservoir cores [61]. The experiments employed the unsteady-state method under controlled conditions (292.15 K, 0.1 MPa). This simulation quantified the difference in gas–water phase permeability between matrix cores and damage cores post-fracturing.
- (6)
- Three-dimensional seepage experimental
The three-dimensional seepage experiment uses the outcrops of the Fugu profile to clarify the extent of fracturing in the conversion of irreducible water to mobile water in the near-well zone. The splitting experiment was carried out to observe the changes in water saturation under different repellent pressure differences in the core block. A comparison of before and after splitting was required to clarify how the conversion of irreducible water to mobile water in the near-well zone is affected by fracturing. To simulate the change in flow direction of the gas and water phases after fracturing, in the experiment, the matrix before modification was injected through the A-side to the C-side to be extracted. After fractured and modification, it was changed to be injected perpendicular to the fractured surface (B-sides and D-sides) and extracted from the fractured surface (C-side) (shown in Figure 6).
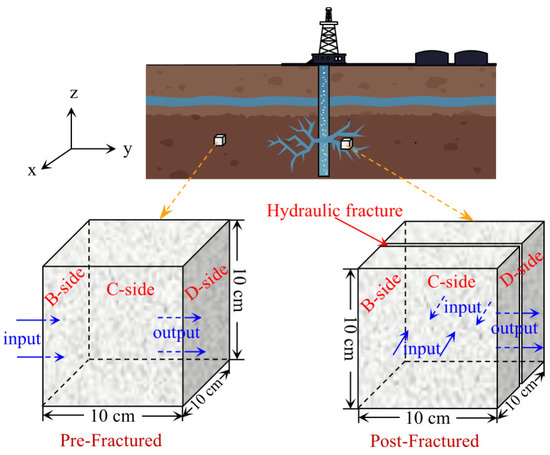
Figure 6.
Seepage mechanism in pre-fractured and post-fractured vertical wells.
2.2.3. Three-Dimensional Seepage Experimental Apparatus
This experiment adopts the true triaxial in situ seepage system (as shown in Figure 7) from the State Key Laboratory of Chengdu University of Science and Technology. It mainly consists of a three-dimensional high-pressure injection system, a true triaxial chamber cylinder (10 cm × 10 cm × 10 cm), a high-temperature and high-pressure trace gas and water automatic metering device, and a pressure sensing system. Among them, the large-size true triaxial experimental frame adopts the rigid load applied laterally. According to the force characteristics of the reservoir rock, the porous high-pressure injection system can be servo-boosted by the oil cylinder, and the maximum injection pressure of 70 MPa can be achieved in the X–Y–Z directions. The heating system is electrically heated, and its thermodynamic simulation module can achieve precise temperature control of up to 120 ± 0.5 °C. The high-temperature, high-pressure micro gas and water automatic dosing devices are based on the positive and negative displacement drive weighing method, which can achieve accurate dosing of 1 mL.
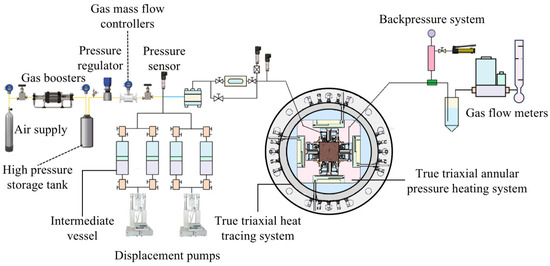
Figure 7.
Schematic diagram of a true triaxial in situ percolation system.
2.2.4. Three-Dimensional Seepage Experimental Procedure
The experimental procedure involves the following steps: (1) Dry the core, weigh it, then place it under vacuum to saturate with simulated formation water. (2) Heat the core holder to 105 °C using a thermostat and maintain this temperature for at least 8 h. (3) Apply a confining pressure of 32 MPa to the core while setting the backpressure valve to 31.9 MPa. (4) Adjust the backpressure at the outlet end once pressures at both inlet and outlet stabilize, then gradually decrease the backpressure. (5) Monitor water saturation by weighing rock samples during the displacement process; repeat until no effluent is observed at the outlet. (6) Repeat steps 4–5 until water saturation changes by ≤2% between experimental stages. (7) Split the core along the displacement direction, reconfigure the system for vertical fractured displacement, and repeat steps 1–5.
3. Results
3.1. Pore Structure Variations
3.1.1. Micro-CT Test Results
We identify the pore structure change types by analyzing micro-CT imaging of matrix cores and damaged cores [62]. Figure 8 shows two typical pore structure variants: diameter enlargement in connected pore throats and connectivity conversion of isolated pores. The experimental results of H1 cores from a class of reservoirs used in this experiment were analyzed.
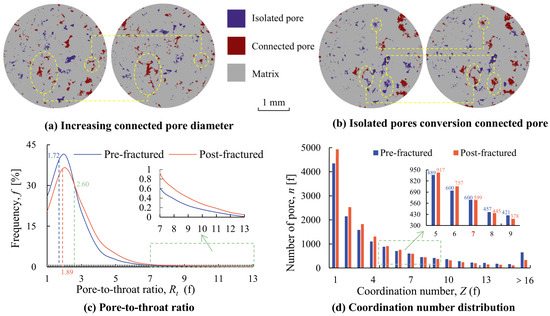
Figure 8.
Pore structure changes in post-fractured (micro-CT).
The increase in interconnected pore diameter is primarily attributed to the physical expansion of the pore structure during hydraulic fracturing. Figure 8a shows the pore size distribution and pore-throat geometry of the pre-fractured sample on the left, and the enlarged pore size and pore-throat structure variation on the right (scale is 1 mm). The pore alteration of geometry considerably reduces capillary forces, thereby increasing the formation permeability. In the damage zone, pore radius variations are closely related to rock mechanical properties.
Due to the isolated pores’ lack of connectivity with the seepage network, the irreducible water of its pores cannot migrate under the production differential pressure. As shown in Figure 8b, the isolated pore is linked to the seepage network by hydraulic fracturing in the damage zone. A stress field occurred under the influence of hydraulic fracturing, which caused seepage network development. while reducing the one-way resistance of the gas–water phase and increasing the effective permeability of the gas reservoir. This can easily be an order of magnitude higher equivalent permeability in post-fracture. As the geomechanical qualities differ among reservoirs, the degree of importance for pore enlargement versus connectivity modification is also expected to vary a great deal between classes.
The pore-to-throat change curves are shown in Figure 8c. Based on these curves, the average pore-to-throat ratio of matrix sample is 1.72, and the average damage sample is 1.89. The results indicate that the high-pressure injection induces shear-dominated plastic deformation in the matrix during hydraulic fracturing. This process has increasing connected pore diameter and isolated pores conversion connected pore. The mechanisms enlarge the pores and increase the pore-to-channel ratio. Notably, the number of pores in the damage samples exceeds that in the matrix when the coordination number is less than 7. The damage samples are less than the matrix samples when the coordination number is greater than 7 (Figure 8d). It can be seen that plastic deformation may have squeezed the original throat, resulting in the splitting of some of the high-coordination-number pores into multiple low-coordination-number pores.
3.1.2. NMR Test Results
The T2 distributions compared with matrix samples and damage samples are displayed in Figure 9. The distribution of three classes of formation pore size are bimodal, in which the primary peak corresponds to micropores and the secondary peak corresponds to macropores. Collectively, these results indicate that the micropores constituted the main storage spaces, but the macropores constituted the main seepage network. The alteration of rock pore structure induced by hydraulic fracturing leads to changes in both porosity and permeability [63].
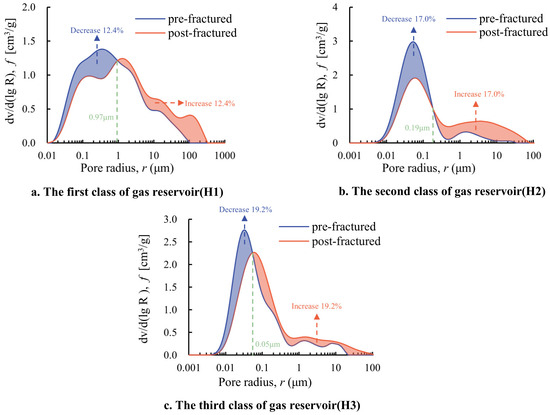
Figure 9.
Pore structure changes in post-fracture (NMR).
The pore size distribution curves move to larger pore sizes. The median pore radii of the three classes was calculated as 0.97 μm, 0.19 μm, and 0.05 μm, respectively. Concurrently, small pore proportion decreased by 12.4%, 17.0%, and 19.2%, and permeability increased by a factor of 171% to 934%. These results indicate that hydraulic fracturing does improve pore structures. The capillary resistance of fluid in the pore throat is an exponential rate, which causes an increase in the effective permeability of the reservoir. Excellent correlation was found between pore structure variation using micro-CT imaging and pore size distribution using NMR. Fracture modification significantly altered the pore structure of the damaged zones. As shown in Table 4, the porosity of the H1 shown increases from 15.53% to 16.08%, accompanied by a rise in permeability from 2.466 mD to 4.229 mD, with growth rates of 3.54% and 71.5%, respectively. Likewise, the H2 sample indicated a porosity increase from 9.22% to 9.84%, and a permeability rise from 1.127 mD to 3.378 mD, with growth rates of 6.72% and 199.73%, respectively. Similarly, the H3 sample revealed a porosity increase from 6.06% to 6.59% and a permeability rise from 0.206 mD to 1.924 mD, with growth rates of 8.75% and 833.98%, respectively. Notably, pore structural alteration rate is negatively associated with the physical properties of the gas reservoir. This can be attributed to the inhomogeneity of gas reservoirs. These results indicate that physical property difference has a different effect on rock mechanics. High porosity and permeability formation have a lower Young’s modulus, making it easy to form a single main fracture [64]. On the contrary, low porosity and permeability formation have a higher brittleness index, prone to generate shear failure and pore restructure. And, more importantly, the seepage network achieved “improved probable reserves” by hydraulic fracturing, enhancing the capacity to mobilize matrix formation, supporting the long-term stable production of gas wells.
Table 4.
A comparison of the parameters of the core samples pre- and post-fractured.
3.2. Threshold Pressure Gradient Variations
As shown in Figure 10, the threshold pressure gradient was comparatively analyzed between the matrix sample and the damaged samples. Seepage curves of the core samples exhibited nonlinear characteristics because of the presence of formation water. Notably, the threshold pressure gradient of the four core samples increases with water saturation. As the water saturation becomes higher, the non-Darcy flow characteristics become more significant. They share a powerful function correlation, so as the water saturation increases, the non-Darcy flow characteristics become more significant. As shown in Figure 10, they have a high fitting accuracy (R2 > 96%). The phenomenon arises because the gas is in a discrete bubble state at higher water saturation. It can be due to the presence of these discontinuity bubbles, which cause the generation of the Jamin effect in nano-/micropores [65]. Because it is affected by the Jamin effect, the flow resistance in the discontinuous phase flow includes a much higher capillary resistance than the continuous phase flow. In general, there is a positive correlation between the flow resistance and the water saturation in gas–water phase seepage [57]. The Jamin effect in a gas reservoir results in a high initial water cut, and this means the resistance of the Jamin effect should not be ignored.
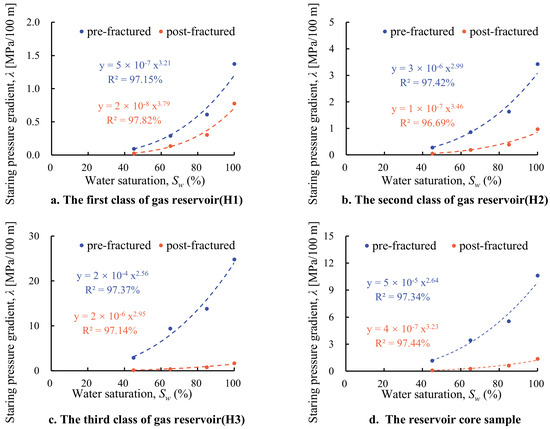
Figure 10.
Plot of starting pressure gradient versus water saturation.
Based on the experimental data, the permeability of pre-fracturing and post-fracturing were 0.58 mD and 3.0 mD, respectively. Then, combined with the average water saturation of 52%, we compared the threshold pressure gradient value between the matrix zone and damage zone. The value was calculated using the previous fit equation (Figure 11). The analysis results show that the threshold pressure gradient of the pre-fractured formation was 1.0 MPa/100 m, and the post-fractured formation was 0.1 MPa/100 m. It indicates a tenfold decrease following hydraulic stimulation.
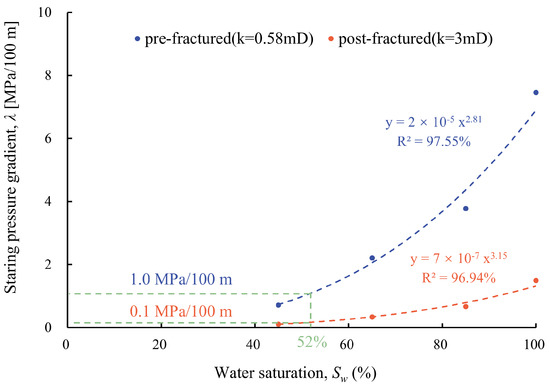
Figure 11.
Average starting pressure gradient pre-fracture and post-fracture in reservoirs.
Although there were no macro-fractures in the damage zone, the permeability can significantly increase through microfracture expansion and pore space variation. Redistribution of pore-throat size can significantly reduce the capillary resistance of the fluid, resulting in a decrease in the starting pressure gradient. The dissolution and migration of pore surface mineralogy would reduce the solid–liquid interfacial tension. The part of the irreducible water that emanates from the mineral surface transforms into movable water. Some scholars have pointed out that when the average pore-throat radii is increased to 0.1 μm from 0.3 μm, the starting pressure gradient can drop to 50–70% [66]. Additionally, the value of the absolute open flow potential (AOPF) increased 4 × 10³ m3/d after hydraulic fracturing when considering the TPG. Comparisons show that AOFP is underestimated while using the TPG value of the matrix sample [26,67]. The results provide the theoretical basis for the enhancement of seepage capacity in tight sandstone gas reservoirs.
Additionally, gas–water interactions critically influence fluid mobility, particularly during gas displacement of irreducible water [68]. In the damaged zone, the increased permeability due to the change in pore structure weakens the Klinkenberg effect, but enlarged pore throats drastically reduce Pc and dominate the threshold pressure reduction. Here, the synergy between higher k∞ and suppressed Pc enables gas mobilization at significantly lower pressures than in the matrix. The Klinkenberg effect critically governs threshold pressure disparities between matrix and damage zones.
3.3. Transformation Relationship Between Irreducible and Mobile Water
As shown in Figure 12, the water saturation decreases exponentially with the gradual increase in drive pressure. This result demonstrates that the irreducible water adsorbed to the gas reservoirs incurs the gas–water distribution reorganization under a larger pressure difference. Some of the capillary water is stripped from the pore wall and is converted to movable water. When the drive pressure has increased to a constant value (pre-fracturing approximately is 7.0 MPa; post-fracturing approximately is 2.0 MPa), the water saturation value will soon stabilize. This is because the residual water changes from a continuous phase to an isolated phase when it reaches dynamic equilibrium between the capillary pressure and the driving pressure. At this time, the residual water, which is irreversible, remains in the microporous throat and adsorbs on hydrophilic rock surfaces, eventually developing the irreducible water. The experimental result demonstrates that the variation rates between irreducible water and movable water are 1.38%, 6.87%, and 11.61% for the three reservoir classes, respectively. Notably, the hydraulic fracturing accelerates variation rate in the damage zone, but the water production does not rise that much.
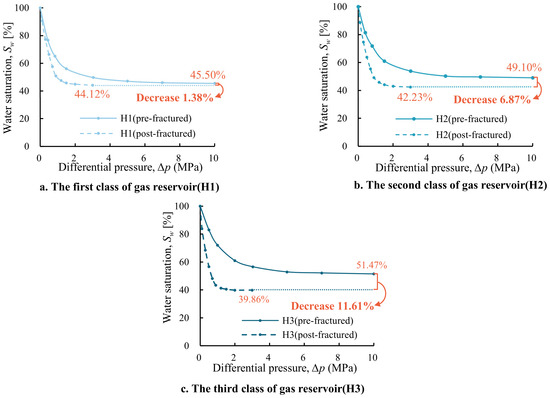
Figure 12.
Conversion curve of irreducible to mobile water in reservoir damage zones.
3.4. Gas–Water Flowability Variations
The gas–water relative permeability curves of the pre-fractured matrix sample and the post-fractured damage sample are shown in Figure 13. We can calculate several key points of relative permeability curves in this sample, including the irreducible water saturation with corresponding gas phase relative permeability, equal-permeability point water saturation, and equal-permeability point relative permeability (shown in Table 5).
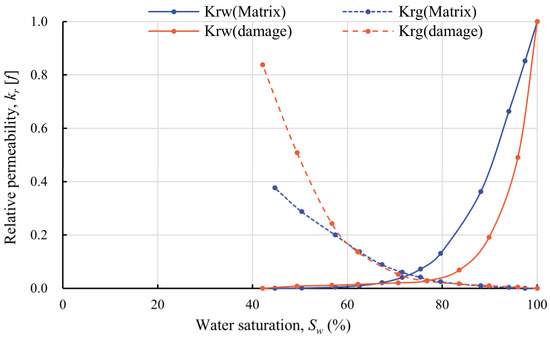
Figure 13.
Comparison of the matrix and damage sample relative permeability curve.
Table 5.
Results of gas-driven water-phase infiltration tests.
From Figure 13, we can see that the gas–water relative permeability curves present a concave profile due to the gas–water phase relative permeability change by the same amount. With the gas saturation increases, the gas relative permeability is stably growing, and the water relative permeability is declining. While the gas relative permeability shows a rise at the beginning of the experiment, it presents a rapid increase after the isotonic point. On the contrary, the water relative permeability has decreased rapidly before slowing. Compared to the matrix cores, the gas–water relative permeability curve of the damaged core changes as follows: (1) irreducible water saturation has decreased by 2.59%; (2) the gas–water flow zone has expanded; (3) the gas relative permeability in irreducible water saturation has more than doubled. Notably, the gas relative permeability value will rapidly decline when the water saturation in the sample falls from 100% to 80% [69]. At the isotonic point, the water saturation of the damaged sample is roughly 4.85% higher than that of the matrix sample.
The results show that the pore system transformed into a “matrix-fracture” dual-porosity system in the gas reservoir, which led to significant improvements in gas flow mobility. During the lower gas saturation phase (Sg < 20%), the gas phase priorities formed a continuous gas phase flow. These results indicate that the viscous resistance created by the residual water film attached to the fracture surface gradually decreases with the water produced. When the gas saturation phase surpasses the critical threshold (Sg > 30%), this can be attributed to the gas phase overcoming the capillary force, which makes the gas relative permeability increase significantly and form the main seepage channels. Concurrently, the water phase migration into micropores (r < 1 μm) is under heavy capillary forces, leading to the water relative permeability rapidly declining, and the residual water stabilizes by capillary forces captured. The matrix-damage system expanded the zone of gas–water phase flow and improved the gas–water phase flow efficiency.
3.5. Quantification of Irreducible Water and Movable Water
Figure 14 illustrates the water saturation variations of matrix and fractured blocks under different pressure differences using a three-dimensional seepage experimental apparatus. The matrix block and fractured block were from the same outcrop, only representing the different states, which are before the splitting treatment and after the splitting treatment. This process ensures the homology of mineral composition and initial physical properties in two tests. There is an increasing trend in the physical properties of the three classes of reservoirs. The basic physical parameters of the three blocks are shown in Table 3.
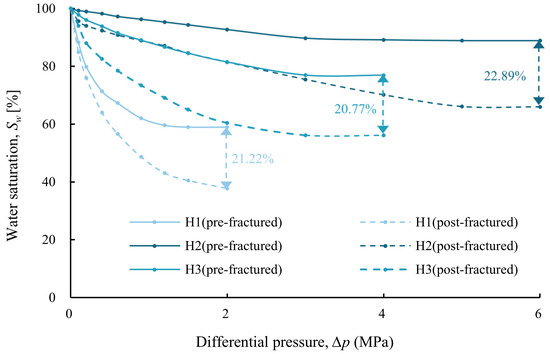
Figure 14.
Conversion curve of irreducible to mobile water in reservoir fracture networks.
Compared to the damage core plunger, the water saturation of the fractured block also decreases exponentially with the gradual increase in drive pressure. The difference is that the irreducible water saturation of rock blocks decreased by 21.22%, 20.77%, and 22.89%, respectively. The cause of this phenomenon is that the lower porosity and lower permeability lead to higher capillary pressure in tight sandstone gas reservoirs, while the stable water saturation values of the pre-fractured matrix block of the three classes of reservoirs are 59.00% (2.0 MPa), 76.93% (3.0 MPa), and 88.87% (5.0 MPa), respectively. This result demonstrates that the irreducible water saturation is significantly influenced by pressure differential; it requires greater pressure gradients to achieve stable irreducible water saturation in core samples.
Hydraulic fracturing changed the seepage path of the gas–water phase, which resulted in the pressure drop gradient decreasing by half. For the main seepage channel, a significant change in the pore structures was caused by fracture network generation [70]. When the main fracture interconnected with adjacent microfractures, over 20% of the irreducible water was converted to mobile water. The main seepage paths subsequently enhanced mobile water phase mobility.
4. Discussion
4.1. Flow Mechanism of Irreducible Water After the Change
4.1.1. Pore Diameter Amplify
The irreducible water production mechanism through hydraulic fracturing is a key element of the gas recovery rate in tight sandstone. Micro-CT analyses reveal varying changes in the pore structure of gas reservoirs during hydraulic fracturing, leading to mechanisms of irreducible water evolution. Unfortunately, the majority of water in the connected pore is trapped in nano-/micropores due to capillary force. The occurrence pattern of irreducible water obeys the Young–Laplace equation [71], Equation (4).
where Pc is capillary force, Pa; σ is surface tension, mN/m; r is capillary radius, mm; θ is wetting angle, °.
As shown in Figure 15, hydraulic fracturing is an important trigger for induced physical reconstruction between sand grains and pore throats. Under the dual drive of rock mechanics changes and geo-mechanical changes, the pore-throat size of the damage zone undergoes marked enlargement. On the one hand, pore-throat enlargement leads to the combination of microfracture spread and primary pore expansion. The irreducible water overcomes the capillary force and transforms into a movable phase. On the other hand, shear slide and extension fracture enlarge the pore-throat diameter. On yet another hand, proponent embedment and acid etching improve the roughness of the porous surface, which enhances the flow path. Overall, the synergy between pore structure, variation, and stress state alteration decreases the initiation multiphase flow threshold.
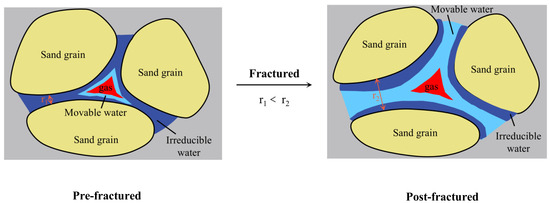
Figure 15.
Schematic diagram of amplified pore diameter, leading to conversion of irreducible water to mobile water.
4.1.2. Isolated Pore Space Connected
Seepage network connectivity is altered through localized pore structure variation and gas–water flow mechanisms. Of these, isolated pore space is connected to pore networks that promote the transformation of irreducible water into movable water. As illustrated in Figure 16, the local isolated pore is connected with the seepage network by hydraulic fracturing. This pore structure variation phenomenon might be attributed to shear and slippage of cement [72]; this is because the effective stress decreases after hydraulic fracturing, and original intracrystalline pores and the intercrystalline solution pore system were reorganized by shear failure, forming a pore system dominated by secondary solution pores. While the coordination numbers of connected pores have increased, this leads to pore connectivity. Irreducible water, which is confined in narrow throats or isolated micropores, has been integrated into continuous flow networks. The movable water saturation has increased, and the irreducible water has diminished.
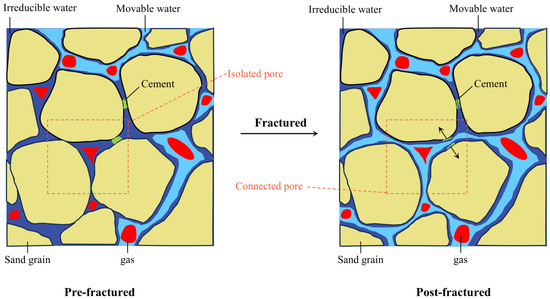
Figure 16.
Schematic diagram of isolated pore space connection, leading to conversion of irreducible water to mobile water.
In the damage zone, the gas–water flow mechanism obeys Darcy’s law. Improving the reservoir permeability can significantly affect the pore connectivity and reduce the threshold pressure gradient. During reservoir depletion, this indicates that gas expansion induces efficient pressure propagation in microporous systems. The gas overcomes the barriers of the capillary and displaces irreducible water into macropore networks. Moreover, the gas-driven water effect, which refers to the gas–water flow mechanism, enhances water phase mobilization efficiency in interconnected pore systems.
4.2. The Maximum Recoverable Water Increases from a Horizontal Well’s Hydraulic Fracturing
To further examine the fracturing underlying increased water production, we note that a significant research effort should be focused on eight fractured horizontal wells in the Dongsheng Gas Field in the Ordos Basin. Based on the data from the previous physical experiment, concerning the transformation rate from irreducible water to movable water, there is already ample evidence of a variation of 2% in the damaged zone and 20% in the fractured zone. As shown in Figure 17, we calculated the total maximum increase in recoverable water volume attributable to hydraulic fracturing using the volumetric method.
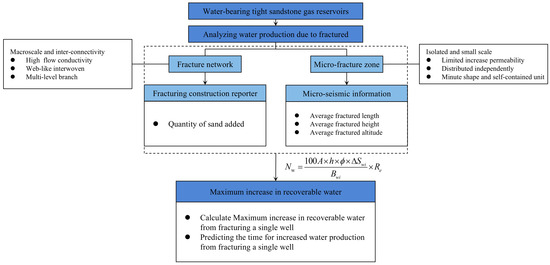
Figure 17.
Research methodology and steps.
We establish the relationship between the maximum recoverable water increase from a gas well and the variation rate from irreducible water to movable water [73].
where A is water-bearing area, km2; h is effective thickness, m; Re is recovery rate, dimensionless; ϕ is porosity, dimensionless; B is original formation water volume factor, dimensionless; ΔSw is increase in movable water rate due to fractured, dimensionless; Nw is the maximum recoverable water increase from a horizontal well’s hydraulic fracturing ×104 m3.
Four fractured horizontal wells were studied in each of Channels 5 and 6 within the target block. To simplify the model, we hypothesized that each fractured section was ellipsoidal, and the fracture volume was replaced with the quantity of sand added. Figure 18 shows the results of the maximum increase in recoverable water through hydraulic fracturing in eight horizontal wells.
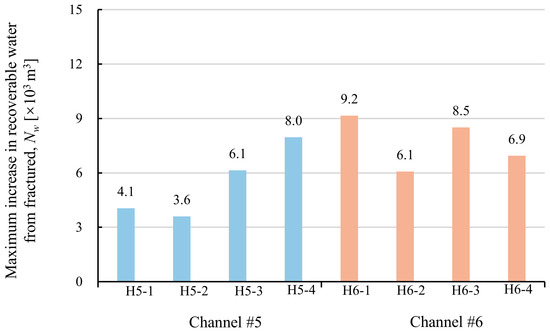
Figure 18.
Maximum increase in recoverable water from hydraulic fracturing in a horizontal well (8 wells from Channel 5 and Channel 6).
For this reason, hydraulic fracturing resulted from fracking-induced conversion of irreducible water to mobile water. Of the eight wells analyzed, typical cases were calculated to yield a maximum water production potential of 3607–9163 m3. Channel 6 had a higher increase in recoverable water than Channel 5. This caused enhanced connectivity to water-bearing zones through hydraulic fracturing. Moreover, it had lower reservoir resistivity and higher water saturation. As illustrated in Figure 19, the onset of water production may delay gas production by 3–6 months, primarily due to the gradual conversion of irreducible water to mobile water. This phenomenon elevates the risk of fluid loading in gas wells. From the above discussion, the conclusion can be reached that the gas well must be developed using the drainage gas recovery technique. The water–gas ratio (WGR) must be maintained below 5 m3/104 m3 with the economic viability of gas production.
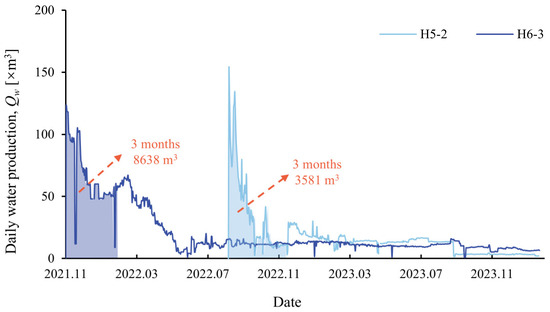
Figure 19.
Single well production dynamic curve (3 months).
5. Conclusions
This study investigated the mechanism of irreducible water transforming into movable water in water-bearing tight sandstone gas reservoirs, caused by fractured alterations in pore-throat structures. By integrating analyses of multiple experimental datasets, some conclusions were obtained, as follows.
- (1)
- All three reservoir classes in the Dongsheng Gas Field, tight sandstone, exhibit a bimodal pore-throat distribution. The hydraulic fracturing process promotes significant modifications to the reservoir. This process reveals the creation of new seepage channels, increasing the diameter of the pore-throat connections and establishing links between isolated and connected pores. The conversion percentage from small to large pores in the three reservoir classes reached 12.4%, 17.0%, and 19.2%, respectively. This transformation achieves the capillary resistance, which causes 171% to 937% higher than that of pre-fractured matrix permeability.
- (2)
- The starting pressure gradient of water-bearing gas reservoirs increased with its rising water saturation, and this relationship can be described as a power function. After hydraulic fracturing stimulation, the starting pressure gradient of the gas reservoir decreased from 1 MPa/100 m to 0.1 MPa/100 m. The potential mechanisms underlying the reduction in starting pressure gradient on the gas–water flow include reduced capillary forces between fluid phases and the establishment of a continuous gas phase via bubble coalescence.
- (3)
- In damage zones, gas seepage primarily obeys Darcy flow. Pre-fracturing high capillary pressure causes irreducible saturation to decrease exponentially with rising pressure gradient, stabilizing after rapid attenuation. The lower irreducible saturation and a notable acceleration in water production rate may, therefore, be involved in their enhanced permeability and pore connectivity in hydraulic fracturing. In three classes of formations, the transformation of irreducible water to mobile water occurs at rates of 1.38%, 6.87%, and 11.61%. Fracture zones obey pipe flow (non-Darcy flow), which occurs, reaching 20.77% to 22.89% transform efficiency.
- (4)
- The relative permeability curves of gas and water phases in the matrix sample and damaged samples exhibit concave profiles. The water-phase permeability displays a rapid initial decline followed by a gradual reduction as water saturation decreases. Experiments performed in the damaged sample demonstrated enhanced gas–water flow capability, as evidenced by that of the matrix sample. In particular, the iso-permeability point shifts toward higher water saturation. The gas-phase relative permeability at irreducible water saturation is two times as high as that of the matrix sample.
- (5)
- The analysis of eight gas wells in the J30 well area of the Dongsheng Gas Field revealed that hydraulic fracturing increased water production by 3607 to 9163 m3. The results disclosed that hydraulic fracturing enhances initial water production rates and elevates water yields, which leads to a decrease in well performance. But this effect is only maintained during the first 3 to 6 months post-fracture. Despite this short-term water influx accelerating near-wellbore pressure depletion, we strongly suggest that it is critical to maintain the water–gas ratio (WGR) below 5 m3/104 m3 of gas in implementing an optimized production strategy. Such balanced production control ensures prolonged gas well stabilization.
Author Contributions
Conceptualization, A.H. and C.Y.; methodology, A.H. and L.S.; experimental, L.S. and G.C.; discussion, A.H. and C.Y.; software, Q.C. and Z.L.; results analysis, L.S. and C.Y.; investigation, G.C. and Z.L.; writing, A.H. and L.S.; review, L.S. and C.Y. All authors have read and agreed to the published version of the manuscript.
Funding
This research was funded by the SINOPEC Ministry of Science and Technology Project, grant number P23156-4.
Data Availability Statement
The original contributions of this study are comprehensively articulated in the article. For additional inquiries, correspondence should be addressed to the corresponding author.
Acknowledgments
The authors would like to express their sincere gratitude to the State Key Laboratory of Oil and Gas Reservoir Geology and Exploitation (Chengdu University of Technology) and the Research Institute of Petroleum Engineering Technology of Sinopec North China Oil and Gas Company for their comprehensive support in this research.
Conflicts of Interest
Author Aiguo Hu was employed by the Research Institute of Petroleum Engineering Technology, Sinopec North China Petroleum Bureau. The remaining authors declare that they have no known competing financial interests or personal relationships that could have appeared to influence the work reported in this paper.
References
- Zou, C.; Dong, D.; Wang, Y.; Li, X.; Huang, J.; Wang, S.; Guan, Q.; Zhang, C.; Wang, H.; Liu, H.; et al. Shale gas in China: Characteristics, challenges and prospects (II). Pet. Explor. Dev. 2016, 43, 182–196. [Google Scholar] [CrossRef]
- Burrows, L.C.; Haeri, F.; Cvetic, P.; Sanguinito, S.; Shi, F.; Tapriyal, D.; Goodman, A.; Enick, R.M. A literature review of CO2, natural gas, and water-based fluids for enhanced oil recovery in unconventional reservoirs. Energy Fuels 2020, 34, 5331–5380. [Google Scholar] [CrossRef]
- Yao, J.; Wang, C.; Huang, Z.; Zhou, X.; Li, J. Stress sensitivity of ultra-deep tight sandstone gas reservoirs based on microscopic ffuid-solid coupling. Nat. Gas Ind. 2024, 44, 45–55. [Google Scholar] [CrossRef]
- Meng, D.; Jia, A.; Ji, G.; He, D. Water and gas distribution and its controlling factors of large scale tight sand gas fields: A case study of western Sulige gas field, Ordos Basin, NW China. Pet. Explor. Dev. 2016, 43, 663–671. [Google Scholar] [CrossRef]
- Meng, D.; He, D.; Guo, Z.; Wang, G.; Ji, G.; Tang, H.; Zeng, Q. Dynamic analysis of high-water-cut tight sandstone gas reservoirs and study of water production splitting of gas wells: A case study on the Western Sulige Gas Field, Ordos Basin, NW China. Processes 2023, 11, 2093. [Google Scholar] [CrossRef]
- Pow, M.; Allan, V.; Mallmes, R.; Kantzas, A. Production of gas from tight naturally-fractured reservoirs with active water. In Proceedings of the 48th Annual Technical Meeting, Calgary, AB, Canada, 8–11 June 1997. [Google Scholar]
- Ghanbari, E.; Dehghanpour, H. The fate of fracturing water: A field and simulation study. Fuel 2016, 163, 282–294. [Google Scholar] [CrossRef]
- Zheng, S.; Wang, R.; Shou, Q.; Zhao, J.; Zhang, Y. Analysis of atmospheric water locks and water lock solutions in tight sandstone gas reservoirs in the Ordos Basin. J. Phys. Conf. Ser. 2025, 2962, 012002. [Google Scholar] [CrossRef]
- Zhang, J.; Tang, Y.; Wang, H.; Huang, L.; Liao, F.; Liu, Y.; Chen, Y. Study on the mechanism of water blocking in tight sandstone gas reservoirs based on centrifugal and nuclear magnetic resonance methods. Energies 2022, 15, 6680. [Google Scholar] [CrossRef]
- Khormali, A.; Ahmadi, S. Synergistic Effect Between Oleic Imidazoline and 2-Mercaptobenzimidazole for Increasing the Corrosion Inhibition Performance in Carbon Steel Samples. Iran. J. Chem. Chem. Eng. 2023, 42, 321–336. [Google Scholar] [CrossRef]
- Clarkson, C.R.; Solano, N.; Bustin, R.M.; Bustin, A.M.M.; Chalmers, G.R.L.; He, L.; Melnichenko, Y.B.; Radliński, A.P.; Blach, T.P. Pore structure characterization of North American shale gas reservoirs using USANS/SANS, gas adsorption, and mercury intrusion. Fuel 2013, 103, 606–616. [Google Scholar] [CrossRef]
- Gao, H.; Li, H.A. Pore structure characterization, permeability evaluation and enhanced gas recovery techniques of tight gas sandstones. J. Nat. Gas Sci. Eng. 2016, 28, 536–547. [Google Scholar] [CrossRef]
- Wu, Y.; Tahmasebi, P.; Lin, C.; Zahid, M.A.; Dong, C.; Golab, A.N.; Ren, L. A comprehensive study on geometric, topological and fractal characterizations of pore systems in low-permeability reservoirs based on SEM, MICP, NMR, and X-ray CT experiments. Mar. Pet. Geol. 2019, 103, 12–28. [Google Scholar] [CrossRef]
- Xu, L.; Cai, M.; Dai, Z.; Zheng, Z.; Chen, W.; Yin, S.; Zhang, X.; Thanh, H.V.; Soltanian, M.R. Fractal and NMR based characterizations of multi-scale pore structure alterations in tight sandstones due to scCO2-water–rock interactions. Chem. Eng. J. 2025, 508, 160898. [Google Scholar] [CrossRef]
- Guo, X.; Huang, Z.; Zhao, L.; Han, W.; Ding, C.; Sun, X.; Yan, R.; Zhang, T.; Yang, X.; Wang, R. Pore structure and multi-fractal analysis of tight sandstone using MIP, NMR and NMRC methods: A case study from the Kuqa depression, China. J. Pet. Sci. Eng. 2019, 178, 544–558. [Google Scholar] [CrossRef]
- Nie, R.-S.; Zhou, J.; Chen, Z.; Liu, J.; Pan, Y. Pore structure characterization of tight sandstones via a novel integrated method: A case study of the Sulige gas field, Ordos Basin (Northern China). J. Asian Earth Sci. 2021, 213, 104739. [Google Scholar] [CrossRef]
- Wu, Y.; Liu, C.; Ouyang, S.; Luo, B.; Zhao, D.; Sun, W.; Awan, R.S.; Lu, Z.; Li, G.; Zang, Q. Investigation of pore-throat structure and fractal characteristics of tight sandstones using HPMI, CRMI, and NMR methods: A case study of the lower Shihezi Formation in the Sulige area, Ordos Basin. J. Pet. Sci. Eng. 2022, 210, 110053. [Google Scholar] [CrossRef]
- Wang, W.; Lu, S.; Chen, X.; Li, X.; Li, J.; Tian, W. A new method for grading and assessing the potential of tight sand gas resources: A case study of the Lower Jurassic Shuixigou Group in the Turpan-Hami Basin, NW China. Pet. Explor. Dev. 2015, 42, 66–73. [Google Scholar] [CrossRef]
- Bo, N.; Dazhong, R.; Hu, W.; Hanpeng, Z.; Jianlin, G.; Ninghai, F.; Junjian, L.; Tian, L.; Qihui, L. Multi-scale combination characterization of micropore structure of tight sandstone gas reservoirs. Fault-Block Oil Gas Field 2024, 31, 35–41. [Google Scholar]
- Zhang, W.; Shi, Z.; Tian, Y. An improved method to characterize the pore-throat structures in tight sandstone reservoirs: Combined high-pressure and rate-controlled mercury injection techniques. Energy Explor. Exploit. 2020, 38, 014459872092072. [Google Scholar] [CrossRef]
- Li, P.; Zheng, M.; Bi, H.; Wu, S.; Wang, X. Pore throat structure and fractal characteristics of tight oil sandstone: A case study in the Ordos Basin, China. J. Pet. Sci. Eng. 2017, 149, 665–674. [Google Scholar] [CrossRef]
- Lai, J.; Wang, G.; Fan, Z.; Chen, J.; Wang, S.; Zhou, Z.; Fan, X. Insight into the pore structure of tight sandstones using NMR and HPMI measurements. Energy Fuels 2016, 30, 10200–10214. [Google Scholar] [CrossRef]
- Zhao, P.; Wang, Z.; Sun, Z.; Cai, J.; Wang, L. Investigation on the pore structure and multifractal characteristics of tight oil reservoirs using NMR measurements: Permian Lucaogou Formation in Jimusaer Sag, Junggar Basin. Mar. Pet. Geol. 2017, 86, 1067–1081. [Google Scholar] [CrossRef]
- Dong, S.; Zeng, L.; Xu, C.; Dowd, P.; Gao, Z.; Mao, Z.; Wang, A. A novel method for extracting information on pores from cast thin-section images. Comput. Geosci. 2019, 130, 69–83. [Google Scholar] [CrossRef]
- Liu, D.; Sun, W.; Ren, D. Experimental investigation of pore structure and movable fluid traits in tight sandstone. Processes 2019, 7, 149. [Google Scholar] [CrossRef]
- Zafar, A.; Su, Y.-L.; Li, L.; Fu, J.-G.; Mehmood, A.; Ouyang, W.-P.; Zhang, M. Tight gas production model considering TPG as a function of pore pressure, permeability and water saturation. Pet. Sci. 2020, 17, 1356–1369. [Google Scholar] [CrossRef]
- Zhang, J.; Li, X.; Shen, W.; Gao, S.; Liu, H.; Ye, L.; Fang, F. Study of the effect of movable water saturation on gas production in tight sandstone gas reservoirs. Energies 2020, 13, 4645. [Google Scholar] [CrossRef]
- Zhu, W.; Zou, G.; Liu, Y.; Liu, W.; Pan, B. The influence of movable water on the gas-phase threshold pressure gradient in tight gas reservoirs. Energies 2022, 15, 5309. [Google Scholar] [CrossRef]
- Chen, F.; Wang, Z.; Fu, S.; Li, A.; Zhong, J. Research on transformation of connate water to movable water in water-bearing tight gas reservoirs. Energies 2023, 16, 6961. [Google Scholar] [CrossRef]
- Xu, W.; Wu, C.; Guan, P.; Hu, F. Prediction of free water in the unconsolidated sandstone reservoir in the Quaternary gas field, Qaidam basin. Nat. Gas Geosci. 2012, 23, 952–955. [Google Scholar]
- Hu, Y.; Huayin, Z.; Yang, M.; Changmin, G.; Chunyan, J.; Xuan, X. The evaluation method for mobile water saturation of tight sandstone gas reservoir. Dev. Energy Sci. 2013, 2, 16–21. [Google Scholar]
- Ji, S. Movable Condition Research of Pore Water in Sulige Gas Field. Master’s Thesis, Xi’an Shiyou University, Xi’an, China, 2015. [Google Scholar]
- Gao, S.; Hou, J.; Yang, H.; Xiong, W.; Hu, Z. Water production mechanism of Xujiahe low-permeability sandstone gas reservoirs in Middle Sichuan Basin. Nat. Gas Ind. 2012, 32, 40–42. [Google Scholar] [CrossRef]
- Ye, L.; Gao, S.; Yang, H.; Xiong, W.; Hu, Z.; Liu, H.; Du, S. Water production mechanism and development strategy of tight sandstone gas reservoirs. Nat. Gas Ind. 2015, 35, 41–46. [Google Scholar] [CrossRef]
- Liu, D.; Yue, X.; Hou, J.; Cao, J.; Wang, L. Experimental study of adsorbed water layer on solid particle surface. Acta Mineral. Sin. 2005, 25, 15–19. [Google Scholar] [CrossRef]
- Deng, Y.; Lu, Y.; Li, J.; REn, Z. Critical-flowing condition of inner-layer secondary-movable water in low-permeability gas reservoir. Nat. Gas Explor. Dev. 2011, 34, 36–38. [Google Scholar] [CrossRef]
- Liu, Y.; Ding, Z.; Ao, K.; Zhang, Y.; Wei, J. Manufacturing method of large-scale fractured porous media for experimental reservoir simulation. SPE J. 2013, 18, 1081–1091. [Google Scholar] [CrossRef]
- Cao, T.; Zhang, T.; Zhang, Y.; Wang, L. Physical simulation experiment of gas and water distribution during the accumulation of a tight sandstone gas reservoir. J. Chengdu Univ. Technol. Sci. Technol. Ed. 2024, 51, 60–75. [Google Scholar] [CrossRef]
- Awoleke, O.O.; Zhu, D.; Hill, A.D. New propped-fracture-conductivity models for tight gas sands. SPE J. 2016, 21, 1508–1517. [Google Scholar] [CrossRef]
- An, G.; Sun, H.; Ye, X.; Li, A.; Guo, W.; Fu, S.; Liu, S.; Zhu, Y.; Hu, Z. Research on the influence of sand-mud interlayer properties on the expansion of SAGD steam chamber. SPE J. 2024, 29, 3825–3843. [Google Scholar] [CrossRef]
- Jiao, C.; Liu, H.; Liu, P.; Gong, H. Similarity criterion of the physical simulating experiment for the development performances of low-permeability tight gas reservoirs. Pet. Geol. Oilfield Dev. Daqing 2019, 38, 156–161. [Google Scholar]
- Li, L.; Liu, W.; Zhang, Y.; Yao, C. Optimization of the fracturing operation parameters in Well Block Jin-58 of Dongsheng Gas Field. Pet. Geol. Oilfield Dev. Daqing 2020, 39, 48–55. [Google Scholar] [CrossRef]
- Bakarji, J.; Callaham, J.; Brunton, S.L.; Kutz, J.N. Dimensionally consistent learning with Buckingham Pi. Nat. Comput. Sci. 2022, 2, 834–844. [Google Scholar] [CrossRef] [PubMed]
- Peng, D.; Robinson, D.B. A new two-constant equation of state. Ind. Eng. Chem. Fundam. 1976, 15, 59–64. [Google Scholar] [CrossRef]
- Heidaryan, E.; Moghadasi, J.; Rahimi, M. New correlations to predict natural gas viscosity and compressibility factor. J. Pet. Sci. Eng. 2010, 73, 67–72. [Google Scholar] [CrossRef]
- Zhang, W.; Mehrabian, A. Dimensionless solutions for the time-dependent and rate-dependent productivity index of wells in deformable reservoirs. SPE J. 2021, 26, 2814–2836. [Google Scholar] [CrossRef]
- Chen, D.; Wang, F.; Chen, H.; Wei, X.; Sun, S.; Zhu, S. Characterization of braided river reservoir architecture of the Upper Paleozoic He 8 member on Fugu Tianshengqiao outcrop, eastern Ordos Basin. Oil Gas Geol. 2019, 40, 335–345. [Google Scholar]
- Chen, A.; Chen, H.; Xiang, F.; Liu, W.; Hou, Z.; Shang, Y.; Ye, L.; Li, J. Sandstone characteristic and provenance analysis of the PermianShanxi Formation—Shangshihezi Formationinthe northeast of Ordos Basin China. J. Chengdu Univ. Technol. Sci. Technol. Ed. 2007, 34, 305–311. [Google Scholar]
- Xiao, D.; Lu, S.; Lu, Z.; Huang, W.; Gu, M. Combining nuclear magnetic resonance and rate-controlled porosimetry to probe the pore-throat structure of tight sandstone. Pet. Explor. Dev. 2016, 43, 961–970. [Google Scholar] [CrossRef]
- GB/T 21650.1; Pore Size Distribution and Porosity of Solid Materials by Mercury Porosimetry and Gas Adsorption. National Standardization Administration: Beijing, China, 2008.
- Tan, D.; Luo, L.; Tan, X.; Wang, J.; Gao, X.; Cao, T.; Zhou, H.; Zha, X. Diagenesis and reservoir formation effect of tight sandstone in lower Permian Shihezi formation, Dongsheng gasfield. Spec. Oil Gas Reserv. 2021, 28, 68–76. [Google Scholar] [CrossRef]
- Xu, W.; Li, L. Reservoir evaluation of the middle Permian lower Shihezi formation, Dongsheng gasfield, Ordos basin. Nat. Gas Explor. Dev. 2016, 39, 18–21,40. [Google Scholar]
- Song, X.; Gao, H.; Feng, C.; Yi, P.; Wang, C.; Li, T. Analysis of the influence of micro-pore structure on oil occurrence using nano-CT scanning and nuclear magnetic resonance technology: An example from Chang 8 tight sandstone reservoir, Jiyuan, Ordos Basin. Processes 2023, 11, 1127. [Google Scholar] [CrossRef]
- Feng, G.; Xie, H.; Meng, Q.; Wu, F.; Li, G. Advanced coal, petroleum, and natural gas exploration technology. Energies 2022, 15, 8976. [Google Scholar] [CrossRef]
- Wang, Y.; Long, Y.; Sun, Y.; Zhang, S.; Song, F.; Wang, X. Threshold pore pressure gradients in water-bearing tight sandstone gas reservoirs. Energies 2019, 12, 4578. [Google Scholar] [CrossRef]
- Liu, B.; Yang, Y.; Li, J.; Chi, Y.; Li, J.; Fu, X. Stress sensitivity of tight reservoirs and its effect on oil saturation: A case study of Lower Cretaceous tight clastic reservoirs in the Hailar Basin, Northeast China. J. Pet. Sci. Eng. 2020, 184, 106484. [Google Scholar] [CrossRef]
- Mo, F.; Du, Z.; Peng, X.; Tang, Y.; Sun, H. Pore-scale analysis of flow resistance in tight sandstones and its relationship with permeability jail. J. Nat. Gas Sci. Eng. 2017, 44, 314–327. [Google Scholar] [CrossRef]
- Zhang, J.; Gao, S.; Xiong, W.; Ye, L.; Liu, H.; Zhu, W.; Sun, X.; Li, X.; Zhu, W. An improved experimental procedure and mathematical model for determining gas-water relative permeability in tight sandstone gas reservoirs. Geoenergy Sci. Eng. 2023, 221, 211402. [Google Scholar] [CrossRef]
- Yu, Q.; Jia, Y.; Liu, P.; Hu, X.; Hao, S. Rate transient analysis methods for water-producing gas wells in tight reservoirs with mobile water. Energy Geosci. 2023, 5, 100251. [Google Scholar] [CrossRef]
- SY/T 5345; Test Method for Two Phase Relative Permeability in Rock. National Development and Reform Commission: Beijing, China, 2007.
- Li, Y.; Xiao, F.; Xu, W.; Wang, J. Performance evaluation on water-producing gas wells based on gas & water relative permeability curves: A case study of tight sandstone gas reservoirs in the Sulige gas field, Ordos Basin. Nat. Gas Ind. B 2016, 3, 52–58. [Google Scholar] [CrossRef]
- Zhao, Y.; Zhu, G.; Dong, Y.; Danesh, N.N.; Chen, Z.; Zhang, T. Comparison of low-field NMR and microfocus X-ray computed tomography in fractal characterization of pores in artificial cores. Fuel 2017, 210, 217–226. [Google Scholar] [CrossRef]
- Jalali, M.; Gischig, V.; Doetsch, J.; Näf, R.; Krietsch, H.; Klepikova, M.; Amann, F.; Giardini, D. Transmissivity changes and microseismicity induced by small-scale hydraulic fracturing tests in crystalline rock. Geophys. Res. Lett. 2018, 45, 2265–2273. [Google Scholar] [CrossRef]
- Li, H.; Wang, D.; Gao, J.; Zhang, M.; Wang, Y.; Zhao, L.; Yang, Z. Role of saturation on elastic dispersion and attenuation of tight rocks: An experimental study. J. Geophys. Res. Solid Earth 2020, 125, e2019JB018513. [Google Scholar] [CrossRef]
- Rao, Y.; Yang, Z.; Chang, L.; Zhang, Y.; Wu, Z.; Li, H. Influence of reservoir lithology on porous flow resistance of gas-bearing tight oil reservoirs and production forecast. J. Pet. Explor. Prod. Technol. 2022, 12, 409–419. [Google Scholar] [CrossRef]
- Ren, X.; Li, A.; Fu, S.; Tian, W. Influence of micro-pore structure in tight sandstone reservoir on the seepage and water-drive producing mechanism—A case study from Chang 6 reservoir in Huaqing area of Ordos basin. Energy Sci. Eng. 2019, 7, 741–753. [Google Scholar] [CrossRef]
- Lin, X.; Zeng, J.; Wang, J.; Huang, M. Natural Gas Reservoir Characteristics and Non-Darcy Flow in Low-Permeability Sandstone Reservoir of Sulige Gas Field, Ordos Basin. Energies 2020, 13, 1774. [Google Scholar] [CrossRef]
- Chao, Z.; Ma, G.; Hu, X.; Luo, G. Experimental research on stress-dependent permeability and porosity of compact sandstone with different moisture saturations. J. Nat. Gas Sci. Eng. 2020, 84, 103639. [Google Scholar] [CrossRef]
- Fatemi, S.M.; Sohrabi, M. Recovery mechanisms and relative permeability for gas/oil systems at near-miscible conditions: Effects of immobile water saturation, wettability, hysteresis, and permeability. Energy Fuels 2013, 27, 2376–2389. [Google Scholar] [CrossRef]
- Zhao, Z.; Zhou, X.; Chen, J. Pore-scale hydraulic properties of virtual sandstone microstructures: Spatial variations and voxel scale effects. Arch. Civ. Mech. Eng. 2022, 23, 22. [Google Scholar] [CrossRef]
- Cui, Y.; Ming, J.; Shi, X.; Yang, W.; Zhang, Z.; Zhang, C. A new method for calculating reservoir core-bound water saturation using the cast thin section. Processes 2023, 11, 1397. [Google Scholar] [CrossRef]
- Zhao, Y.; Huang, G.; Liang, Q.; Chen, Q. Study on microscopic characteristics and rock mechanical properties of tight sandstone after acidification–supercritical CO2 composite action: Case study from Xujiahe Formation, China. Appl. Sci. 2024, 14, 4108. [Google Scholar] [CrossRef]
- He, X.; Wang, C.; Chang, B.; Cao, Z.; Tang, H. A dynamic reserve evaluation method for an ultra-deep fractured tight sandstone gas reservoir. Energies 2024, 17, 2648. [Google Scholar] [CrossRef]


Disclaimer/Publisher’s Note: The statements, opinions and data contained in all publications are solely those of the individual author(s) and contributor(s) and not of MDPI and/or the editor(s). MDPI and/or the editor(s) disclaim responsibility for any injury to people or property resulting from any ideas, methods, instructions or products referred to in the content. |
© 2025 by the authors. Licensee MDPI, Basel, Switzerland. This article is an open access article distributed under the terms and conditions of the Creative Commons Attribution (CC BY) license (https://creativecommons.org/licenses/by/4.0/).