Abstract
This study investigates the effects of different sealing materials, steel lining and Fiber-Reinforced Polymer (FRP), on the thermodynamic properties of hydrogen storage in lining rock caverns (LRCs). A thermodynamic coupling equation for hydrogen storage in LRCs was developed, and its validity was confirmed by comparison with simulations and data from the Huntorf power station. The leakage rate, temperature changes, and stress distribution of steel and FRP sealing layers with varying thicknesses were analyzed over a 30-day period. The results show that the leakage rate of the FRP layer decreases significantly with thickness, with a peak leakage of 1.3 g/s for the 10 mm layer, stabilizing at around 0.1 g/s for the 100 mm layer. Temperature fluctuations within the cavern are periodic, with more pronounced changes in the FRP layer as its thickness increases. Steel lining experiences minimal temperature changes. Additionally, increasing the FRP thickness results in larger fluctuations in the principal stress of both the sealing and lining layers, impacting the surrounding rock mass. The FRP lining experiences higher tensile stress, while the steel lining shows smaller changes. A thicker FRP layer also increases normal and shear stresses in the surrounding rock, potentially affecting cavern stability. These findings emphasize the importance of selecting appropriate sealing materials and thicknesses to improve the efficiency and stability of hydrogen storage systems.
1. Introduction
How to ensure the long-term stable storage and extraction of hydrogen gas through underground caverns without sacrificing efficiency and safety has become one of the core issues in current hydrogen storage solutions [1]. Hydrogen, as a clean and versatile energy carrier with high gravimetric energy density but low volumetric energy density, is considered a promising but challenging solution for future energy systems [2]. Compared with traditional fossil fuels, hydrogen has high gravimetric energy density and wide applicability, though its low volumetric energy density poses challenges for storage and transport [3], but it also can produce only water as a byproduct during use [4], making it an ideal choice for multiple fields such as transportation, industrial production, and power generation [5,6]. Hydrogen plays an important role in addressing the intermittency and seasonal fluctuations in renewable energy [7]. The production of renewable energy sources such as wind and solar has significant spatiotemporal imbalances, and their power generation is strongly influenced by factors such as weather and seasons [8,9]. Hydrogen, as an energy storage medium, can convert excess renewable electricity into hydrogen storage, store it when power demand is low, and release it when demand increases [10]. This efficient energy conversion and storage capability makes large-scale hydrogen storage technology a link in achieving global energy transformation [11]. However, in order to achieve large-scale commercial application of hydrogen, especially in the widespread use of energy storage, ensuring the efficiency, safety, and economy of hydrogen during storage remains one of the core issues that urgently need to be addressed.
Hydrogen storage technology faces many challenges, especially in ensuring its long-term stable storage and extraction without sacrificing efficiency and safety [12]. The storage methods of hydrogen include high-pressure compression gas storage, liquefaction storage, and solid-state storage [13]. Among them, underground compressed hydrogen gas energy storage (CHGS) has gradually become a research and application focus due to its significant advantages [14]. CHGS technology utilizes geological structures such as underground salt domes, porous rocks, or depleted oil and gas fields as storage media, which can safely and stably store large amounts of hydrogen gas under high pressure [15]. This energy storage method not only has lower operating costs but also achieves long-term stable storage, greatly meeting the seasonal fluctuations in renewable energy demand and ensuring the reliability of energy supply. Compared to other hydrogen storage methods, underground hydrogen storage has significant advantages such as being unaffected by weather, environmental factors, and being easy to construct on a large scale. However, despite the theoretical advantages of CHGS technology, its long-term stability and safety still face many challenges in practical applications, especially in terms of sealing, temperature fluctuations, stress distribution management, and material aging [16,17,18].
In CHGS systems, the injection, storage, and extraction process of hydrogen gas is usually periodic, and this dynamic process triggers complex thermodynamic and mechanical behaviors [10]. Firstly, the periodic injection and extraction of hydrogen gas cause significant fluctuations in pressure and temperature inside the storage chamber, which not only affect the storage efficiency of hydrogen gas but may also have adverse effects on the structural integrity of the sealing layer and surrounding rock [19]. Especially during the injection and extraction process, due to the compression of hydrogen gas, the temperature and pressure inside the hydrogen storage chamber undergo drastic changes, which may even cause local thermal and mechanical stresses [20], thereby affecting the stability of the hydrogen storage system. Secondly, as a key component to ensure that hydrogen gas does not leak, regulate temperature fluctuations, and control stress transmission, the performance of the sealing layer directly affects the safety and stability of the entire hydrogen storage system. The sealing layer not only needs to have good airtightness but also needs to maintain long-term stability under extreme temperature and pressure changes [21]. Therefore, how to choose suitable sealing materials and optimize their thickness to ensure the long-term stability and safety of hydrogen storage systems has become an important topic in current research.
At present, steel lining and Fiber-Reinforced Polymer (FRP) are two widely used sealing materials [12]. Steel lining has been widely used in hydrogen storage chambers due to its high stiffness, excellent thermal conductivity, and strong sealing ability [22]. The high thermal conductivity of the steel lining enables it to effectively alleviate temperature fluctuations in the hydrogen storage caverns, ensuring a relatively uniform temperature distribution and reducing the impact of thermal stress on the sealing layer and surrounding rock. However, the high cost and significant quality of steel lining limit its economy and flexibility in large-scale hydrogen storage applications, especially in projects that require large-scale hydrogen storage. In contrast, FRP, as a polymer-based material, has received increasing attention due to its low cost, light weight, and efficient sealing performance [23]. However, the mechanical properties and durability of FRP materials still face challenges in long-term use, especially under cyclic loading and extreme temperature conditions, and their performance is not fully understood [24]. In order to ensure the safety of hydrogen storage systems, it is necessary to thoroughly explore the long-term performance of sealing materials under dynamic cycling conditions, especially the interaction between the sealing layer, lining layer, and surrounding rock.
The thickness of the sealing layer also plays a crucial role in its performance [25]. Usually, a thicker sealing layer can provide better sealing and insulation performance [26], but an increase in its quality and stiffness may cause higher stress on the surrounding rock, leading to rock fracture or deformation and affecting the stability of the hydrogen storage chamber. Therefore, finding the optimal balance between ensuring good sealing performance, effective insulation, and rock stability has become an important challenge in the design of hydrogen storage systems. Although existing research has extensively explored the performance of sealing materials under their initial properties [9] or short-term behavior [27], there is still a lack of systematic and in-depth research on the long-term performance of sealing materials under dynamic cycling conditions, especially in terms of how temperature, pressure, and stress changes affect the stability of hydrogen storage systems. The periodic injection and extraction of hydrogen not only cause fluctuations in temperature and pressure [28] but also redistribute stress between the sealing layer, lining layer, and surrounding rock [29]. These dynamic changes may gradually accumulate over time, ultimately affecting the overall performance and safety of the hydrogen storage system [30]. Therefore, a comprehensive analysis of the thermodynamic behavior of sealing materials under cyclic loading conditions is crucial for optimizing the design of hydrogen storage systems and improving their long-term stability.
This study aims to fill the gap in existing research by systematically analyzing the effects of different sealing materials (steel lining and FRP) and their thicknesses on the long-term performance of hydrogen storage caverns. By establishing a multi-physics field model that combines hydrogen dynamics, heat conduction, and solid mechanics, we simulated the hydrogen permeation behavior of sealing layers with different thicknesses under cyclic hydrogen injection conditions, revealing the quantitative relationship between the leakage rate and material properties and thickness. Further analysis was conducted on the effects of different sealing materials on temperature and stress distribution during long-term operation in storage caverns. By gaining a deeper understanding of the interactions between sealing materials, temperature changes, and mechanical stress, this study contributes insights that may support the development of more technically and economically viable hydrogen storage strategies.
The structure of this study is as follows: In Section 2, the conservation equation in storage and the thermodynamic equation of hydrogen are introduced. Then, the leakage equation of the sealing layer is introduced to control the loss of hydrogen gas. Finally, the thermodynamic coupling model is established by coupling solid deformation. In Section 3, we compare the correctness of the conservation equation and thermodynamic equation with the results of Chen and Wang [20], verify the correctness of the model by comparing it with test data from the Huntorf power station [31], and finally compare the temperature changes in hydrogen gas storage with Hu et al. [12] to verify the correctness of the hydrogen parameters in this paper. In Section 4, a systematic analysis is conducted on the temperature and stress effects of 10 mm steel lining and FRP with different thicknesses on hydrogen storage chambers. Some reliable conclusions are presented in Section 5.
2. Thermodynamic Model of Injection Production Cycle
Kushnir et al. [31] developed both numerical and approximate analytical solutions to model the variations in temperature and pressure within a gas cavity. Their approach is based on the mass conservation equation, the energy conservation equation, and the gas state equation. While the model does not account for the spatial variation in temperature and pressure within the chamber, the final results are sufficiently accurate for practical engineering applications. The mass conservation equation primarily describes how gas density changes within the chamber during the processes of continuous inflation and deflation. On the other hand, the energy conservation equation considers the temperature variations inside the chamber resulting from interactions between internal and external factors. According to Kushnir et al. [31] and Wu et al. [32], the equations for mass conservation and energy conservation are as follows:
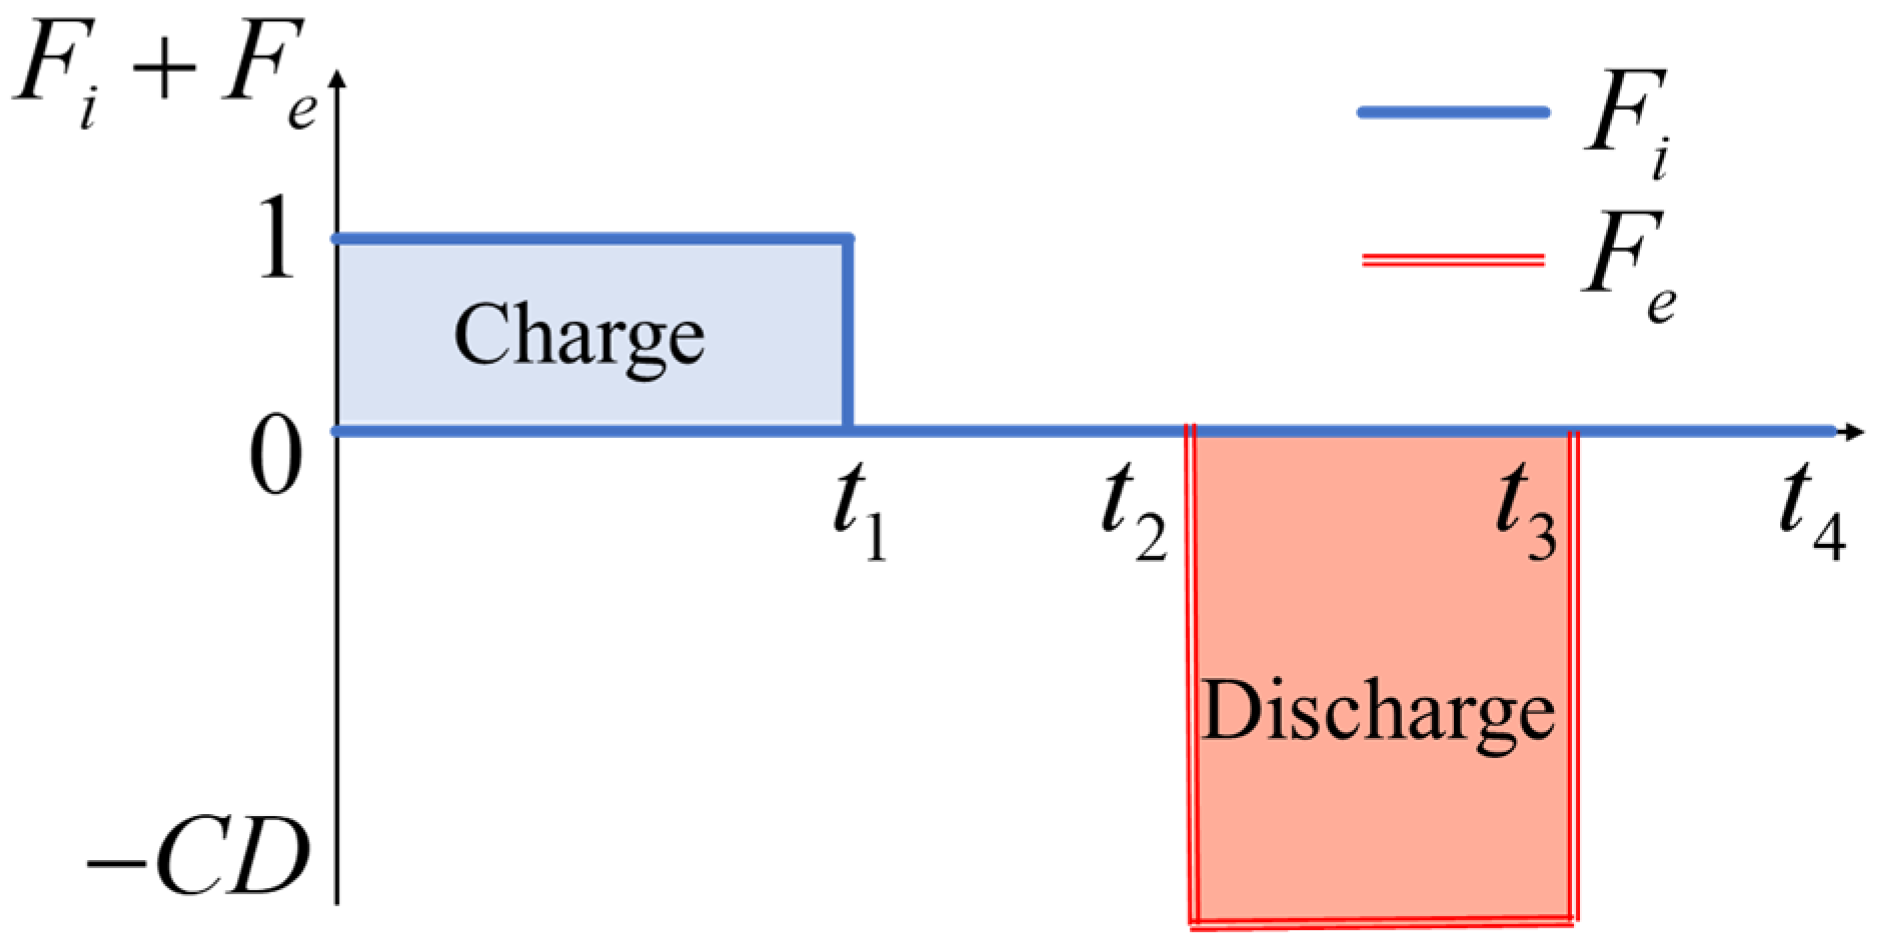
In this context, ρ represents the gas density inside the chamber, V is the chamber’s volume, and (Fi + Fe) mie denotes the total mass flow rate, where mie is the individual gas mass flow rate. cv is the volumetric specific heat coefficient, Tc is the chamber temperature, h denotes the enthalpy, Z represents the gas compression coefficient, Rc is a constant value, u is the specific heat energy, and Q represents the rate of heat transfer. The mass flow rate of gas and hydrogen are 100 kg/s and 20 kg/s, respectively [12]. Figure 1 illustrates the cyclic behavior of a compressed gas energy storage (CAES) system during periodic operation. CD is 2 in this paper, which indicates the mass flow rate ratio between deflation and inflation, while ml stands for the gas leakage rate from the surrounding rock of the chamber. t1, t2, t3, and t4 are 8 h, 12 h, 16 h, and 24 h, respectively.
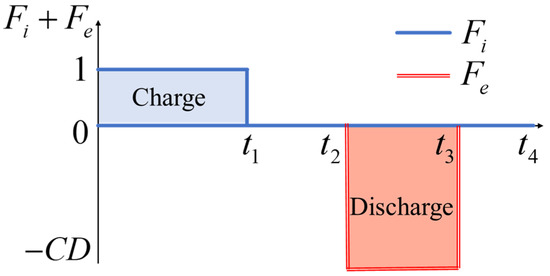
Figure 1.
Function image of Fi and Fe within one cycle.
The gas state equation and the thermodynamic properties of the gas are as follows [32], where the simplification of Equation (2) refers to the conclusion given by Kushnir et al. [31], and this simplification method has little effect on the results:
where Ti is the gas temperature during the gas charge, and ZT is the derivative of Z over T. Z0, cv0, cp0, and ZT0 are their respective initial states (ρ0, T0).
At the chamber boundary, both convection and heat conduction take place throughout the entire process. Consequently, the total heat exchange can be determined by integrating the relevant heat transfer equations:
where hc denotes the heat transfer coefficient, and Ac represents the surface area of the chamber. Tt is the surface temperature of the surrounding rock, while Tc refers to the real-time temperature inside the chamber.
In this study, the compressed gas storage cavern uses steel lining and polymer materials (butyl rubber) as sealing layers to prevent gas leakage. It is assumed that the steel lining has good sealing performance and no gas leakage occurs, while the polymer material layer may experience leakage. This means that the high-pressure gas inside the chamber will penetrate the sealing layer and enter the surrounding rock. Since the permeability coefficient of the polymer material is much lower than that of the surrounding rock, only a small amount of gas is expected to diffuse through the sealing layer into the surrounding rock. Therefore, the potential leakage has little impact on the pore fluid pressure in the surrounding rock. The leakage effect is neglected, and the surrounding rock pressure is assumed to be at standard atmospheric pressure. Throughout the process, the polymer sealing layer plays a major sealing role, so the leakage in the chamber is primarily the result of gas diffusion into the polymer material. The leakage rate is solved using the gas permeation equation for the polymer material, which is similar to Darcy’s law [33].
where ρs is the gas density at 273.15 K and one atmospheric pressure, λ and hm represent the permeability coefficient and thickness of the polymer sealing material (butyl rubber) (in units of (m3(STP)·m)/(m2·s·Pa)), and Ps is the gas pressure outside the polymer sealing layer.
The strain of non-isothermal surrounding rock mass εij and the force balance equations are follows [27,34], and the Einstein summation convention is applied in Equation (5):
where G is the shear modulus and G = E/2(1 + v), where E and v are the Young’s modulus of the rock and Poisson’s ratio, respectively. αT is the volume expansion coefficient, and ΔT = T − T0 is the relative temperature compared to the initial temperature T0. ui is the displacement in the i direction, and fi is the unit volume force in the i direction.
In summary, the thermodynamic coupling in this study is realized by integrating the heat transfer processes from gas injection and extraction cycles with the mechanical deformation of the surrounding rock. The energy equation, which governs temperature evolution, interacts with the solid mechanics equation through the thermal expansion term (αTΔT). This coupling mechanism enables the model to capture stress redistributions induced by temperature changes, thus reflecting the realistic thermo-mechanical behavior of the hydrogen storage system.
3. Establishment and Verification of Hydrogen Storage Model
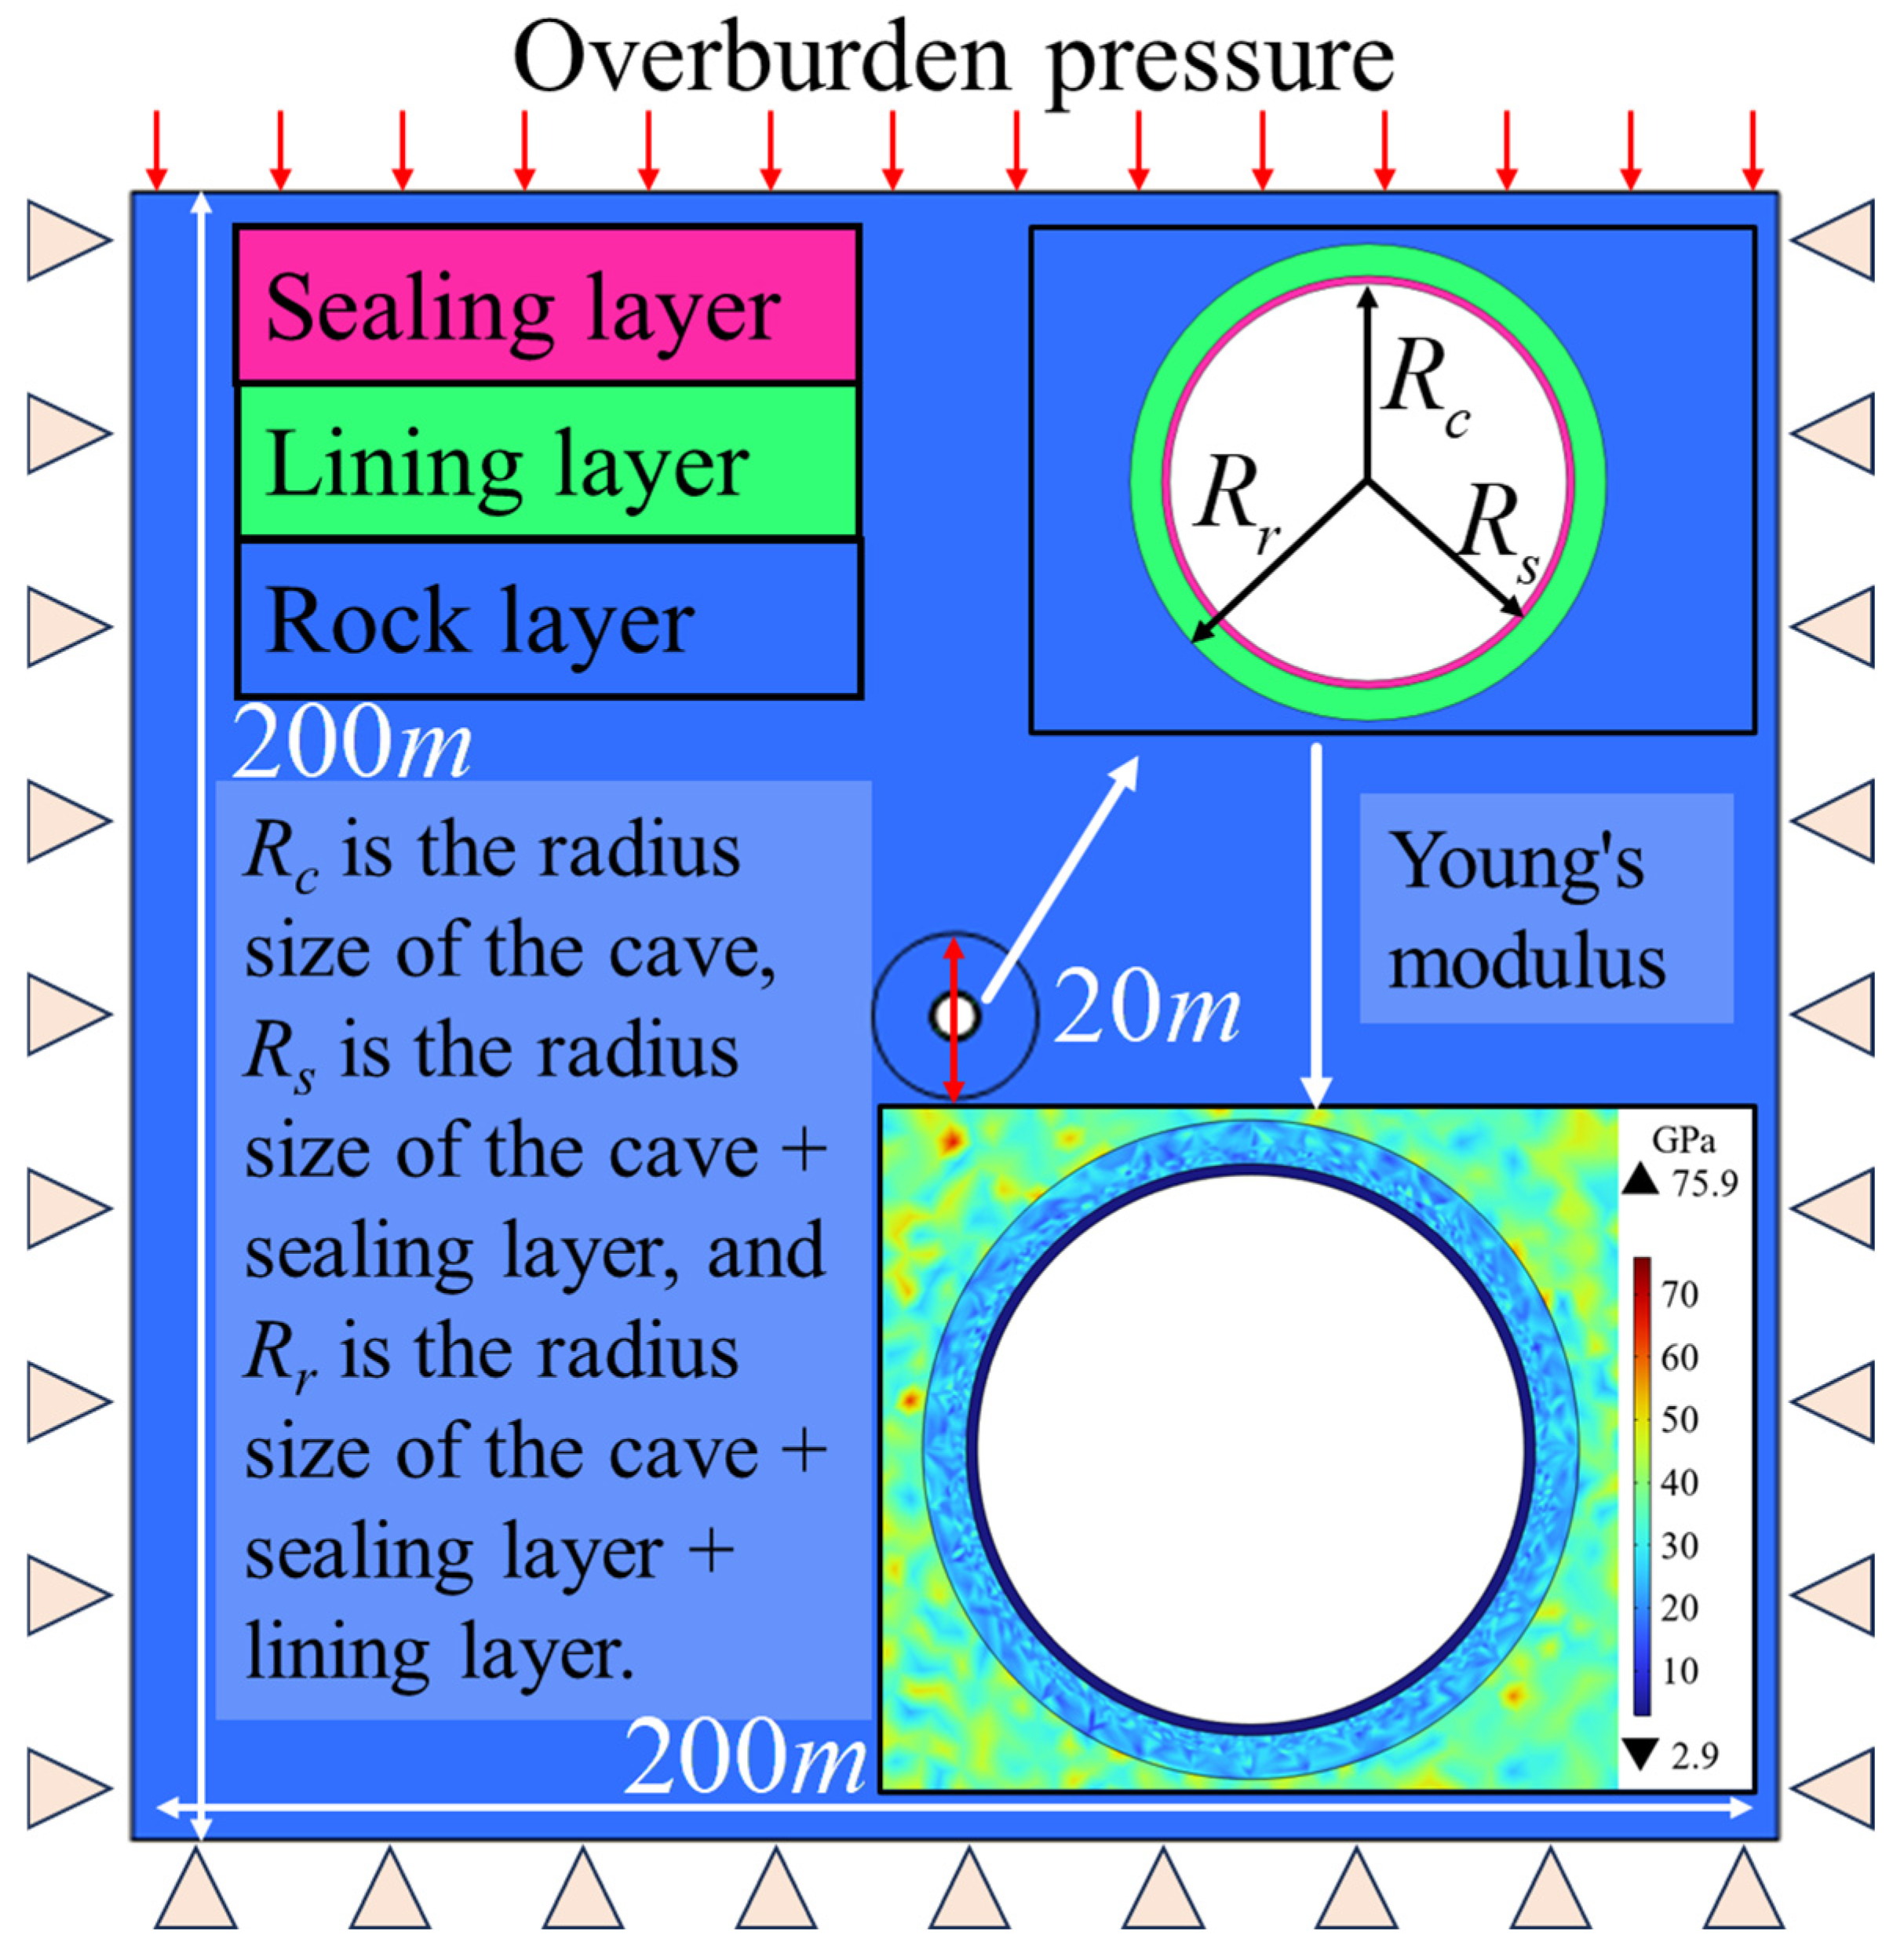
This paper mainly analyzes the gas storage effect of different types of sealing layers. For the compressed gas energy storage model, COMSOL required iterative calculation and analysis. The numerical model was constructed using a structured grid primarily composed of triangular elements. Mesh refinement was applied near the cavern and boundary layers to accurately capture temperature and stress gradients. A time-dependent solver was employed with a relative tolerance of 1 × 10⁻⁴. The simulation used a segregated solver approach, solving the thermal and mechanical fields sequentially within each time step. Convergence was evaluated based on the residuals of the temperature and displacement fields. Before analysis, it is generally necessary to validate the model and theory. The model analyzed in this paper is shown in Figure 2. Figure 2 shows the thickness distribution of the sealing layer, lining layer, and surrounding rock layer, respectively. According to the research results of Sun et al. [9], the influence range of a three-layer tunnel generally does not exceed 20 m. Therefore, in order to save computational costs, we conducted additional grid refinement for the area around the tunnel within 20 m. The lower right corner of Figure 2 shows the distribution of Young’s modulus when the sealing layer is made of polymer material.

Figure 2.
Size and elastic modulus distribution diagram of energy storage room.
In a circular energy storage chamber, the innermost layer is the sealing layer, which serves primarily to prevent gas leakage and stress transmission. The second layer consists of concrete, poured over the excavation or backfilling, providing high strength and direct contact with the surrounding rock. The third layer is the surrounding rock itself. The elastic modulus of rocks and concrete exhibits strong non-uniformity [35,36], which can generally be described using Weibull distribution [37]. Additionally, Chen et al. [20] demonstrated the feasibility of utilizing compressed gas energy storage in coal mine surrounding rock based on the application of the Weibull function. The elastic modulus E follows a three-parameter Weibull distribution, and its probability density function and distribution function are expressed as follows:
Among them, E represents the average elastic modulus of the solid domain around the rock cavern, including the concrete lining layer and rock layer. βw = 2.41 is the shape parameter, αw = 1.073 is the scale parameter, and μw = 0.296 is the position parameter.
This model considers the overall mechanical deformation and non-isothermal heat transfer of the model during the cyclic inflation and deflation process. The parameters used in the validation process are shown in Table 1 and Table 2.

Table 1.
The parameters of gas used in numerical simulation models from Hu et al. [12].
Table 2.
The parameters of the layer used in the numerical simulation models.
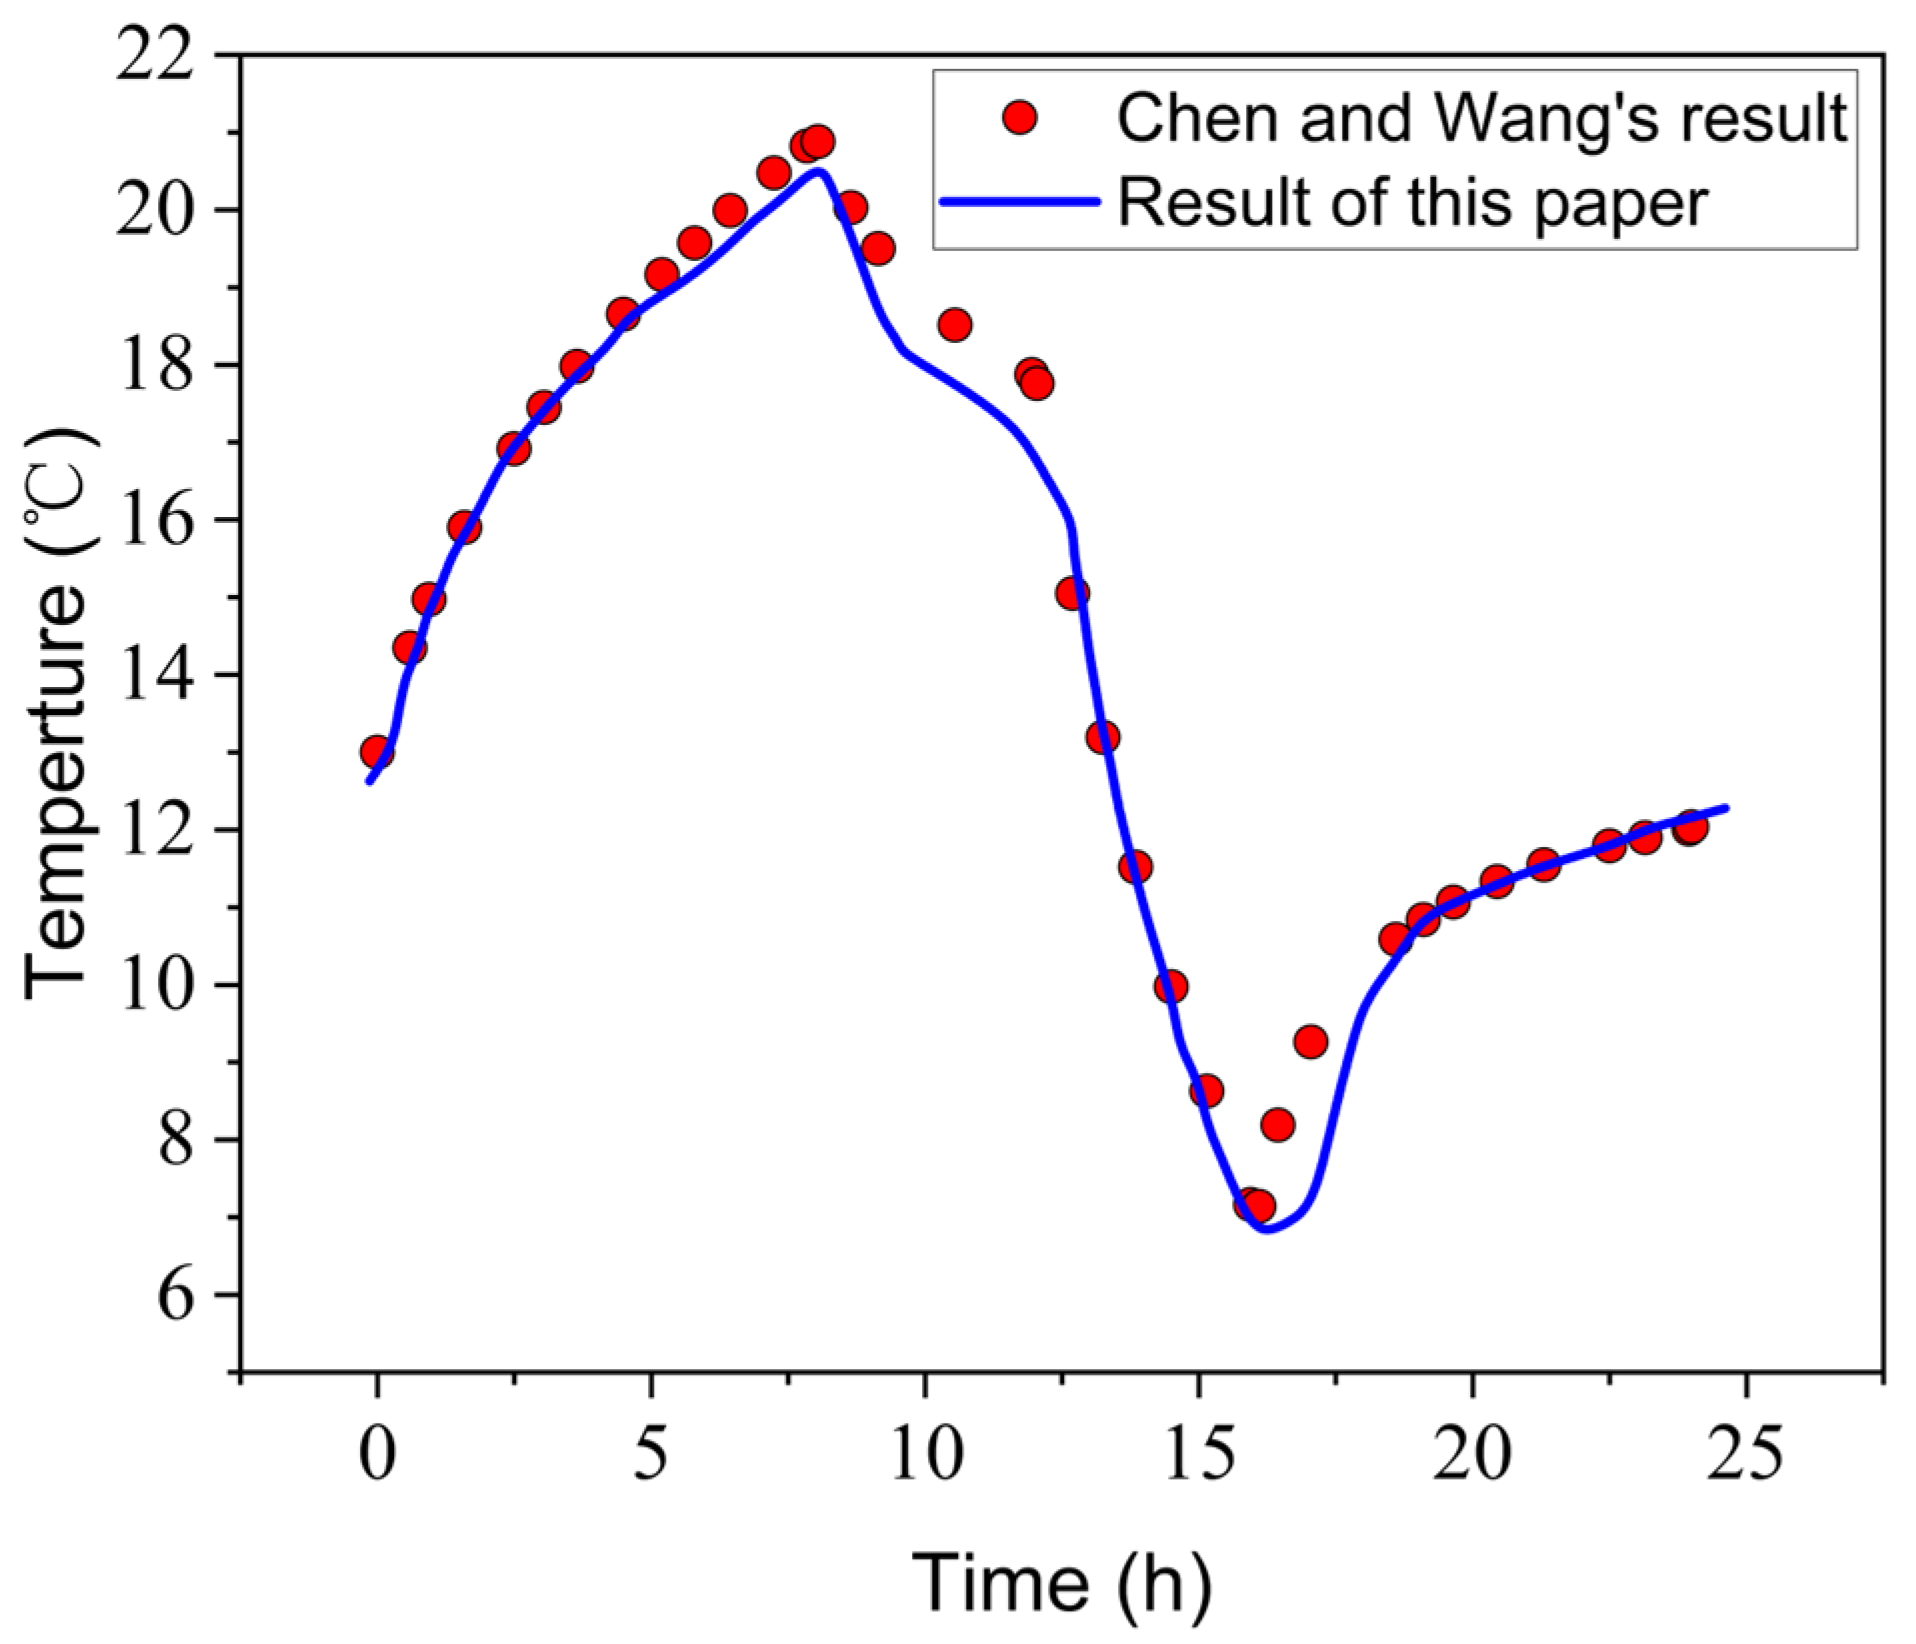
The effectiveness of the cave gas storage model proposed in this paper was verified by comparing the simulation results with those of Chen and Wang [20]. Chen and Wang [20] established a thermal fluid solid coupling model for gas storage in caverns and also used the equation theory proposed in this paper for the process of cyclic gas injection and release. The gas pressure and temperature changes were solved using differential equations, and then the solved pressure and temperature were applied as external loads on the inner wall of the cavern. During the inflation process, the mass flow rate of air is 100 kg/s, while during the deflation process, the mass flow rate of air is 200 kg/s. After inflation and deflation, the interior of the chamber will be pressurized for a period of time. The thermodynamic parameters of the air and the basic parameters of the chamber are shown in Table 1 and Table 2. Figure 3 shows a comparison between the simulation results of this paper and those of Chen and Wang [20]. According to the curve in the figure, it can be seen that the two sets of data are in good agreement and the trend is consistent. The temperature curve shows a trend of “up–down–down–up”, and at the final moment, the temperature is basically the initial temperature. The deviation between our model results and Chen and Wang’s results is mainly due to the consideration of the leakage process of the sealing layer in this paper, resulting in lower calculation results. However, overall, our results still have good consistency with Chen and Wang [20].
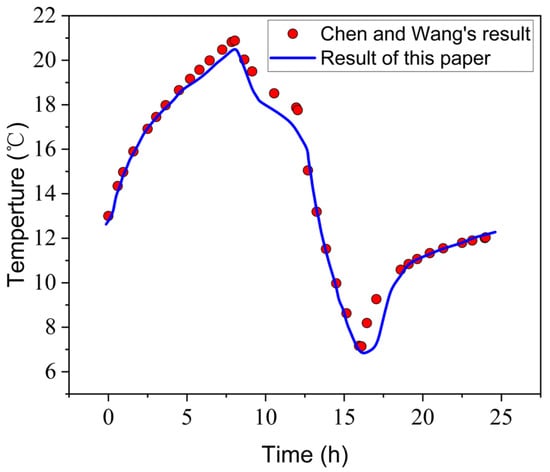
Figure 3.
Temperature result verification comparison of Chen and Wang [20].
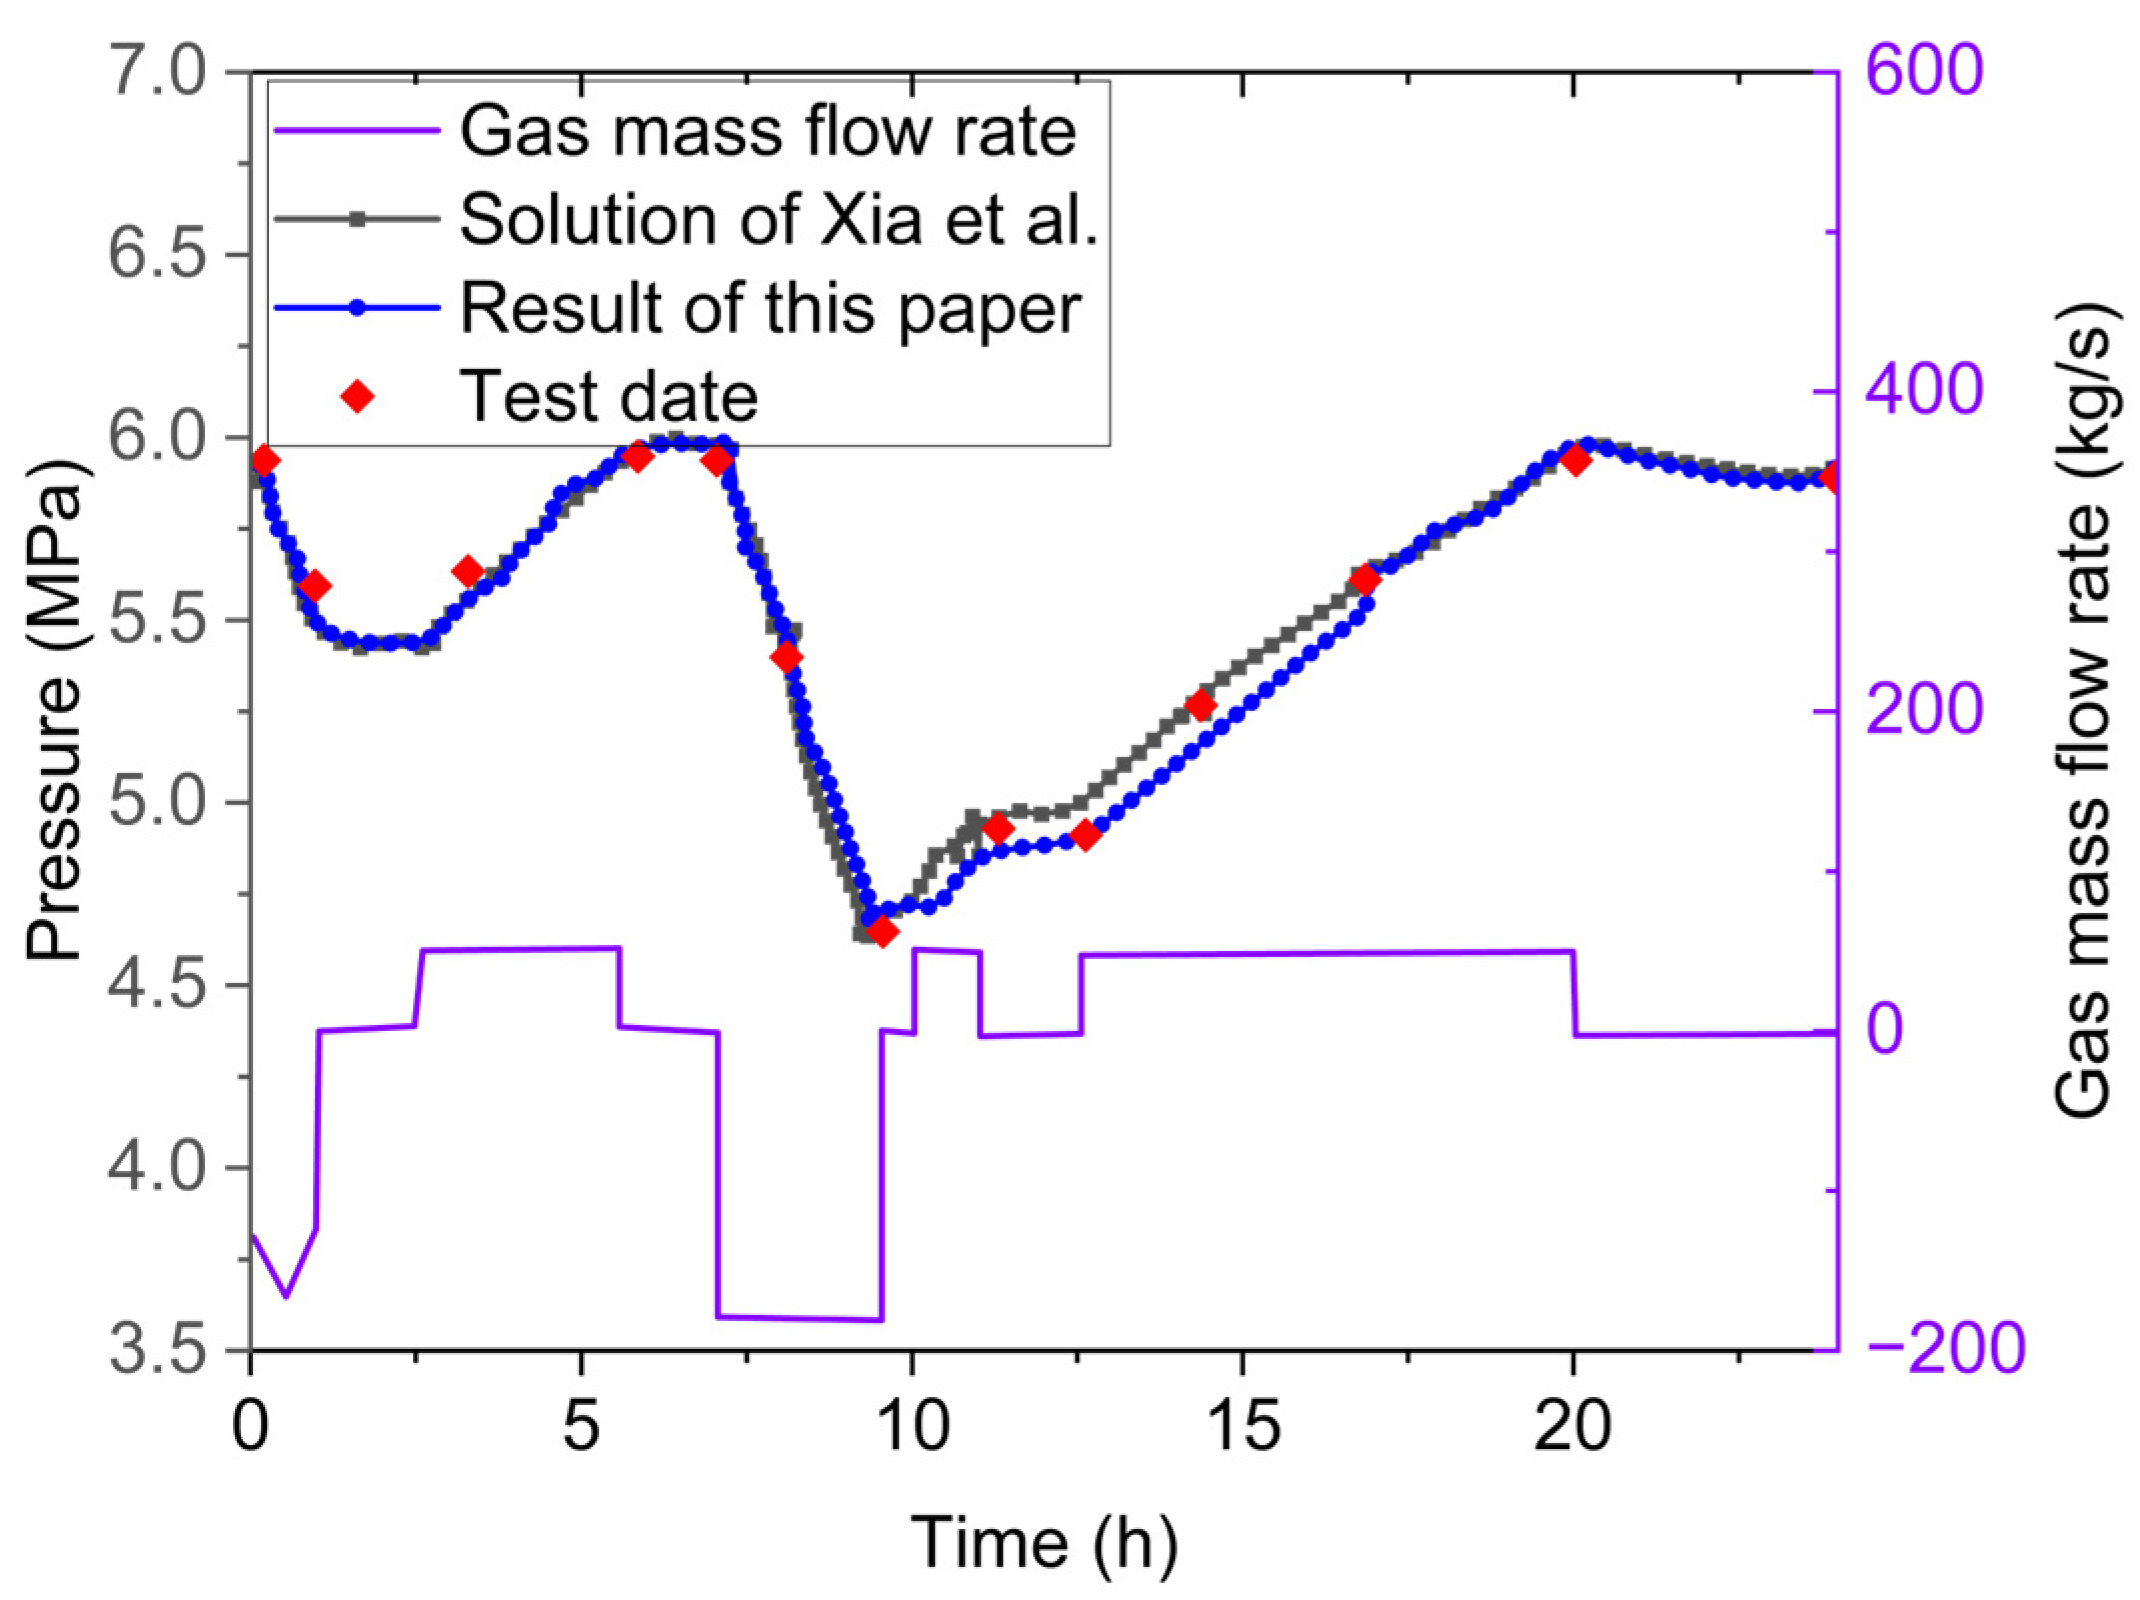
To validate the reliability of the proposed model for cyclic injection and production operations, we simulated the operational process of the Huntorf power plant, the world’s first compressed air energy storage (CAES) facility, located in Huntorf, Germany [38]. Figure 4 show a comparison of the pressure obtained from the theoretical analytical solutions, test data, and our current simulation results. The analytical solutions for air pressure are based on the work of Xia et al. [39], while the test data (red dots) for the Huntorf plant are provided by Kushnir et al. [31]. It is evident that the air pressure predicted by our model aligns closely with the test data, demonstrating a consistent trend. This suggests that our proposed model is effective in describing the evolution of the thermodynamic characteristics of gases during the charging and discharging processes in large caverns.
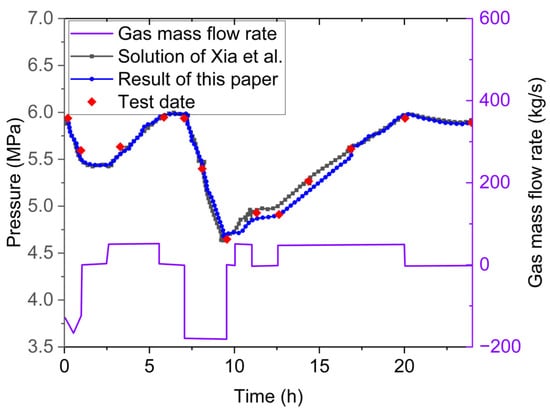
Figure 4.
Pressure result verification comparison with the Huntorf plant [39].
By comparing data from two projects related to air compression energy storage, the reliability of the theory and model presented in this paper was confirmed. However, up to now, all validations were based on the thermodynamic parameters of air, and this paper still needs to compare the correctness of the thermodynamic parameters of hydrogen. Li et al. [40] conducted a series of hydrogen filling experiments to investigate the evolution of hydrogen temperature inside storage tanks during rapid filling processes. In their experiment, the storage tank was a high-pressure hydrogen cylinder with a length of 1.748 m and an inner diameter of 0.167 m. The lining thickness and wall thickness of the storage tank were 0.005 m and 0.015 m, respectively. The heat transfer coefficient between hydrogen and the tank wall was 8 W/(m2·K), and the initial temperature of hydrogen was 20 °C. The hydrogen filling rate was 14 g/s. Hu et al. [12] verified the consistency between theory and simulation, and we also simulated the injection of hydrogen using the above parameters. The simulation results are shown in Figure 5, and it can be observed that the simulation results in this paper are very consistent with those of Hu et al., and both experiments and simulations show the same trend.
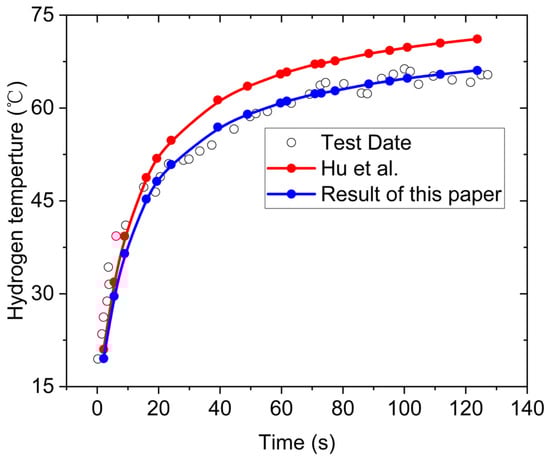
Figure 5.
Hydrogen temperature result verification comparison [12].
4. Mechanical Analysis of Leakage Caused by Different Sealing Layers
In this section, we selected two types of sealing layers, with one being steel lining, assuming its excellent sealing performance and no gas leakage. Another option is to use FRP, with a permeability coefficient of 5.7 × 10⁻¹⁷ m2/s/Pa. We analyzed FRP layers of 10, 20, 50, and 100 mm separately, and for better comparison, we also compared a 10 mm steel lining. The reason for choosing a thickness of 10 mm is based on the experimental results of Qin et al. [41]. Here, we assume that hydrogen does not undergo a chemical reaction with the steel lining, and the role of the steel lining is only for sealing and support. We conducted a 30-day cyclic injection of hydrogen gas and recorded the leakage of hydrogen gas in real time during the injection process, as shown in Figure 6. From Figure 6, we can observe that the injected gas changes were consistent with the assumed cycle in this paper, which was one cycle per day, inflating for 8 h, storing for 4 h, then deflating for 4 h, and storing again for 8 h. It can be observed that the injected gas exhibited periodic changes, with a peak value of approximately 1.68 × 10⁵ kg. The leakage of FRP was consistent with the time of the cyclic injection, and it also exhibited a certain periodicity, that is, the leakage was faster when the chamber pressure was high and slower when the chamber pressure was low. This is consistent with common sense. For 10 mm FRP, the leakage rate was the highest, with a peak value of 1.3 g/s. As the thickness increased, the leakage rate began to decrease. At 100 mm FRP, the leakage rate was the lowest, basically maintaining at 0.1 g/s. The above analysis results are consistent with the theoretical law of Equation (4).
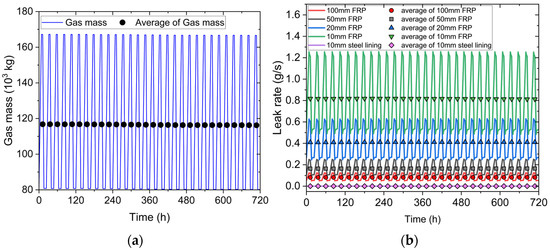
Figure 6.
Inflation of caves and leakage of different sealing layers within 30 days. (a) Changes in gas quality. (b) Changes in gas leakage.
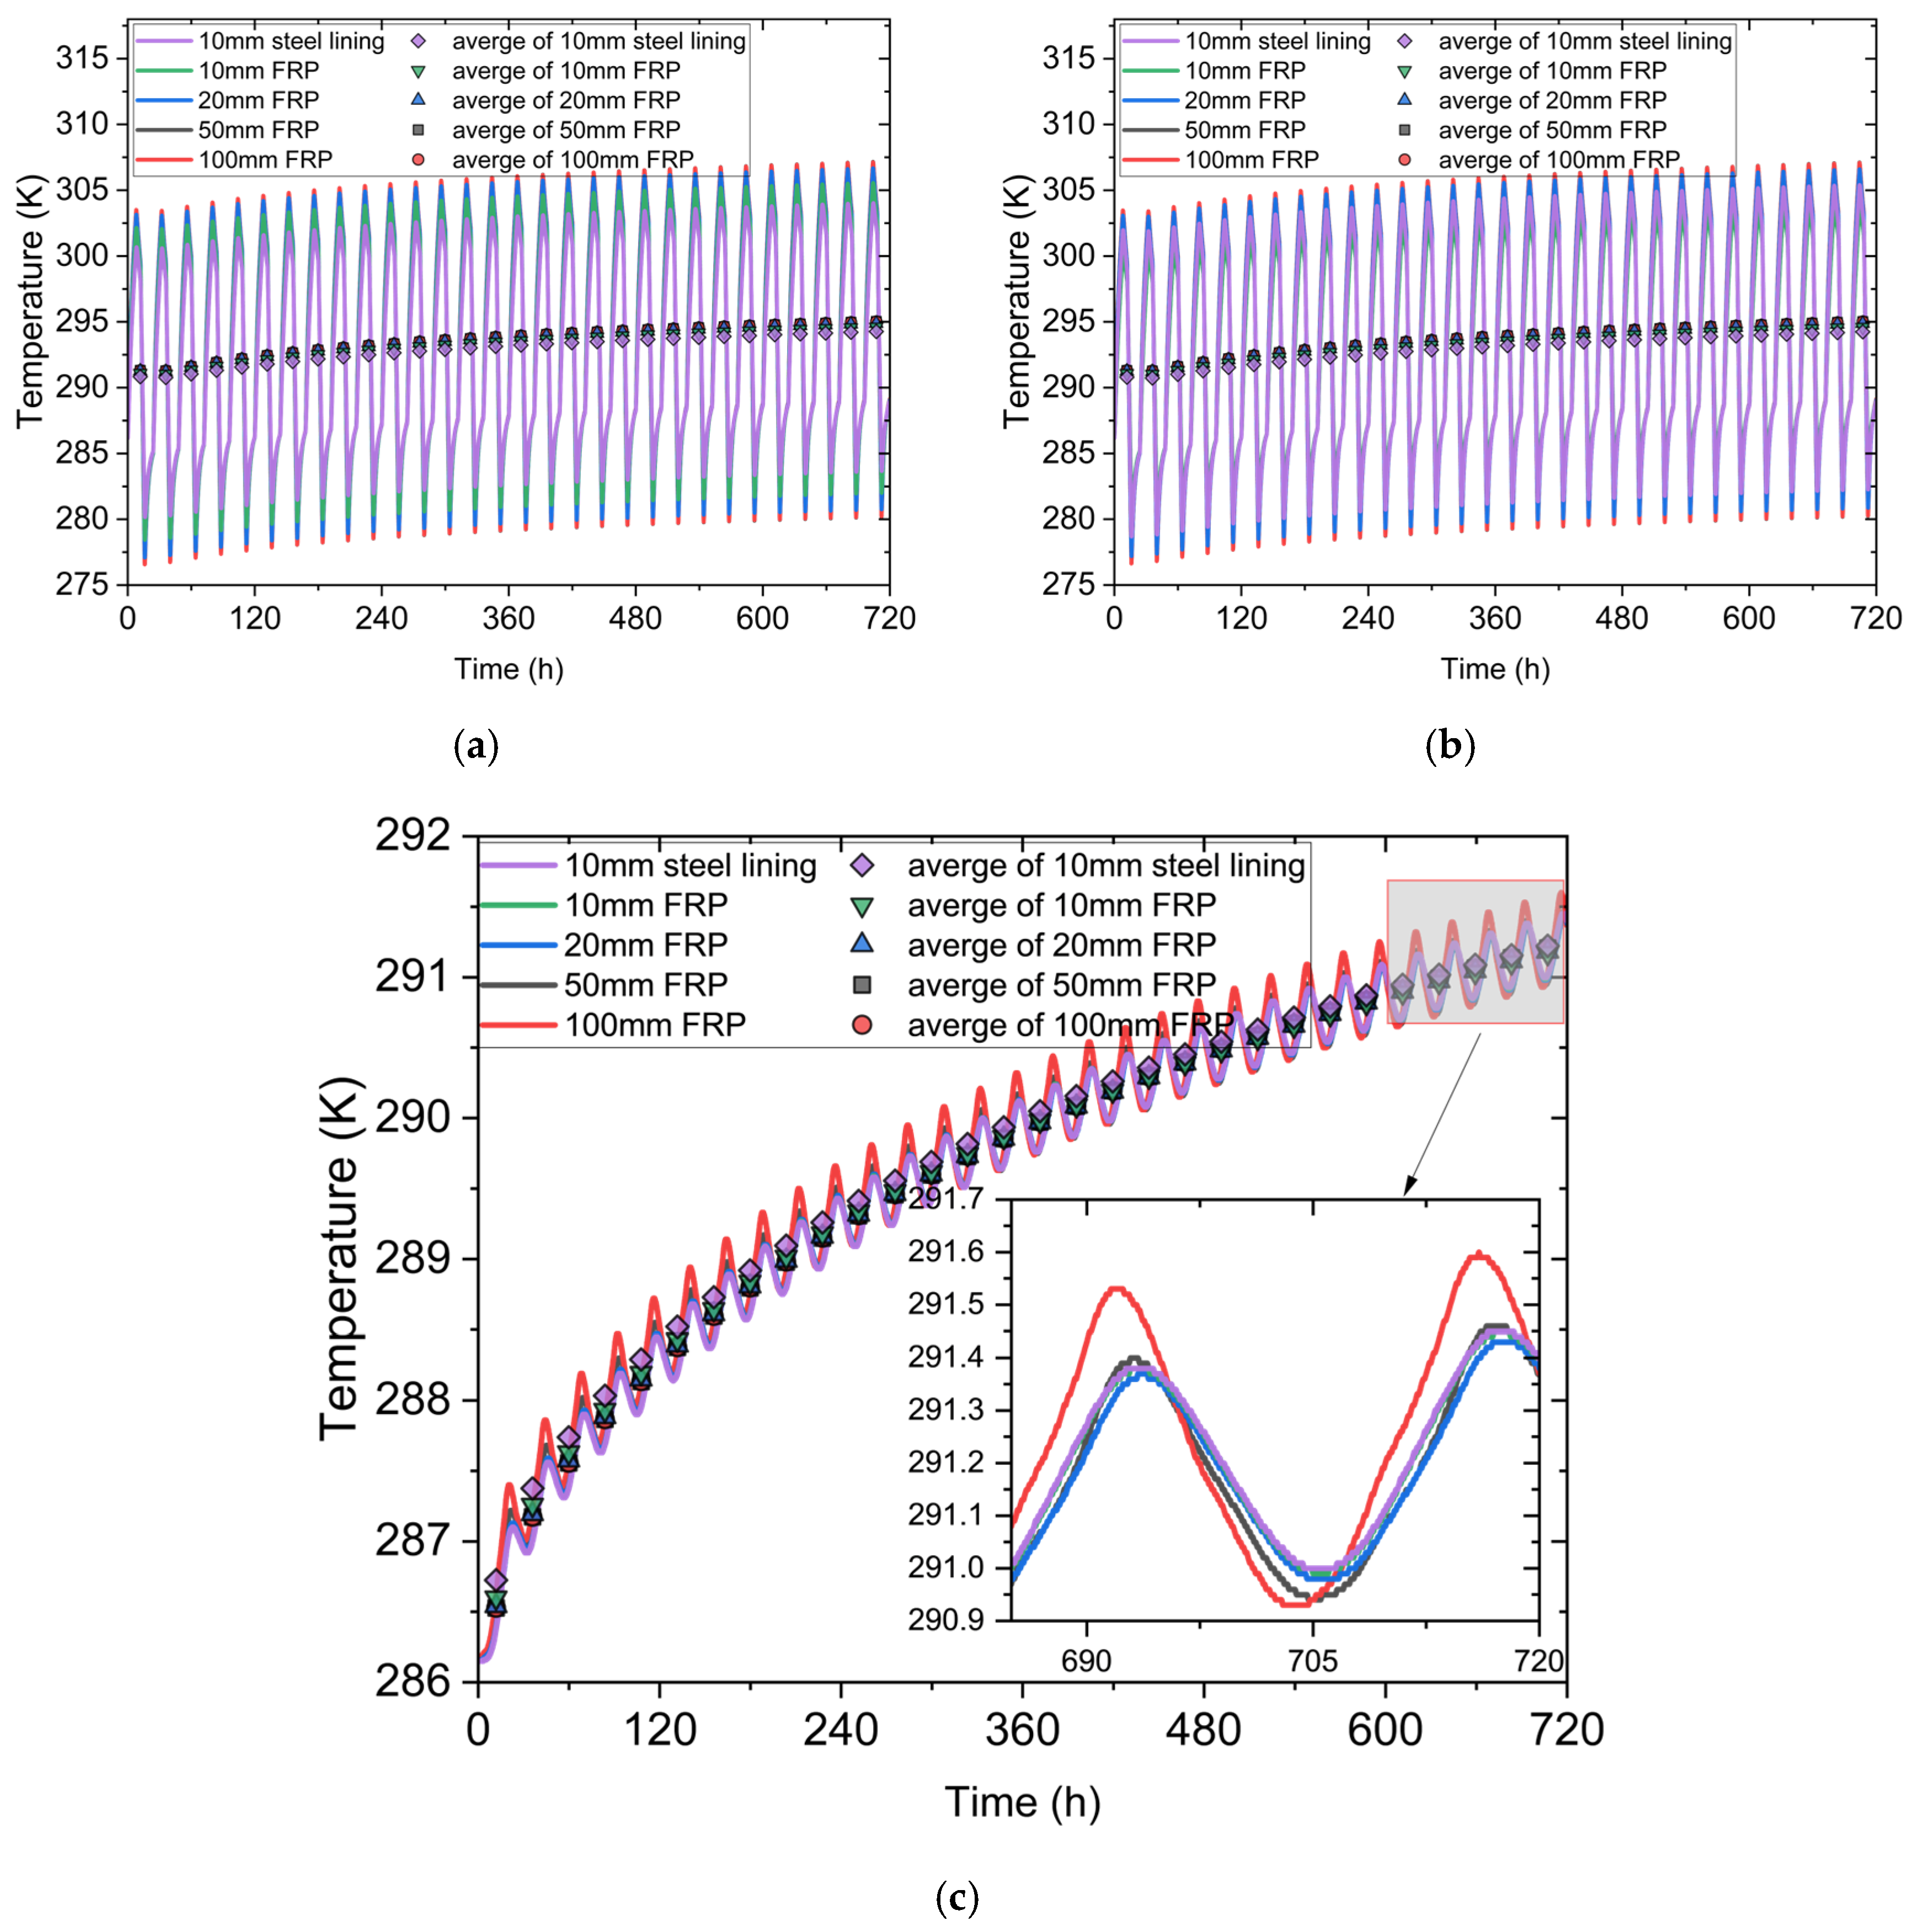
For the compressed hydrogen energy storage chamber, we selected three key locations to analyze its temperature and stress changes. These three key positions are the inner boundary of the sealing layer, the inner edge of the lining layer, and the inner surface of the surrounding rock layer. To avoid heterogeneity in the selected locations, we averaged each inner boundary, and Figure 7 shows the temperature changes at the key cave locations. Through observation, it can be found that the temperature in the sealing layer, lining layer, and surrounding rock layer exhibited a periodic variation, and the peak temperature also increased continuously over time. To realistically represent the thermal interaction with the surrounding geological environment, we applied a convective heat transfer boundary condition at the outer boundary of the rock layer. This approach mimics the semi-infinite thermal behavior of geological formations, allowing the heat to gradually dissipate into the surrounding medium. As a result, the temperature rise in the system was not unbounded but asymptotically approached a steady-state value over long-term cycling. In the sealing layer, the rate of temperature increase was higher than that in the lining layer, and the rate of temperature increase in the lining layer was higher than that in the surrounding rock layer. The reason for this situation is that temperature transfer has a time effect, that is, it took a certain amount of time to transfer from the high-temperature boundary to the low-temperature area. Hydrogen gas injected into the cave first contacted the sealing layer, and then the sealing layer gradually transferred the high temperature to the surrounding rock layer.
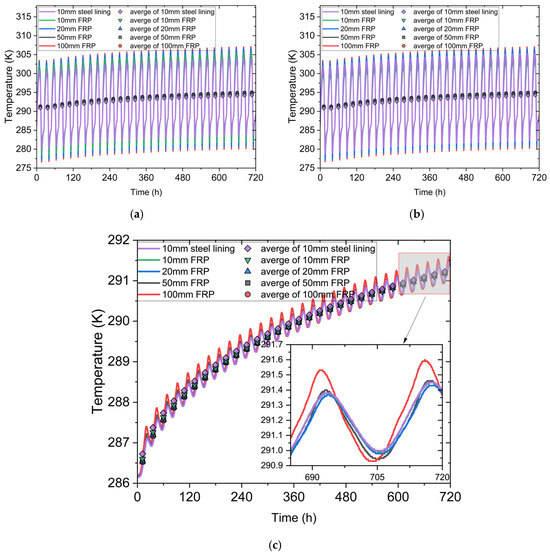
Figure 7.
Temperature changes around the cavern: (a) temperature inside the sealing layer; (b) temperature inside the lining layer; (c) temperature inside the surrounding rock.
At the same time, we also found that the temperature of the chamber reached its lowest point at the moment of deflation and its highest point at the end of inflation. The temperature change in the 100 mm FRP was the largest, while the temperature change in the 10 mm steel lining was the smallest. In the sealing layer, the overall temperature distribution was between 276 K and 307 K. In the lining layer and surrounding rock layer, the temperature distribution in the lining layer was between 276 K and 305 K, while in the surrounding rock layer, it was between 286 K and 291.5 K. This means that the thickness of the FRP has a significant impact on the temperature changes. The thicker the thickness, the less gas leakage and the relatively higher the temperature. In terms of the steel lining, the steel lining has better thermal conductivity, so the temperature change was the smallest.
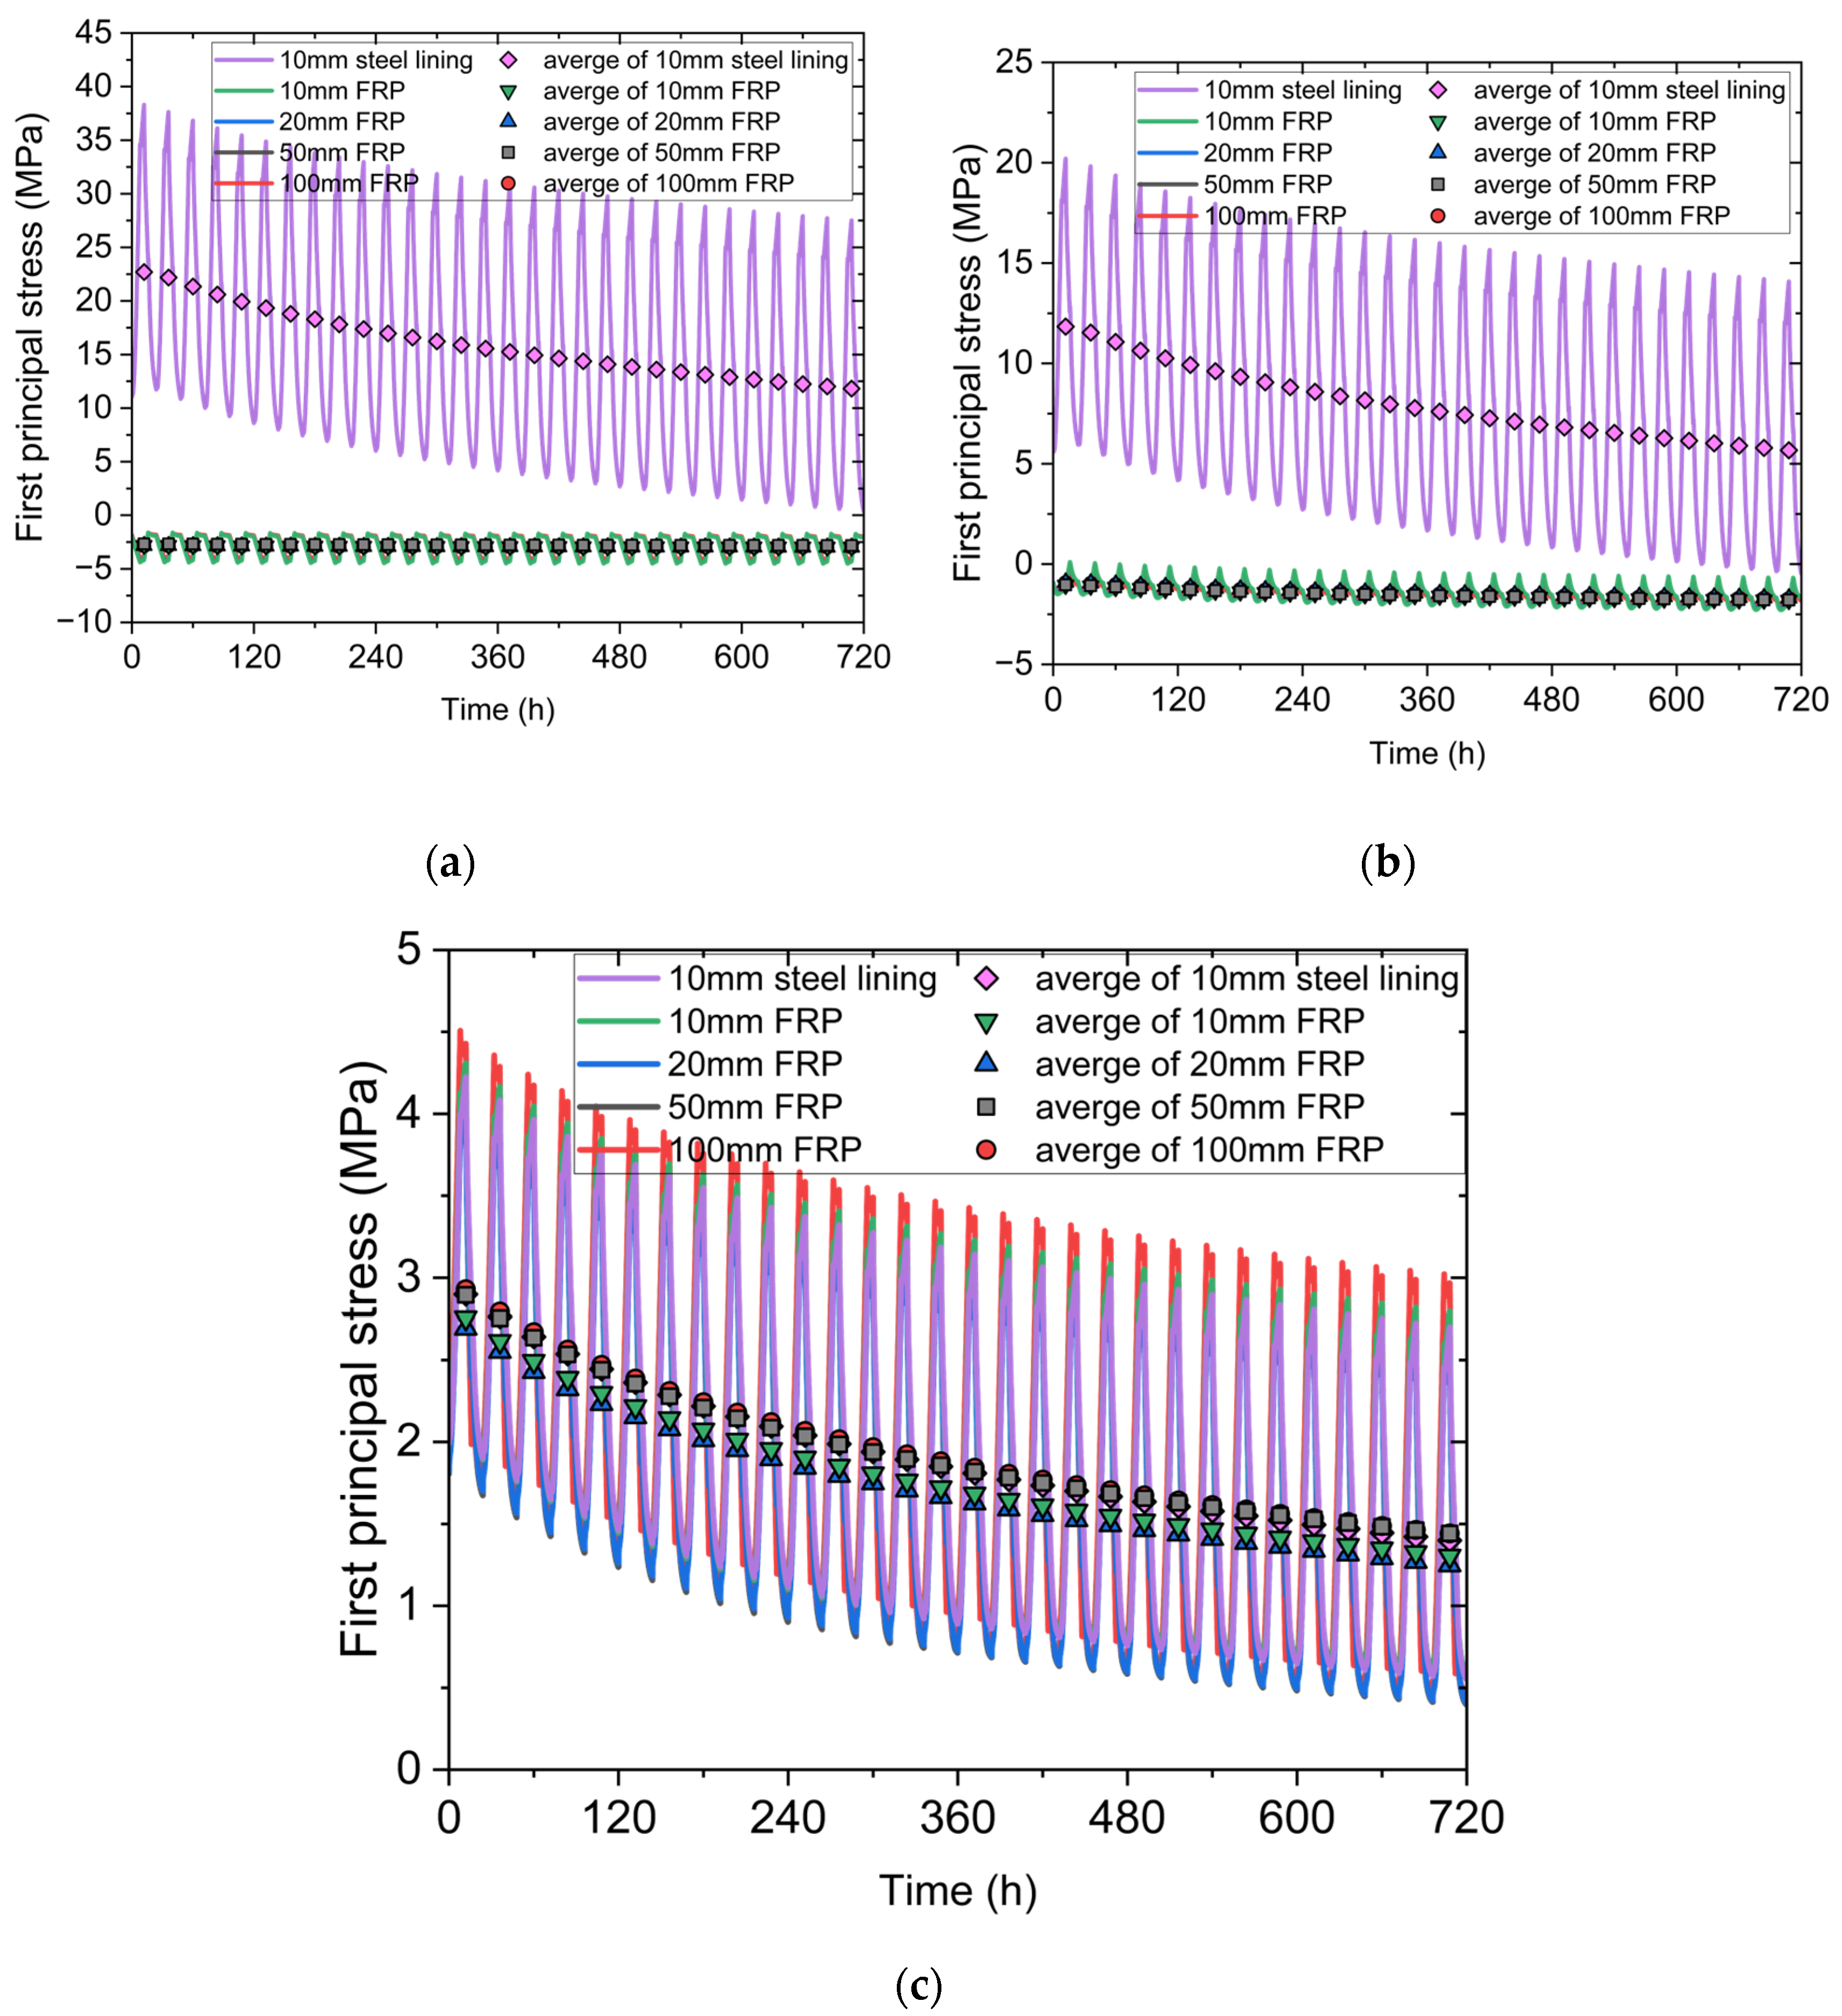
By observing Figure 8, it can be found that the peak value of the first principal stress in the steel lining decreased with time, regardless of the medium. However, due to its excellent elastic deformation ability, the FRP did not show significant changes in the first principal stress. In the sealing layer, the range of variation in the first principal stress of the steel lining was from 0 MPa to 36 MPa, while in the lining layer, the range of variation in the first principal stress was still relatively large, from 0 MPa to 25 MPa. However, in the surrounding rock layer, its variation value was relatively small, basically maintained between 0.5 MPa and 4.5 MPa. The first principal stress of FRP in the sealing layer and lining layer was manifested as negative values, ranging from −5 MPa to 0 MPa and −2 MPa to 0 MPa, respectively. However, in the surrounding rock layer, the variation in the first principal stress was relatively large, ranging from 0.5 MPa to 4.3 MPa. The influence of the FRP with different thicknesses on the first principal stress changes in the sealing layer and lining layer was relatively small, while the influence was greater in the surrounding rock layer. Specifically, in the sealing layer, the FRP of different thicknesses had little effect. In the lining layer, the 10 mm FRP had the largest variation range, while the 100 mm FRP had the smallest variation range. In the surrounding rock, the variation range of the 10 mm FRP was the smallest (basically consistent with the variation range of the 10 mm steel lining), while the variation range of the 100 mm FRP was the largest, and its peak value was also the largest.
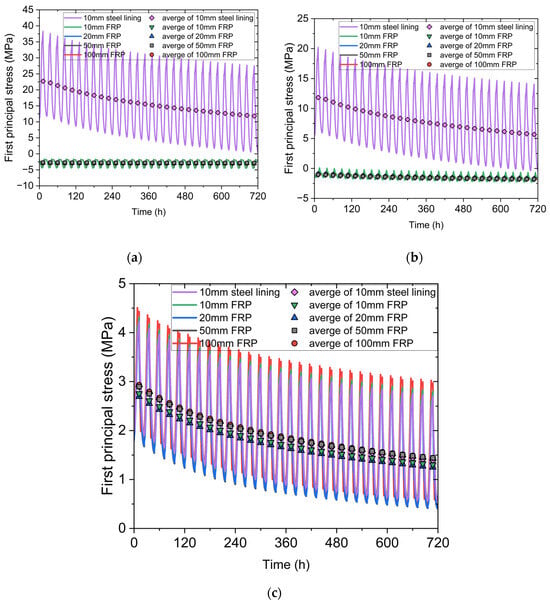
Figure 8.
Variation in the first principal stress around the cavern: (a) inner boundary of sealing layer; (b) inner boundary of lining layer; (c) inner boundary of surrounding rock.
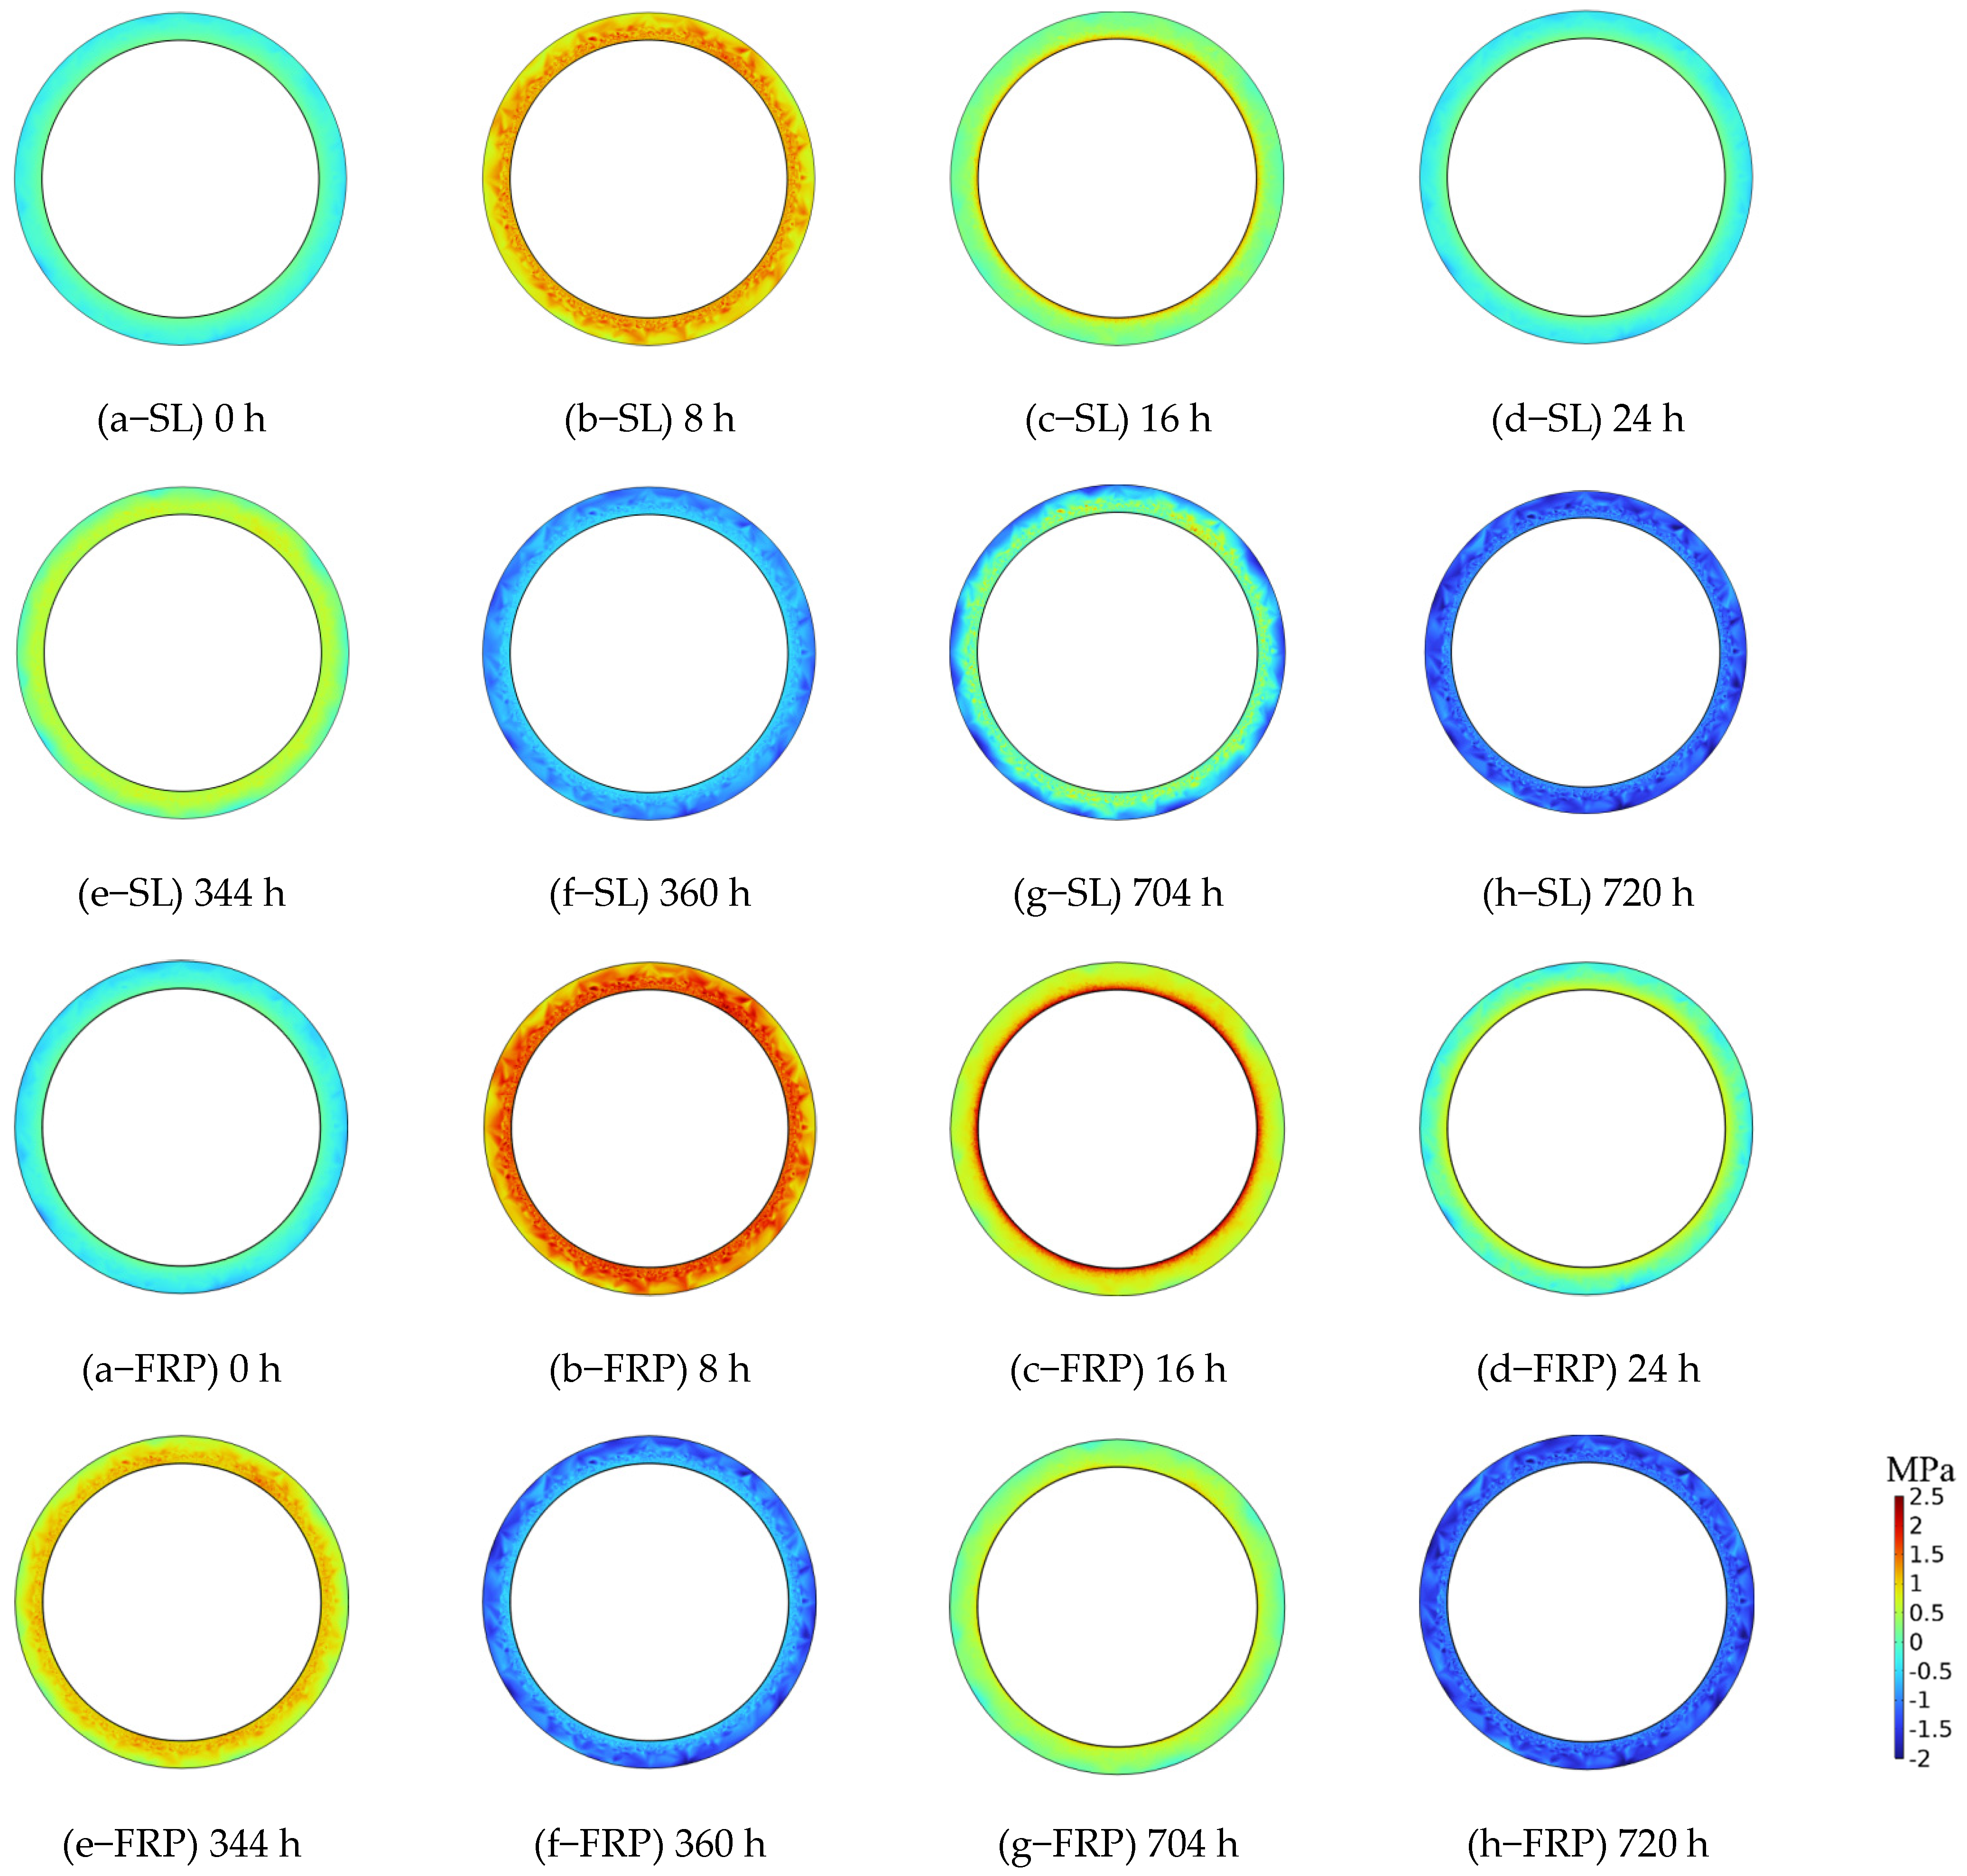
Considering that there was not a significant difference in the stress variation between the FRP with different thicknesses, only the 10 mm FRP and 10 mm steel lining were compared in the process of cloud map analysis. Figure 9 shows the variation in the first principal stress of the concrete lining. It should be noted that SL refers to models with a 10 mm steel lining, while FRP refers to models using 10 mm FRP. For the time nodes, we selected the starting time (0 h), end of inflation on the first day (8 h), end of deflation on the first day (16 h), end of cycle on the first day (24 h), end of inflation on the fifteenth day (344 h), end of cycle on the fifteenth day (360 h), end of inflation on the thirtieth day (704 h), and end of cycle on the thirtieth day (720 h). In these cloud maps, stress greater than 0 means tensile stress, while stress less than 0 means compressive stress.
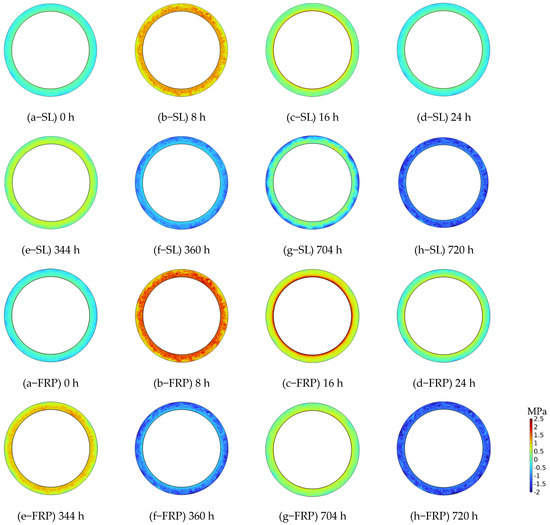
Figure 9.
Cloud map of the first principal stress of the lining layer. SL represents the model of a 10 mm steel lining, and FRP represents the model of a 10 mm FRP lining. (a–h) Results at 0 h, 8 h, 16 h, 24 h, 344 h, 360 h, 704 h, and 720 h, respectively.
By observing the first principal stress cloud map of the lining, it can be observed that the stress at any stage was not uniformly distributed, whether in the steel lining or FRP. The main reason for this phenomenon is that the elastic modulus of the lining follows a Weibull distribution. At the same time, it can also be observed that at 8 h, the distribution range of the first principal stress was significantly larger than that at 344 h, which, in turn, was significantly larger than that at 704 h. This means that the first principal stress caused by inflation was the most dangerous at the beginning, and it then gradually decreased and eventually tended to stabilize due to the overall deformation of the surrounding rock. At any stage, the closer to the inner layer of the tunnel, the wider the magnitude and distribution range of tensile stress, which means that the inner side of the lining layer is more prone to tensile failure. By comparing and analyzing the lining layers in the steel lining and FRP models, it can be significantly found that the range and magnitude of the first principal stress change in the lining layer caused by the steel lining were smaller than those in the FRP model. At any given moment, the FRP exhibited greater tensile stress at the end of inflation and greater compressive stress at the end of deflation. The main reason is that steel lining, as a sealing layer, can provide certain support for the tunnel. When gas acts on it, the deformation is small, while the support ability of FRP is not as good as that of steel lining. When gas acts on it, its deformation ability is large, and the force is quickly and attenuated to the lining layer.
Figure 10 shows the variation in the third principal stress at different positions. It can be observed that the third principal stress remained relatively stable during the cyclic mining and injection process within 30 days, with the peak value remaining basically unchanged, especially in the sealing layer and lining layer. The magnitude of the third principal stress in the sealing layer was maintained between −11.6 MPa and −4.4 MPa. Regardless of the type of sealing ring, its value was basically the same. Only in the later stage was the maximum value of FRP for 50 mm and 100 mm slightly higher than that of the other types of sealing rings, while the minimum value of FRP for 10 mm and 20 mm was slightly lower than that of the other types of sealing rings. The maximum variation range of FRP in the lining layer was 10 mm, the third principal stress range was from −11.5 MPa to −4.6 MPa, and the minimum variation range of the steel lining was 10 mm. In the surrounding rock layer, there was a relatively large difference in the third principal stress caused by the different types of sealing materials. It can be observed that the thicker the thickness, the larger the minimum value of the third principal stress. The 10 mm steel lining had a similar effect to FRP, with the third principal stress range maintained between −6.4 MPa and −4.3 MPa, while the 100 mm FRP maintained the third principal stress between −8.3 MPa and −5.2 MPa. This means that thinner sealing rings have better performance.
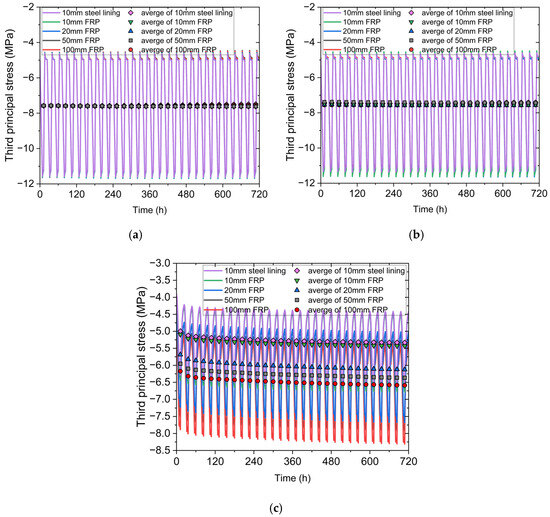
Figure 10.
Variation in the third principal stress around the cavern: (a) inner boundary of sealing layer; (b) inner boundary of lining layer; (c) inner boundary of surrounding rock.
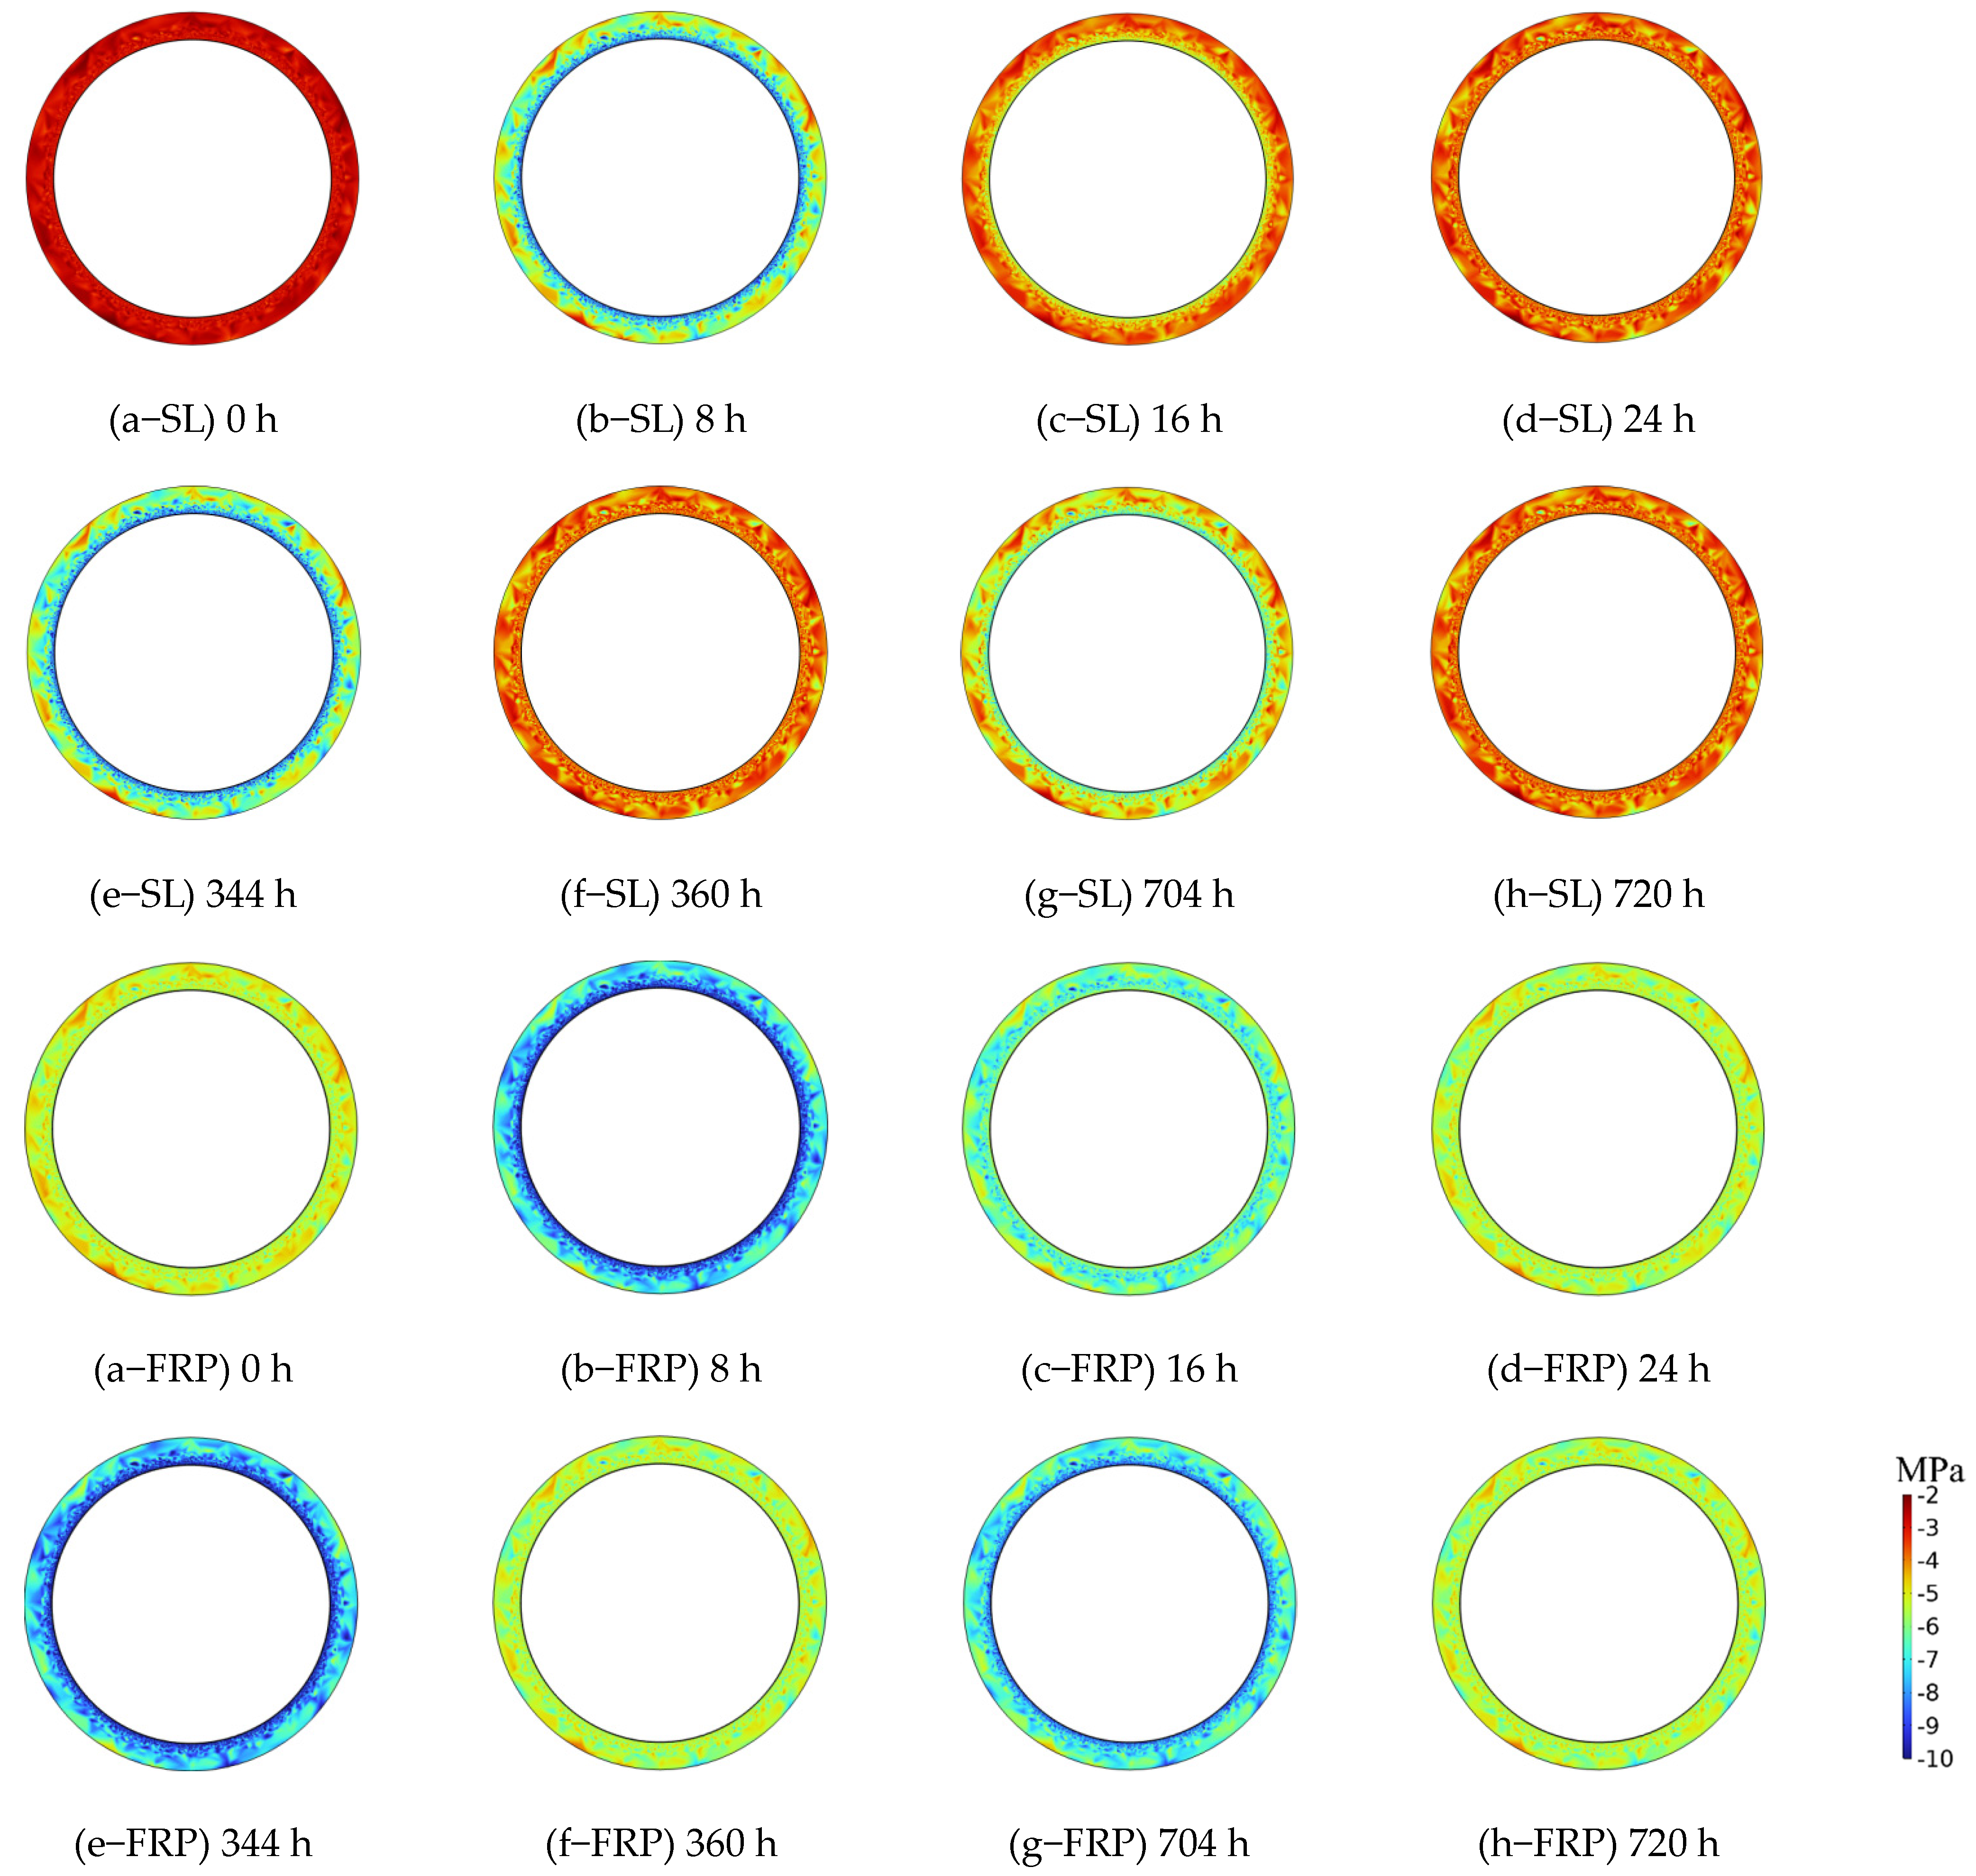
Figure 11 shows a cloud map of the third principal stress variation in the lining. It can be observed that the stress distribution of the 10 mm steel lining and 10 mm FRP was mainly dominated by compressive stress. Similar to the pattern of the first principal stress, the initial compressive stress was relatively small, but at the end of inflation, the compressive stress reached its maximum. After deflation, the third principal stress decreased. After the cycle ended, the third principal stress reached its lowest point. It can be observed that during the inflation phase, the magnitude of the third principal stress gradually decreased and eventually tended towards a stable state. The third principal stress of the FRP lining had a larger range of variation and more severe compression, while the third principal stress of the steel lining had a smaller variation. At the end of deflation and cycle, the value of the third principal stress was basically maintained around −2 MPa, and the unevenness of the distribution of the third principal stress was also caused by the unevenness of the elastic modulus.

Figure 11.
Cloud map of the third principal stress of the lining layer. SL represents the model of a 10 mm steel lining, and FRP represents the model of a 10 mm FRP lining. (a–h) Results for 0 h, 8 h, 16 h, 24 h, 344 h, 360 h, 704 h, and 720 h, respectively.
Whether the surrounding rock will be damaged has always been one of the most concerned issues for engineers, because if the strength of the surrounding rock can always be greater than the stress strength, then this energy storage chamber will be considered stable and safe, and the role of the sealing layer is mainly reflected in preventing gas leakage, while the lining layer is more for support and stress sharing. However, there are multiple criteria for analyzing the strength of the surrounding rock. Under the three-dimensional underground stress state, analyzing the variation patterns of the first and third principal stresses alone is not enough. Therefore, this paper further analyzed the stress state of the surrounding rock. Figure 12 shows the normal stress and shear stress of the inner boundary of the surrounding rock. The trend of the normal stress variation indicates that the range of variation for the 10 mm steel lining was the smallest, followed by 10 mm FRP, with stress variation ranges of −4.27 MPa to −6.26 MPa and −4.26 MPa to −6.5 MPa, respectively. At the same time, it can be observed that as the thickness of the FRP increased, the range of the normal stress variation also increased, reaching its maximum at 100 mm, with a normal stress variation range of −5 MPa to −8.29 MPa. The laws of the shear stress and normal stress are basically similar. We can observe that shear stress increased with time, and the trend of the 100 mm FRP was the most obvious. As the thickness increased, the peak value of the shear stress also increased continuously, with the 10 mm steel lining being the smallest, followed by 10 mm FRP. For sealing rings with a thickness of less than 20 mm, the variation range of the shear stress was between 0.05 MPa and 0.13 MPa, while the variation range of the 50 mm FRP was between 0.12 MPa and 0.18 MPa, and the variation range of the 100 mm FRP was the largest, ranging from 0.13 MPa to 0.26 MPa.
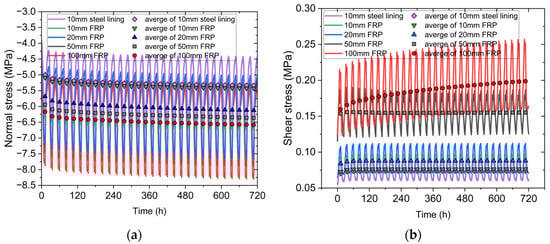
Figure 12.
Stress variation at the inner boundary of surrounding rock: (a) normal stress; (b) shear stress.
5. Conclusions
This paper systematically studied the long-term stability of cavern hydrogen storage based on the theory of thermal coupling. Firstly, this paper established the gas thermodynamic equation and then derived the thermodynamic coupling equation applicable to cave gas storage analysis by coupling the stress–strain equation of solid mechanics. Secondly, based on the leakage rate of different sealing rings, the temperature and stress changes in the hydrogen storage cavern were analyzed, and the long-term performance of the hydrogen storage cavern was analyzed using steel lining and FRP. Through these studies, the following conclusions were drawn:
- (1)
- The leakage rate of the FRP sealing layer decreases significantly with thickness. A 10 mm FRP layer has a peak leakage rate of 1.3 g/s, while a 100 mm layer stabilizes at around 0.1 g/s, demonstrating that thicker layers effectively reduce gas permeation.
- (2)
- Thicker FRP layers result in more pronounced temperature fluctuations and enhanced thermal insulation. However, they also lead to larger fluctuations in principal stresses, particularly in the surrounding rock, which may affect cavern stability.
- (3)
- Steel lining experiences greater overall stress than FRP, but FRP exhibits significant tensile stress and fluctuating compressive stress. The stress distribution in FRP is more variable due to its lower elastic modulus compared to steel.
- (4)
- While thicker FRP layers improve leakage prevention and thermal performance, they increase normal and shear stresses in the surrounding rock, potentially compromising the cavern’s overall stability. Therefore, a balance between sealing effectiveness and rock stability is essential.
In summary, the selection of the sealing layer plays a crucial role in the performance of compressed hydrogen storage caverns. Thicker FRP layers have excellent performance in reducing leakage rates and regulating temperature fluctuations, but they may lead to increased stress changes in the surrounding rock layer. On the other hand, although steel lining has better thermal conductivity and higher stiffness, its cost-effectiveness is not high compared to cheap FRP. Therefore, the design of the sealing layer must carefully balance leakage control, thermal management, material properties, and the impact on the surrounding rock stability to optimize the performance and safety of the hydrogen storage system.
Author Contributions
Conceptualization, C.H. and L.H. (Lixin He); methodology, C.H. and L.H. (Lixin He); software, L.H. (Lihua Hu); validation, C.H., L.H. (Lixin He) and L.H. (Lihua Hu); formal analysis, B.J. and X.L.; investigation, L.H. (Lihua Hu) and X.L.; writing—original draft preparation, C.H. and K.Z.; writing—review and editing, K.Z., Y.J. and P.Z.; visualization, Y.J. and P.Z.; funding acquisition, X.L., Y.J. and P.Z. All authors have read and agreed to the published version of the manuscript.
Funding
This research was funded by the Science and Technology Project of Xuzhou (KC23427), the National Natural Science Foundation of China (42230704), the National Key Research and Development Plan (2022YFC3003300), and the Basic Research Program of 423 Jiangsu (BM2022009, BK20221135, BK20243024).
Data Availability Statement
The original contributions presented in this study are included in the article. Further inquiries can be directed to the corresponding authors.
Conflicts of Interest
The authors declare no conflicts of interest.
References
- Zivar, D.; Kumar, S.; Foroozesh, J. Underground Hydrogen Storage: A Comprehensive Review. Int. J. Hydrogen Energy 2021, 46, 23436–23462. [Google Scholar] [CrossRef]
- Le, T.T.; Sharma, P.; Bora, B.J.; Tran, V.D.; Truong, T.H.; Le, H.C.; Nguyen, P.Q.P. Fueling the Future: A Comprehensive Review of Hydrogen Energy Systems and Their Challenges. Int. J. Hydrogen Energy 2024, 54, 791–816. [Google Scholar] [CrossRef]
- Yang, J.; Sudik, A.; Wolverton, C.; Siegel, D.J. High Capacity Hydrogen Storage Materials: Attributes for Automotive Applications and Techniques for Materials Discovery. Chem. Soc. Rev. 2010, 39, 656–675. [Google Scholar] [CrossRef]
- Armaroli, N.; Balzani, V. The Hydrogen Issue. ChemSusChem 2011, 4, 21–36. [Google Scholar] [CrossRef] [PubMed]
- Dash, S.K.; Chakraborty, S.; Elangovan, D. A Brief Review of Hydrogen Production Methods and Their Challenges. Energies 2023, 16, 1141. [Google Scholar] [CrossRef]
- Hwang, J.; Maharjan, K.; Cho, H. A Review of Hydrogen Utilization in Power Generation and Transportation Sectors: Achievements and Future Challenges. Int. J. Hydrogen Energy 2023, 48, 28629–28648. [Google Scholar] [CrossRef]
- Evro, S.; Oni, B.A.; Tomomewo, O.S. Carbon Neutrality and Hydrogen Energy Systems. Int. J. Hydrogen Energy 2024, 78, 1449–1467. [Google Scholar] [CrossRef]
- Engeland, K.; Borga, M.; Creutin, J.-D.; François, B.; Ramos, M.-H.; Vidal, J.-P. Space-Time Variability of Climate Variables and Intermittent Renewable Electricity Production—A Review. Renew. Sustain. Energy Rev. 2017, 79, 600–617. [Google Scholar] [CrossRef]
- Sun, R.; Wang, J.; Zhang, K.; Li, F.; Ding, X.; Guo, Q. Stress Redistribution in a Multilayer Chamber for Compressed Air Energy Storage in Abandoned Coalmine: Elastic Analytical Insights and Material Choice. Energy Sci. Eng. 2023, 11, 4198–4223. [Google Scholar] [CrossRef]
- Hu, B.; Mi, X.; Liyuan, Y.; Li, S.; Li, W.; Wei, C. Effects of Cushion Gas Pressure and Operating Parameters on the Capacity of Hydrogen Storage in Lined Rock Caverns (LRC). Renew. Energy 2024, 235, 121317. [Google Scholar] [CrossRef]
- Bin Abu Sofian, A.D.A.; Lim, H.R.; Siti Halimatul Munawaroh, H.; Ma, Z.; Chew, K.W.; Show, P.L. Machine Learning and the Renewable Energy Revolution: Exploring Solar and Wind Energy Solutions for a Sustainable Future Including Innovations in Energy Storage. Sustain. Dev. 2024, 32, 3953–3978. [Google Scholar] [CrossRef]
- Hu, B.; Yu, L.; Mi, X.; Xu, F.; Li, S.; Li, W.; Wei, C.; Zhang, T. Comparative Analysis of Thermodynamic and Mechanical Responses between Underground Hydrogen Storage and Compressed Air Energy Storage in Lined Rock Caverns. Int. J. Min. Sci. Technol. 2024, 34, 531–543. [Google Scholar] [CrossRef]
- Rusman, N.A.A.; Dahari, M. A Review on the Current Progress of Metal Hydrides Material for Solid-State Hydrogen Storage Applications. Int. J. Hydrogen Energy 2016, 41, 12108–12126. [Google Scholar] [CrossRef]
- Ozarslan, A. Large-Scale Hydrogen Energy Storage in Salt Caverns. Int. J. Hydrogen Energy 2012, 37, 14265–14277. [Google Scholar] [CrossRef]
- Opoku Duartey, K.; Ampomah, W.; Rahnema, H.; Mehana, M. Underground Hydrogen Storage: Transforming Subsurface Science into Sustainable Energy Solutions. Energies 2025, 18, 748. [Google Scholar] [CrossRef]
- Gunathilake, C.; Soliman, I.; Panthi, D.; Tandler, P.; Fatani, O.; Ghulamullah, N.A.; Marasinghe, D.; Farhath, M.; Madhujith, T.; Conrad, K.; et al. A Comprehensive Review on Hydrogen Production, Storage, and Applications. Chem. Soc. Rev. 2024, 53, 10900–10969. [Google Scholar] [CrossRef]
- Habib, A.K.M.A.; Sakib, A.N.; Mona, Z.T.; Bhuiyan, M.M.H.; Kazempoor, P.; Siddique, Z. Hydrogen-Assisted Aging Applied to Storage and Sealing Materials: A Comprehensive Review. Materials 2023, 16, 6689. [Google Scholar] [CrossRef] [PubMed]
- Gao, P.; Hu, D.; Lu, D.; Wang, J.; Cheng, Z.; Yi, F.; Zhou, J. Modeling and Analysis of Minor Seal Leakages in High-Pressure Hydrogen Valves under Extreme Environmental Temperatures. Int. J. Hydrogen Energy 2024, 64, 26–38. [Google Scholar] [CrossRef]
- Xue, Y.; Liu, J.; Liang, X.; Li, X.; Wang, S.; Ma, Z.; Zhang, S.; Jiao, X. Influence Mechanism of Brine-Gas Two-Phase Flow on Sealing Property of Anisotropic Caprock for Hydrogen and Carbon Energy Underground Storage. Int. J. Hydrogen Energy 2023, 48, 11287–11302. [Google Scholar] [CrossRef]
- Chen, X.; Wang, J.G. Stability Analysis for Compressed Air Energy Storage Cavern with Initial Excavation Damage Zone in an Abandoned Mining Tunnel. J. Energy Storage 2022, 45, 103725. [Google Scholar] [CrossRef]
- Li, S.; Qiu, K.; Wang, Z.; Zhao, S.; Wan, Z. Static and Fatigue Behaviors of Epoxy-Based Sealing Layers for Underground Hydrogen Energy Storage. Int. J. Hydrogen Energy 2024, 60, 66–81. [Google Scholar] [CrossRef]
- Meda, U.S.; Bhat, N.; Pandey, A.; Subramanya, K.N.; Lourdu Antony Raj, M.A. Challenges Associated with Hydrogen Storage Systems Due to the Hydrogen Embrittlement of High Strength Steels. Int. J. Hydrogen Energy 2023, 48, 17894–17913. [Google Scholar] [CrossRef]
- Sgambitterra, E.; Pagnotta, L. Permeability: The Driving Force That Influences the Mechanical Behavior of Polymers Used for Hydrogen Storage and Delivery. Energies 2024, 17, 2216. [Google Scholar] [CrossRef]
- Moradi, R.; Groth, K.M. Hydrogen Storage and Delivery: Review of the State of the Art Technologies and Risk and Reliability Analysis. Int. J. Hydrogen Energy 2019, 44, 12254–12269. [Google Scholar] [CrossRef]
- Prewitz, M.; Gaber, M.; Müller, R.; Marotztke, C.; Holtappels, K. Polymer Coated Glass Capillaries and Structures for High-Pressure Hydrogen Storage: Permeability and Hydrogen Tightness. Int. J. Hydrogen Energy 2018, 43, 5637–5644. [Google Scholar] [CrossRef]
- Balali, A.; Yunusa-Kaltungo, A.; Edwards, R. A Systematic Review of Passive Energy Consumption Optimisation Strategy Selection for Buildings through Multiple Criteria Decision-Making Techniques. Renew. Sustain. Energy Rev. 2023, 171, 113013. [Google Scholar] [CrossRef]
- Li, F.; Li, F.; Sun, R.; Zheng, J.; Li, X.; Shen, L.; Sun, Q.; Liu, Y.; Ji, Y.; Duan, Y. A Study on the Transient Response of Compressed Air Energy Storage in the Interaction between Gas Storage Chambers and Horseshoe-Shaped Tunnels in an Abandoned Coal Mine. Energies 2024, 17, 953. [Google Scholar] [CrossRef]
- Liu, W.; Dong, Y.; Jiang, L.; Wei, Y.; Wan, J. Studying Injection-Extraction Induced Thermal Stress on Hydrogen Storage Cavern in Bedded Salt Rocks. Int. J. Hydrogen Energy 2024, 94, 626–638. [Google Scholar] [CrossRef]
- Zamani, O.A.M.; Knez, D. Well Integrity in Salt Cavern Hydrogen Storage. Energies 2024, 17, 3586. [Google Scholar] [CrossRef]
- Rochat, S.; Polak-Kraśna, K.; Tian, M.; Mays, T.J.; Bowen, C.R.; Burrows, A.D. Assessment of the Long-Term Stability of the Polymer of Intrinsic Microporosity PIM-1 for Hydrogen Storage Applications. Int. J. Hydrogen Energy 2019, 44, 332–337. [Google Scholar] [CrossRef]
- Kushnir, R.; Dayan, A.; Ullmann, A. Temperature and Pressure Variations within Compressed Air Energy Storage Caverns. Int. J. Heat Mass Transfer 2012, 55, 5616–5630. [Google Scholar] [CrossRef]
- Wu, D.; Wang, J.G.; Hu, B.; Yang, S.-Q. A Coupled Thermo-Hydro-Mechanical Model for Evaluating Air Leakage from an Unlined Compressed Air Energy Storage Cavern. Renew. Energy 2020, 146, 907–920. [Google Scholar] [CrossRef]
- George, S.C.; Thomas, S. Transport Phenomena through Polymeric Systems. Prog. Polym. Sci. 2001, 26, 985–1017. [Google Scholar] [CrossRef]
- Yang, J.; Wang, J.G.; Liang, W.; Li, P.; Sun, R. Optimal Selection of Working Fluid for Enhanced Geothermal Systems: A Comparative Analysis of Supercritical Carbon Dioxide and Water under Various Reservoir and Extraction Conditions. Appl. Therm. Eng. 2024, 246, 122947. [Google Scholar] [CrossRef]
- Hu, B.; Ren, Y.; Sun, R.; Wang, S.; Su, S. Heterogeneity Properties and Permeability of Shale Matrix at Nano-Scale and Micron-Scale. Phys. Fluids 2024, 36, 96613. [Google Scholar] [CrossRef]
- Sun, R.; Wang, J. Effects of In Situ Stress and Multiborehole Cluster on Hydraulic Fracturing of Shale Gas Reservoir from Multiscale Perspective. J. Energy Eng. 2024, 150, 04024002. [Google Scholar] [CrossRef]
- Li, P.; Wang, J.; Liang, W.; Sun, R. An Analytical and Numerical Analysis for Hydraulic Fracture Propagation through Reservoir Interface in Coal-Measure Superimposed Reservoirs. Sustainability 2023, 15, 4597. [Google Scholar] [CrossRef]
- Matos, C.R.; Silva, P.P.; Carneiro, J.F. Overview of Compressed Air Energy Storage Projects and Regulatory Framework for Energy Storage. J. Energy Storage 2022, 55, 105862. [Google Scholar] [CrossRef]
- Xia, C.; Zhou, Y.; Zhou, S.; Zhang, P.; Wang, F. A Simplified and Unified Analytical Solution for Temperature and Pressure Variations in Compressed Air Energy Storage Caverns. Renew. Energy 2015, 74, 718–726. [Google Scholar] [CrossRef]
- Li, M.; Yang, Q.; Zhang, C.; Huang, S.; Zhang, M.; Zhang, G.; Zhao, L.; Jiang, S. Experimental and Numerical Study of the Temperature Evolution in Hydrogen Cylinder under Fast-Refueling Process. Int. J. Heat Mass Transfer 2023, 211, 124220. [Google Scholar] [CrossRef]
- Qin, S.; Xia, C.; Zhou, S. Air Tightness of Compressed Air Storage Energy Caverns with Polymer Sealing Layer Subjected to Various Air Pressures. J. Rock Mech. Geotech. Eng. 2023, 15, 2105–2116. [Google Scholar] [CrossRef]


Disclaimer/Publisher’s Note: The statements, opinions and data contained in all publications are solely those of the individual author(s) and contributor(s) and not of MDPI and/or the editor(s). MDPI and/or the editor(s) disclaim responsibility for any injury to people or property resulting from any ideas, methods, instructions or products referred to in the content. |
© 2025 by the authors. Licensee MDPI, Basel, Switzerland. This article is an open access article distributed under the terms and conditions of the Creative Commons Attribution (CC BY) license (https://creativecommons.org/licenses/by/4.0/).