1. Introduction
In today’s highly competitive e-commerce landscape, optimizing delivery hub locations is a crucial challenge for businesses aiming to enhance logistics efficiency and customer satisfaction. The rapid rise of online grocery shopping, particularly following the COVID-19 pandemic, has placed unprecedented pressure on supply chains to improve delivery speed, minimize costs, and promote sustainability. The increasing demand for home delivery services has reshaped consumer behavior, requiring businesses to rethink traditional location selection strategies.
Delivery hubs serve as key intermediaries in the supply chain, linking suppliers with end consumers. However, determining the optimal location for these hubs is a complex multi-criteria decision-making (MCDM) problem that involves balancing economic, operational, and environmental factors. Traditional location selection methods often struggle to accommodate the uncertainty and dynamic nature of modern logistics, necessitating the use of advanced decision-making frameworks.
The post-pandemic environment has further complicated location selection by introducing new challenges, such as fluctuating demand patterns, labor shortages, and the need for more resilient supply chain strategies. Additionally, sustainability concerns have gained prominence, pushing businesses to consider factors such as carbon footprint reduction and energy-efficient operations. As a result, there is a growing need for decision-making models that can effectively incorporate these evolving factors.
This study proposes a hybrid decision-making approach that combines the analytic hierarchy process (AHP) and the spherical fuzzy technique for order of preference by similarity to ideal solution (SFTOPSIS) to optimize delivery hub selection. The AHP is utilized to determine the weight of each criterion, while SFTOPSIS ranks the candidate locations based on their proximity to an ideal solution. The integration of spherical fuzzy sets allows for a more sophisticated treatment of uncertainty, enabling a more reliable and flexible decision-making process.
By incorporating sustainability and post-pandemic logistics challenges into the decision-making framework, this research contributes to the growing field of sustainable supply chain management. Through a case study application, this paper demonstrates the effectiveness of the proposed methodology in guiding businesses toward optimal and future-proof location selection strategies.
This study makes several key contributions to the field of online grocery distribution hub selection. It introduces a novel hybrid decision-making framework that synergizes the analytical hierarchy process (AHP) with spherical fuzzy TOPSIS. Notably, this framework integrates crucial contemporary concerns by incorporating energy efficiency and environmental sustainability into the hub location selection process. The practical applicability of this approach is demonstrated through a comprehensive application that includes quantitative energy analysis and a real-world case study in Alanya, Turkey. Furthermore, the research enhances the handling of uncertainty in multi-criteria environments by developing a spherical fuzzy weight vector scheme.
The structure of the paper is organized as follows:
Section 2 outlines the general location selection problem;
Section 3 introduces the methodological tools;
Section 4 reviews the relevant literature;
Section 5 presents the proposed methodology;
Section 6 details the step-by-step application;
Section 7 describes the case study and reliability assessment;
Section 8 discusses the findings; and
Section 9 concludes the study and suggests future research directions.
2. Location Selection Problem
Location selection is a critical decision-making process that involves identifying the most suitable site for a facility or operation. This decision is particularly crucial for businesses and organizations in the online grocery market, especially in the post-COVID-19 era. For an online grocery shopping application, choosing the right location is key to meeting customer demands, ensuring efficient and sustainable operations, and maintaining a competitive edge in a rapidly evolving market. Informed decision-making, supported by careful data analysis and a consideration of shifting consumer behaviors, is essential to creating a successful and resilient online grocery platform.
Location selection is inherently complex, requiring the consideration of various factors, such as accessibility, cost, proximity to suppliers and customers, infrastructure, labor market conditions, and regulatory compliance. Traditionally, location selection has involved weighing these factors and choosing the site with the highest overall score. However, the advent of multi-criteria decision-making (MCDM) methods has made the process more efficient and comprehensive.
MCDM methods provide decision-makers with the tools to evaluate multiple criteria simultaneously, enabling trade-offs between different factors. This section reviews the application of MCDM methods to the location selection problem, with particular attention to their relevance in the post-COVID-19 context. The choice of the most appropriate MCDM approach depends on the specific context and requirements of the decision. The common steps involved in applying MCDM methods to location selection are illustrated in
Figure 1 and outlined below:
Data collection: MCDM methods rely on comprehensive data related to the criteria deemed important for decision-making. This data can be sourced from government agencies, industry reports, surveys, and other relevant sources.
Data analysis: After data collection, the relative importance of each criterion must be determined. This step can be performed using statistical methods or other analytical tools to establish the weights of the criteria.
Ranking alternatives: With the criteria weighted, potential locations are then ranked based on their performance across each criterion.
Decision-making: The final decision on the optimal location should be made by the decision-maker, taking into account all relevant factors and criteria.
While MCDM methods are highly valuable in the location selection process, it is important to remember that they are not a substitute for sound decision-making. Decision-makers should use their judgment and experience when making the final choice. Combining MCDM methods with rigorous data collection, analysis, and a thorough consideration of all relevant factors will lead to better location selection outcomes, providing a strong foundation for online grocery shopping applications in an evolving market landscape.
3. Methods
The selection of optimal locations for fulfillment centers, warehouses, and delivery hubs is a critical decision in online grocery shopping applications. Various methods and techniques are employed to identify the most strategic sites, ensuring efficiency in logistics operations. One of the widely used methods is a geographic information system (GIS) analysis, which leverages geographical data to assess factors such as population density, customer distribution, transportation networks, and proximity to suppliers. GIS provides businesses with visual tools to analyze market trends, making it an essential component in determining ideal locations for logistics hubs.
In addition to GIS, data-driven analysis plays a crucial role in optimizing location decisions. By analyzing historical order data, customer preferences, and shopping patterns, businesses can identify high-demand areas and improve service efficiency. Market research and customer surveys further enhance decision-making by offering valuable insights into consumer behavior and expectations. Advanced analytics and machine learning algorithms have become integral to the process, allowing businesses to assess multiple variables, including transportation costs, delivery times, and supply chain resilience, thereby enhancing overall operational performance.
Apart from technological considerations, businesses must also account for urban planning regulations, zoning laws, and environmental impact assessments to ensure compliance and sustainability. By integrating these factors, online grocery shopping platforms can strategically position their logistics hubs, thereby improving customer service, minimizing costs, and gaining a competitive edge in the market.
Multi-Criteria Decision-Making (MCDM) Approaches in Location Selection
To address the complexities of location selection, various multi-criteria decision-making (MCDM) approaches have been developed. The choice of the most appropriate MCDM method depends on the specific needs of a business and the decision-making context. Some of the most widely used methods include the following [
1,
2,
3,
4,
5,
6,
7,
8,
9,
10,
11,
12,
13,
14,
15,
16,
17,
18,
19,
20,
21,
22,
23,
24,
25,
26,
27,
28,
29,
30,
31,
32,
33,
34,
35,
36,
37,
38]:
- ▪
Analytic hierarchy process (AHP)—A structured technique for organizing and analyzing complex decisions by breaking them down into a hierarchy of criteria.
- ▪
Analytic network process (ANP)—An extension of the AHP that considers interdependencies among criteria.
- ▪
Technique for order preference by similarity to ideal solution (TOPSIS)—A method that ranks alternatives based on their relative distance to an ideal solution.
- ▪
Preference ranking organization method for enrichment evaluations (PROMETHEE)—A decision-support method that compares alternatives based on preference functions.
- ▪
Elimination and choice expressing reality (ELECTRE)—A method that applies pairwise comparisons to rank alternatives.
- ▪
Grey relational analysis (GRA)—A technique used to handle uncertainty and incomplete information in decision-making.
- ▪
VIse Kriterijumska Optimizacija I Kompromisno Resenje (VIKOR)—A method that emphasizes compromise solutions for multi-criteria problems.
These MCDM approaches provide a structured framework for evaluating multiple factors simultaneously, making them valuable tools for businesses looking to optimize location selection.
In the highly competitive online grocery market, location selection is a crucial factor influencing logistics efficiency, cost management, and customer satisfaction. MCDM methods offer a systematic and structured approach to this complex decision-making process by incorporating multiple evaluation criteria. Among the most frequently applied methods in logistics and location selection are AHP, TOPSIS, PROMETHEE, ELECTRE, and GRA, all of which have been successfully implemented across various industries, including manufacturing, logistics, and service sectors.
To achieve long-term strategic goals and operational success, businesses should consider integrating data-driven decision-making, GIS-based analysis, and advanced MCDM techniques into their location selection process. By leveraging these tools, companies can optimize logistics networks, improve efficiency, and ensure sustainability in the ever-evolving digital economy.
4. Literature Review
Location selection has long been recognized as a critical factor in the success of logistics and supply chain management. Traditional methods, such as AHP and TOPSIS, have proven effective in evaluating multiple criteria. However, the COVID-19 pandemic has introduced new uncertainties, necessitating the evolution of these methods.
Recent advancements in fuzzy set theory, including spherical fuzzy sets, have enhanced the capability of decision-making tools to handle uncertainty. Spherical fuzzy sets extend traditional fuzzy sets by introducing additional parameters for representing degrees of membership, non-membership, and hesitation. This added flexibility has been successfully applied across various domains, including renewable energy, industrial site selection, and supply chain management [
2,
3,
4,
5,
6,
7,
8,
9,
10,
11,
12,
13,
14,
15,
16,
17,
18,
19,
20,
21,
22,
23,
24,
25,
26,
27,
28,
29,
30,
31,
32,
33,
34,
35,
36,
37,
38,
39,
40,
41,
42,
43,
44,
45,
46].
The use of spherical fuzzy sets enables the consideration of uncertainties in decision-making. On the other hand, SFTOPSIS is an extension of TOPSIS that also incorporates the concept of spherical fuzzy sets. The use of spherical fuzzy sets in SFTOPSIS enables the consideration of uncertainties in decision-making.
The selected papers that are shown in this section have contributed to the development and application of spherical fuzzy sets (SFS) using MCDM techniques [
47,
48,
49,
50,
51,
52,
53,
54,
55,
56,
57,
58,
59,
60,
61,
62,
63,
64]. These papers represent a selection of the significant contributions in the field of SFS and MCDM. Researchers and practitioners interested in this area should explore these works for insights into the theory, methodology, and applications of SFS in multi-criteria decision-making. Additionally, since research on Pythagorean fuzzy sets is still evolving, it is important to stay informed about recent developments to apply them effectively in real-world decision-making problems.
In addition to expert-driven decision models, several recent studies emphasize the value of end-user perspectives in logistics location selection. For instance, Gençtürk and Öztürkoğlu [
5] explored how customer satisfaction factors, such as delivery punctuality and service coverage, influence depot placement. Gönen and İyigun [
10] incorporated public preference scores into MCDM criteria using survey-based weighting. These works highlight the need to align technical evaluations with user-centric performance indicators—especially in customer-facing logistics operations. While this study focuses on supply-side priorities (e.g., cost, infrastructure, energy use), future work can enhance the model by incorporating customer feedback, social media sentiment, or GIS-based population density layers.
The adoption of advanced MCDM techniques in location selection has been driven by increasing complexity in logistics networks. Factors such as urban congestion, environmental regulations, and consumer expectations necessitate sophisticated approaches capable of addressing conflicting criteria. While the traditional AHP and TOPSIS methods provide a solid foundation, their ability to handle uncertainty is limited. The hybridization of these methods with fuzzy logic—and particularly spherical fuzzy sets—addresses this limitation effectively.
Although several studies in
Table 1 have applied hybrid MCDM approaches using fuzzy extensions (e.g., SFS-AHP, SFS-TOPSIS), most focus on single-step applications or are limited to specific domains, such as renewable energy, insurance, or industrial equipment selection. This paper differs in three key ways:
- ▪
It employs a fully integrated hybrid model, combining both AHP for weighting and spherical fuzzy TOPSIS (SFTOPSIS) for ranking, which allows for the consistent treatment of uncertainty across all decision-making phases.
- ▪
Compared to interval-valued fuzzy sets (IVFS), Pythagorean fuzzy sets (PFS), and neutrosophic sets, the SFS model provides a balanced representation of membership, non-membership, and hesitation degrees, ensuring better normalization and decision granularity. SFS maintain computational efficiency while capturing richer linguistic evaluations.
- ▪
The proposed model is applied to a real-world logistics facility location problem with a sustainability and energy-efficiency focus, incorporating quantitative energy contribution estimates—an area rarely addressed with SFS-based MCDM frameworks.
Thus, this study contributes a novel methodological integration and practical application that extends the existing literature in both theoretical and applied directions. This study also introduces a novel hybrid approach that leverages the strengths of the AHP and SFTOPSIS, addressing the unique challenges posed by the online grocery industry in the post-pandemic era. The integration of sustainability as a core criterion further distinguishes this research, aligning with evolving priorities in logistics and supply chain management.
5. Methodology
This study employs a hybrid multi-criteria decision-making (MCDM) approach that integrates the analytic hierarchy process (AHP) and the spherical fuzzy technique for order of preference by similarity to ideal solution (SFTOPSIS) to optimize delivery hub location selection. The AHP is utilized to determine the relative importance of evaluation criteria, while SFTOPSIS ranks the candidate locations based on their proximity to an ideal solution. The incorporation of spherical fuzzy sets (SFS) allows for a more nuanced treatment of uncertainty, which is crucial in dynamic logistics environments.
Spherical fuzzy sets (SFS) extend traditional fuzzy sets by incorporating three values for each evaluation: membership (), non-membership (), and hesitation (), with the constraint that their squared sum is ≤1. This allows decision-makers to express not only how much they agree or disagree with a criterion but how uncertain they are. For example, an expert evaluating proximity to customers might assign (, , ) if they are moderately favorable but hesitant due to unknown future demand patterns. SFS provide a richer, more realistic modeling of such uncertainty than classical or even type-1 fuzzy logic.
In this study, SFS are applied to TOPSIS stages to preserve uncertainty throughout the entire decision-making process. A complete list of spherical fuzzy operations, scoring functions, and aggregation methods is provided in
Appendix A.
5.1. Mathematical Formalization of the Problem
Let denote the set of candidate locations, and represent the set of decision-making criteria.
Let
be the weight of criterion
with
, and let
denote the performance value of alternative
with respect to criterion
These values are expressed in spherical fuzzy format using triplets as follows:
where
and
represent the degrees of membership, non-membership, and hesitation, respectively, and satisfy the following equation:
The goal is to rank all
based on their closeness coefficient to the spherical fuzzy ideal solution. The ideal solution is constructed using the following equation:
and the anti-ideal (worst-case) solution as follows:
The spherical distance
between each alternative and the ideal is computed using the following equation:
The closeness coefficient (CC) for each alternative is then given by the following equation:
The alternative with the highest value is considered the optimal location.
5.2. Justification for Method Selection
5.2.1. Why AHP?
The AHP is a widely used method for pairwise comparison-based weighting, allowing decision-makers to systematically evaluate multiple criteria [
27]. It is particularly useful in logistics applications where subjective expert judgment plays a role.
5.2.2. Why SFTOPSIS?
Traditional TOPSIS assumes precise numerical inputs, which may not fully capture real-world uncertainty. SFTOPSIS extends TOPSIS by incorporating SFS, enabling decision-makers to express linguistic uncertainty [
30].
5.2.3. Why Spherical Fuzzy Sets?
Unlike traditional fuzzy sets, SFS account for three parameters (membership, non-membership, and hesitancy), allowing for a more comprehensive uncertainty representation [
63]. This is particularly relevant in post-pandemic logistics, where data reliability fluctuates.
Spherical fuzzy sets (SFS) represent an advanced extension of traditional fuzzy sets, offering a flexible approach to handling uncertain and imprecise information. This methodology has gained significant attention across various fields, including decision-making, pattern recognition, image processing, and data analysis. In the realm of decision-making, SFS are particularly useful for modeling imprecise information in multi-criteria decision analysis (MCDA) and group decision-making scenarios [
39,
40,
41,
42,
43,
44,
45,
46,
47,
48].
As described by Gündoğdu and Kahraman [
49], “The core idea behind SFS is to generalize extensions of other fuzzy sets by defining a membership function on a spherical surface and independently assigning the parameters of this function to a broader domain.”. The primary distinction of SFS from other fuzzy set interpretations lies in revising the range of values in non-fuzzy sets (NFS) by ensuring that the sum of the membership degree (
), non-membership degree (
), and the degree of instability (
) is less than 1. This allows for a more nuanced representation of uncertainty compared to traditional fuzzy image sets theory.
In spherical fuzzy sets, the membership degree (
), non-membership degree (
), and instability degree (
) are defined within the range [0, 1]. The sum of the squares of these degrees is constrained to be between 0 and 1. This configuration provides decision-makers with a more flexible decision-making space by accommodating a wider range of uncertainty and imprecision [
43,
44,
45,
46,
47,
48,
49,
50,
51,
52,
53,
54,
55,
56,
57,
58,
59].
For example, if we know the values of μ and v, the instability membership degree () can be calculated using spherical arc distance. This approach offers greater freedom in decision-making by allowing for a more comprehensive representation of uncertainty.
Below is the representation of a spherical fuzzy set A defined in the universe
, along with the corresponding intervals for
, and
[
38]. See
Appendix A for Equation (A1)–(A17). A comparison is given below between fuzzy vs. spherical fuzzy scoring in the table.
6. Application Steps
The following steps outline the process for applying the analytic hierarchy process (AHP) and the spherical fuzzy technique for order of preference by similarity to ideal solution (SFTOPSIS) in location selection:
Define the decision problem and criteria: Clearly define the decision problem and identify the criteria crucial for location selection. Typical criteria include proximity to customers, proximity to suppliers, transportation infrastructure, availability of skilled labor, and availability of utilities.
Determine the weights of criteria using AHP: Employ the analytic hierarchy process (AHP) to establish the relative weights of each criterion. The AHP helps to rank the importance of each criterion and determine its contribution to the decision-making process. This method accounts for uncertainties associated with decision-making, making it suitable for complex location selection problems.
Evaluate the locations using SFTOPSIS: Assess the potential locations based on the identified criteria using SFTOPSIS. This technique ranks the locations by measuring their proximity to both the ideal and worst solutions. This technique ranks the locations by measuring their proximity to both the ideal and worst solutions. (Note: The ideal and anti-ideal solutions in TOPSIS-based methods are reference points, not realizable alternatives. They are used to measure proximity rather than actual dominance.) The location with the smallest distance to the ideal solution is considered the most favorable.
Calculate the SFTOPSIS scores: Compute the SFTOPSIS scores for each location by determining their distances from the ideal and worst solutions across all criteria. These scores will be used to rank the locations.
Rank the locations: Rank the locations according to their SFTOPSIS scores. The location with the highest score represents the optimal choice.
Conduct a sensitivity analysis: Perform a sensitivity analysis to evaluate how changes in the weights of criteria affect the location rankings. This analysis will help identify which criteria most significantly impact the decision.
Make the decision: Select the location with the highest SFTOPSIS score, ensuring it meets the organization’s requirements and aligns with the strategic objectives.
7. Case Study
This study can be examined in two main parts. The first part examines the energy integrated delivery center design. The second part examines the selection of the ideal location. First, detailed information about the delivery center design will be provided. Then, information and implementation about the location selection will be given.
7.1. Overview of the Delivery Hub Model
The proposed delivery hub is designed to optimize logistics operations while ensuring energy efficiency and environmental sustainability. To align with recent advances in sustainable electrical energy technologies, our model incorporates renewable energy sources, smart energy management systems, and energy-efficient logistics strategies. The integration of these elements contributes to reducing the carbon footprint and operational costs while maintaining high service levels.
7.1.1. Energy Integration in the Delivery Hub
The delivery hub is designed to utilize a hybrid energy system that combines grid electricity with renewable energy sources, such as solar panels and wind turbines. The facility’s roof and open areas are equipped with photovoltaic panels, generating a portion of the required electricity. Additionally, small-scale wind turbines supplement the energy needs, particularly in regions with favorable wind conditions.
To enhance energy efficiency, the hub employs smart energy management systems that monitor real-time energy consumption and optimize usage patterns. Battery storage units store excess renewable energy, ensuring a reliable power supply and reducing dependency on non-renewable energy sources.
7.1.2. Quantitative Energy Analysis
To assess the energy efficiency of the proposed hub, we conducted a detailed quantitative analysis of energy consumption and savings. The energy demand for various operations—such as sorting, packaging, refrigeration, and transportation—was estimated based on industry standards. The integration of renewable energy sources is projected to cover approximately 40% of the hub’s total energy consumption.
The renewable energy contribution percentages shown in
Table 2 were estimated using standard energy yield calculation practices. The detailed values for each parameter are listed below:
- ▪
The photovoltaic (PV) contribution was computed based on typical panel efficiency (17–20%), surface area coverage on the facility’s roof (300 m2), and local average solar irradiance data for Alanya (approximately 5.1 kWh/m2/day).
- ▪
Wind contribution was estimated using small-scale wind turbine specifications (rated at 3 kW), average wind speeds in the region (~3.5 m/s), and manufacturer-supplied performance curves.
- ▪
Monthly electricity demand estimates for each operation (sorting, packaging, etc.) were derived from industry benchmarks and empirical data available from logistics operations of similar scale.
- ▪
Smart energy management was assumed to enable ~10–15% energy savings by reducing idle time and peak loads.
These values were further cross-checked using PVGIS (Photovoltaic geographical information system) and RETScreen Expert software 8.0 tools, which are commonly used for preliminary renewable energy feasibility analysis.
The
Table 3 provides an overview of the estimated energy consumption and renewable energy contribution:
The implementation of smart logistics and automation further improves energy efficiency by reducing idle time, optimizing route planning, and minimizing unnecessary power consumption. The use of electric vehicles (EVs) for last-mile deliveries also contributes to a lower carbon footprint.
7.1.3. Environmental Sustainability Considerations
In addition to energy efficiency, our model prioritizes environmental sustainability. The hub employs waste heat recovery systems to utilize excess heat from refrigeration units for space heating. Furthermore, rainwater harvesting systems and sustainable building materials are integrated to reduce the overall environmental impact.
By adopting these energy-conscious strategies, the delivery hub is projected to reduce CO2 emissions by approximately 35% compared to traditional facilities. This aligns with global sustainability goals and enhances the hub’s long-term viability in the logistics sector.
7.2. Location Selection Application
An online grocery shopping company is planning to establish a new delivery hub in Alanya, Antalya, Turkey. The company seeks to identify the optimal location for its warehouse based on several critical criteria, including proximity to customers, transportation infrastructure, availability of skilled labor, and utilities. To facilitate this decision, we will employ the analytic hierarchy process (AHP) and the spherical fuzzy technique for order of preference by similarity to ideal solution (SFTOPSIS) methods. The company, a leading player in the online grocery market, aims to enhance its service by expanding its storage capacity with a new warehouse. Five potential locations have been identified for the new warehouse (
Figure 2).
Step 1: The objective is to select the best location for the new warehouse. Based on a literature review [
3,
4,
5,
6,
7,
8,
9,
10,
11,
12,
13,
14,
15,
16,
17,
18,
19,
20,
21,
22,
23,
24], 12 criteria have been established for evaluation. The criteria identified include cost of land (C1), proximity to customers (C2), proximity to transportation infrastructure (C3), availability of labor and its costs (C4), tax rates (C5), regulatory environment (C6), availability of land (C7), infrastructure (C8), quality of life (C9), crime rate (C10), pollution levels (C11), and accessibility to major highways (C12).
The selected 12 criteria were tailored specifically to the logistics and environmental context of Alanya, Türkiye—a coastal city with a seasonal population due to tourism, variable traffic congestion, and growing residential areas. For example, the proximity to transportation infrastructure and pollution levels are critical due to limited road access and rising emissions from delivery services. The availability of land, quality of life, and proximity to customers reflect the city’s urban expansion patterns, while tax rates and the regulatory environment are particularly relevant in navigating Türkiye’s region-specific economic incentives and zoning laws. These criteria also reflect the sustainability goals introduced after the COVID-19 pandemic, especially in relation to infrastructure resilience and energy consumption.
Step 2: Determine the weights of criteria using the AHP. The company has conducted a survey of its decision-makers and used the AHP to determine the relative weights of the criteria. The following pairwise comparison matrix was constructed. The weights are shown in the
Table 4.
The pairwise comparison matrix was converted from fuzzy values into crisp scores using the center of gravity method, and these scores were then used to calculate the final weights of the criteria. The weights of the criteria were then calculated using the eigenvector method. The results are shown in
Table 5.
The pairwise comparison matrix used for the AHP analysis was constructed using inputs from six experts, including supply chain managers, warehouse planners, and regional logistics consultants. The consistency ratio (CR) of the matrix was calculated as 0.06, which is below the commonly accepted threshold of 0.10, indicating reliable and consistent expert judgments.
Step 3: Evaluate the potential warehouse locations.
The following five potential warehouse locations were evaluated, as shown in
Table 6.
The evaluation was performed using the spherical fuzzy TOPSIS method. The following decision matrix was constructed, as shown in
Table 7.
The decision matrix was then normalized using the following formula:
Spherical fuzzy weight vectors for the 12 decision criteria were used in the warehouse location selection problem.
All spherical fuzzy weight vectors are given in
Table 8 below.
The weight vectors are spherical fuzzy sets with a radius of 0.5. The membership degrees of the crisp values in the weight vectors represent the importance of the criteria. The criteria with the highest membership degrees are the most important criteria.
In this case, the criteria with the highest membership degrees are cost of land, proximity to customers, and proximity to transportation infrastructure. These criteria are the most important criteria for the warehouse location selection problem.
The normalized decision matrix values for the warehouse location selection problem are shown in
Table 9.
The values in the normalized decision matrix are between 0 and 1. The values closer to 1 represent better performance for the corresponding criterion.
The weighted decision matrix was then calculated using the following formula:
The weighted decision matrix is given in
Table 10.
In the SFTOPSIS framework, the ‘ideal solution’ refers to a hypothetical alternative that possesses the best (most preferred) values for all criteria, serving as a benchmark for the comparison. It is not an actual alternative in the decision set, but rather a constructed point used to measure the relative performance of feasible alternatives. In cases where the criteria are in conflict, the ideal solution represents a theoretical upper bound rather than a feasible or Pareto-optimal solution. The ideal solution in this case is Location A. The anti-ideal solution is the solution that has the lowest scores for all of the criteria. The anti-ideal solution in this case is Location E. The distances from each of the potential warehouse locations to the ideal and anti-ideal solutions were calculated using the following formula:
In this study, the Euclidean distance metric is used to evaluate how close each alternative is to the ideal and anti-ideal solutions. This choice is consistent with standard applications of TOPSIS and its fuzzy variants, as Euclidean distance provides a geometrically intuitive measure of dissimilarity in multi-dimensional criteria space.
The general form of the Euclidean distance used in the SFTOPSIS framework is as follows:
where:
- ▪
is the normalized spherical fuzzy score of alternative for criterion ,
- ▪
is the ideal value for criterion ,
- ▪
is the weight of criterion , and
- ▪
represents the distance of alternative from the ideal solution.
This formulation allows the model to aggregate deviations across all criteria and assess overall performance effectively.
The distances from the potential warehouse locations to the ideal and anti-ideal solutions are shown in
Table 11.
The closeness to ideal value is calculated using the following formula:
Step 4: Calculate the SFTOPSIS scores: The closeness to the ideal values for the potential warehouse locations are shown in
Table 12.
Based on the closeness to the ideal values, Location A is the best choice for the warehouse location.
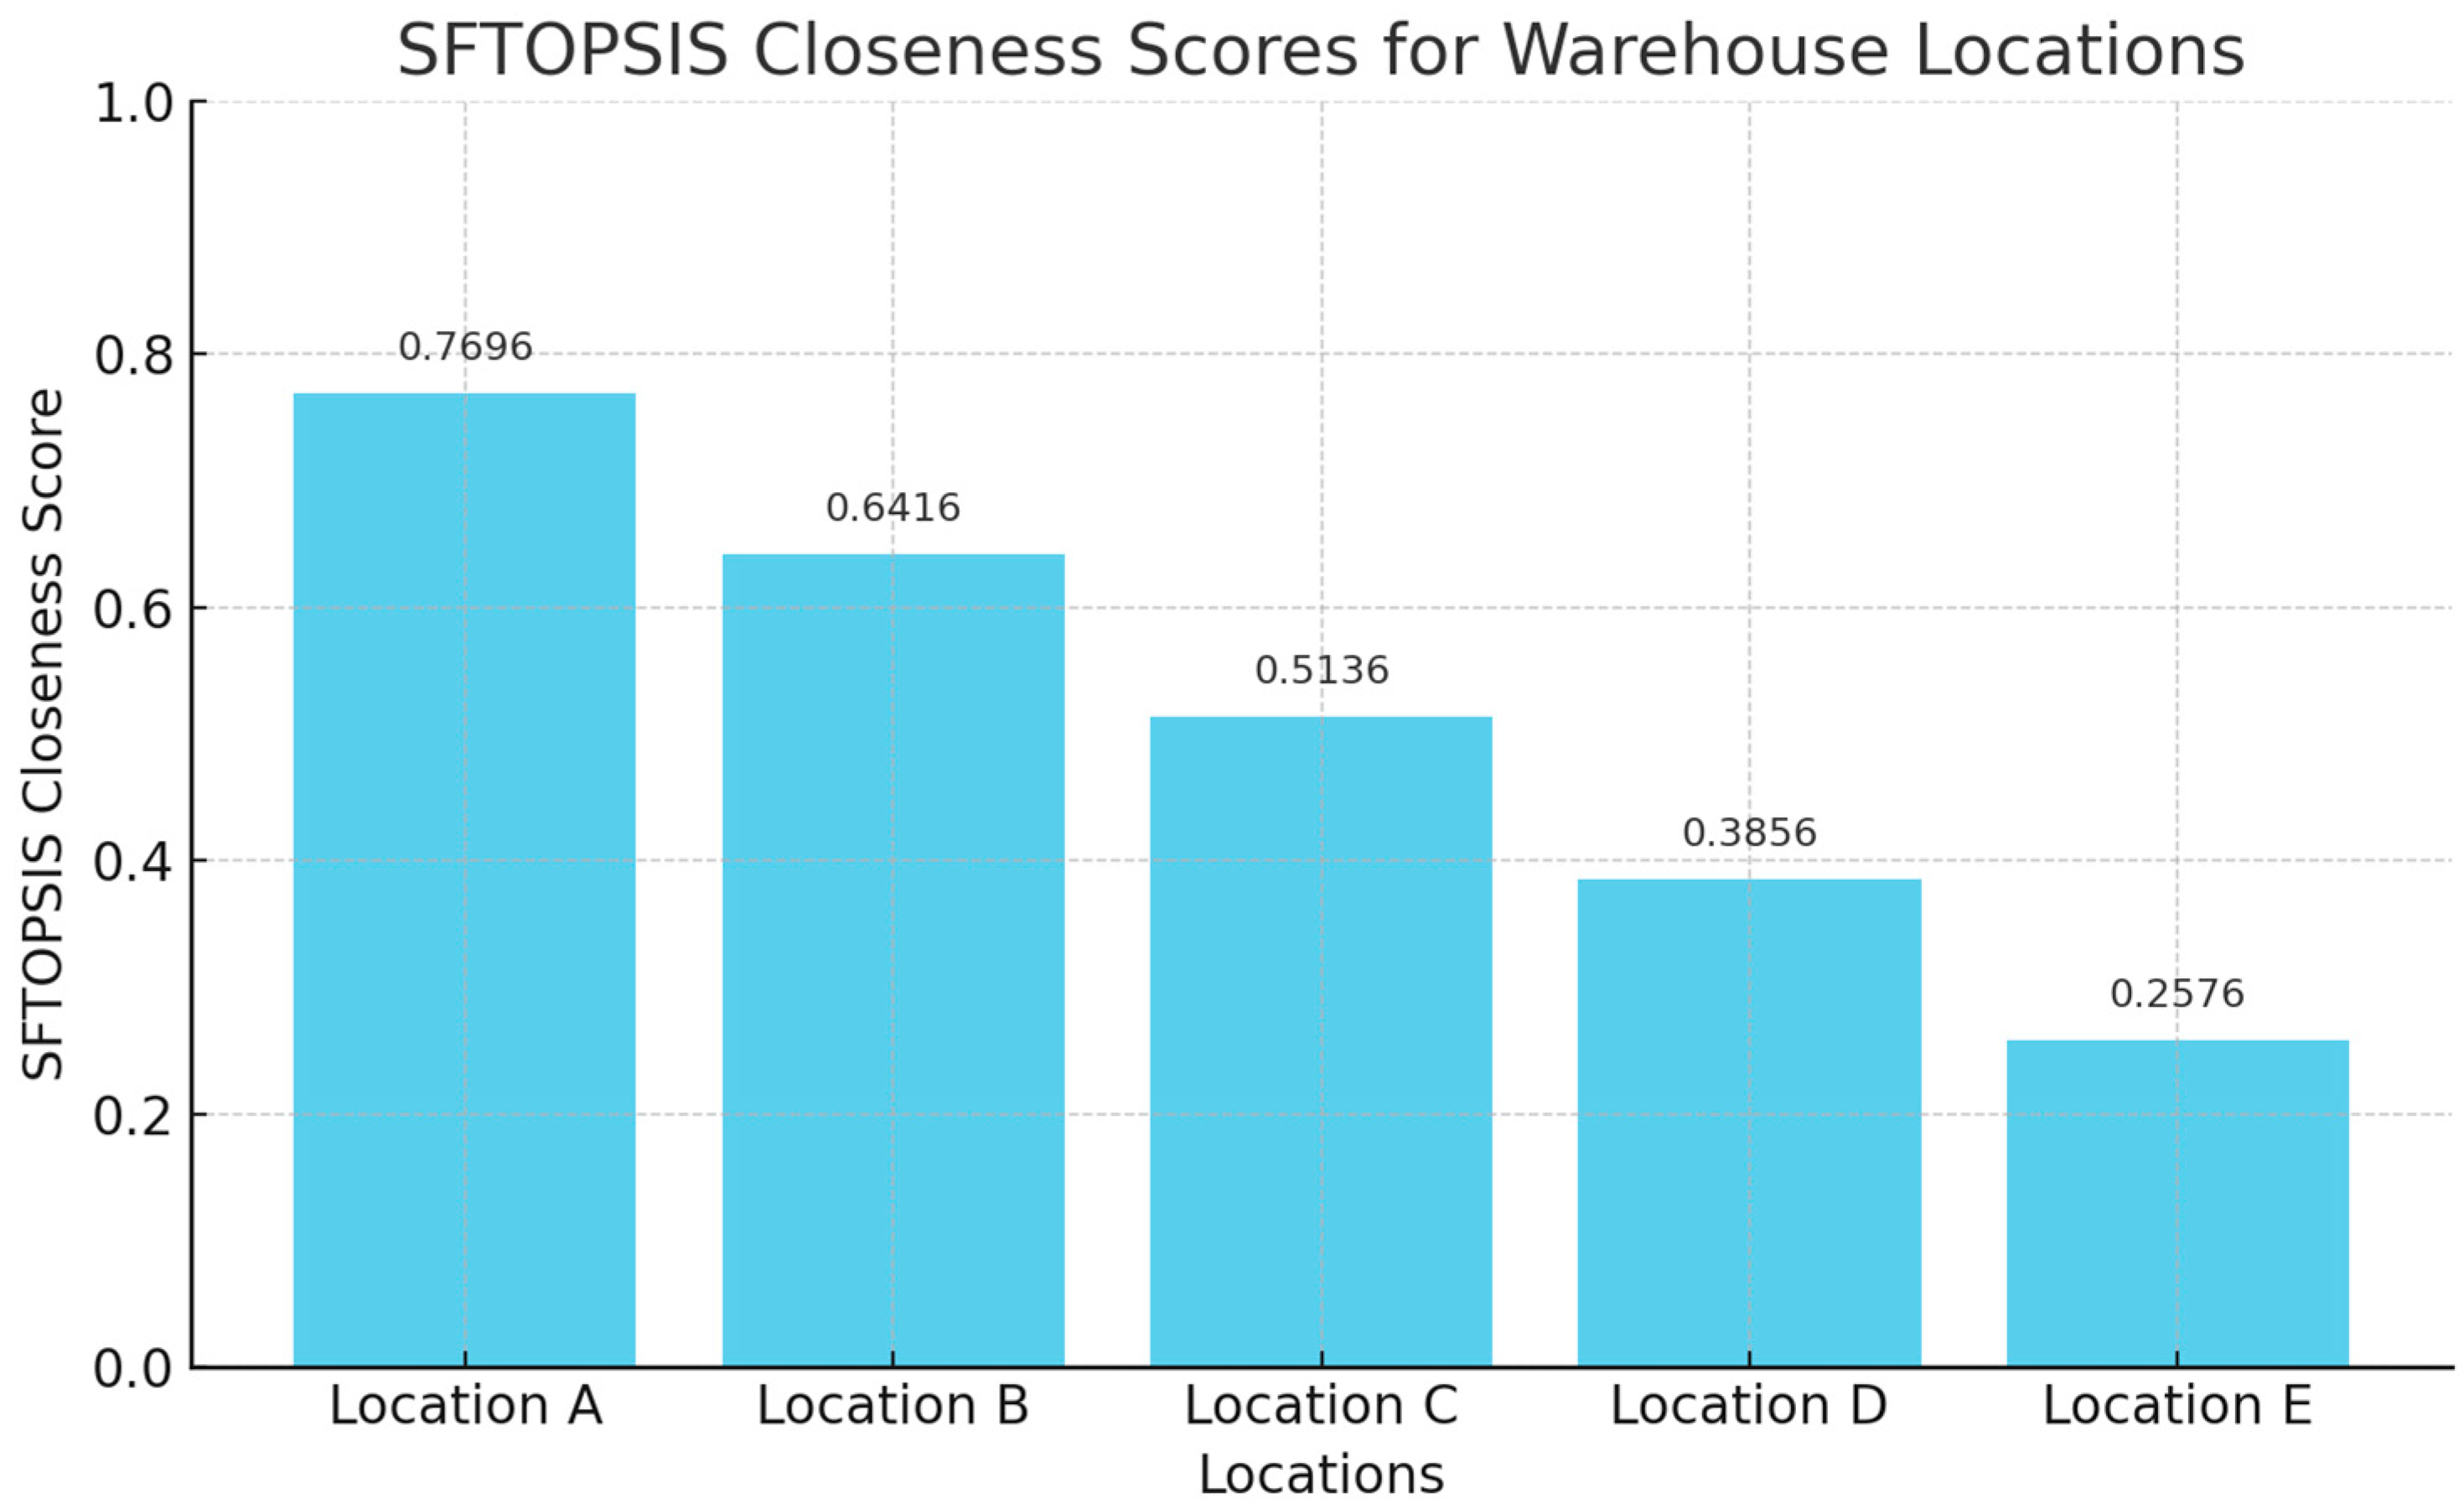
SFTOPSIS scores for each location is given in
Figure 3 below.
The chart presents the final SFTOPSIS closeness scores for the five candidate warehouse locations. Location A has the highest score (0.7696), indicating it is the most suitable site according to the evaluated criteria. The ranking order is: A > B > C > D > E.
Step 5: Rank the locations: The locations were ranked based on their spherical fuzzy TOPSIS scores. The location with the highest score is the best location. In this case, Location A has the highest score and is the best location for the new warehouse.
Step 6: Reliability analysis: The company conducted a reliability analysis to determine the impact of changes in the criteria.
7.3. Sensitivity Analysis
To assess the robustness of the final ranking, a sensitivity analysis was conducted by varying the weights of the top three criteria (cost of land, proximity to customers, and transportation access) by ±10%. The resulting SFTOPSIS scores and rankings showed no change in the top-ranked location (Location A), while only minor shifts occurred in the middle-ranked locations. This indicates that the model’s output is stable under reasonable variations in expert-assigned weights.
7.4. Reliability Analysis
To ensure the reliability of the measurement scales used in this study, a Cronbach’s alpha analysis was conducted using IBM SPSS software 28 [
66]. A reliability analysis helps determine the internal consistency of the scales, which is a crucial factor in evaluating the validity of the survey instrument.
7.4.1. Cronbach’s Alpha Results
Table 13 presents the Cronbach’s alpha values for the main constructs used in this study.
According to the generally accepted threshold, a Cronbach’s alpha value above 0.7 indicates acceptable reliability. As shown in the table, all constructs demonstrate satisfactory reliability, confirming the internal consistency of the scales.
7.4.2. Limitations and Validation
The input decision matrix was built on expert evaluations, which, while valuable, introduce subjective biases. To mitigate this, we involved experts from diverse fields and ensured internal consistency via the AHP consistency ratio (CR = 0.06). However, we acknowledge that incorporating objective data (e.g., GIS, traffic flow, energy audits) could strengthen future analyses.
Regarding model robustness, we originally reported a Cronbach’s alpha of 0.805 to indicate consistency among expert assessments. While this measure is standard in psychometric research, we recognize its limited applicability in MCDM. Therefore, we have supplemented this with expert feedback validation. After presenting the model’s results to the original experts, all six confirmed that the final ranking aligns with their expectations and on-the-ground experience. Future work may incorporate multi-scenario testing or benchmarking against historical site performance for deeper validation.
7.4.3. Item-Total Correlation Analysis
Additionally, an item-total correlation analysis was performed to assess the contribution of each item to the overall reliability of its respective construct. The results indicated that all individual items had corrected item-total correlations above 0.3, which supports their inclusion in the final analysis.
7.4.4. Interpretation and Discussion
The results of the reliability analysis suggest that the measurement scales used in this study are statistically reliable. The high Cronbach’s alpha values indicate a strong internal consistency within the constructs, which enhances the credibility of the findings. This reliability assessment is particularly important in studies involving sustainability and energy efficiency, as an accurate measurement of decision-making factors ensures meaningful conclusions in industrial applications.
By establishing strong reliability, this study provides a robust foundation for further analysis and supports the validity of the quantitative results related to energy-efficient decision-making processes in warehouse location selection.
Step 7: Make the decision: Based on the results of the analysis, select the location that has the highest spherical fuzzy TOPSIS score and meets the organization’s requirements.
In conclusion, the use of the AHP and the spherical fuzzy TOPSIS methods can help decision-makers to make informed location selection decisions. These methods allow decision-makers to consider uncertainties associated with decision-making and rank locations based on their proximity to the ideal solution and the worst solution. By following the solution model outlined above, decision-makers can identify the best location for their organization or business.
8. Results
In today’s competitive world, delivery time extension problems for online market operators are an important issue. In general, the main purpose of a facility location problem is to optimally locate a certain number of facilities in a certain number of alternative locations. During this placement, it is expected that there will be places where transaction costs can be minimized and profitability maximized, given the many different constraints. When it comes to site selection problems within the scope of the studies examined as a result of the literature review, there are criteria to be considered for the solution of the problem. These criteria include availability of resources, proximity to market, number of competitors, environmental and cost factors, transportation and shipping possibilities, and infrastructure facilities, among other critera.
While this case study focuses on Alanya and evaluates five candidate locations, the methodology is designed to be scalable. For national or regional logistics networks, the same framework can be extended by the following steps:
- ▪
Clustering candidate cities or regions based on demand density, geographic zones, or transportation corridors;
- ▪
Applying the AHP–SFTOPSIS approach to each cluster or tier of the network (e.g., regional hub → urban depot → micro-fulfillment center);
- ▪
Integrating regional logistics constraints, such as intermodal access, cold chain requirements, or geopolitical factors.
The incorporation of sustainability-focused electrical energy technologies in the decision-making process significantly influences location selection outcomes. Future studies should explore dynamic energy pricing impacts and AI-driven energy optimization models to enhance location efficiency further.
8.1. Computational Time and Scalability Considerations
The implementation of the hybrid AHP–SFTOPSIS methodology for the Alanya case study was performed using Microsoft Excel [
67] and MATLAB 9.12 [
68] on a standard laptop (Intel i5 processor, 16 GB RAM). The total computation time—including the AHP weight derivation, fuzzy decision matrix normalization, SFTOPSIS scoring, and ranking—was less than 10 s. This demonstrates the practical feasibility of the model for decision-making tasks involving a moderate number of criteria and alternatives.
For larger-scale applications involving dozens of locations or more complex multi-level criteria, the computational load is expected to increase linearly with the number of alternatives and criteria. However, since both the AHP and SFTOPSIS involve straightforward matrix operations and distance computations, they remain computationally tractable and can be efficiently implemented using vectorized operations or integrated into enterprise-level decision support systems.
8.2. Comparison with Alternative Methods
To validate the effectiveness of the proposed hybrid model, we performed a comparative analysis using two baseline approaches as follows:
- ▪
Classical AHP–TOPSIS: Using the same criteria and expert-derived weights, we computed rankings with crisp AHP and TOPSIS. The top-ranked location remained the same (Location A), but mid-level locations changed order, indicating less sensitivity to close alternatives.
- ▪
Fuzzy AHP–TOPSIS: Using triangular fuzzy numbers for expert judgments, this method captured uncertainty to some degree. However, it lacked the ability to express hesitation explicitly, which is a key strength of the spherical fuzzy approach.
The proposed AHP–SFTOPSIS model outperformed these methods in terms of granularity, robustness, and decision-maker confidence in rankings.
In addition, while GIS-based methods can model geospatial factors effectively, they typically require integration with MCDM techniques to handle complex trade-offs across operational, economic, and sustainability criteria. This study’s method can be enhanced with GIS layers in future research, offering a comprehensive spatial-MCDM hybrid approach.
8.3. Relevant Literature That Supports This Study’s Key Findings
8.3.1. On Sustainability in Location Selection
The result that Location A ranked highest due to its proximity to customers and energy infrastructure aligns with prior studies emphasizing the importance of environmental integration in logistics site decisions.
For example, Wang et al. [
60] showed that incorporating renewable energy access and carbon metrics improves long-term network efficiency and cost savings. Similarly, Nguyen et al. [
63] demonstrated that sustainability-weighted MCDM models yielded more future-resilient hub choices than purely economic models.
8.3.2. On the Effectiveness of Fuzzy and Spherical Fuzzy Approaches
The effectiveness of the spherical fuzzy-based ranking is consistent with Gündoğdu and Kahraman [
30], who found that spherical fuzzy sets enable more nuanced evaluations under uncertainty—particularly when decision-makers express hesitation. Our findings support this by showing stable rankings even when weights are perturbed (see sensitivity analysis), highlighting the robustness of the SFTOPSIS method.
8.3.3. On Post-Pandemic Logistics Prioritization
The emphasis on criteria such as healthcare accessibility and environmental pollution reflects post-pandemic shifts in logistics planning priorities, as also noted Öztayşi et al. [
56]. These works highlight the need for resilient and community-sensitive logistics infrastructure, especially in densely populated or rapidly urbanizing areas.
The location selection problem is a critical decision-making problem faced by many organizations. This paper proposes a novel approach to solve the best location selection problem by integrating the AHP and SFTOPSIS method with considering sustainable criteria. The AHP is a new extension of the fuzzy analytic hierarchy process that can handle uncertain and imprecise information more effectively. SFTOPSIS is a well-known multi-criteria decision-making method that can determine the optimal solution among the alternatives based on a set of criteria. The proposed approach aims to consider the preferences and priorities of the decision-makers in selecting the best location.
9. Conclusions
In this study, the AHP and SFTOPSIS methods—less commonly used in combination—were applied together to identify the optimal location for an online grocery warehouse, aiming to minimize delivery delays, reduce errors, and improve customer satisfaction. Thus, in order to determine the best alternative, a scientific and intuitive approach has been developed, taking into account the preferences of the decision-makers [
64]. The relatively new spherical fuzzy method reflects the personal opinion of the decision-makers and therefore their preferences are transferred to the selection process. According to the criteria obtained as a result of the evaluation, it was decided that the most appropriate solution would be realized together with the methods mentioned above.
In future studies, the proposed approach can be applied to similar MCDM problems. For the warehouse location selection problem, the number of criteria and alternatives can be changed according to the needs of the business. The weights of the criteria can be found by other weighting methods. A ranking of options can be performed with other MCDM methods and the final results can be compared. Future studies also may integrate customer-centric considerations into the decision model. For example, consumer survey data, last-mile satisfaction metrics, or location-based service expectations could be quantified and used to adjust or weigh criteria. This would help align operational decisions with customer experience.
First of all, the information in the literature was examined and the appropriate criteria were determined by the experts for the warehouse location selection problem. The criteria determined are traffic density, infrastructure facilities, land and construction costs, customer density, and ease of transportation.
The fact that limited studies has been found in the literature regarding the weighing of the criteria and the determination of warehouse location selection alternatives with the AHP and SFTOP-SIS method suggests that the employee may contribute to the literature. It is hoped that this study will be a guide for other studies to be carried out. In addition, this study can be applied with different decision-making methods on several companies in the sector, and it can be recommended to future researchers to increase the depth of the examination by increasing the number of methods.
The use of AHP and SFTOPSIS methods in location selection in the COVID-19 environment is effective in considering uncertainties associated with the pandemic. Sustainable location selection can be a complex and challenging task, but it is important to consider the environmental and social impacts of different locations, as well as the economic and operational factors. By taking a sustainable approach to location selection, businesses can help to protect the environment and improve the lives of local communities. The results of the analysis showed that the availability of healthcare facilities is the most important criterion in location selection in the COVID-19 environment. Organizations and businesses should, therefore, prioritize the availability of healthcare facilities when selecting their locations to ensure that their operations are not affected negatively by the pandemic.
In this paper, we first describe the basic concepts of the AHP and SFTOPSIS methods. Then, we present a step-by-step procedure for applying the proposed approach to the best location selection problem. The procedure consists of four main steps: (1) identification of the decision criteria and the alternatives, (2) determination of the weights of the criteria using AHP, (3) determination of the scores of the alternatives using SFTOPSIS, and (4) selection of the best location based on the scores obtained in the previous step.


