
A Simple Method to Determine Pheomelanin Content and Structure in FFPE Human Melanoma Specimens

 , , , , and
Abstract

1. Introduction
2. Materials and Methods
2.1. Material
2.2. Preparation of FFPE for Analysis
2.3. Reagents and Compounds
2.4. Preparation of Reference Synthetic Melanins
2.5. Py-GC/MS/MS Analysis
3. Results and Discussion
4. Conclusions
Supplementary Materials
Author Contributions
Funding
Institutional Review Board Statement
Data Availability Statement
Conflicts of Interest
References
- Elder, D.E.; Bastian, B.C.; Cree, I.A.; Massi, D.; Scolyer, R.A. The 2018 World Health Organization Classification of Cutaneous, Mucosal, and Uveal Melanoma: Detailed Analysis of 9 Distinct Subtypes Defined by Their Evolutionary Pathway. Arch. Pathol. Lab. Med. 2020, 144, 500–522. [Google Scholar] [CrossRef] [PubMed]
- Saud, A.; Sagineedu, S.; Ng, H.-S.; Stanslas, J.; Lim, J. Melanoma Metastasis: What Role Does Melanin Play? (Review). Oncol. Rep. 2022, 48, 217. [Google Scholar] [CrossRef] [PubMed]
- El Sharouni, M.-A.; Van Diest, P.J.; Witkamp, A.J.; Sigurdsson, V.; Van Gils, C.H. Subtyping Cutaneous Melanoma Matters. JNCI Cancer Spectr. 2020, 4, pkaa097. [Google Scholar] [CrossRef] [PubMed]
- Fortarezza, F.; Cazzato, G.; Ingravallo, G.; Dei Tos, A.P. The 2023 WHO Updates on Skin Tumors: Advances since the 2018 Edition. Pathologica 2024, 116, 193–206. [Google Scholar] [CrossRef]
- Wiśniewski, P.; Szumera-Ciećkiewicz, A.; Nasierowska-Guttmejer, A. New Pathomorphological Classification of Melanomas. Nowotw. J. Oncol. 2019, 69, 103–107. [Google Scholar] [CrossRef]
- Rutkowski, P.; Wysocki, P.J.; Nasierowska-Guttmejer, A.; Jeziorski, A.; Wysocki, W.M.; Kalinka, E.; Świtaj, T.; Kozak, K.; Kamińska-Winciorek, G.; Czarnecka, A.M.; et al. Cutaneous Melanoma. Oncol. Clin. Pract. 2020, 16, 163–182. [Google Scholar] [CrossRef]
- Park, H.Y.; Kosmadaki, M.; Yaar, M.; Gilchrest, B.A. Cellular Mechanisms Regulating Human Melanogenesis. Cell. Mol. Life Sci. 2009, 66, 1493–1506. [Google Scholar] [CrossRef]
- Gillbro, J.M.; Olsson, M.J. The Melanogenesis and Mechanisms of Skin-lightening Agents—Existing and New Approaches. Int. J. Cosmet. Sci. 2011, 33, 210–221. [Google Scholar] [CrossRef]
- Dzierżęga-Lęcznar, A.; Kurkiewicz, S.; Tam, I.; Marek, Ł.; Stępień, K. Pheomelanin Content of Cultured Human Melanocytes from Lightly and Darkly Pigmented Skin: A Pyrolysis-Gas Chromatography/Tandem Mass Spectrometry Study. J. Anal. Appl. Pyrolysis 2017, 124, 349–354. [Google Scholar] [CrossRef]
- Dall’Olmo, L.; Papa, N.; Surdo, N.C.; Marigo, I.; Mocellin, S. Alpha-Melanocyte Stimulating Hormone (α-MSH): Biology, Clinical Relevance and Implication in Melanoma. J. Transl. Med. 2023, 21, 562. [Google Scholar] [CrossRef]
- Nordlund, J.J.; Boissy, R.E.; Hearing, V.J.; King, R.A.; Oetting, W.S.; Ortonne, J.P. The Pigmentary System: Physiology and Pathophysiology, 2nd ed.; Blackwell Publishing Ltd.: Hoboken, NJ, USA, 2007; ISBN 978-1-4051-2034-0. [Google Scholar]
- Simon, J.D.; Peles, D.; Wakamatsu, K.; Ito, S. Current Challenges in Understanding Melanogenesis: Bridging Chemistry, Biological Control, Morphology, and Function. Pigment Cell Melanoma Res. 2009, 22, 563–579. [Google Scholar] [CrossRef] [PubMed]
- Nezirevic Dernroth, D.; Kågedal, B.; Hansson, C. Pheomelanin Markers in Melanoma with Reference to Their Excretion into Urine; Linköping University Electronic Press: Linköping, Sweden, 2009; ISBN 978-91-7393-566-1. [Google Scholar]
- Wakamatsu, K.; Fukushima, S.; Minagawa, A.; Omodaka, T.; Hida, T.; Hatta, N.; Takata, M.; Uhara, H.; Okuyama, R.; Ihn, H. Significance of 5-S-Cysteinyldopa as a Marker for Melanoma. Int. J. Mol. Sci. 2020, 21, 432. [Google Scholar] [CrossRef]
- Katoh, Y.; Hara, H.; Harada, T.; Hirai, S. Combination of Serum 5-S-Cysteinyldopa, Melanoma Inhibitory Activity and IL-8 Improves the Diagnostic Accuracy of Malignant Melanoma Compared with Individual Markers. Medicine 2022, 101, e30471. [Google Scholar] [CrossRef]
- Wakamatsu, K.; Yokochi, M.; Naito, A.; Kageshita, T.; Ito, S. Comparison of Phaeomelanin and Its Precursor 5-S-Cysteinyldopa in the Serum of Melanoma Patients. Melanoma Res. 2003, 13, 357. [Google Scholar] [CrossRef]
- Umemura, H.; Yamasaki, O.; Kaji, T.; Otsuka, M.; Asagoe, K.; Takata, M.; Iwatsuki, K. Usefulness of Serum 5-S-Cysteinyl-Dopa as a Biomarker for Predicting Prognosis and Detecting Relapse in Patients with Advanced Stage Malignant Melanoma. J. Dermatol. 2017, 44, 449–454. [Google Scholar] [CrossRef]
- Salopek, T.G.; Yamada, K.; Ito, S.; Jimbow, K. Dysplastic Melanocytic Nevi Contain High Levels of Pheomelanin: Quantitative Comparison of Pheomelanin/Eumelanin Levels Between Normal Skin, Common Nevi, and Dysplastic Nevi. Pigment Cell Res. 1991, 4, 172–179. [Google Scholar] [CrossRef]
- Mitsui, H.; Kiecker, F.; Shemer, A.; Cannizzaro, M.V.; Wang, C.Q.F.; Gulati, N.; Ohmatsu, H.; Shah, K.R.; Gilleaudeau, P.; Sullivan-Whalen, M.; et al. Discrimination of Dysplastic Nevi from Common Melanocytic Nevi by Cellular and Molecular Criteria. J. Investig. Dermatol. 2016, 136, 2030–2040. [Google Scholar] [CrossRef]
- Wang, H.; Osseiran, S.; Roider, E.; Fisher, D.E.; Evans, C.L. New Imaging-Based Biomarkers for Melanoma Diagnosis Using Coherent Raman Scattering Microscopy (Conference Presentation). In Photonic Therapeutics and Diagnostics XII; SPIE: Bellingham, WA, USA, 2016; Volume 9689, p. 2-2. [Google Scholar]
- Pavel, S.; van Nieuwpoort, F.; van der Meulen, H.; Out, C.; Pizinger, K.; Cetkovská, P.; Smit, N.P.M.; Koerten, H.K. Disturbed Melanin Synthesis and Chronic Oxidative Stress in Dysplastic Naevi. Eur. J. Cancer 2004, 40, 1423–1430. [Google Scholar] [CrossRef]
- Mitra, D.; Luo, X.; Morgan, A.; Wang, J.; Hoang, M.P.; Lo, J.; Guerrero, C.R.; Lennerz, J.K.; Mihm, M.C.; Wargo, J.A.; et al. An Ultraviolet-Radiation-Independent Pathway to Melanoma Carcinogenesis in the Red Hair/Fair Skin Background. Nature 2012, 491, 449–453. [Google Scholar] [CrossRef]
- Morgan, A.M.; Lo, J.; Fisher, D.E. How Does Pheomelanin Synthesis Contribute to Melanomagenesis?: Two Distinct Mechanisms Could Explain the Carcinogenicity of Pheomelanin Synthesis. BioEssays 2013, 35, 672–676. [Google Scholar] [CrossRef]
- Nasti, T.H.; Timares, L. MC 1R, Eumelanin and Pheomelanin: Their Role in Determining the Susceptibility to Skin Cancer. Photochem. Photobiol. 2015, 91, 188–200. [Google Scholar] [CrossRef] [PubMed]
- Rodríguez-Martínez, S.; Wakamatsu, K.; Galván, I. Increase of the Benzothiazole Moiety Content of Pheomelanin Pigment after Endogenous Free Radical Inducement. Dye. Pigment. 2020, 180, 108516. [Google Scholar] [CrossRef]
- Lembo, S.; Di Caprio, R.; Micillo, R.; Balato, A.; Monfrecola, G.; Panzella, L.; Napolitano, A. Light-independent Pro-inflammatory and Pro-oxidant Effects of Purified Human Hair Melanins on Keratinocyte Cell Cultures. Exp. Dermatol. 2017, 26, 592–594. [Google Scholar] [CrossRef]
- Piskounova, E.; Agathocleous, M.; Murphy, M.M.; Hu, Z.; Huddlestun, S.E.; Zhao, Z.; Leitch, A.M.; Johnson, T.M.; DeBerardinis, R.J.; Morrison, S.J. Oxidative Stress Inhibits Distant Metastasis by Human Melanoma Cells. Nature 2015, 527, 186–191. [Google Scholar] [CrossRef]
- Dzierzega-Lecznar, A.; Kurkiewicz, S.; Stepien, K.; Chodurek, E.; Wilczok, T.; Arzberger, T.; Riederer, P.; Gerlach, M. GC/MS Analysis of Thermally Degraded Neuromelanin from the Human Substantia Nigra. J. Am. Soc. Mass Spectrom. 2004, 15, 920–926. [Google Scholar] [CrossRef]
- Kurkiewicz, S.; Dzierżęga-Lęcznar, A.; Stanek-Widera, A.; Lange, D. Development of a Method for Isolation of Melanin from Archival FFPE Tissues of Human Melanoma for Structural Studies by Pyrolysis-Gas Chromatography-Tandem Mass Spectrometry. Adv. Hyg. Exp. Med. 2022, 76, 122–127. [Google Scholar] [CrossRef]
- Greco, G.; Wakamatsu, K.; Panzella, L.; Ito, S.; Napolitano, A.; D’Ischia, M. Isomeric Cysteinyldopas Provide a (Photo)Degradable Bulk Component and a Robust Structural Element in Red Human Hair Pheomelanin. Pigment Cell Melanoma Res. 2009, 22, 319–327. [Google Scholar] [CrossRef] [PubMed]
- Borges, C.R.; Roberts, J.C.; Wilkins, D.G.; Rollins, D.E. Relationship of Melanin Degradation Products to Actual Melanin Content: Application to Human Hair. Anal. Biochem. 2001, 290, 116–125. [Google Scholar] [CrossRef]
- Slominski, R.M.; Sarna, T.; Płonka, P.M.; Raman, C.; Brożyna, A.A.; Slominski, A.T. Melanoma, Melanin, and Melanogenesis: The Yin and Yang Relationship. Front. Oncol. 2022, 12, 842496. [Google Scholar] [CrossRef]

| Symbol * | Melanoma Subtype | Tumour Site | pTNM | Breslow Thickness (mm) | Clark Level | TILs | Vascular Invasion | Mitotic Rate (Number of Mitoses/mm²) | Lymph Node in Which Any Metastatic Tumour Cells Are Identified | Deparaffinised Sample Under Analysis |
|---|---|---|---|---|---|---|---|---|---|---|
| N1 | nodular | auricle | pT4a | 18 | V | No | Yes | 5 | 13/27 | primary tumour (N1p) |
| lymph node metastases (N1m) | ||||||||||
| N2 | nodular | sole | pT4b | 5 | IV | Yes | No | 20 | 0 | primary tumour |
| N3 | nodular | face | pT4b | 7 | III | Yes | No | 32 | 0 | primary tumour |
| N4 | nodular | shoulder | pT3a | 4 | IV | Yes | No | 8 | 0 | primary tumour |
| S1 | superficial spreading | chest | pT4b | 15 | IV | Yes | No | 3 | 12/25 | primary tumour (S1p) |
| lymph node metastases (S1m) | ||||||||||
| S2 | superficial spreading | shank | pT3a | 3.5 | III | Yes | No | 17 | 0 | primary tumour |
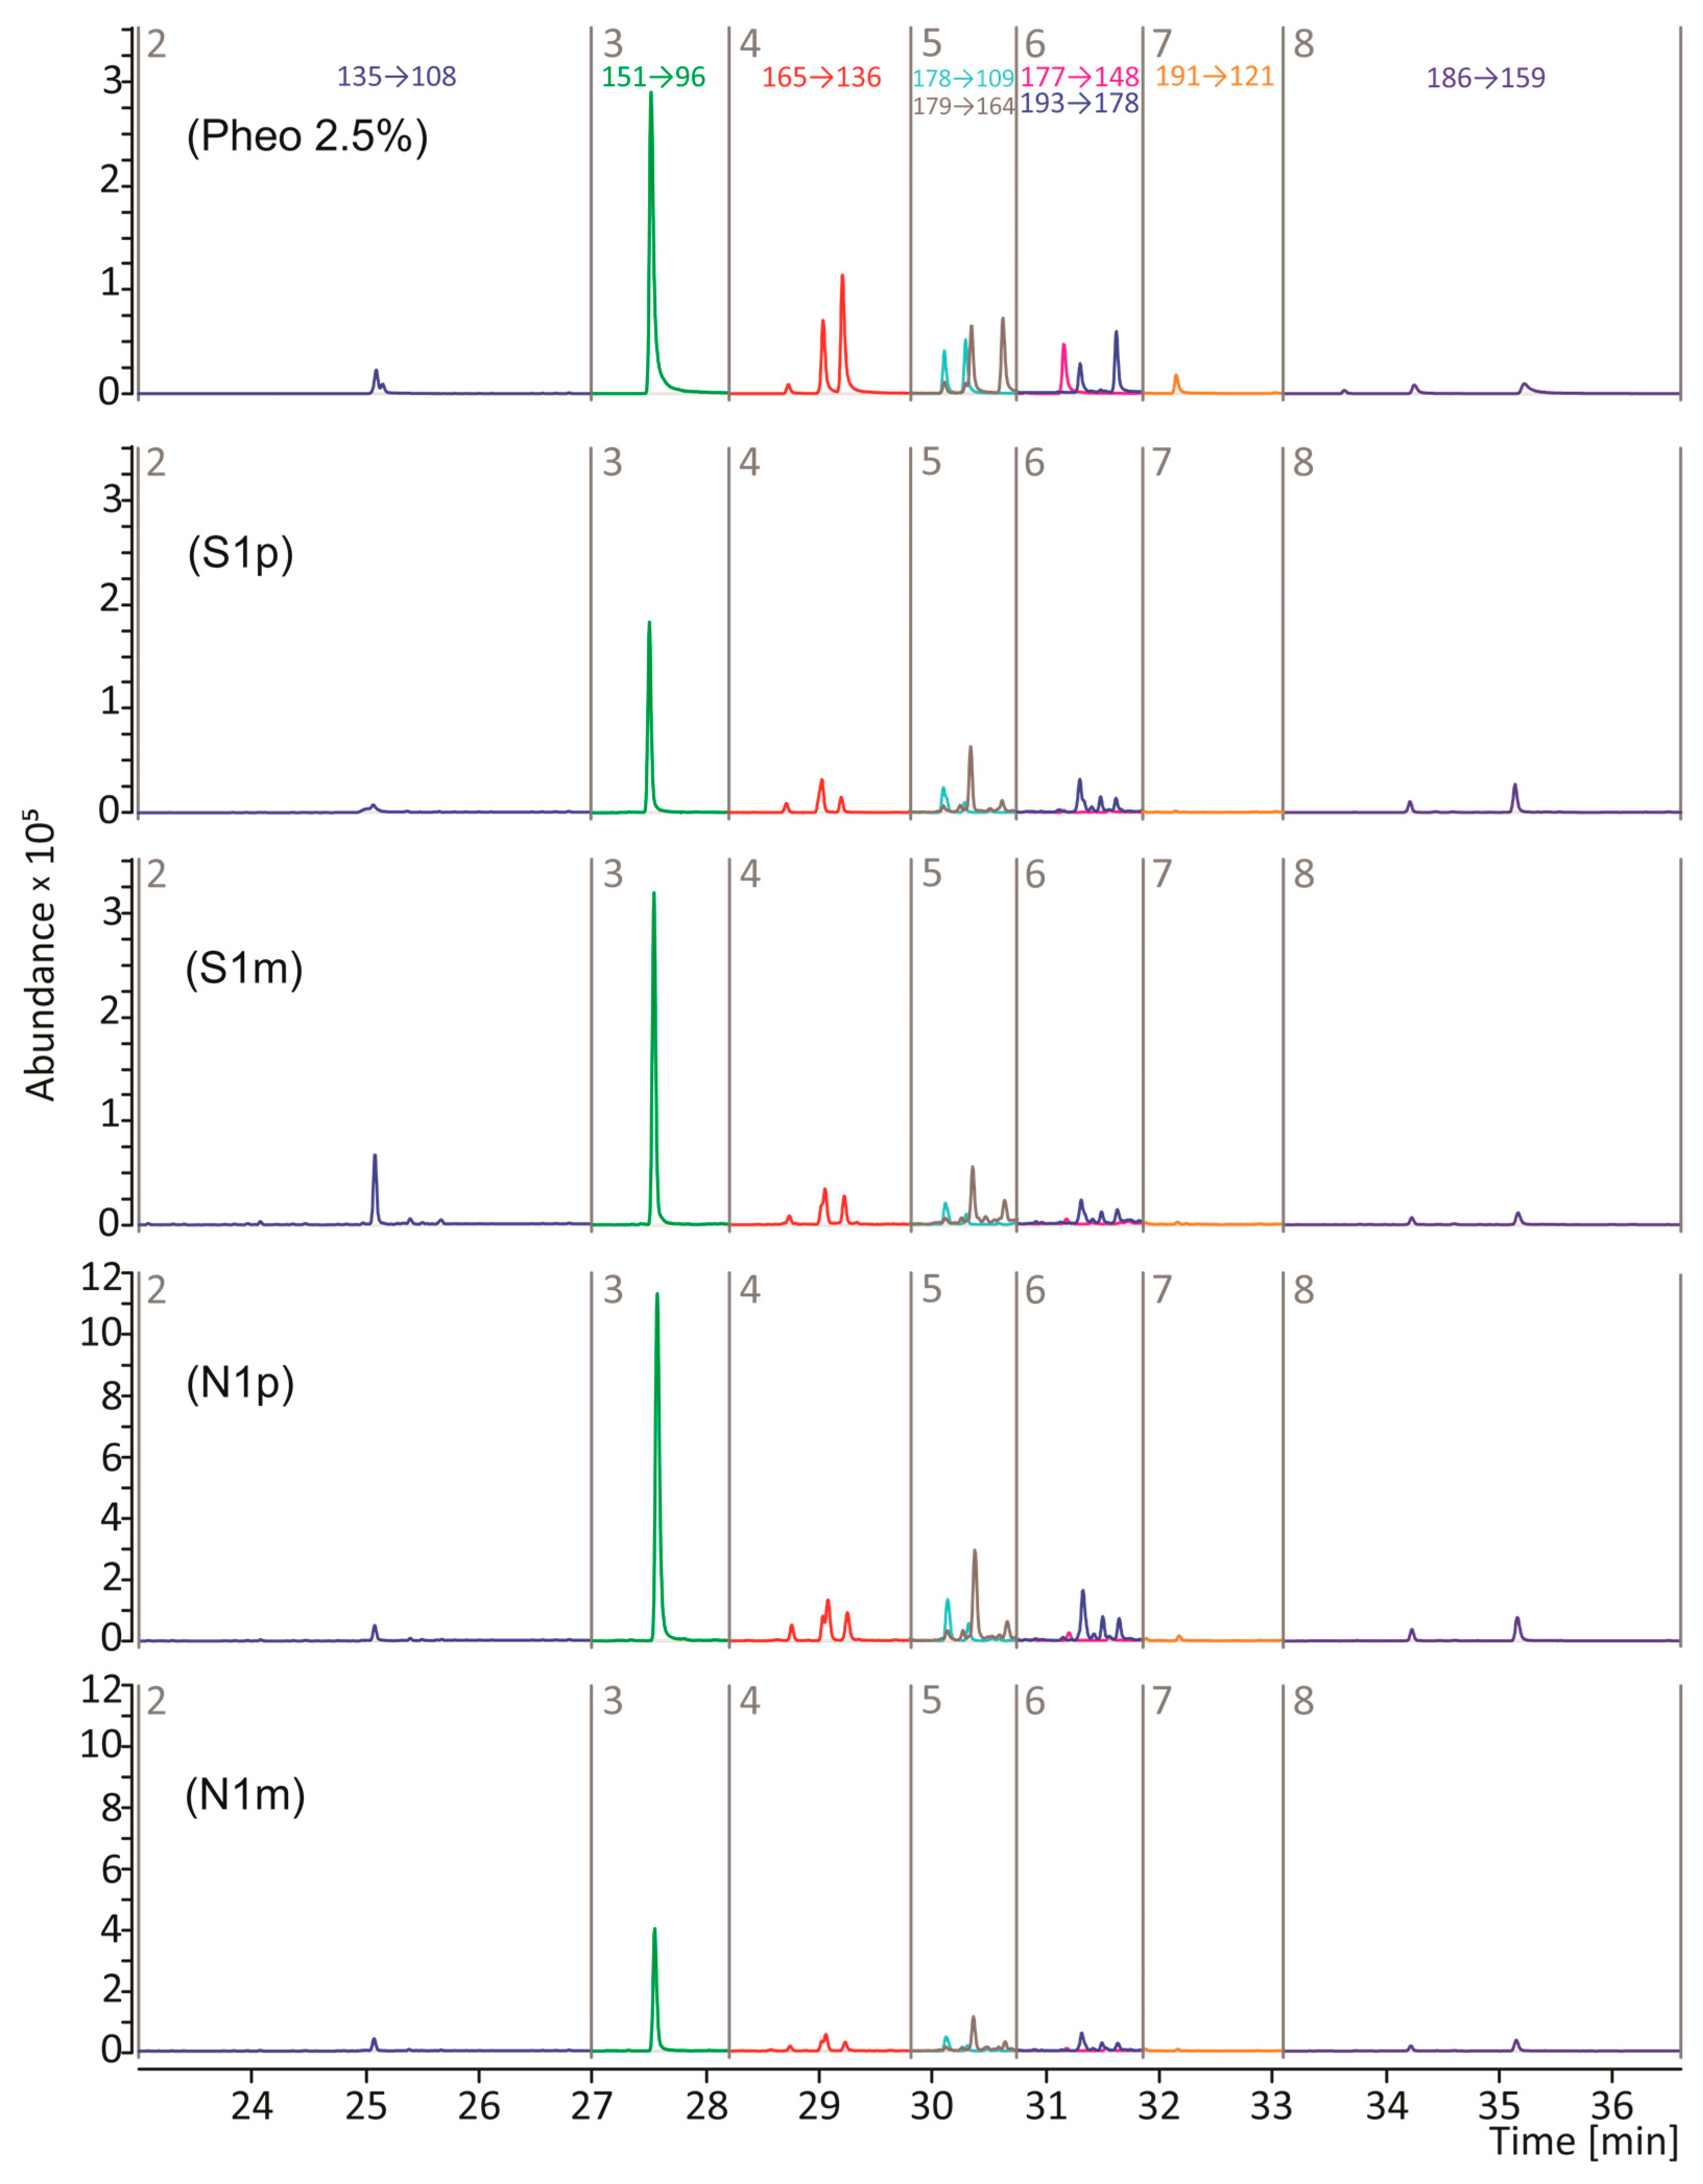
| Time Segment | RT [min] | Compound (Symbol) | MRM Transition * (m/z → m/z) | Collision Energy [eV] |
|---|---|---|---|---|
| 1 | 9.7 | Thiazole (P1) | 85 → 58 | 15 |
| 2 | 25.1 | Benzothiazole (P2) | 135 → 108 | 18 |
| 3 | 27.5 | 4-Hydroxybenzothiazole (P3) | 151 → 96 | 23 |
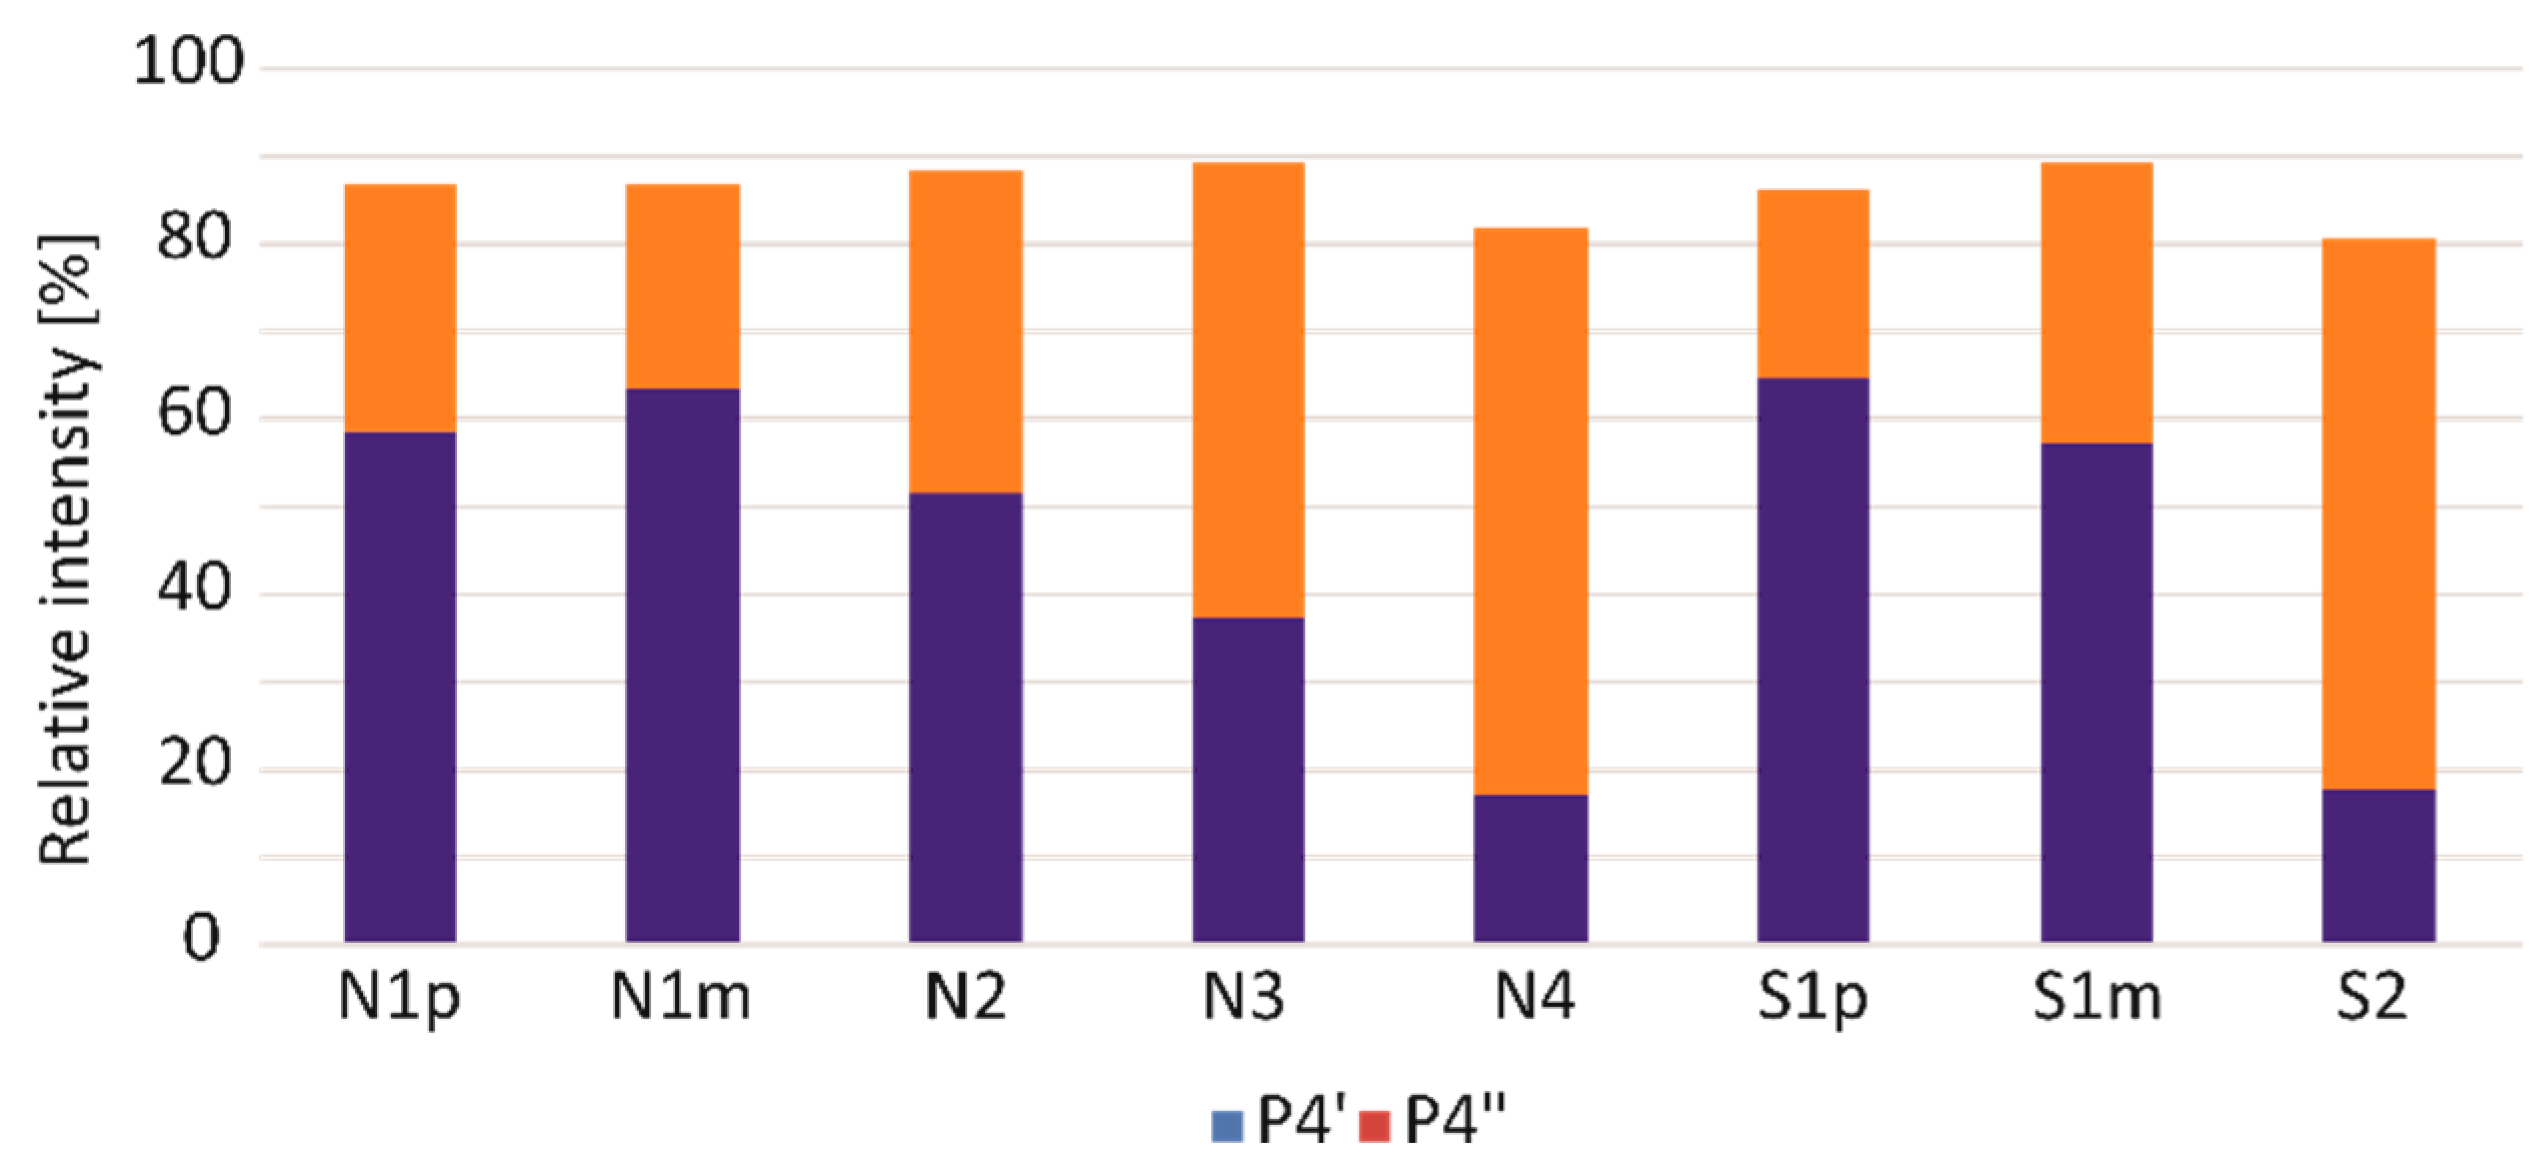
| 4 | 28.7–29.3 | 2,3-Dihydro-5H-1,4-benzothiazin-5-one (P4) and its isomers (P4′ and P4″) | 165 → 136 | 22 |
| 5 | 30.1–30.3 | Methyl-2,3-dihydro-5H-1,4-benzothiazin -5-one (P5) and its isomer (P5′) | 178 → 109 | 20 |
| 5 | 30.3–30.6 | 4-Hydroxy-6-ethylbenzothiazole (P6) and its isomer (P6′) | 179 → 164 | 15 |
| 6 | 31.2 | 7-Methyl-5H-1,4-benzothiazin-5-one (P7) | 177 → 148 | 20 |
| 6 | 31.3–31.6 | 7-Ethyl-2,3-dihydro-5H-1,4-benzothiazin-5-one (P8) and its isomer (P8′) | 193 → 178 | 15 |
| 7 | 32.2 | 7-propyl-2H-1,4-benzothiazine (P9) | 191 → 121 | 26 |
| 8 | 33.6–35.2 | Thiazoloisoquinoline (P10) and its isomers (P10′, and P10″) | 186 → 159 | 19 |
| Symbol | Melanoma Subtype | Sample Under Analysis | Pheomelanin Content (%) |
|---|---|---|---|
| N1 | nodular | primary tumour (N1p) | 4.51 |
| lymph node metastases (N1m) | 1.53 | ||
| N2 | nodular | primary tumour | 1.50 |
| N3 | nodular | primary tumour | 0.46 |
| N4 | nodular | primary tumour | 1.07 |
| S1 | superficial spreading | primary tumour (S1p) | 0.60 |
| lymph node metastases (S1m) | 0.99 | ||
| S2 | superficial spreading | primary tumour | 1.11 |
Disclaimer/Publisher’s Note: The statements, opinions and data contained in all publications are solely those of the individual author(s) and contributor(s) and not of MDPI and/or the editor(s). MDPI and/or the editor(s) disclaim responsibility for any injury to people or property resulting from any ideas, methods, instructions or products referred to in the content. |
© 2025 by the authors. Licensee MDPI, Basel, Switzerland. This article is an open access article distributed under the terms and conditions of the Creative Commons Attribution (CC BY) license (https://creativecommons.org/licenses/by/4.0/).
Share and Cite
Kurkiewicz, S.; Marek, Ł.; Tam, I.; Stanek-Widera, A.; Lange, D.; Stojko, J. A Simple Method to Determine Pheomelanin Content and Structure in FFPE Human Melanoma Specimens. Processes 2025, 13, 1636. https://doi.org/10.3390/pr13061636
Kurkiewicz S, Marek Ł, Tam I, Stanek-Widera A, Lange D, Stojko J. A Simple Method to Determine Pheomelanin Content and Structure in FFPE Human Melanoma Specimens. Processes. 2025; 13(6):1636. https://doi.org/10.3390/pr13061636
Chicago/Turabian StyleKurkiewicz, Slawomir, Łukasz Marek, Irena Tam, Agata Stanek-Widera, Dariusz Lange, and Jerzy Stojko. 2025. "A Simple Method to Determine Pheomelanin Content and Structure in FFPE Human Melanoma Specimens" Processes 13, no. 6: 1636. https://doi.org/10.3390/pr13061636
APA StyleKurkiewicz, S., Marek, Ł., Tam, I., Stanek-Widera, A., Lange, D., & Stojko, J. (2025). A Simple Method to Determine Pheomelanin Content and Structure in FFPE Human Melanoma Specimens. Processes, 13(6), 1636. https://doi.org/10.3390/pr13061636