Article

Thermodynamic and Exergetic Evaluation of a Newly Designed CSP Driven Cooling-Desalination Cogeneration System

by
Hassan F. Elattar
1,*,
Abdul Khaliq
2,
Bassam S. Aljohani
2,
Abdullah M. A. Alsharif
2 and
Hassanein A. Refaey
2
1
Department of Mechanical and Materials Engineering, Faculty of Engineering, University of Jeddah, Jeddah 23890, Saudi Arabia
2
Department of Mechanical Engineering, College of Engineering at Yanbu, Taibah University, Yanbu Al-Bahr 41911, Saudi Arabia
*
Author to whom correspondence should be addressed.
Processes 2025, 13(5), 1589; https://doi.org/10.3390/pr13051589
Submission received: 29 March 2025 / Revised: 9 May 2025 / Accepted: 17 May 2025 / Published: 20 May 2025
(This article belongs to the Section Chemical Processes and Systems)

Abstract

:
This investigation attempts to develop a tower solar collector-based system designed for the cogeneration of cooling and desalination. The traditional organic Rankine cycle (ORC) integrated with the ejector refrigeration cycle generates limited power and cooling at a single temperature. Acknowledging their limitations, our present study uses an organic flash cycle (OFC) supported by solar heat combined with the two-phase ejector cycle and the reverse osmosis (RO) desalination unit. Since the OFC turbine is fed with two extra streams of fluid, therefore, it provides greater power to run the compressor of the ejector and pumps of the RO unit, resulting in the production of cooling at two different temperatures (refrigeration and air conditioning) and a higher mass flow rate of fresh water. A mathematical model is employed to assess the impact of coil curvature ratio, Rib height, and direct normal irradiation (DNI) on the temperature of the collector’s oil outlet. ANSYS-FLUENT conducts numerical simulations through computational fluid dynamics (CFD) analysis. The results indicate an ultimate increase in oil outlet temperature of 45% as the DNI increased from 450 to 1000 W/m2 at a curvature ratio of 0.095 when employing the 1st Rib. Further, a steady-state energy and exergy analysis is conducted to evaluate the performance of the proposed cogeneration, with different design parameters like DNI, coil curvature ratio, rib height, and OFC turbine inlet pressure. The energetic and exergetic efficiencies of the cogeneration system at DNI of 800 W/m2 are obtained as 16.67% and 6.08%, respectively. Exergetic assessment of the overall system shows that 29.57% is the exergy produced as cooling exergy, and the exergy accompanied by freshwater, 68.13%, is the exergy destroyed, and 2.3% is the exergy loss. The solar collector exhibits the maximum exergy destruction, followed by the ejector and RO pumps. Integrating multiple technologies into a system with solar input enhances efficiency, energy sustainability, and environmental benefits.

1. Introduction

The fast use of fossil fuels to fulfill the exponentially rising energy demand for the construction and industrial sectors has caused energy shortages and environmental degradation. Renewable energy sources are gaining popularity due to fossil fuel shortages and greenhouse gas emissions. Solar energy is vital since it provides sustainable cooling, heating, and electricity [1]. Since summer cooling energy is in great demand, solar-based cooling technology has received interest [2]. Solar-to-heat conversion uses concentrated solar power (CSP) technology such as solar power towers, solar dishes, and parabolic trough collectors [3].
Industrial and multi-suite buildings employ solar towers. It has heliostats and a straight-tube receiver [4,5]. Solar energy is contained; thus, the receiver’s heat exchange must be improved to optimum consumption. Helically coiled tubes increase thermal performance and are compact, making them innovative. Heat transfer improves due to the tube’s curvature-induced secondary flow [6]. In tower solar collector systems, helical tubes improve heat transmission and raise the solar heat transfer fluid temperature at the central receiver [7]. The thermal and hydraulic performance of the multi-tubes-in-tube helical coil (MTTHC) was investigated for turbulent flow. The effects of the operating and geometrical parameters and Nusselt numbers, heat transfer coefficients, pumping power, effectiveness, and thermal-hydraulic index are studied and presented [7]. Researchers have examined how helically coiled structured tubes in solar receiver systems may provide cooling, electricity, and heat. Prakash and Chandraker [8] conducted a CFD analysis of the single-phase friction factor in curved tubes, specifically concerning helical coil once-through steam generators designed for small modular reactors (SMRs). Swanepoel et al. [9] used the first and second laws to analyze helically coiled tube-operated solar receivers for steam production. The concentrator’s incidence area was 2.70 m2, and the water flow rate was 0.294 g/s, capturing 861 W of heat with an exit temperature of 343 °C at 757 W/m2. Thermal and exergy efficiency were 50% and 12% for the solar receiver. Khaliq et al. [10] evaluated a central receiver with helically coiled tubes to improve solar-to-heat conversion and drive a cogeneration cycle with the organic Rankine cycle (ORC) and absorption refrigeration cycle. For an intake temperature of 92 °C and solar irradiance of 850 W/m2, the exit temperature of solar heat transfer fluid (oil) increases by 9%, equivalent to a coil diameter increase from 150 to 400 mm.
Integrating ORC with the ejector refrigeration cycle (ERC) improves low-grade solar energy use. Ejector cooling is energy efficient, low-cost, quiet, and flexible with refrigerants. The exergetic assessment of a cooling-power system uses ERC to improve ORC thermodynamics. Wang and Ge [11] presented the comprehensive analysis of a novel power and cooling cogeneration system based on the organic Rankine cycle and ejector refrigeration cycle. Due to thermodynamics, Zhang and Mohamed [12] examined hydrocarbon refrigerant characteristics in solar-operated ORC integrated with ERC. Elakhdar et al. [13] hybridized the parabolic trough solar collector (PTSC) with a thermal system comprising ORC and ERC using thermal oil as heat transfer fluid to address building energy demand. The model demonstrated an hourly response. The exergy study of a novel ORC design with a secondary ejector, internal heat exchanger, and PTSC utilizing Therminol oil as solar fluid was given by Yadav et al. [14]. They found that the predicted configuration’s second law efficiency with isobutane as the working fluid was 18%, greater than systems with an ejector between the ORC turbine and condenser.
Most solar heat is converted into electricity in the aforementioned combined cooling and power (CCP) cycles. Most research employed ORCs and ERCs to produce energy and cool using solar heat, disregarding the organic flash cycle (OFC), which is becoming popular because of its separator tank and flasher [15]. Chen and Kim [16] presented a novel combined system based on a regenerative organic flash cycle. Parametric analyses for the proposed combined system were carried out using six working fluids. Their investigation showed that the preferred working fluid was altered, with a change in the operating condition of the OFC. Few thermodynamic studies have studied OFC for solar power. Lee et al. [17] compare OFC and ORC findings using working fluid thermodynamics and heat source temperature. Because it utilizes low-temperature heat sources well, OFC was selected. Varma et al. [18] increased power by partly flashing warm water and mixing separated vapor with turbine streams in their OFC energy and exergy measurements. Merging OFC with a low-temperature heat source ERC in CCP cycles is unknown. A single-phase ejector powered by ORC turbine exhaust heat evaporates ERC working fluid, reducing turbine power. Only one phase of the cycle chills refrigeration or air conditioning (AC). A two-phase ejector refrigeration cycle can be attractive since it uses excess power from solar-energy-driven OFC, improves energy efficiency, and conserves turbine power. Energy is the focus of the two-phase ejector cooling cycle performance research [19,20,21,22]. Dai et al. [21] carried out the energy and exergy analysis of a two-stage ejector refrigeration cycle with a gas–liquid separator using zeotropic mixtures. Their results determined the maximum COP for the two-stage ERC was 0.126 and the maximum exergetic efficiency was 4.51%. They further determined ejector 1, condenser 1, and generator 1 as the largest exergy-destructive components of the analyzed configuration.
Many Gulf nations are low on freshwater due to rising cooling energy demand. Rising energy prices, depletion of conventional fuel supplies, and global warming provide an urgent need for cogeneration cycles to improve efficiency and minimize pollution [23]. A study was performed to produce cooling and freshwater simultaneously using a double-stage cascade compression cooling system integrated with a water desalination unit [24]. Cogeneration of cooling and desalination offers excellent potential for solar thermal energy owing to the high demand for cooling energy and freshwater during peak summers when sunlight is abundant [25]. Thus, solar irradiation-based simultaneous cooling and desalination is one of the most sustainable ways to meet a building’s cooling and freshwater needs. Zhou et al. [26] created a low-grade waste heat cogeneration system that produced freshwater and cooling. They used exergy analysis to establish the critical operational factors and found that the vapor generator dissipated the most exergy. Shumiye et al. [27] analyzed the exergetic performance of a solar-geothermal-based reverse osmosis water purification system, which met its goal of producing 44 MW of power with an average 50.4% exergetic efficiency. Their analysis determined variation of solar beam radiation as one of the dominant parameters in achieving improved efficiency.
Manesh et al. [28] assessed the exergy of a power plant-desalination unit system that provides freshwater and electricity. Their research showed that seawater salt content and purified water consumption affect desalination’s exergetic efficiency. Moghimi et al. [29] examined a system that cogenerated freshwater and energy under varied operating circumstances for exergy and energy performance. Their system generates 3.14 MW cooling and 85.57 kg/s freshwater, with energy and exergy efficiency of 39.22% and 36.03%. Examining open literature, the above investigations concluded that novel cogeneration system designs producing solar cooling and desalination are necessary. Therefore, the current study applies solar energy harnesses through a novel design of a central receiver embedded with helically coiled tubes for enhanced solar-to-heat conversion. The solar collector is integrated with OFC, generating power to drive the compressor of the two-phase ejector cycle and the pumps of the RO system, which generate the cooling and freshwater. Another novelty of this setup is that the OFC turbine is fed with two extra streams of fluid aiming to generate more power for the effective running of the compressor and pumps. This new configuration produces higher power, cooling, and freshwater than reported in the recent literature [4,11,28]. This configuration aims to produce sustainable cooling at two different temperature levels and freshwater as final products. The system undergoes energetic and exergetic analyses to assess its performance, and an examination is conducted to explore the system’s response to parameter changes. Another contribution of this research is evaluating the impact of climatic conditions on the rate of cleaner production of freshwater and diversified cooling for refrigeration and air conditioning. This detailed analysis and exploration of climatic conditions’ effects on the system’s functionality and outcome have not been extensively investigated in past studies. Therefore, this investigation fills a crucial gap in the reported literature by revealing new insights and findings in these areas, thus advancing the knowledge and understanding of solar energy-supported cooling-desalination systems.

2. System Description

The schematic design of the proposed cooling-desalination system illustrates an innovative integration of an organic flash cycle (OFC) utilizing R124 as the working fluid to produce energy for operating the two-phase ejector and the pumps of the reverse osmosis (RO) sub-system, thereby providing cooling for air conditioning, refrigeration, and freshwater, as depicted in Figure 1. A heliostat-based central receiver employing helical coils for efficient capturing of the heat possessed by solar radiation is considered. Syltherm 800 oil is a heat transfer fluid in the heliostat field that absorbs solar heat. The high-temperature heat transfer fluid (state 18) enters the heat recovery vapor generator (HRVG) of the OFC cycle, and the OFC cycle absorbs the thermal energy from the solar heat transfer fluid (SHTF). High-temperature SHTF passes through HRVG, causing an increase in fluid temperature and consequently forming superheated vapor (22). The SHTF exits the HRVG (state point 16) and enters (state point 17) the heliostat field through a solar pump 1. One part of the pressurized hot liquid (30) from HRVG is given to a high-pressure flasher (HPF) unit (33) via an expansion valve (EV1). In this cycle, HRVG consists of three zones, namely, economizer (ECO), evaporator (EVA), and superheater (SH). In HPF, this liquid is flashed to saturated vapor (35), which is supplied to the turbine and into liquid (34) connected to a low-pressure flasher (LPF) via EV2, wherein it is flashed and separated into liquid (36) and saturated vapor (37). This arrangement caused two extra streams of fluid to enter the turbine, one from HPF and the other from the LPF, generating a greater amount of power, enough to drive the compressor and pumps and meet the electricity requirement of a building. The vapors (23) coming from the turbine reject the heat at the regenerator (23–24) and then condense (25). The condensate is pumped (via pump 2) and then passes through the regenerator (27), mixed with liquid (36), and is then pumped (via pump3) to HRVG (29) to repeat the cycle. The two-phase ejector cycle employs R600a as the working fluid to achieve the desired cooling. The vapor from the separator (10) via the heat exchanger enters the compressor (11) and then the condenser 2 (Cond2) (1) to reject the heat into the ambient. The saturated liquid leaving the condenser 2 (2) goes to the air conditioner (AC) via the heat exchanger and EV3. This heat exchanger (HX) exchanges the heat between the liquid leaving the condenser2 (Cond2) and the saturated vapor approaching the compressor. The stream from the air conditioner (AC) (5) enters the ejector (Eje) as the primary fluid of the motive nozzle. The high-velocity vapor creates the low-pressure region at the mixing chamber inlet and sucks the vapor from the refrigerator (ref) (9). A normal shock wave occurs as a mixed fluid enters the constant area part and causes a pressure increase. It then decelerates in the diffuser as a shock occurs and enters the separator (Sep) (6). The separator (Sep) separates the fluid into two parts; namely, liquid (7) goes to the refrigerator (ref) and produces a refrigeration effect (8). The saturated vapor (10) is routed to the compressor (C) (11) via a heat exchanger (HX). Table 1 depicts some relevant properties of SHTF. In the RO open cycle, the seawater is pumped into the filter tank by a high-pressure pump from state 21 to state 40, utilizing the fraction of power supplied by the OFC turbine. Its two products, freshwater ( m ˙ f r w ) state 41 and brine reject state 42, are taken out separately. The properties of solar heat transfer fluid (Syltherm 800) are shown in Table 1.

3. Computational Programming for the Performance Evaluation of a Proposed Cooling-Desalination System

Examination of the cogeneration model is conducted in three stages:
-
Heliostat is working with the SHTF that drives the proposed system.
-
Organic flash cycle (OFC) using R124 as the working fluid to generate power.
-
A two-phase ejector cycle simultaneously provides cooling for air conditioning and refrigeration.
-
Energy and exergy examination of the model is conducted.
A numerical simulation through CFD analysis using the ANSYS-FLUENT 17.2 package was conducted to determine the temperature of SHTF, Syltherm 800 oil exiting the central receiver employing helical coils to vaporize the working fluid (R124) of the organic flash cycle. System modeling was done using Engineering Equation Solver (EES) software based on mass, energy, and exergy equations. REFPROP 6.01 [31] and EES software V. 10.561 [32] were linked to extract the working fluid’s thermodynamic characteristics. After computation of thermodynamic properties, this data is used for the subsequent energy and exergy analyses of the combined cooling-desalination system. To document the property inputs from REFPROP, the enthalpy and entropy of the working fluids (R124 and R600a) should be set to zero for the saturated liquid at the normal boiling point (NBP). A single fluid was used in all sub-systems of the combined system, not the mixture.
The numerical data pivotal for problem-solving are documented, and the key assumptions underpinning the energetic and exergetic analyses of the entire system include [16,26,33]:
Steady-state operation of all cycles or sub-systems
Negligible pressure drop across equipment, except that specified later.
Disregard the variations in kinetic and potential energies.
Adiabatic operation of all pumps, compressors, and turbines.
Standard ambient conditions were adopted, with temperature and pressure set at 25 °C and 101.32 kPa, respectively.
Only physical exergy is considered for calculation purposes.
Expansion valves operate under isenthalpic processes.
The state of the working substance is a saturated liquid at the outlet of the condenser.
It is assumed that the efficiencies of pumps, compressors, and turbines operating isentropically are 85%.
The specific heats of seawater and freshwater were assumed to be 3.898 kJ/kg-K and 4.12 kJ/kg-K, respectively.

3.1. Mathematical and Governing Equations

Analysis was done using steady-state CFD simulation. In Figure 1, tetrahedral and wedge components formed the grid. Once normalized residual values for continuity, momentum, and energy decreased below 10−5, 10−5, and 10−6, respectively, convergence was achieved. Table 2 summarizes the geometric and operational characteristics of the three coils. The details of the discretization methods, under-relaxation factors, and comprehensive descriptions of the boundary conditions are illustrated in Table 3. The Reynolds number surpassed critical levels for all rib combinations due to the helical coil shape. We chose the realizable k-ε turbulence model as presented in [7,8] to simulate turbulent flow and heat transfer owing to its higher computing efficiency and accuracy in forecasting curved and swirling flow. The model selection and validation [7] were compared to the experimental results of Kumar et al. [34].
A study on grid refinement was conducted to enhance the accuracy and convergence of numerical solutions for capturing key features near coil walls, as well as in regions with intense flow and temperature gradients. A mesh study was conducted for each coil for the three tube diameters and the three studied ribs. For the studied tube diameters of 38, 32, and 25 mm for a coil diameter of 400 mm, the outlet temperature of Syltherm 800 reached stability as shown in Table 3. In addition, beside each mesh conversion number of elements in each coil geometry, the quality metrics in skewness are also presented in Table 3. The validation of the CFD model has been done by Elattar et al. [7] for the flow in helically coiled tubes. The study assumed steady, incompressible Newtonian fluid flows and disregarded the effects of gravity on heat transfer. The equations for energy, continuity, and momentum regarding the temperature distribution in the helical coil were derived using Cartesian coordinates [6,7].
x i ( ρ U i ) = 0
x i ρ U j U i = x i µ U i x i P x i
x i ρ C p U i T = x i k T x i
Ui and T denote the velocity and temperature in the i direction, respectively, as they vary over time. The variables ρ, k, Cp, μ, and P represent density, thermal conductivity, specific heat capacity, viscosity, and thermodynamic pressure, respectively. The Reynolds number (Re) for tube flow is calculated using dt as per the following formula:
R e = m o i l . d t A μ o i l
The external coil surface is designed to be exposed to a uniform heat flow q’’. The oil entry and departure are at average temperatures Ti and To, respectively. The rate of heat transfer Q from flowing oil may be obtained by utilizing the energy balance formula given below:
Q = q   A h = m ˙ C p ( T o T i )
where Cp is the heat carrying capacity of oil and is evaluated at average oil temperature, and m is the flowing mass rate of oil.

3.2. Energy and Exergy Analyses

An exergy investigation is conducted on the proposed cogeneration model, revealing the amount of exergy dissipation of its components.
The conservation of mass principle expresses the steady state operation as
Σ m ˙ i Σ m ˙ o = 0
The conservation of energy principle expresses the steady-state operation as
Q ˙ W   ˙ = m ˙ h 0 + C 2 2 + g z 0 m ˙ h i + C 2 2 + g z i
where h, c, and z are the flowing stream’s specific enthalpy, bulk velocity, and elevation.
Table 4 shows the energy balance for the model components obtained using Equations (6) and (7).
The specific exergy of the flowing stream, while ignoring the kinetic and potential exergies, is formulated as
e x = h h T 0 ( s s )
where * represents the property at the datum state.
For a control volume working on steady state, the exergy destruction equation is given as
Σ 1 T 0 T Q ˙ j Σ W ˙ + Σ m ˙ i e x i Σ m ˙ o e x o E ˙ x , D = 0
Table 5 shows the expression of exergy destruction for the model’s components.

3.3. Proposed Cogeneration Model’s Overall Performance Indicators

In the case of a cooling-desalination cogeneration system driven by solar energy, the energetic output is expressed by the addition of energy associated with fresh water and the cooling outputs of refrigeration and air conditioning, and therefore, the traditional energetic efficiency of the proposed cogeneration can be presented as
The outcome of the proposed model is assessed via energy and exergy efficiencies, which are determined through the first and second laws of thermodynamics. The energy efficiency of the proposed cogeneration system can be expressed as [23]:
η e n = W ˙ n e t + m ˙ f r w h f r w + Q ˙ r e f + Q ˙ A C Q ˙ s o l a r
where W ˙ n e t represents the net power output, m ˙ f r w h f r w is the rate of energy accompanied by the amount of freshwater produced, Q ˙ r e f denotes the refrigeration capacity and Q ˙ A c denotes the air-conditioning capacity, Q ˙ s o l a r is the solar energy input to the system.
The efficiency of the cooling-desalination system indicated by Equation (10) does not reveal the process’s inefficiencies. Contrary to energetic efficiency, an evaluation through exergy determines the quality of the energy source that is transformed into useful products [33].
The exergy efficiency of the proposed cooling-desalination system can be expressed as [29]:
η e x = W ˙ n e t + m ˙ f r w e x , f r w + E ˙ r e f + E ˙ A C E ˙ s o l a r
where m ˙ f r w e x , f r w is the rate of exergy accompanied by the amount of freshwater produced,   E ˙ r e f and E ˙ A C are the exergies accompanied by Q ˙ r e f and Q ˙ A C , respectively, and are given by
E ˙ r e f = Q ˙ r e f T 0 T r e f 1                      
E ˙ A C = Q ˙ A C T 0 T A C 1
where T 0 ,   T r e f ,   T A C are the ambient temperature, refrigeration temperature, and air-conditioning temperature, respectively.
The turbine’s power is utilized to run the solar pump, OFC pumps, the compressor of the two-phase ejector cycle, and the pump of the RO sub-system.
Carnot’s approach of heat into work conversion for the reversible process was employed to estimate the exergy E ˙ accompanied by solar radiation Q ˙ received from the Sun at temperature (TSolar), and it can appear as [11]
E ˙ S o l a r = Q ˙ S o l a r 1 T 0 T S o l a r
where T S o l a r is indicating the Sun’s temperature and Q ˙ S o l a r represents the heat generated by solar energy, which arrives at the collector and is determined by.
Q ˙ s o l a r = A f i e l d q
where q is denoted for (DNI), which may be defined as the solar rays arriving on a one square meter area and A f i e l d is the heliostat area.
Further discussion on equations utilized to model the components of solar source (employed to run the cooling-desalination cogeneration system) can be seen in reference [11].
In this analysis, solar exergy supplied to the combined cooling, heating, and power (CCHP) system is broken down in terms of exergy produced, destroyed, and lost. The global balance of exergy is shown by [35]:
E ˙ x , F , k = E ˙ x , P , k + E ˙ x , D , k + E ˙ x , L , k
where E ˙ x , P , k and E ˙ x , F , k appears as product and fuel exergy, respectively. The terms E ˙ x , L , k and E ˙ x , D , k signifies the exergy loss and the exergy dissipated. The exergy destroyed in the given components can be estimated after employing the expressions shown in Table 5.
The input parameters taken for computing the outputs of the proposed cogeneration are shown in Table 6. Figure 2 represents the workflow diagram for the current work.

4. Results and Discussion

This section covers the assessment findings of a tower solar collector system that drives the OFC, which creates electricity to operate the two-phase ejector compressor and RO desalination unit pumps, providing cooling and freshwater. This analysis examines how DNI, coil rib height, ambient temperature, refrigeration evaporator temperature, and air conditioning sub-systems affect thermal and exergetic efficiencies of a solar receiver-powered cooling-desalination system with helical coils. We picked Syltherm 800 because of its thermal resilience at liquid temperatures up to 400 °C [30]. Its optimal film temperature is 427 °C, and pumpability is below −40 °C. The OSHA Hazard Communication Standard does not classify silicone fluid Syltherm 800 as hazardous. Syltherm 800 is sensitive to high Reynolds numbers and is the heat transfer fluid in this investigation.

4.1. Effect of the Coil Curvature Ratio

Figure 3 illustrates the curvature ratio and outlet temperature relationship for three rib configurations (1st Rib, 2nd Rib, and 3rd Rib) under varying DNI (DNI = 450, 700, and 1000 W/m2). Across all configurations, the outlet temperature increases with the curvature ratio, indicating that a higher curvature enhances heat transfer by promoting secondary flow and mixing. Higher DNI = 1000 W/m2 consistently increases outlet temperatures, enhancing effective heat transfer. Among the three rib designs, the 1st Rib demonstrates the most pronounced increase in outlet temperature with the curvature ratio, suggesting it is the most effective in enhancing thermal performance, particularly at higher DNI. A higher curvature ratio enhances the intensity of secondary flows (Dean vortices) within the helical coil. These secondary flows increase the fluid’s mixing, leading to better convective heat transfer between the fluid and the wall. The improved mixing reduces thermal boundary layers near the wall, facilitating more efficient heat transfer and higher outlet temperatures.
In Figure 4, the temperature contours for the 1st Rib at two different sectional planes that pass through the inlet and outlet are shown for each of the three curvature ratios employed, each at a DNI density of 450 W/m2. The results for a legend with a temperature limit of nearly 100 K are introduced. It is possible to determine how the curvature ratio influences the temperature distribution through the helical coil.

4.2. Influence of Rib Height

Figure 5 and Figure 6 show the output temperature vs. rib height for the three curvature ratios. Various radiation levels and data for the three ribs are compared. The figures illustrate that increasing rib height lowers the outlet temperature in each sample. Amplification of centrifugal force and increased secondary flow efficiency may explain this phenomenon. The temperature contours in Figure 6 are coupled to a 1000 W/m2 DNI and 0.095 curvature ratio to support this interpretation. The outlet temperature increased 39.5% as the rib height reduced from 6 to 2 mm at 1000 W/m2 with a maximum curvature ratio of 0.095. As the rib height decreases from 4 to 2 mm, the output temperature increases by 12.2% at DNI = 400 W/m2. A drop in oil outlet temperature with rib height lowers cycle working fluid temperature, reducing cooling-power output and system efficiency. All curvature ratios and DNI favor the 1st Rib, which boosts the outflow temperature the most. This suggests that the 1st Rib shape optimizes turbulence and secondary flows. The 100 K legend results are presented. The effect of coil rib height on helical coil temperature distribution may be determined. The outflow temperature is maximum for the 1st Rib, 2 mm rib height. To raise output temperature, lower rib height, and increase DNI.

4.3. Effect of Changing DNI

The bar chart in Figure 6 illustrates the outlet HTF temperature % increase for three ribs depending on coil curvature ratio and DNI values. Figure 7 illustrates the maximum output temperature at various curvature ratios and rib heights for 1000 W/m2. Due to the smaller DNI, this transition raises the output temperature the least for all rib configurations. The 3rd Rib form is less heat transferring, raising the outlet temperature the least. The 1st rib exhibits the most considerable curvature ratio increase at 0.095, almost 45%.
Figure 8 shows the coil pressure drop as a function of curvature ratio, DNI, and rib shape in a bar chart. For all rib types, the pressure loss is maximum at 0.0625 and drops dramatically between 0.08 and 0.095. Because fewer tightly coiled geometries have lower flow resistance, centrifugal effects and frictional losses are decreased. The 3rd Rib regularly decreases the most pressure, followed by the 2nd and 1st ribs. Its reduced pressure drop implies a more straightforward design that reduces flow resistance, making the 1st Rib more efficient at balancing heat transfer performance and energy usage. A smaller curvature ratio (0.0625) tightens the coil shape, increasing centrifugal forces and secondary flow. As the curvature ratio increases, the coil loosens, decreasing centrifugal forces, friction, and pressure loss.
The turbine output of the OFC cycle is utilized for two purposes. Half of the power produced by the turbine is used to drive the high-pressure pump of the RO desalination unit, and the remaining power output is used to drive the ejector cycle’s compressor, producing the refrigeration and air-conditioning outputs. It is explained in Figure 9 that an increase in solar flux leads to an increase in turbine power output ( W ˙ T ) of the OFC cycle. This is because an increase in solar flux raises the evaporator temperature, which increases the turbine entry pressure, leading to a higher pressure ratio. As half of the turbine power is utilized to run the compressor of the ejector cycle, the compressor input power also increases with the increase in solar flux. Increasing compressor power increases the refrigeration and air-conditioning output of the two-phase ejector cycle. The increase in turbine power increases the power supplied to the RO pump, increasing the amount of freshwater produced. By increasing solar flux from 600–1000 W/m2, the refrigeration output, air conditioning capacity, and the rate of freshwater produced are found to increase from 1276 kW to 2097 kW, from 387 kW to 635.4 kW, and from 3960 kg/hr to 6840 kg/hr, respectively.
Figure 10 depicts the effect of DNI on cooling exergy outputs (exergy of refrigeration and exergy of air-conditioning output) of the two-phase ejector cycle. According to the trends shown, both the exergetic outputs of the two-phase ejector improved with the rise in DNI. The exergy of refrigeration and exergy of air conditioning are expanded from 241.5 kW to 394 kW and from 10.01 kW to 15.94 kW, along with the increase in power exergy from 981.4 kW to 1600 kW when DNI rises from 600–1000 W/m2. The reason for the increase in both the exergy outputs is the increase in turbine output of the OFC cycle due to an increase in the mass flow rate of the working fluid of the OFC cycle, which is utilized to run the compressor of the two-phase ejector cooling cycle, as mentioned in Figure 8.
The energy efficiency of a system is calculated by comparing the usable energetic output (refrigeration, air conditioning, and desalination) to the energy provided ( Q ˙ s o l a r ) in Equation (10). The system’s exergy efficiency is the ratio of exergetic output (including refrigeration, air conditioning, and freshwater) to exergy supplied ( E ˙ s o l a r ) as per Equation (11). Figure 11 shows how DNI affects system energy and exergy efficiency. As DNI rises, they fall. Because rising DNI increases energetic output (refrigeration, air conditioning, and freshwater energy) less than solar energy input, system thermal efficiency decreases. Energy efficiency reduces from 16.71% to 16.64% when DNI increases from 600 to 1000 W/m2. The increase in DNI reduces the system’s exergy efficiency because the energetic output (refrigeration, air conditioning, and freshwater) is less than the solar exergy input. Exergy efficiency drops from 6.09 to 6.07% when solar flux rises from 600 to 1000 W/m2. Rising solar flux raises SHTF temperature, which increases solar collector thermal losses (high energy and exergy losses at high temperatures).
OFC turbine entrance pressure affects system energy and exergy efficiency, as shown in Figure 12. The mass flow rate of OFC’s working fluid (R124) rises as the turbine entrance pressure increases because its enthalpy of vaporization lowers. The turbine’s power output rises for the same heat input to the heliostat field, which boosts the system’s energetic output (refrigeration, air conditioning, and desalination capabilities) and energy efficiency. The turbine’s power output increases for the same exergy input to the heliostat field, increasing energy output (refrigeration, air conditioning, and freshwater) and efficiency. Since the mass flow rate of working fluid (R124) increases with turbine entry pressure, the system’s energy and exergy efficiencies rise. When OFC turbine entrance pressure climbs from 1800 to 2200 kPa, cooling-desalination system energy and exergy efficiencies improve from 14.83 to 19.38% and 5.463 to 7.123%, respectively.
Figure 13 illustrates the variation of energy and exergy efficiencies of the system concerning ambient temperature or dead state temperature increases. The energy and exergy efficiencies slightly decrease with an increase in ambient temperature. Energy efficiency declines from 16.68% to 16.64% as the ambient temperature rises from 17 °C to 37 °C. Increasing ambient temperature reduces thermal losses between the system and the environment, increasing energy input to the cycle and decreasing the system’s energy efficiency. When associated with thermal losses, exergy is significantly lower than the thermal losses themselves. Consequently, an increase in the exergy supplied to the cycle exceeds that of its energy equivalent, resulting in the system’s exergy efficiency being lower than its energy efficiency. The decline in exergy efficiency occurs at a greater rate than that of energy efficiency due to a more significant reduction in exergy associated with the cooling outputs generated by refrigeration and air conditioning sub-systems. The exergy efficiency of the cooling-desalination cogeneration system declines from 6.09% to 6.06% as the ambient temperature rises from 17 °C to 37 °C.
Under baseline operating circumstances, Figure 14 shows solar exergy breakdown and dissipation from entropy production across system components. The suggested cogeneration system uses 100% solar radiation exergy from the heliostat field. The OFC cycle destroys 21.58% of exergy, followed by the two-phase ejector cycle at 7.27% and the solar collector at 39.28%. The temperature difference between ambient and system boundaries causes 2.3% exergy loss. The remaining 29.57% is cogeneration exergy from refrigeration, air conditioning, and freshwater production. According to the categorization, desalination produces 12.4%, refrigeration 9.48%, and air conditioning 7.69%. The solar collector’s 39.28 exergy destruction dominates the system. The collector’s thermodynamic losses rise because the receiver absorbs high-quality solar insolation at a lower temperature. The OFC destroys 21.58% of solar exergy due to the cycle working fluid throttling from economizer pressure to evaporator pressure, which is the saturation pressure of the high-pressure flasher temperature. Expanding the two-stream mixture in the turbine, which has a large exergy differential between streams, increases OFC solar exergy destruction. The seawater pump’s exergy losses make the RO sub-system the third greatest exergy dissipator at 12.4%. The two-phase ejector destroys 7.27% of solar exergy, the fourth most. Entropy from non-isentropic expansion in the nozzle and friction losses in the fluid stream going through the ejector cause this loss. The refrigerant R600a stream is split into saturated vapor (state 10) and saturated liquid (state 7), and the expansion valve (7–8) throttles the saturated liquid, further degrading exergy in the cooling cycle.

4.4. Model Verification

The data reported in the literature contrasts with the computed results to verify the validity of the thermodynamic model developed in this study. Since a new type of integrated system is devised in this investigation, a direct comparison of the system efficiencies with other types of integrated systems would not be viable. Therefore, a comparison of the output as well as exergy efficiencies of major sub-systems has been validated, independently, and shown in Table 7. Verma and Srinivas validated the model for the OFC performance [18]. The OFC turbine output and its exergy efficiency are determined as 1292 kW and 26.84%, respectively, compared to the OFC turbine output of 1248 kW and exergy efficiency of 26.21% obtained in [18]. The performance of the two-phase ejector is verified through the results obtained by Lawrence and Elbel [36]. The cooling outputs (refrigeration and air conditioning capacities) of the present system are determined as 165 kW and 515 kW, respectively, compared to 1558 kW and 504 kW of the results obtained by [36]. The cooling output of the presently developed system is marginally higher than that of the [36], as a central receiver with helically coiled tubes entails a major input to the system. The results of the RO desalination unit are validated from the results reported by Al-Ghamdi and Mustafa [34]. The exergetic efficiency of the RO sub-system is determined as 29.2%, compared to 29.4%, the exergetic efficiency obtained by [37]. A slight deviation is found between the present findings and the results from the literature [18,37]. In sum, the data obtained from the present investigation support the acceptance of conducting future research in the exploitation of the solar thermal potential of the hot region to enhance the sustainable production of cooling energy and freshwater.

4.5. Sensitivity Analysis

4.5.1. Effect of DNI

The solar radiation concentration reaches the collector per unit area throughout the day, altered by the season. This alteration affects the expected receiver outlet temperature. With an increase in DNI, the receiver outlet temperature, energetic output (OFC turbine power, refrigeration and air conditioning effects, and mass flow rate of freshwater), and the exergetic output (power exergy, refrigeration exergy, and the exergy accompanied by air conditioning load) tend to increase (Figure 9 and Figure 10). At high-intensity solar radiation, solar exergy input increases, reducing the exergy efficiency. Thus, the exergy efficiency makes it possible to evaluate to what extent the cooling-desalination system uses solar energy to produce cooling and fresh water. Increasing DNI significantly improves the system’s exergetic output (cooling exergy and the exergy accompanied by fresh water). A compromise must therefore be found between exergy efficiency and the exegetic output of the designed system.

4.5.2. Effect of Turbine Inlet Pressure

The effect of system performance as a function of turbine inlet pressure is presented in Figure 11. The calculations were performed after applying the first and second laws of thermodynamics, with a constant solar radiation intensity (DNI) of 700 W/m2, curvature ratio of 0.08, and entry temperature of oil of 92 °C. The observation is that the turbine power output and the energy and exergy efficiencies of the cooling-desalination system increase as the turbine inlet pressure increases. A higher operating pressure for the turbine (around 1800–2200 kPa) is desirable to improve the system’s exergy efficiency by 30.39%.
When heat utilization is higher and energetic output decreases, the usable and available energy (exergy) in the designed system is destroyed in an irreversible process. Exergy destruction varies by component, as does its function and direct relationship to the various parameters. Solar collector, OFC, seawater pump, and two-phase ejector are the sub-systems where high exergy destruction occurs relative to other components, as shown in Figure 13.

5. Conclusions

The primary aim of the present study was to examine and integrate various plants to produce cooling and fresh water. The newly designed plant integrates a tower solar collector employing helical coils for solar-to-heat conversion, an OFC, an RO desalination unit, and a two-phase ejector refrigeration cycle. A steady-state energy-exergy analysis model was employed to investigate how some important parameters impact the useful outputs and performance of the proposed cooling-desalination system. Referring to the general results, it is concluded that employment of helically coiled tubes in the central receiver enhances the conversion rate of solar energy to thermal energy, and the use of OFC generates more power output than traditional ORC because it is fed with two extra streams. Finally, OFC supplies greater power to the compressor of the two-phase ejector cycle and the pump of the RO unit, resulting in efficient cooling production at two different temperatures and a higher mass flow rate of freshwater. This comprehensive approach not only improves the overall system’s energy efficiency but also offers an environment-friendly technology to overcome the scarcity of increasing demand for cooling for refrigeration and air conditioning and freshwater needs. Some of the main important findings of this study can be summarized as:
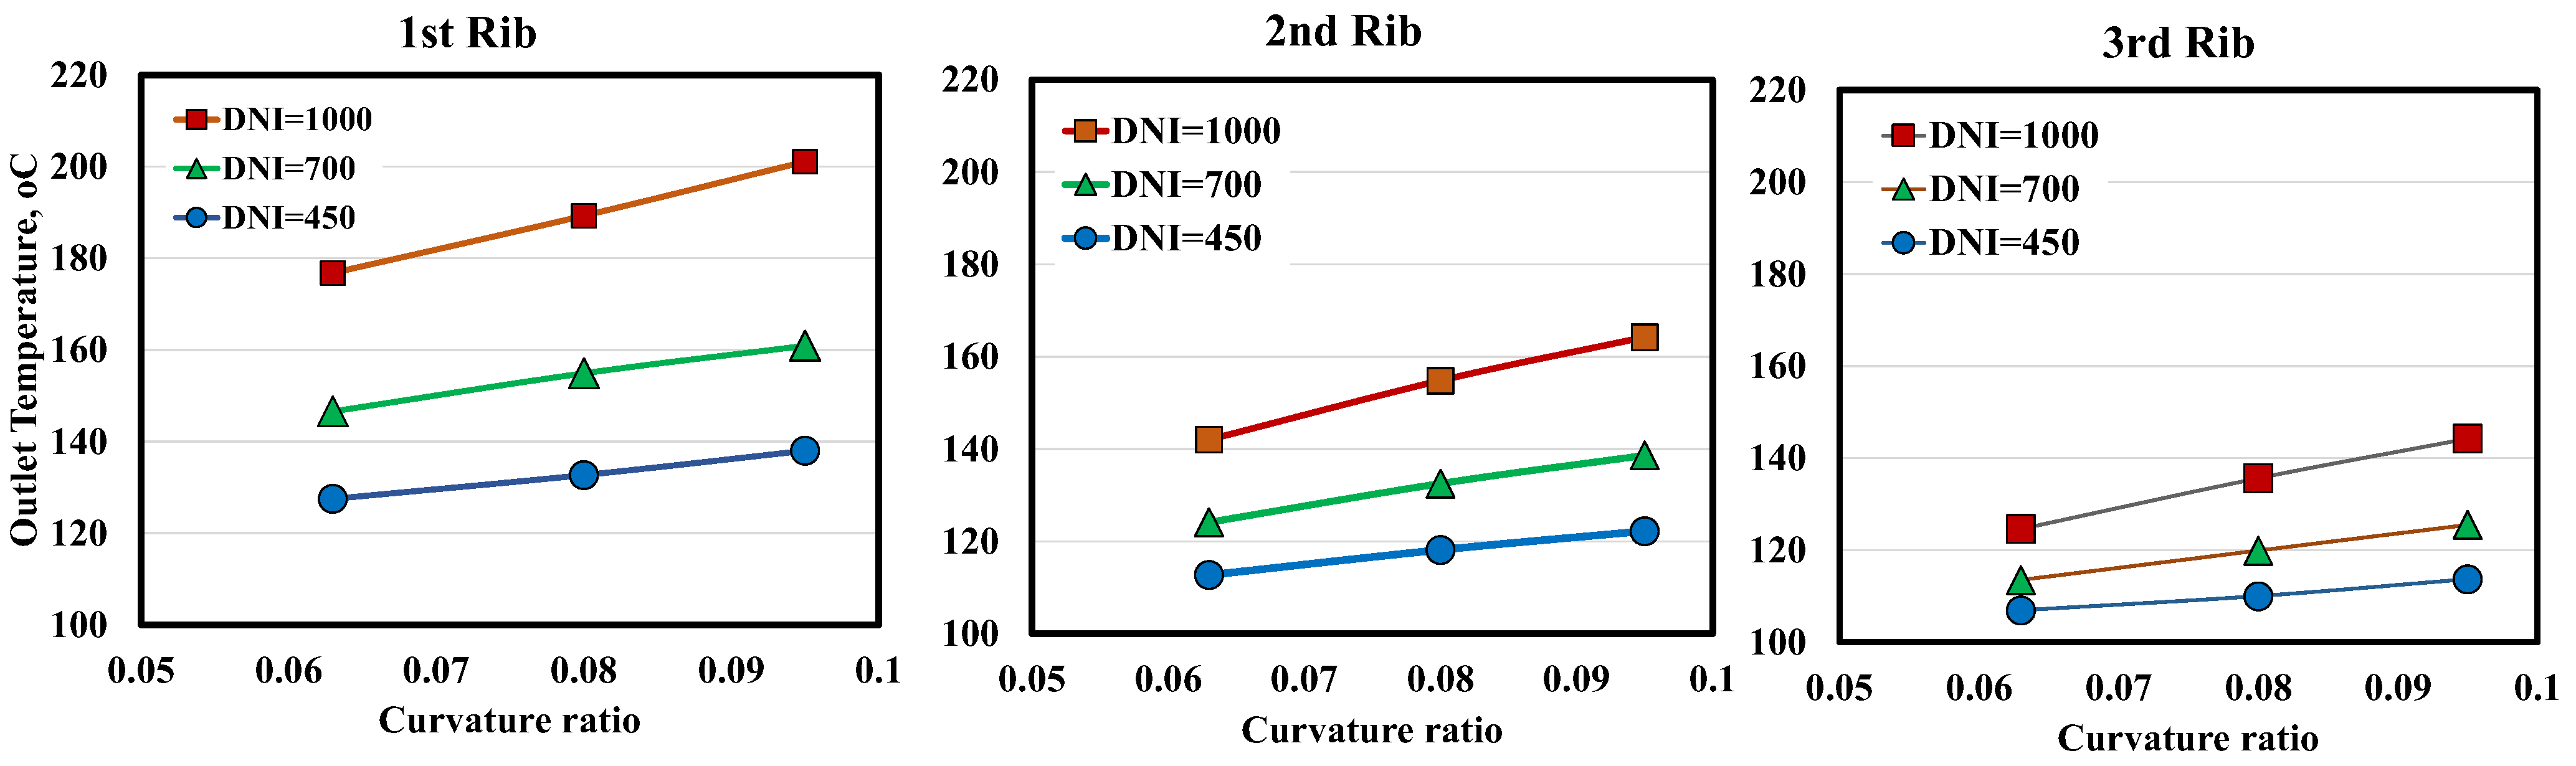
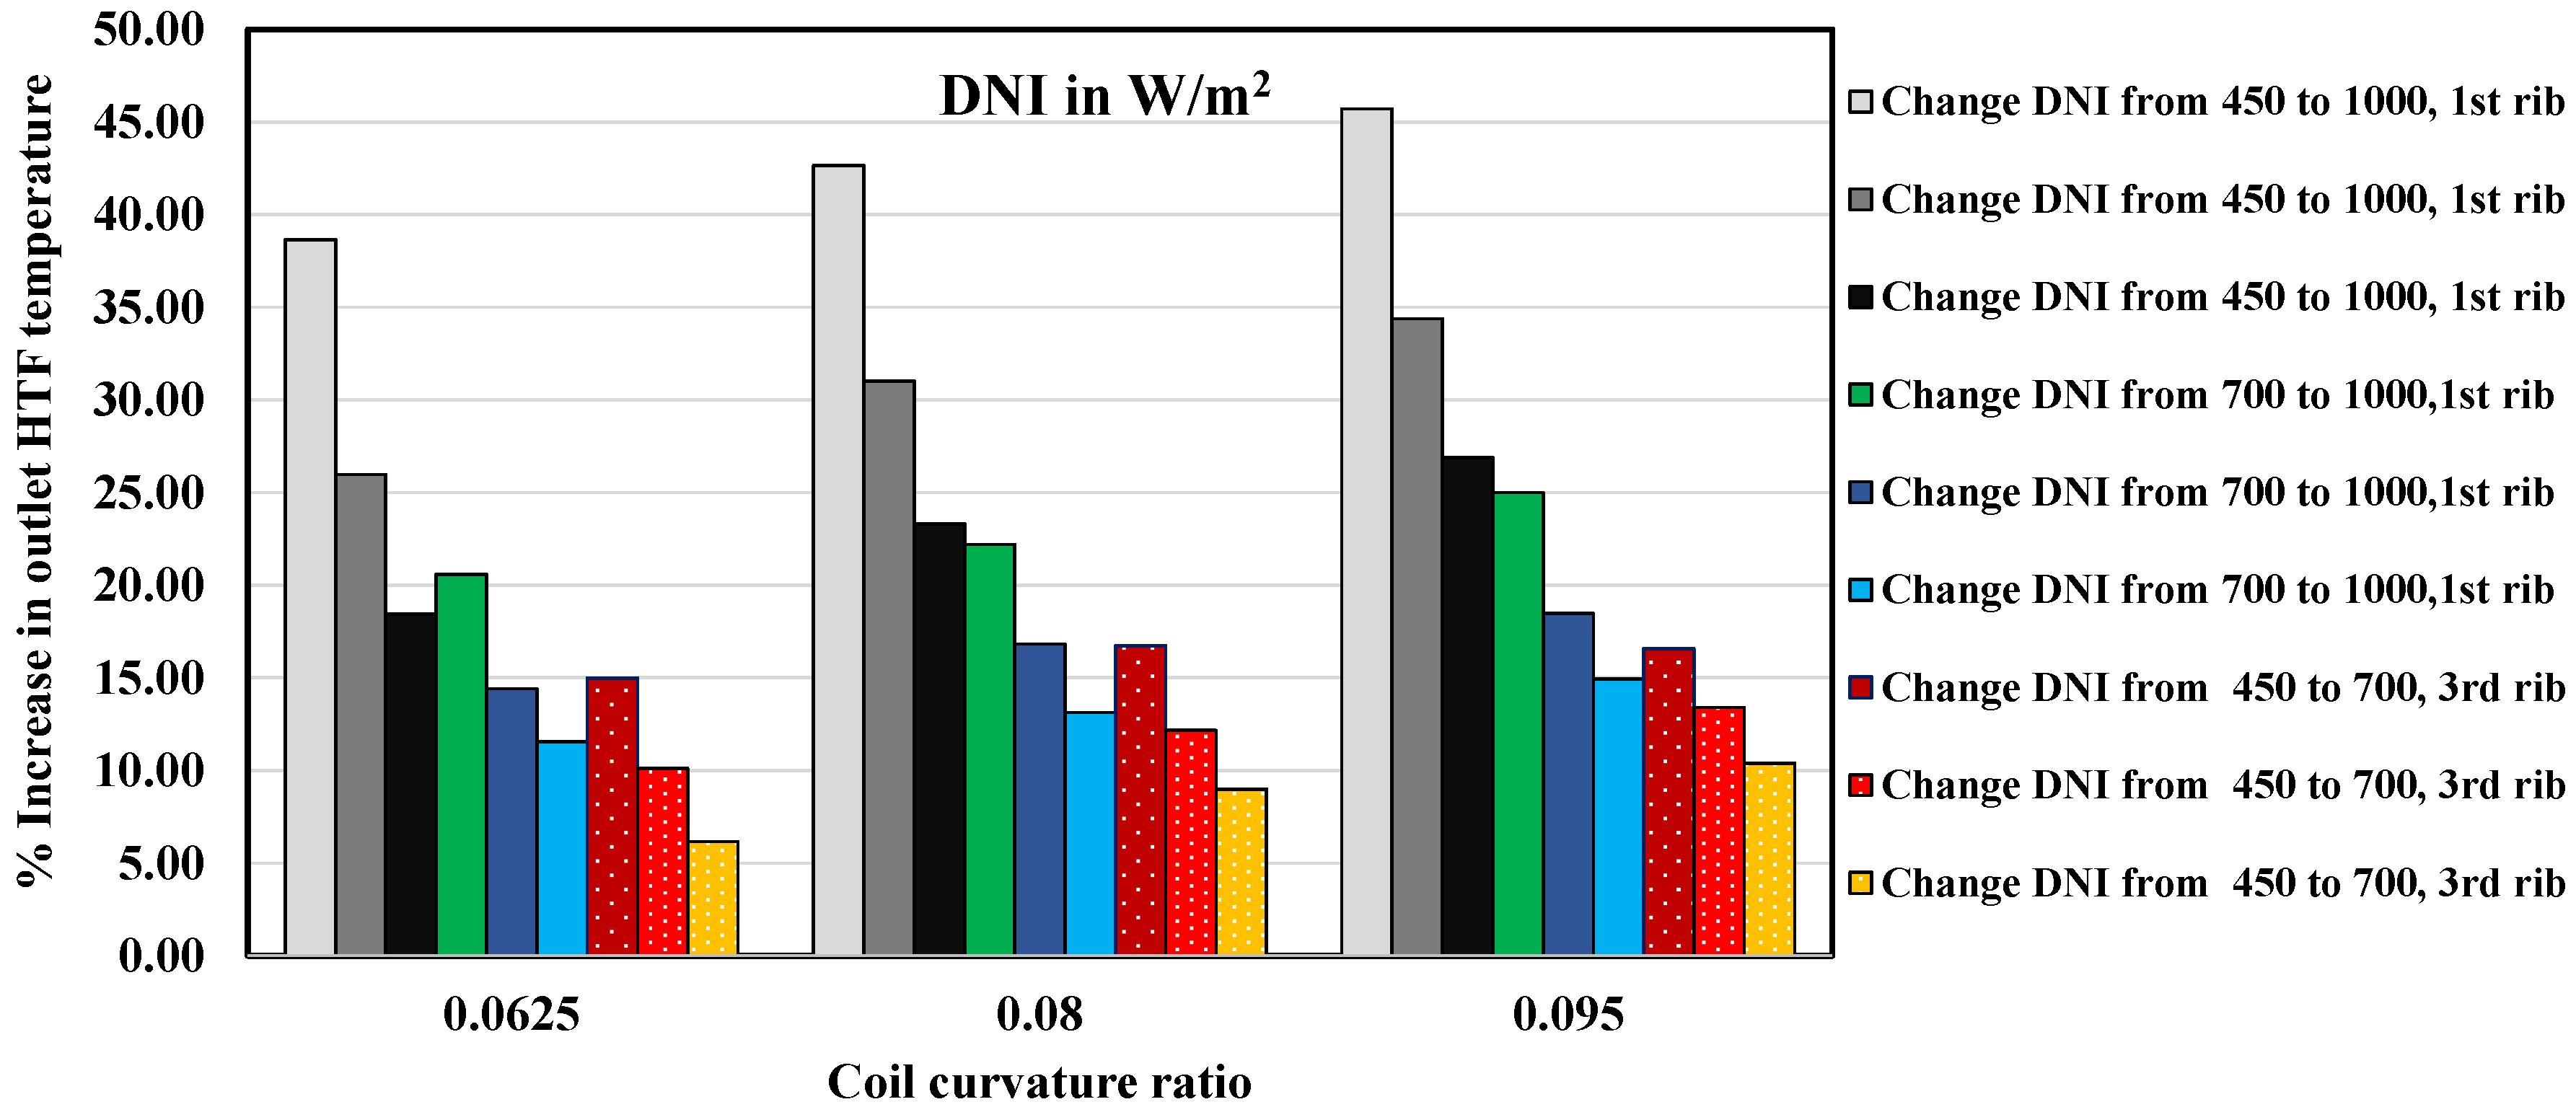
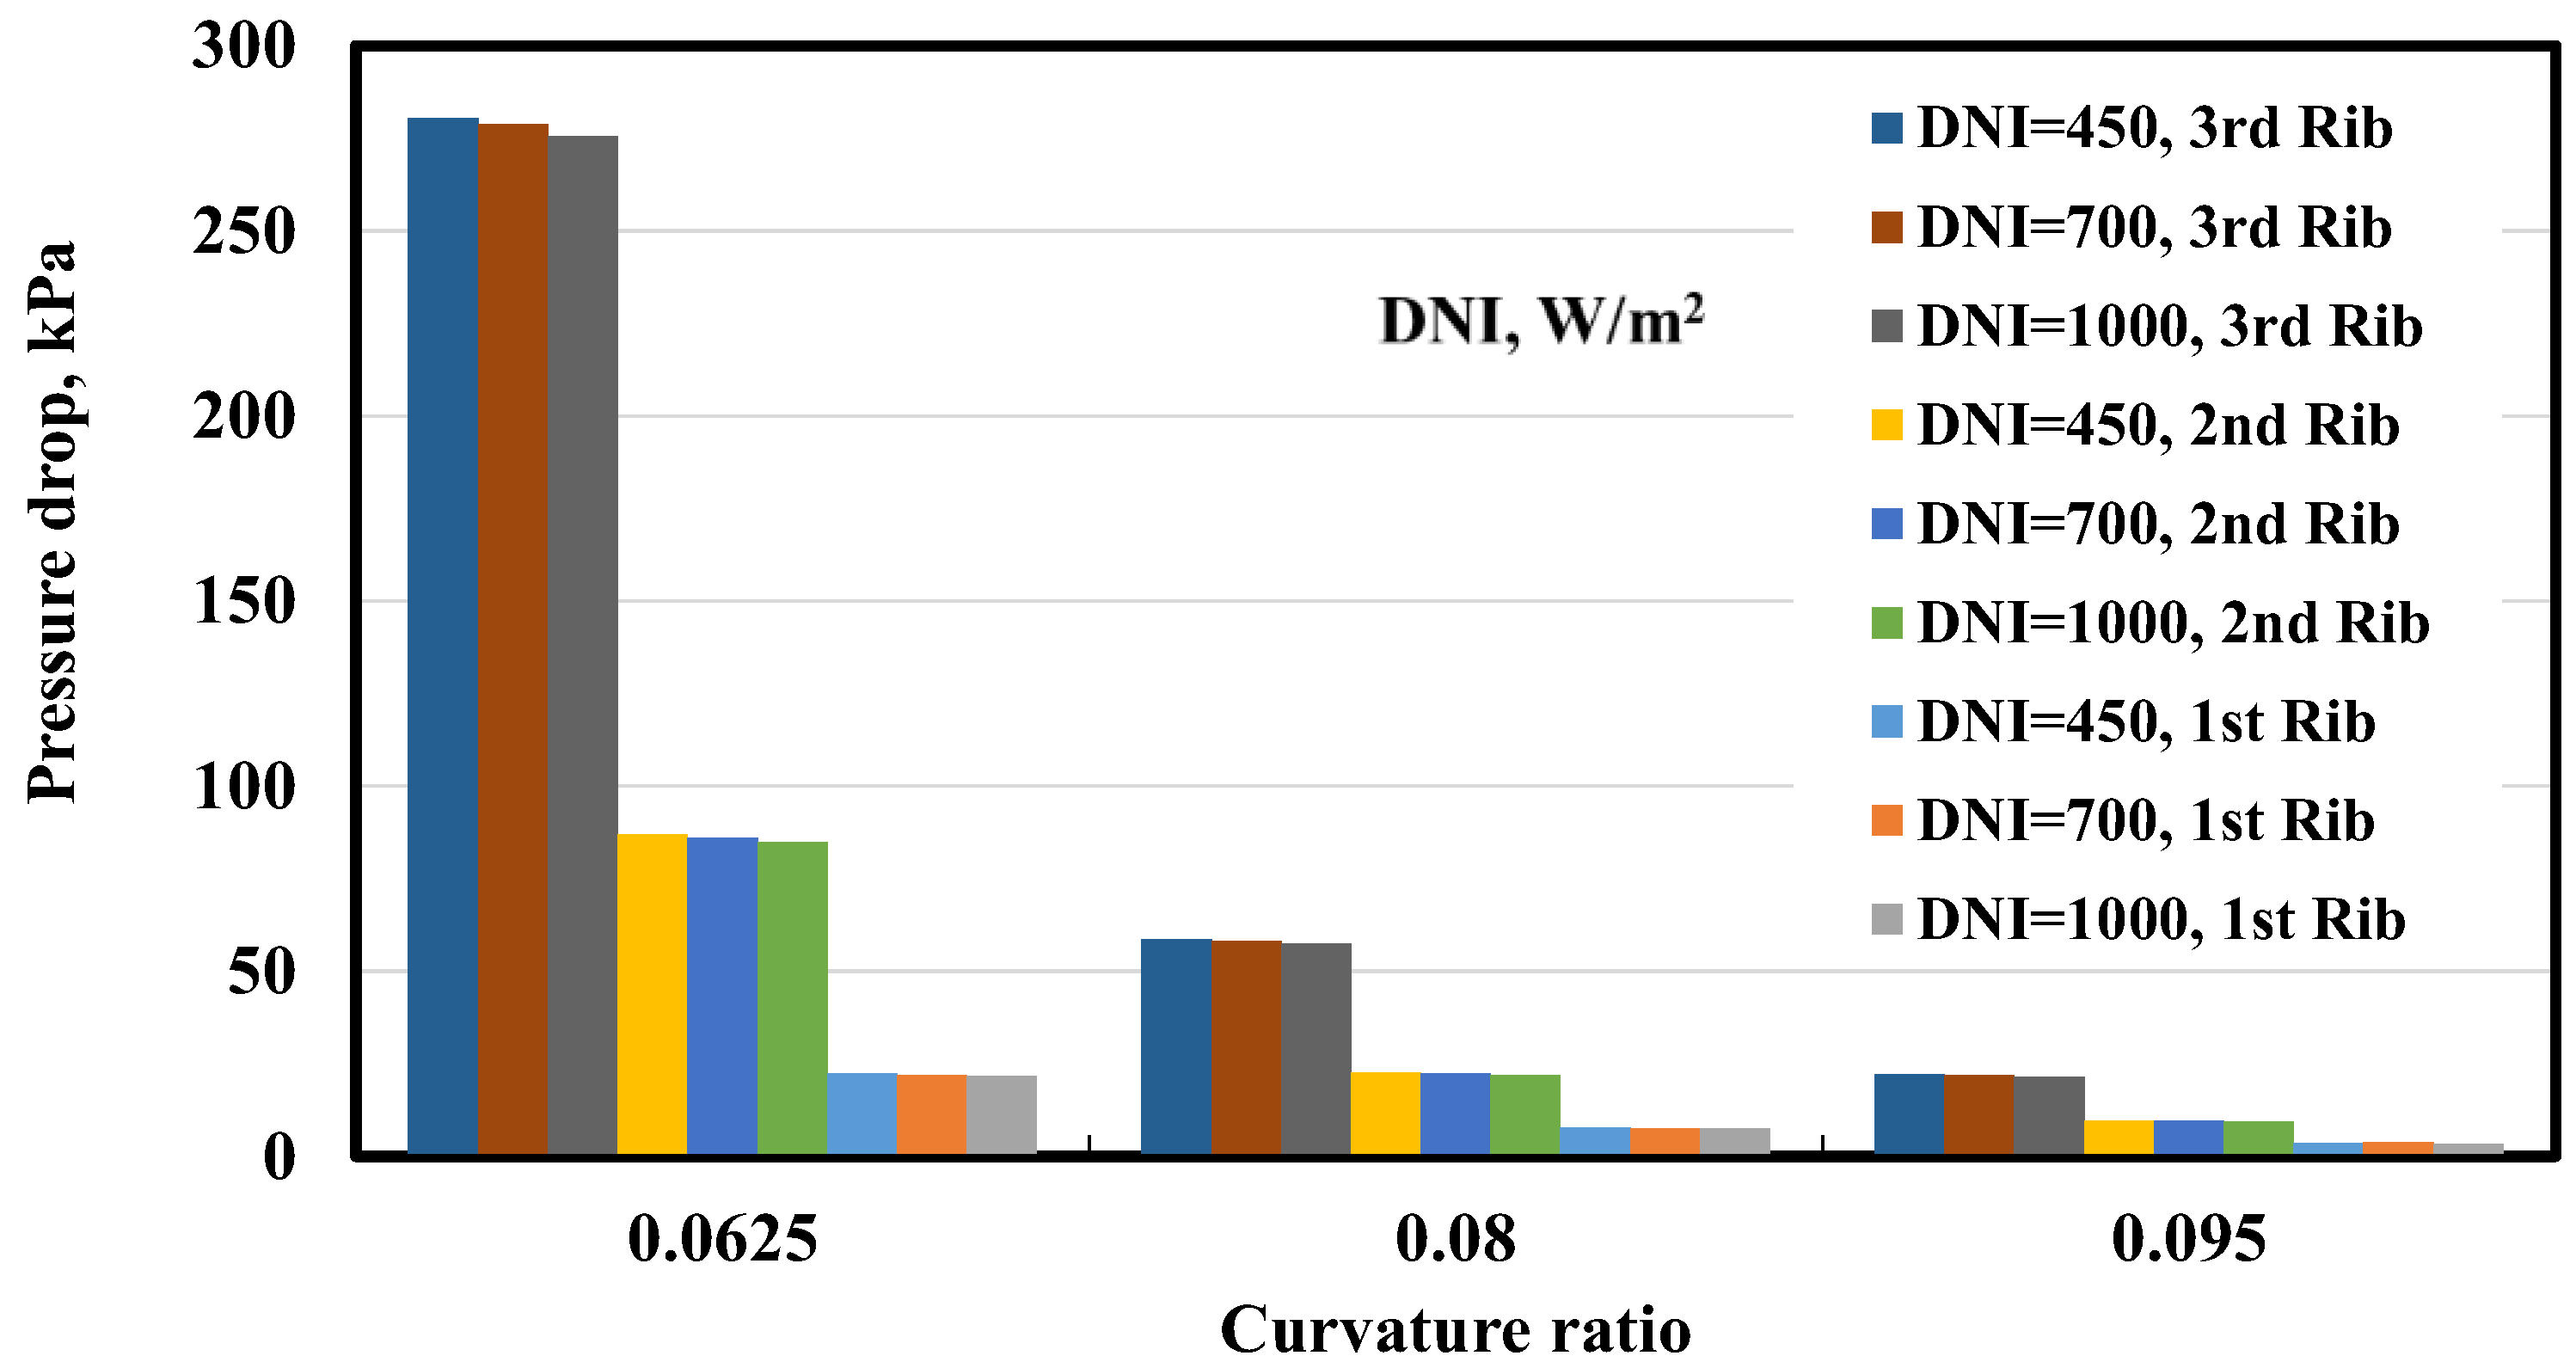
The results obtained through CFD application reveal that the collector output temperature is positively correlated with the DNI and coil curvature ratio. However, the rib height has a negative effect on oil output temperature.
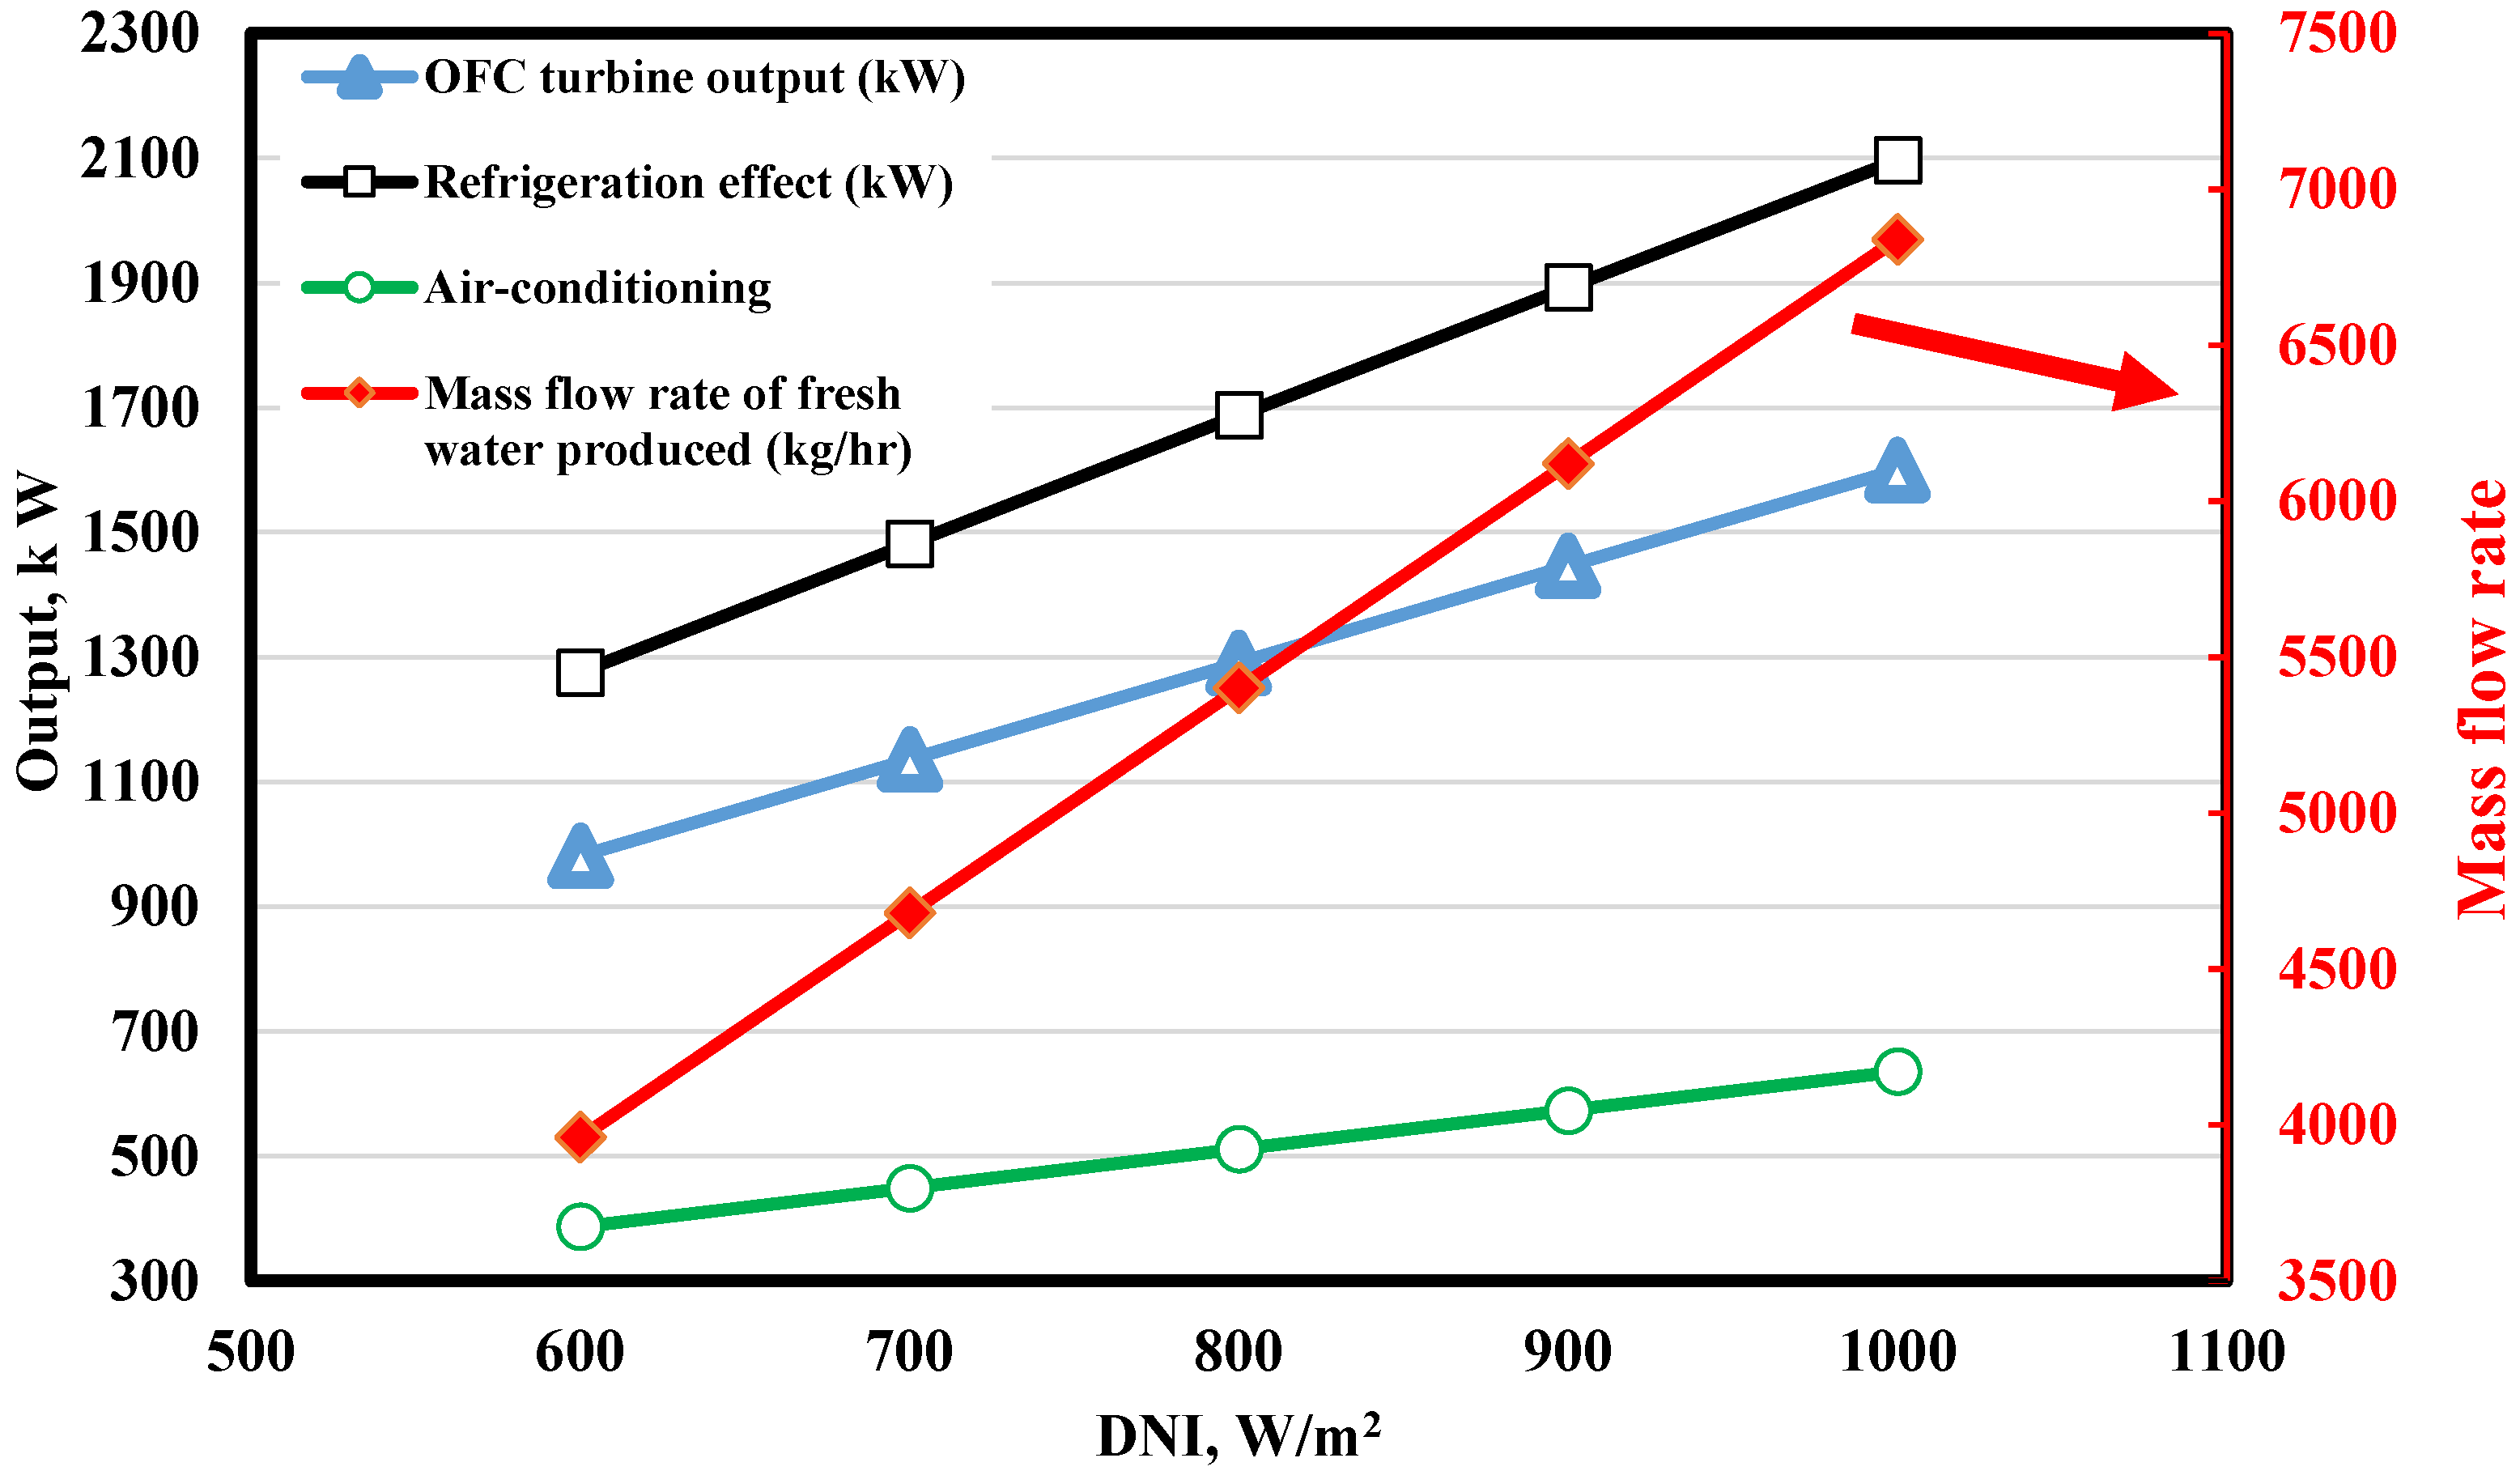
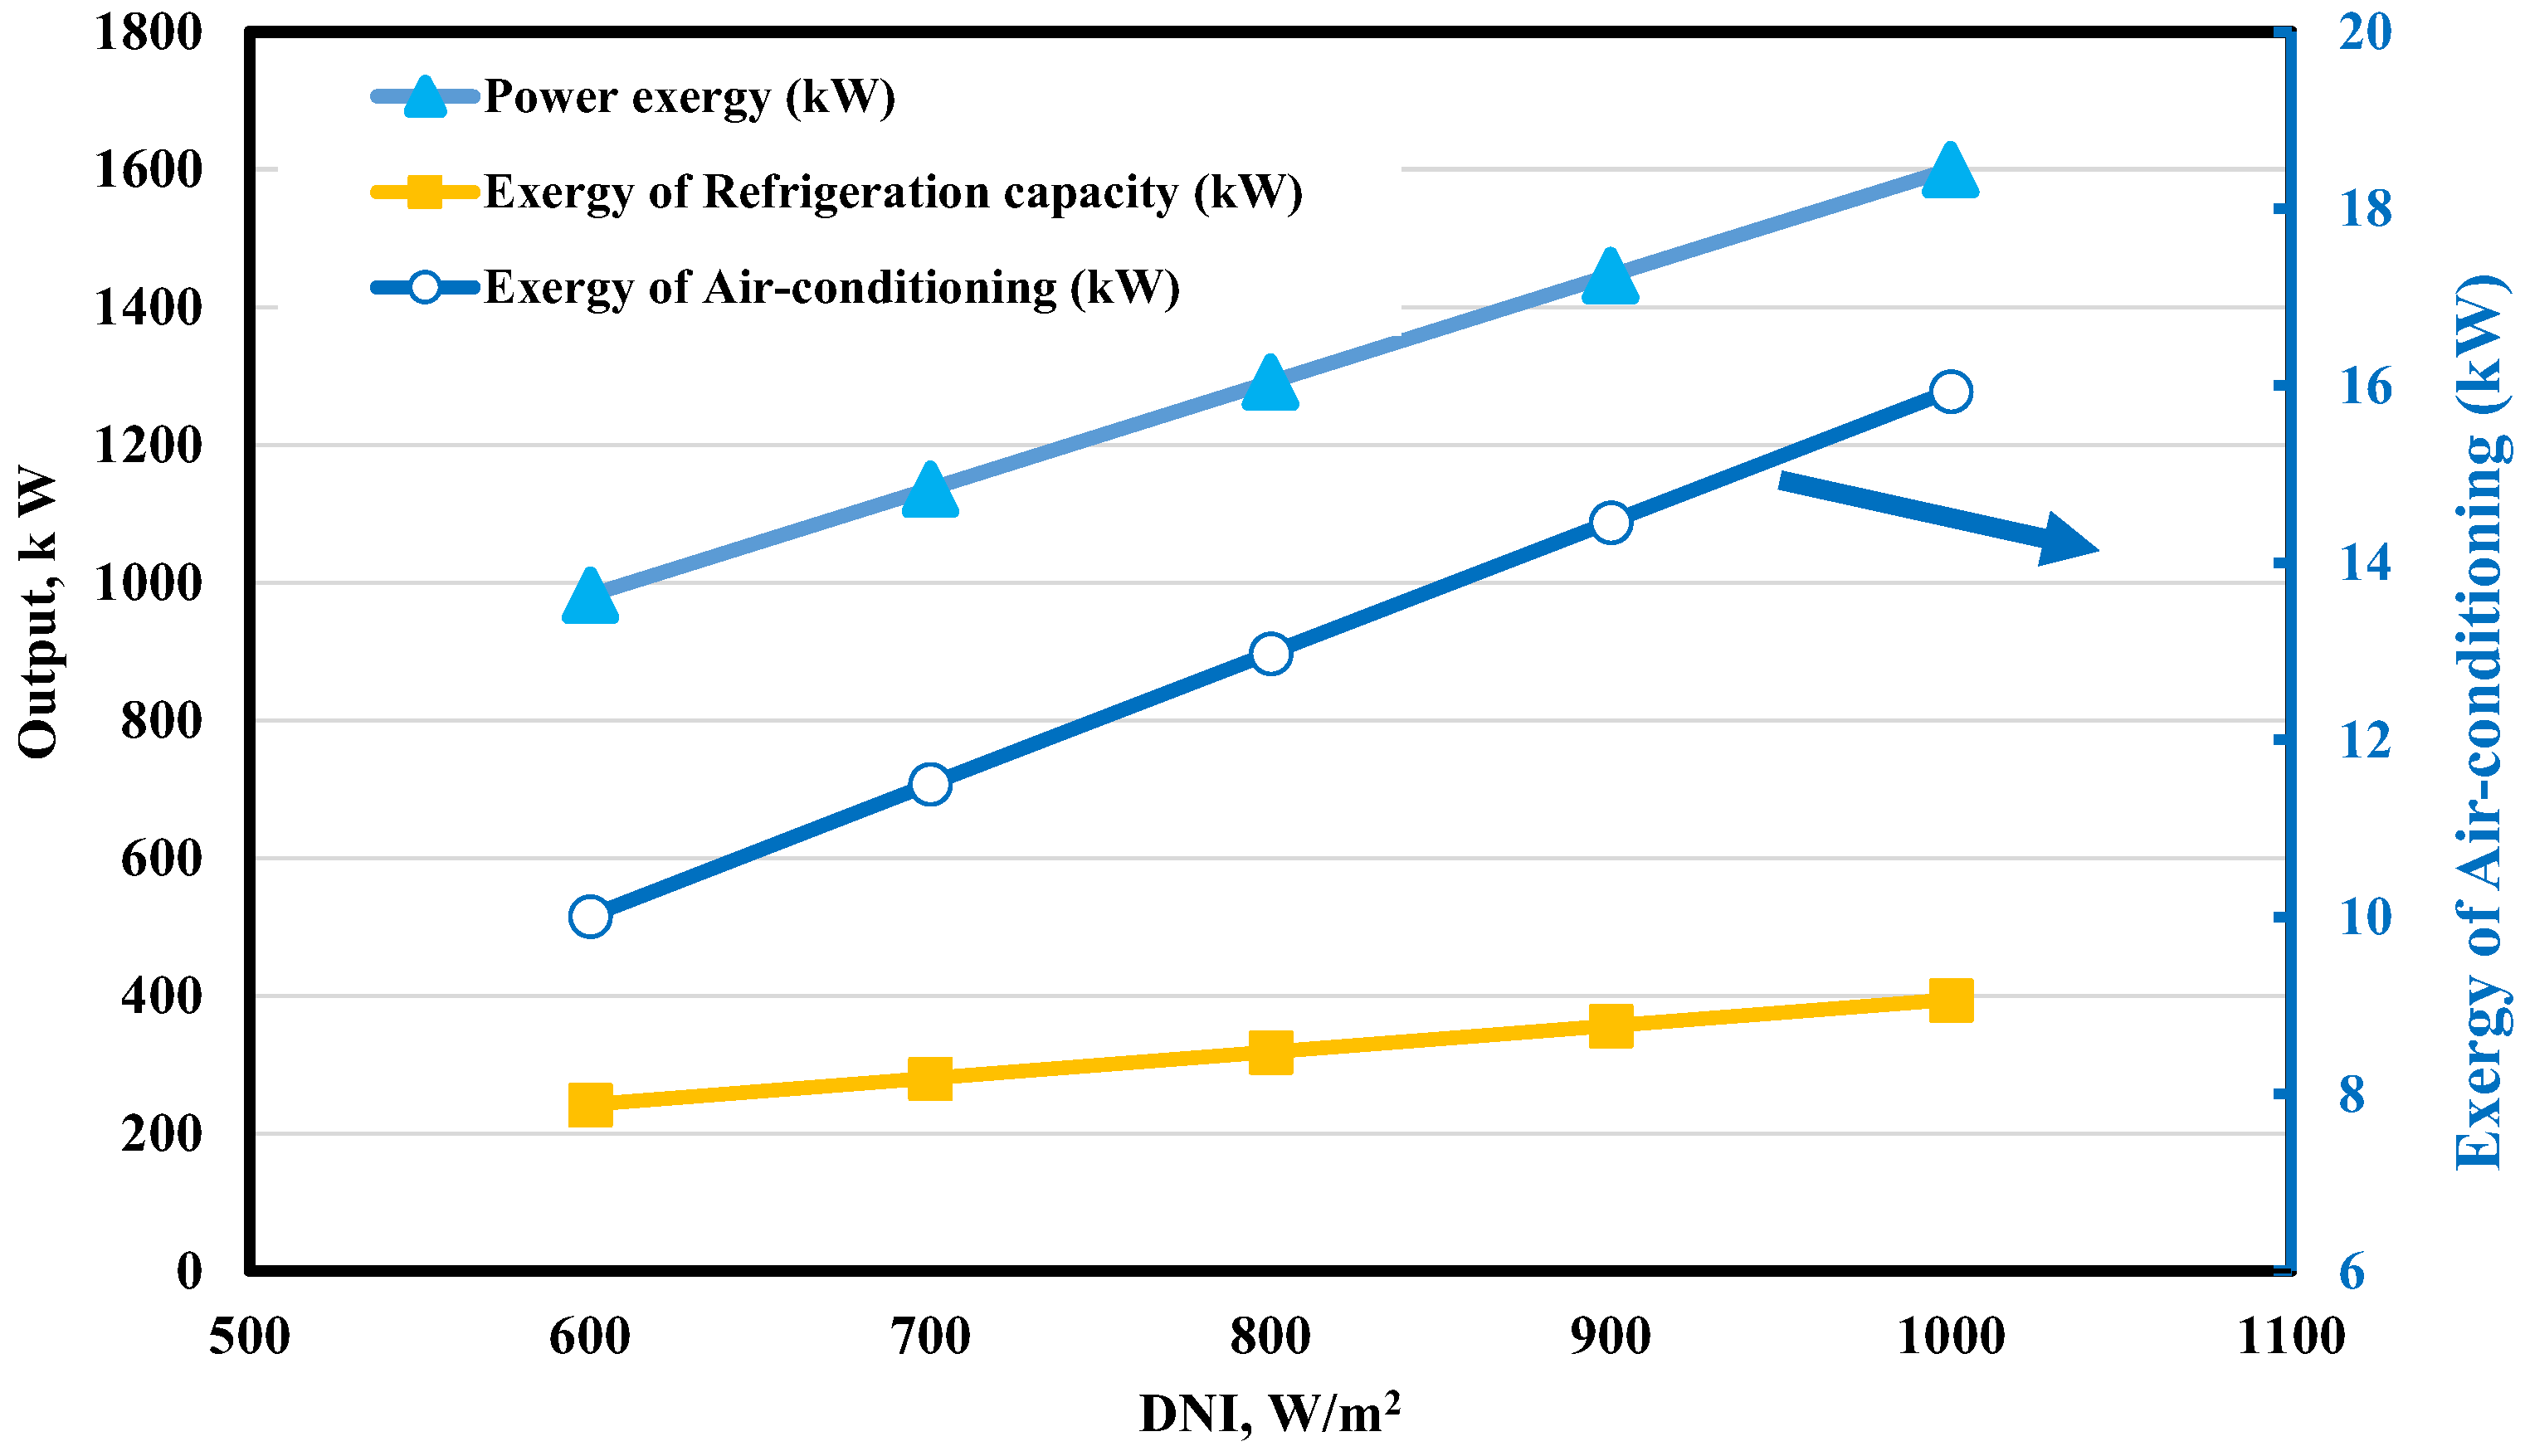
The DNI is found to be one of the system’s dominant operating parameters, as its variation positively affects the beneficial outputs (cooling effect, cooling exergy, and rate of freshwater production) and the system’s performance.
Employing OFC shows superior performance, producing a turbine output of 1292 kW with an exergy efficiency of 26.84%, which is considerably higher than provided using traditional ORC.
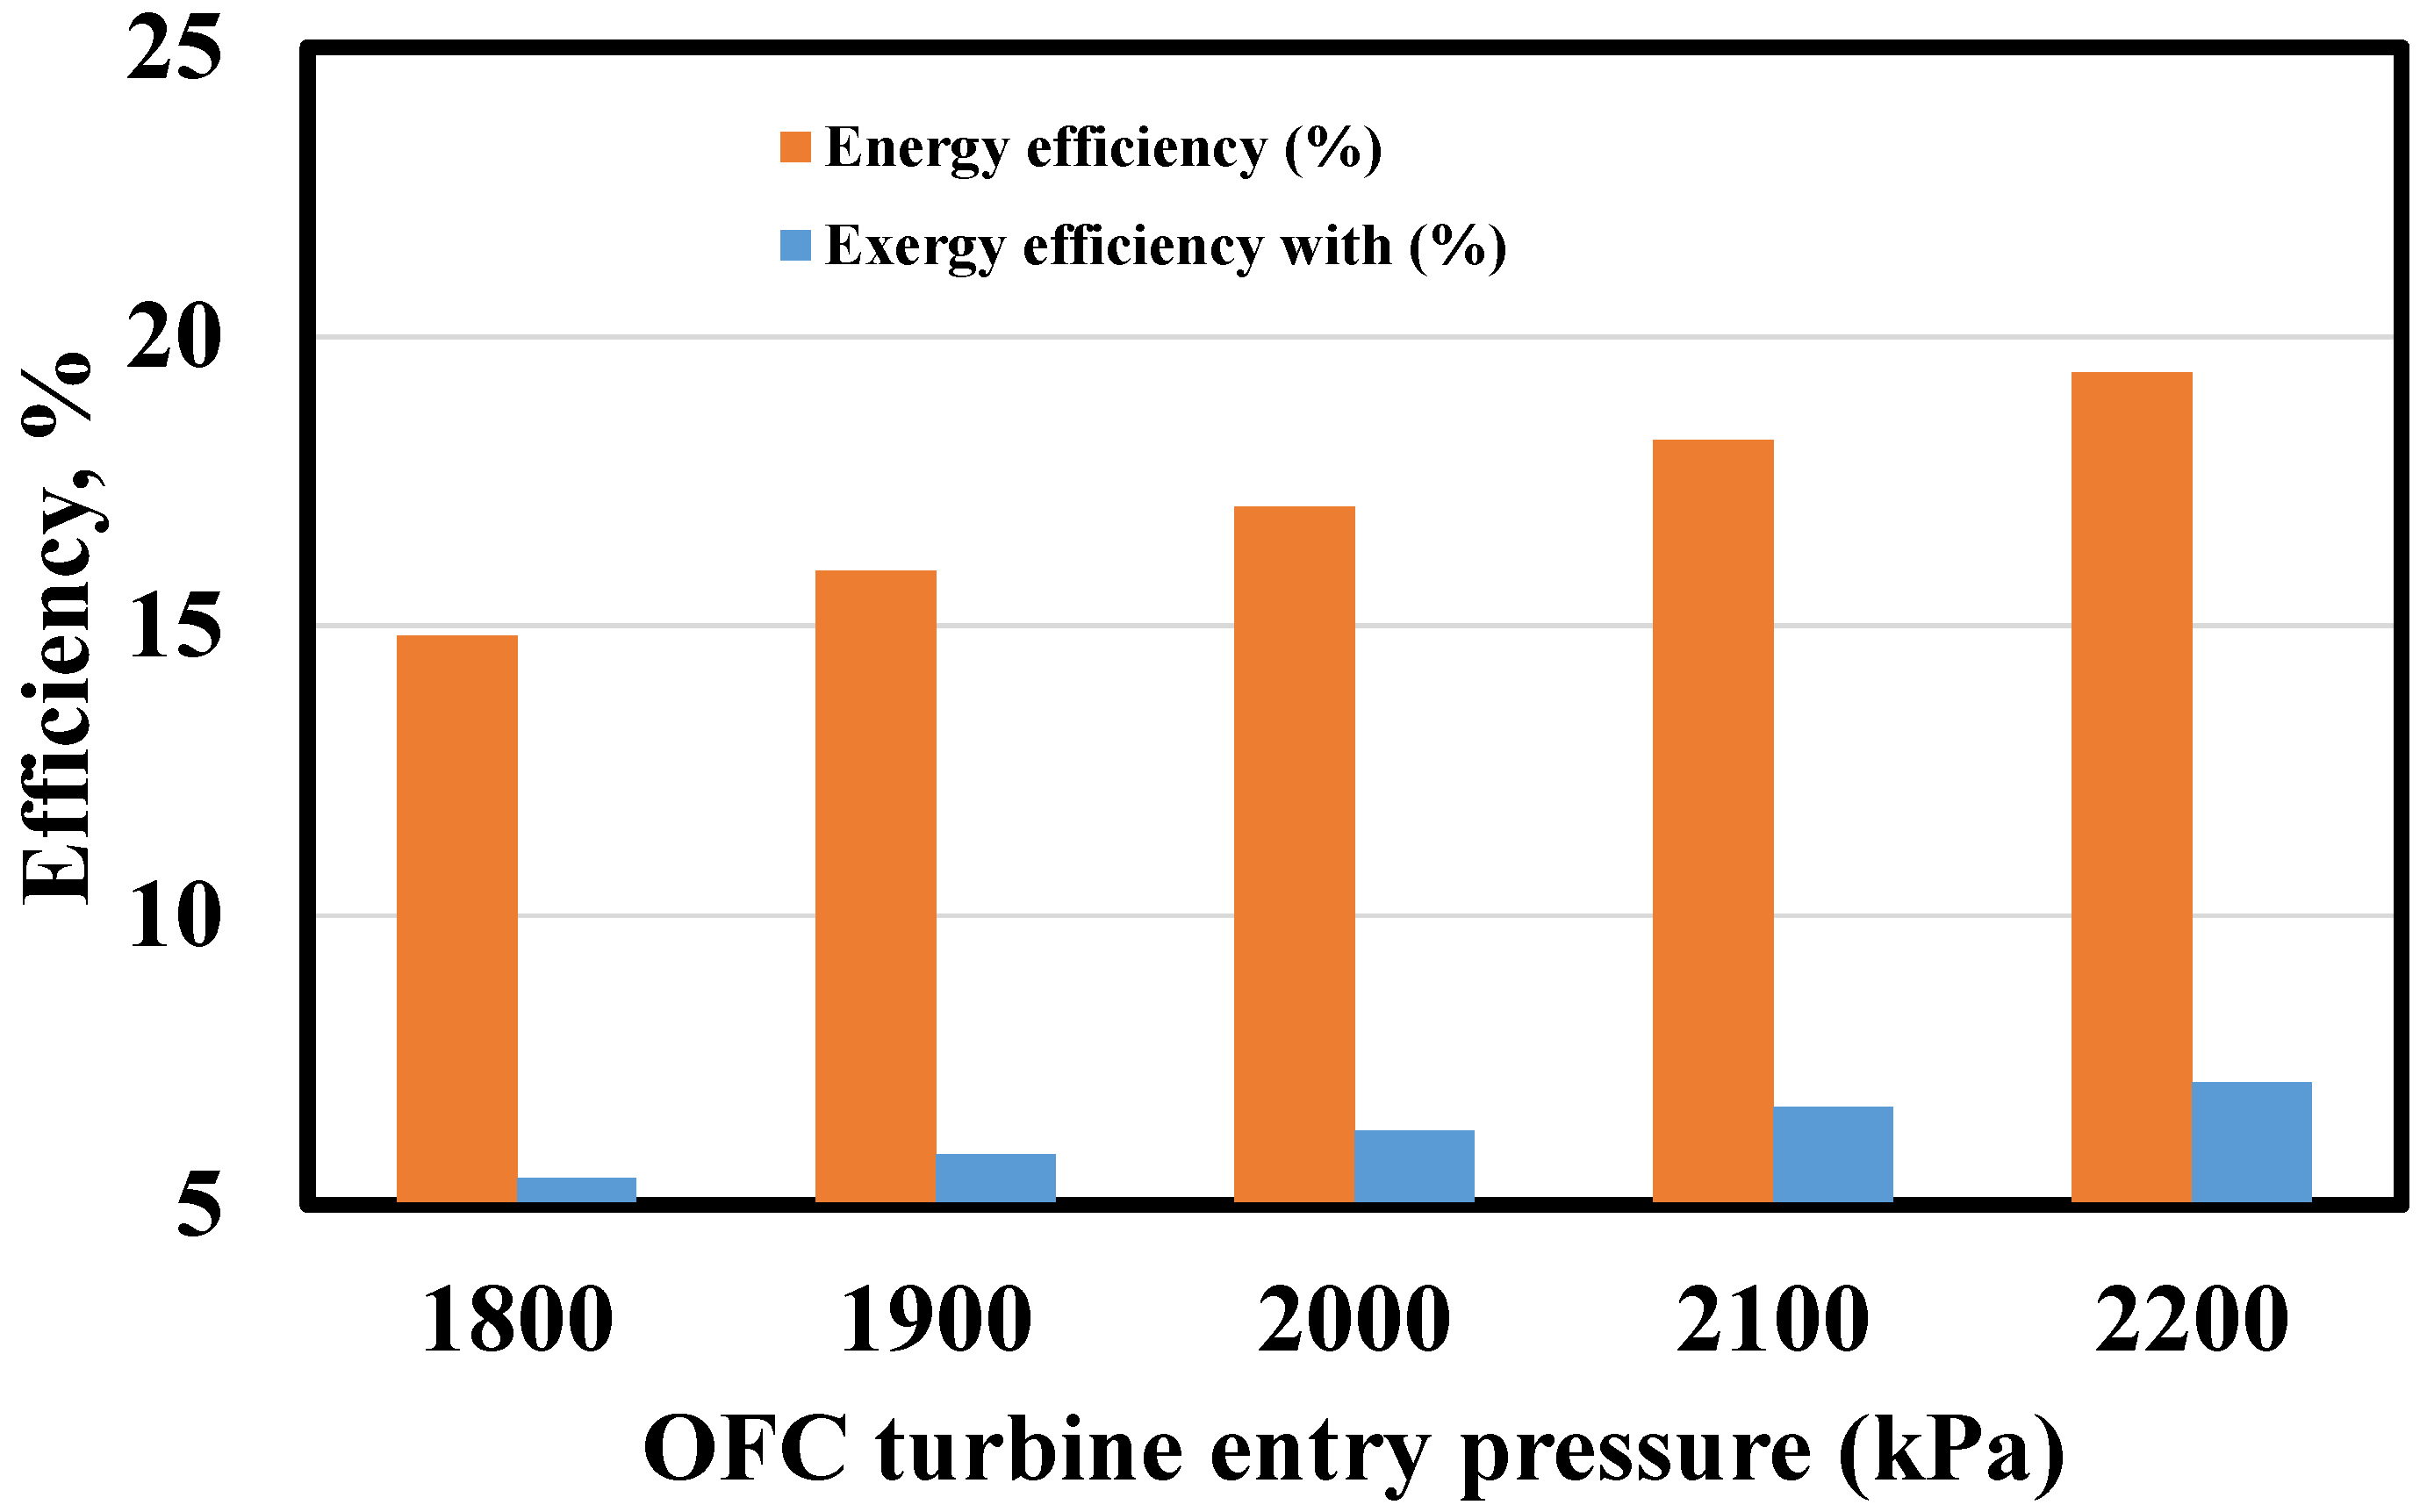
The increase in OFC turbine inlet pressure from 1800 kPa to 2200 kPa increased the energy and exergy efficiencies of the combined cooling-desalination cycle by 21.23% and 1.62%, respectively.
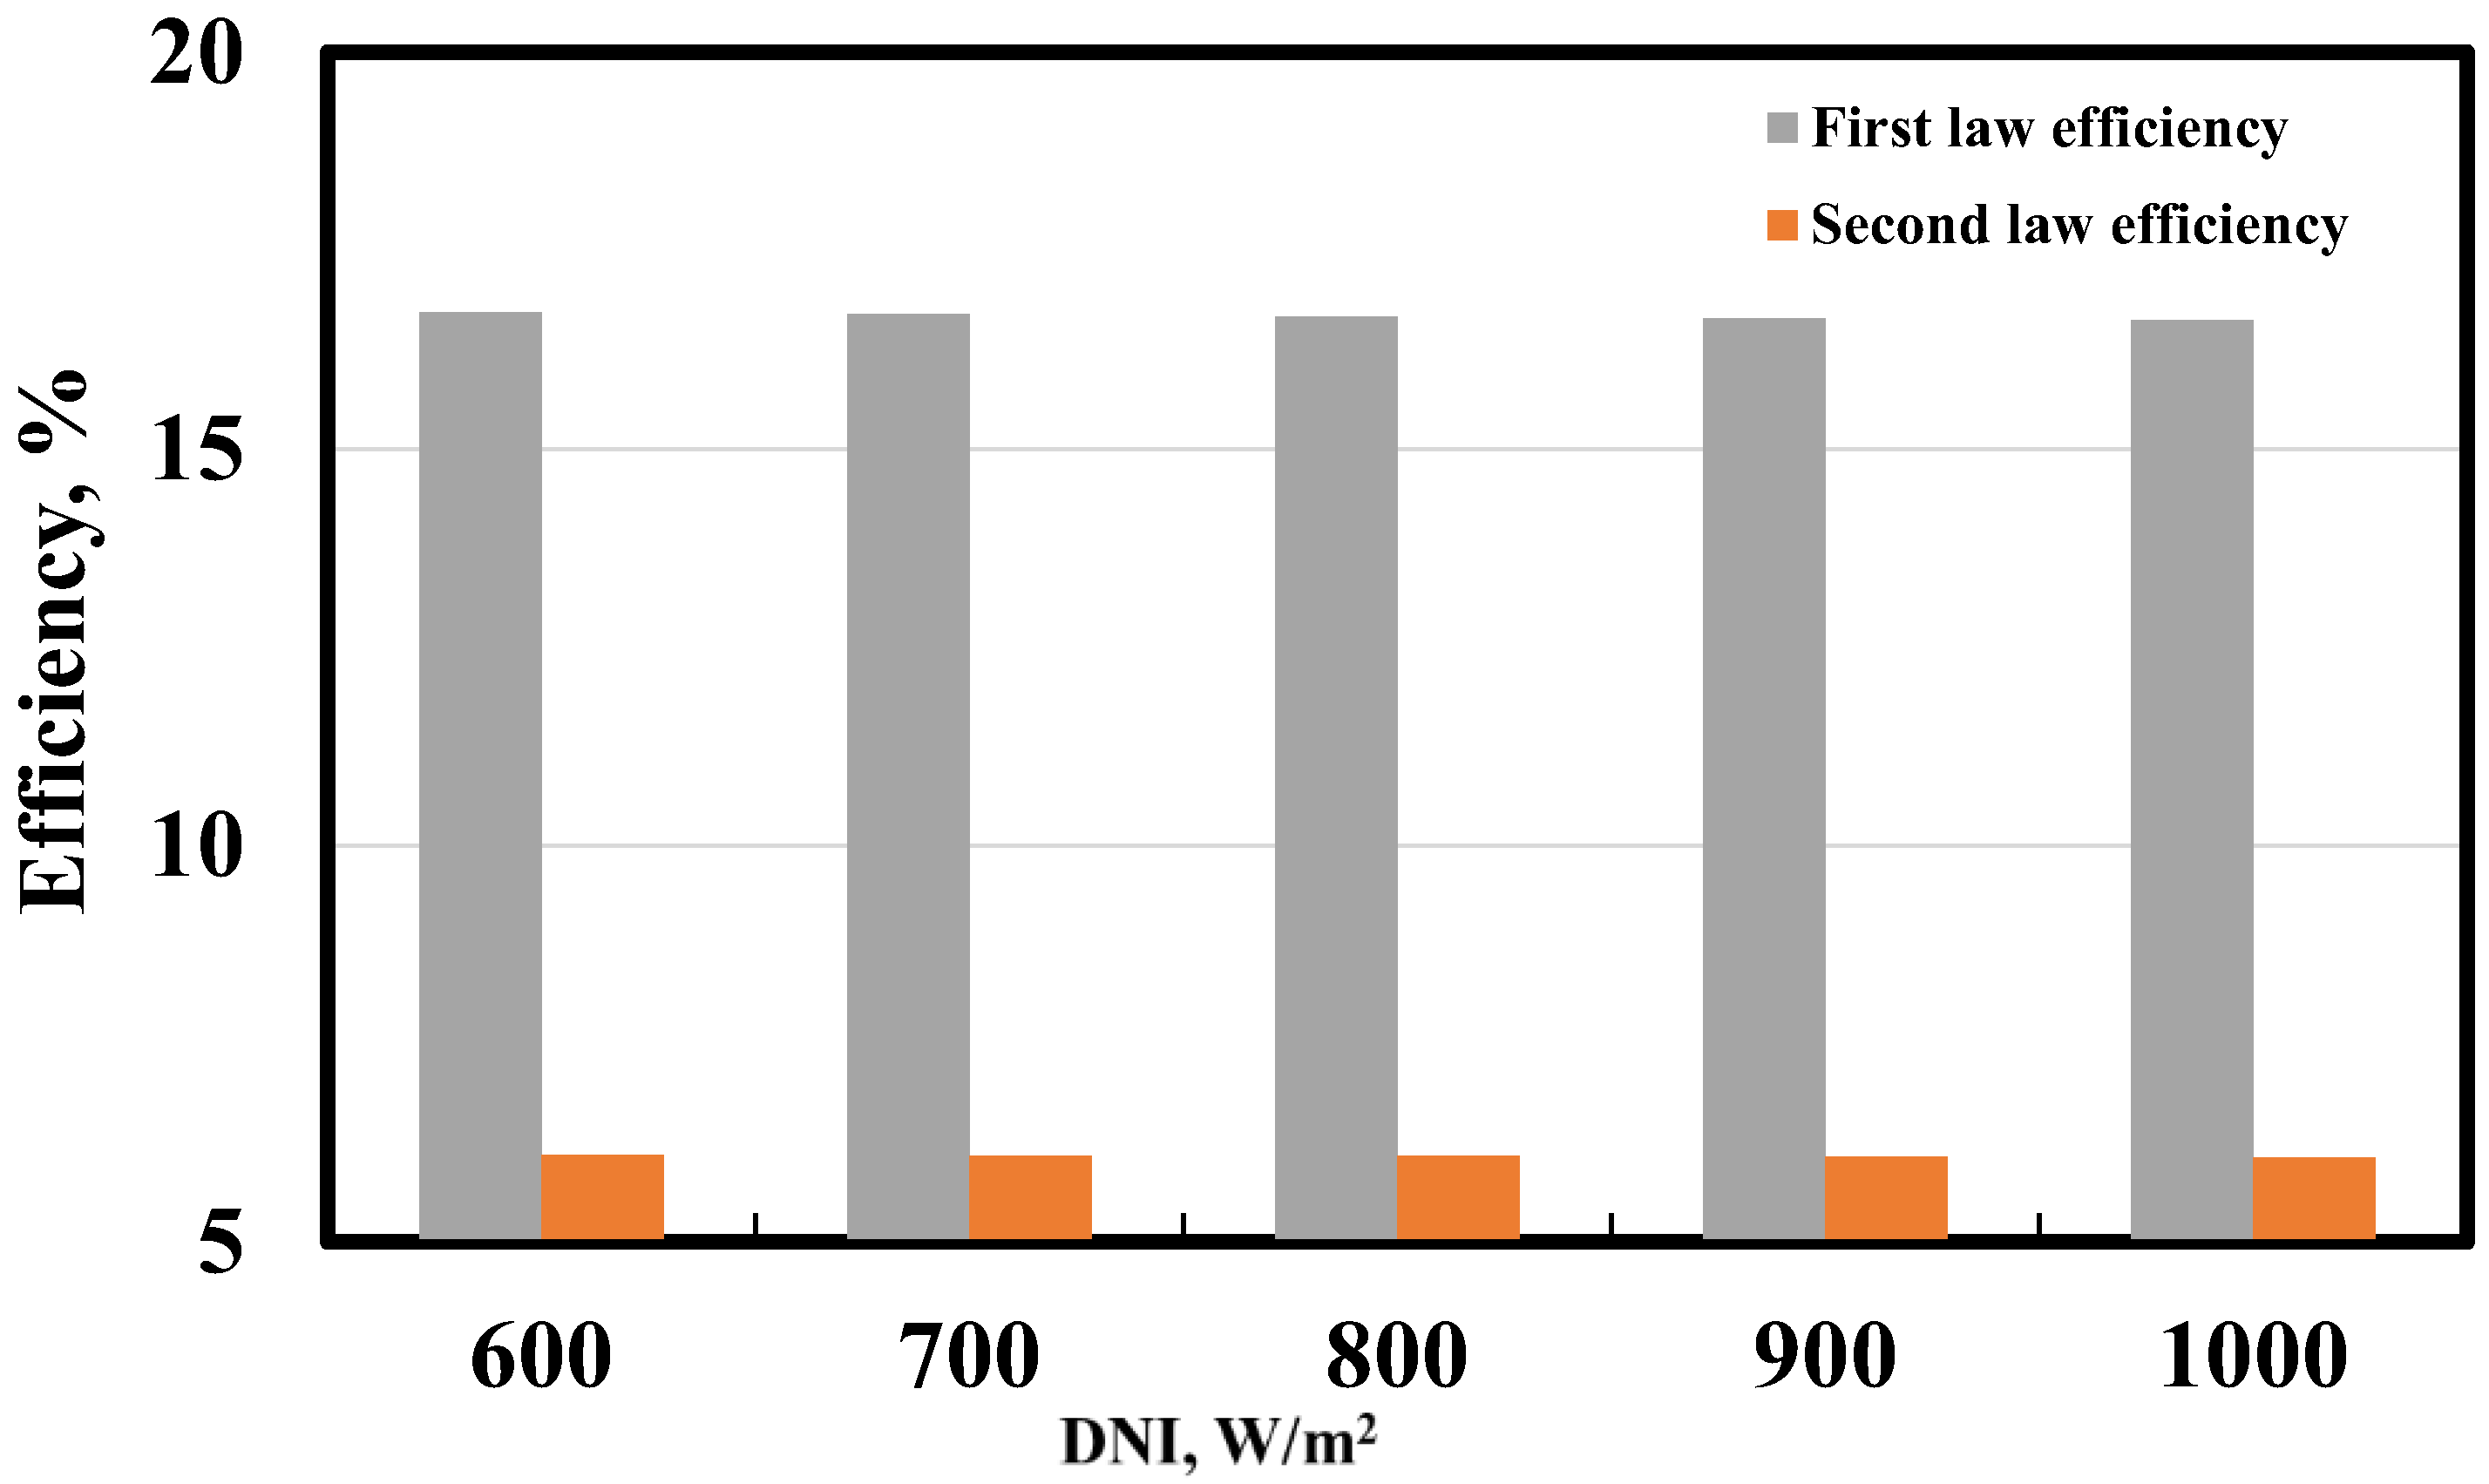
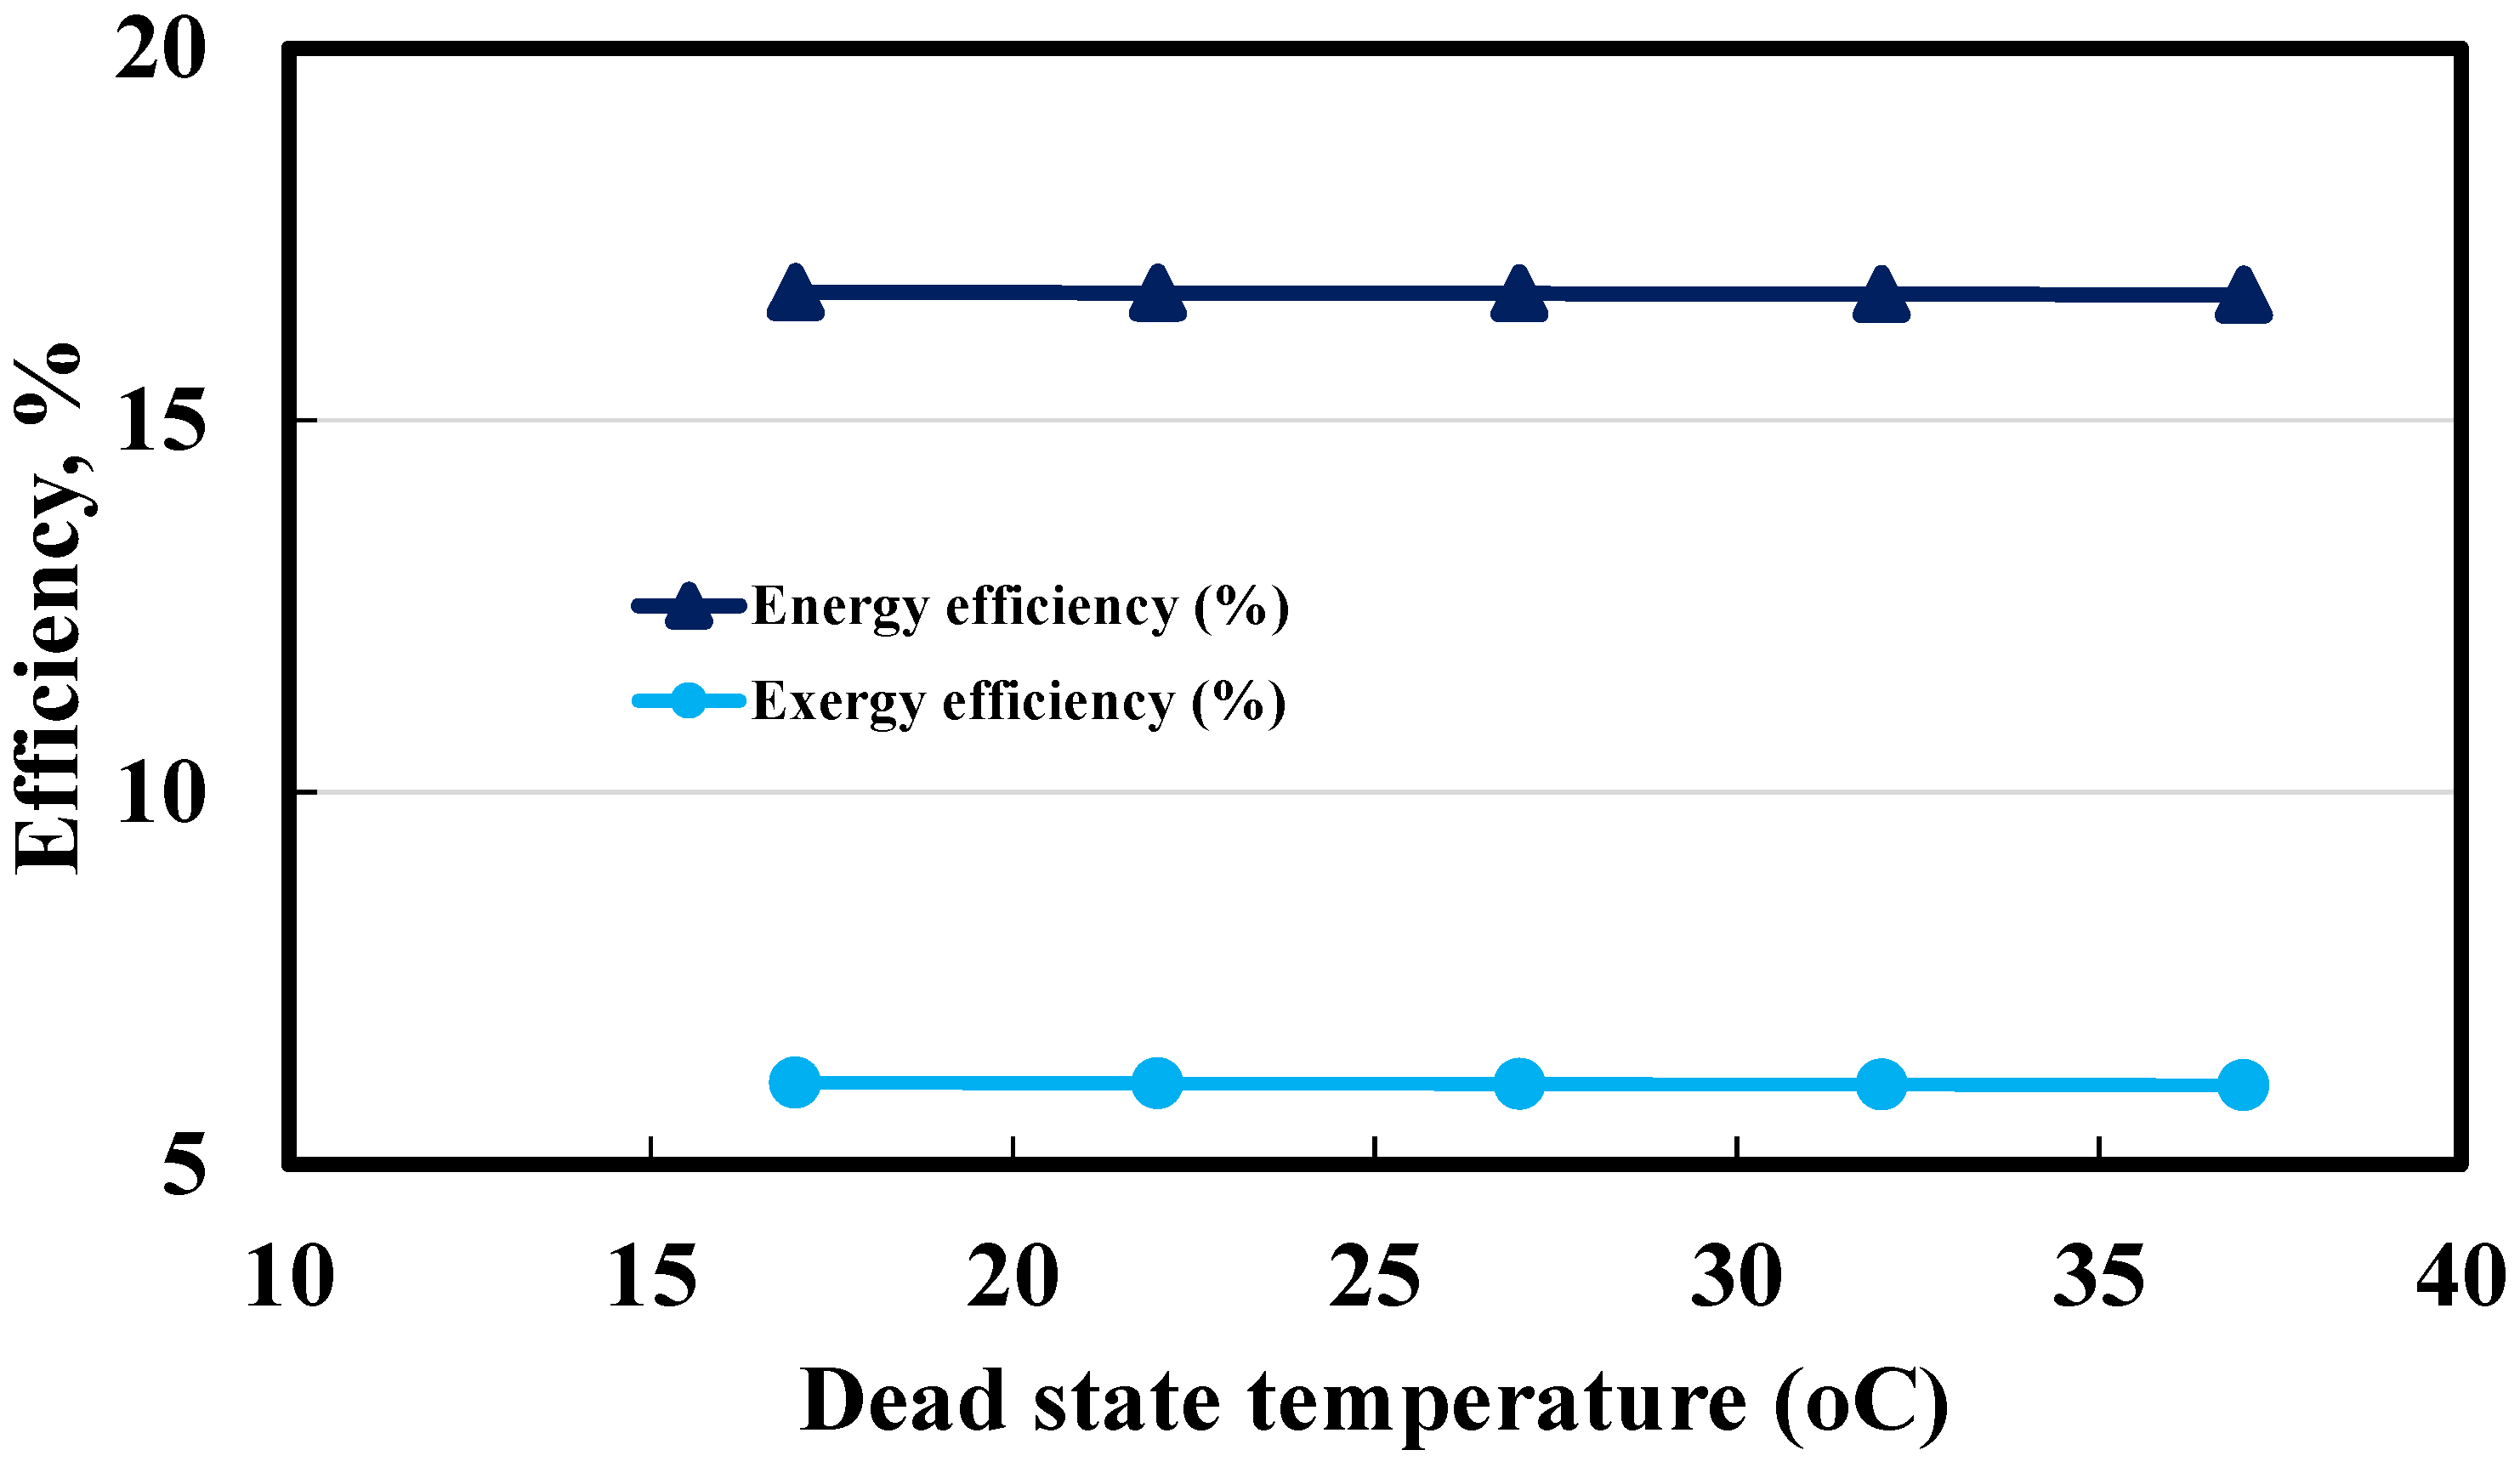
The energy and exergy efficiencies of the designed cogeneration system are found to be less sensitive to climatic conditions (DNI and ambient temperature).
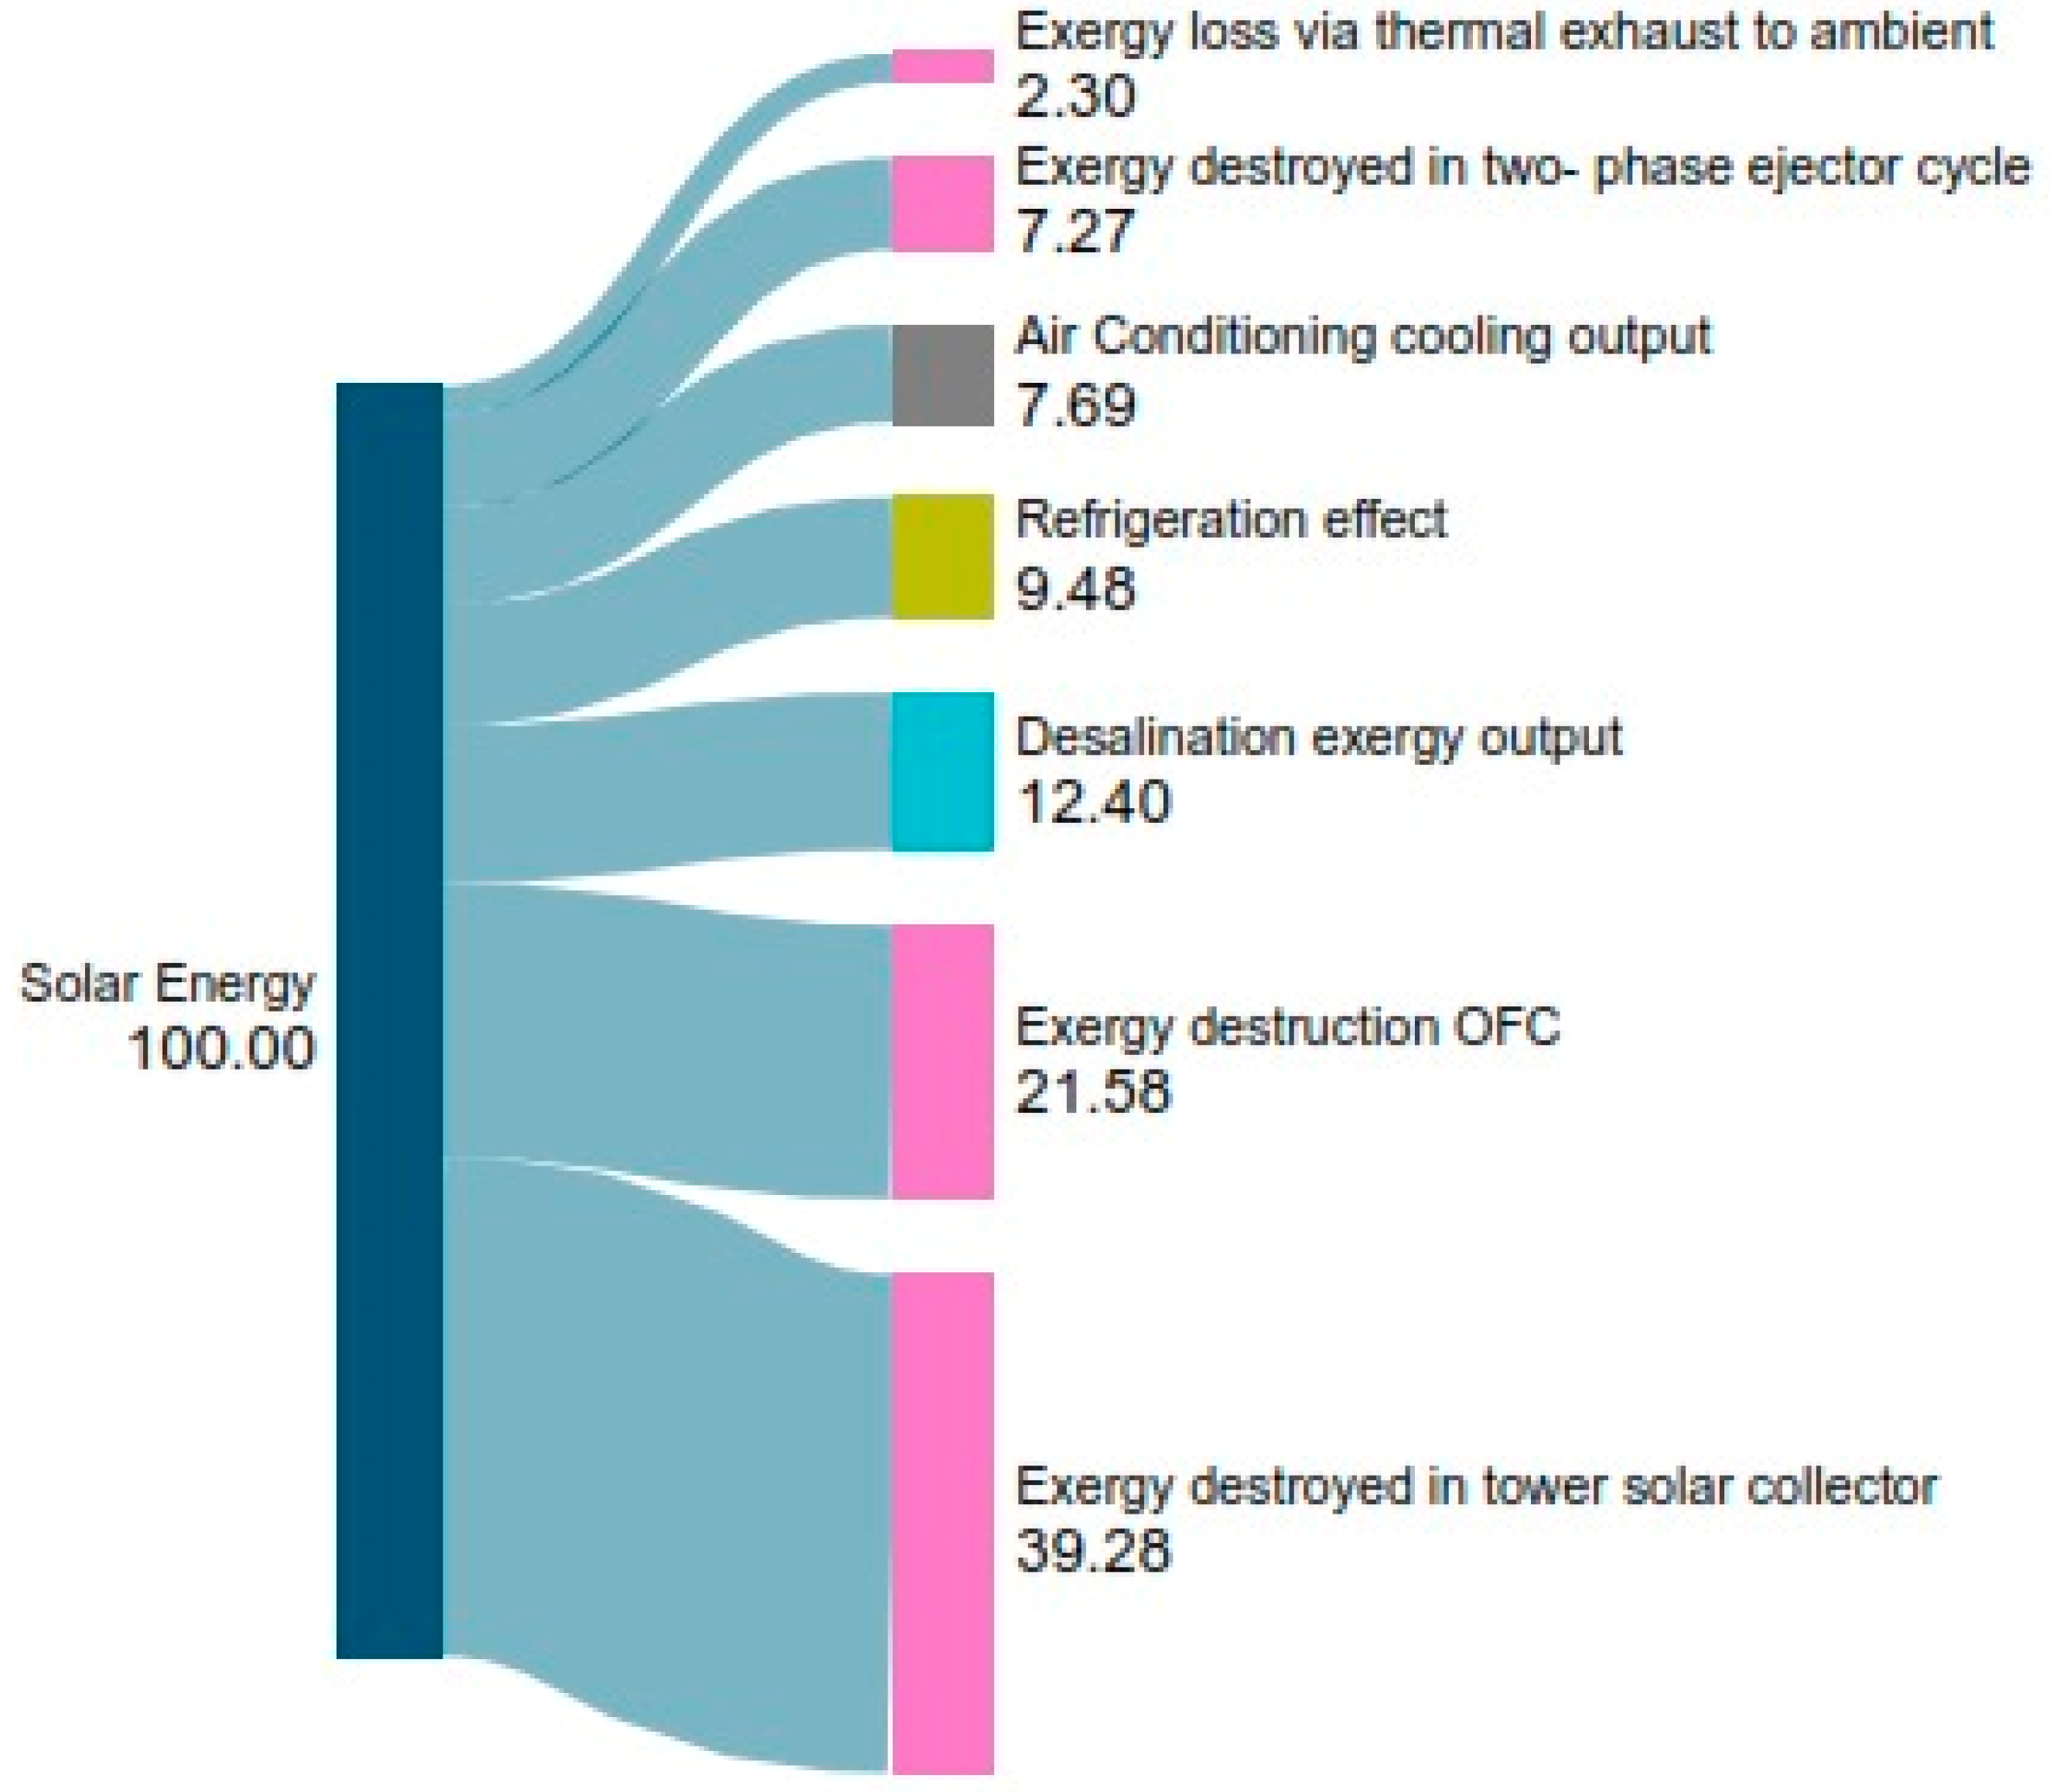
In the base case, 29.57% of the solar exergy appeared as the exergy produced (cooling exergy and the exergy accompanied by freshwater), 68.13% is the exergy destroyed, and 2.3% is the exergy loss via heat transfer between the system and surroundings.
Classification of the destruction of exergy in the overall system revealed the solar collector (39.28% destruction of solar exergy) as the worst-performing component, followed by OFC (21.58%), seawater pump (12.4%), and two-phase ejector cycle (7.27%).
These findings offer valuable insights as they theoretically identify the sub-systems or components responsible for deteriorating the overall system’s performance. Based on this result, it is recommended that any improvement in the performance of the solar collector can significantly enhance the cooling and desalination production rate.
The results of the present work depicted the importance of CFD and exergetic analysis in addressing the impact of climatic conditions on the conversion of solar energy supply into cooling and desalination outputs. Thus, based on the present work’s computed results, future studies can be planned, such as computing the results for the transient performance evaluation of the same system, as it can provide insights into the real behavior of the system. In addition, the cogeneration system developed in this study can be evaluated from an exergo-economic point of view to test its economic viability and technical feasibility as future research.

Author Contributions

Conceptualization, A.K. and H.A.R.; Methodology, A.K.; Software, B.S.A.; Validation, B.S.A.; Formal analysis, H.A.R.; Resources, A.M.A.A.; Data curation, B.S.A.; Writing—original draft, A.K. and H.A.R.; Writing—review & editing, A.M.A.A.; Visualization, A.M.A.A.; Supervision, H.F.E.; Project administration, H.F.E.; Funding acquisition, H.F.E. All authors have read and agreed to the published version of the manuscript.

Funding

This research received no external funding.

Data Availability Statement

No new data were created or analyzed in this study.

Acknowledgments

The authors extend their appreciation to the Deputyship for Research & Innovation, Ministry of Education in Saudi Arabia for funding this research work through the project number MoE-IF-UJ-R2-22-04220258-1.

Conflicts of Interest

The authors declare no conflict of interest.

Nomenclature

Symbols
A p Aperture (m2)
AhHeat transfer area [m2]
DcCoil diameter [mm]
exSpecific flow exergy (kJ/kg)
E x ˙ Exergy   rate   ( kW )
hEnthalpy per unit mass (kJ/kg)
m ˙ Mass flow rate (kg/s)
PPressure (MPa)
Q ˙ Heat transfer per unit time (kW)
sEntropy per unit mass (kJ/kg K)
TTemperature (K)
W ˙ Output power (kW)
ZFlowing stream elevation (m)
Greek symbols
ηEfficiency (%)
Subscript
absAbsorbed
ACAir conditioner
amAmbient
CCompressor
Cond1Condenser 1
Cond2Condenser 2
DDestruction
EjeEjector
EVExpansion valve
ECOEconomizer
EVAEvaporator
frwFreshwater
iInlet
oOutlet
PPump
rReceiver
refRefrigerator
regRegenerator
SepSeparator
SHSuperheater
TTurbine
uUseful
Abbreviations
ACAir conditioning
ARCAbsorption refrigeration cycle
CCHPCombined cooling heating and power
CCPCombined cooling and power
CFDComputational fluid dynamics
CSPConcentrated solar power
DNI Direct normal irradiation (W/m2)
ERCEjector refrigeration cycle
EESEngineering equation solver
HPFHigh-pressure flasher
HRVGHeat recovery vapor generator
HeHelium
HXHeat exchanger
LPFLow-pressure flasher
OFCOrganic flash cycle
ORCOrganic Rankine cycle
ROReverse osmosis
SHTFSolar heat transfer fluid
SWPSeawater pump

References

  1. Ozlu, S.; Dincer, I. Analysis and evaluation of a new solar energy-based multigeneration system. Int. J. Energy Res. 2016, 40, 1339–1354. [Google Scholar] [CrossRef]
  2. Palomba, V.; Vasta, S.; Freni, A.; Pan, Q.; Wang, R.; Zhai, X. Increasing the share of renewables through adsorption solar cooling: A validated case study. Renew. Energy 2017, 110, 126–140. [Google Scholar] [CrossRef]
  3. Ghaith, F.A.; Razzaq, H.-U. Performance of solar powered cooling system using parabolic trough collector in UAE. Sustain. Energy Technol. Assess. 2017, 23, 21–32. [Google Scholar] [CrossRef]
  4. Anjum, A.; Mishra, R.S.; Samsher. Thermodynamic assessment of a novel solar powered trigeneration system for combined power generation, heating, and cooling. Proc. Inst. Mech. Eng. Part C J. Mech. Eng. Sci. 2024, 238, 7308–7321. [Google Scholar] [CrossRef]
  5. Drosou, V.; Kosmopoulos, P.; Papadopoulos, A. Solar cooling system using concentrating collectors for office buildings: A case study for Greece. Renew. Energy 2016, 97, 697–708. [Google Scholar] [CrossRef]
  6. Pawar, S.S.; Sunnapwar, V.K. Studies on convective heat transfer through helical coils. Heat Mass Transf. 2013, 49, 1741–1754. [Google Scholar] [CrossRef]
  7. Fouda, A.; Nada, S.; Elattar, H.; Refaey, H.; Bin-Mahfouz, A.S. Thermal performance modeling of turbulent flow in multi tube in tube helically coiled heat exchangers. Int. J. Mech. Sci. 2018, 135, 621–638. [Google Scholar] [CrossRef]
  8. Prakash, A.; Chandraker, D. Numerical & experimental study of single-phase flow in helically coiled pipes for laminar & turbulent regimes. Prog. Nucl. Energy 2025, 180, 105637. [Google Scholar] [CrossRef]
  9. Swanepoel, J.K.; le Roux, W.G.; Lexmond, A.S.; Meyer, J.P. Helically coiled solar cavity receiver for micro-scale direct steam generation. Appl. Therm. Eng. 2021, 185, 116427. [Google Scholar] [CrossRef]
  10. Khaliq, A.; Refaey, H.; Alharthi, M.A. Development and analysis of a novel CSP source driven cogeneration cycle for the production of electric power and low temperature refrigeration. Int. J. Refrig. 2021, 130, 330–346. [Google Scholar] [CrossRef]
  11. Yu, W.; Wang, H.; Ge, Z. Comprehensive analysis of a novel power and cooling cogeneration system based on organic Rankine cycle and ejector refrigeration cycle. Energy Convers. Manag. 2021, 232, 113898. [Google Scholar] [CrossRef]
  12. Zhang, T.; Mohamed, S. Conceptual Design and Analysis of Hydrocarbon-Based Solar Thermal Power and Ejector Cooling Systems in Hot Climates. J. Sol. Energy Eng. 2014, 137, 021001. [Google Scholar] [CrossRef]
  13. Elakhdar, M.; Landoulsi, H.; Tashtoush, B.; Nehdi, E.; Kairouani, L. A combined thermal system of ejector refrigeration and Organic Rankine cycles for power generation using a solar parabolic trough. Energy Convers. Manag. 2019, 199, 111947. [Google Scholar] [CrossRef]
  14. Yadav, V.K.; Sarkar, J.; Ghosh, P. Performance optimization and multi-objective analysis of an innovative solar-driven combined power and cooling system. Energy Build. 2024, 307, 113943. [Google Scholar] [CrossRef]
  15. Shokati, N.; Ranjbar, F.; Yari, M. Comparative and parametric study of double flash and single flash/ORC combined cycles based on exergoeconomic criteria. Appl. Therm. Eng. 2015, 91, 479–495. [Google Scholar] [CrossRef]
  16. Chen, H.; Kim, M.H. Thermodynamic Analysis and Working Fluid Selection of a Novel Cogeneration System Based on a Regenerative Organic Flash Cycle. Energies 2022, 15, 7843. [Google Scholar] [CrossRef]
  17. Lee, H.Y.; Park, S.H.; Kim, K.H. Comparative analysis of thermodynamic performance and optimization of organic flash cycle (OFC) and organic Rankine cycle (ORC). Appl. Therm. Eng. 2016, 100, 680–690. [Google Scholar] [CrossRef]
  18. Varma, G.V.P.; Srinivas, T. Power generation from low temperature heat recovery. Renew. Sustain. Energy Rev. 2017, 75, 402–414. [Google Scholar] [CrossRef]
  19. Chaiwongsa, P.; Wongwises, S. Effect of throat diameters of the ejector on the performance of the refrigeration cycle using a two-phase ejector as an expansion device. Int. J. Refrig. 2007, 30, 601–608. [Google Scholar] [CrossRef]
  20. Pottker, G.; Guo, B.; Hrnjak, P.S. Experimental investigation of an R410A vapor compression system working with an ejector. In Proceedings of the International Refrigeration and Air Conditioning Conference, West Lafayette, IN, UAS, 12–15 July 2010. [Google Scholar]
  21. Dai, Z.; Chen, X.; Chen, Q.; Zhang, X.; Zhang, H. Energy and exergy analysis of a novel two-stage ejector refrigeration cycle using binary zeotropic mixtures. Int. J. Refrig. 2024, 168, 178–189. [Google Scholar] [CrossRef]
  22. Lawrence, N.D. Analytical and Experimental Investigation of Two-Phase Ejector Cycles Using Low-Pressure Refrigerants. Master’s Thesis, University of Illinois, Urbana, IL, USA, 2012. [Google Scholar]
  23. Alelyani, S.; Fette, N.; Stechel, E.; Doron, P. Analysis of heat-driven combined cooling and desalination. In Proceedings of the ASME 2016 Inter-national Mechanical Engineering Congress and Exposition, Phoenix, AZ, USA, 11–17 November 2016. [Google Scholar]
  24. Delgado-Gonzaga, J.; Rivera, W.; Jiménez-García, J.C.; Pacheco-Reyes, A.; Juárez-Romero, D. Modeling of a Novel Cascade Cycle for the Simultaneous Production of Desalinated Water and Cooling Using Various Refrigerants. Processes 2025, 13, 166. [Google Scholar] [CrossRef]
  25. Anand, B.; Shankar, R.; Srinivas, T.; Murugavelh, S. Performance analysis of combined two stage desalination and cooling plant with different solar collectors. Desalination Water Treat. 2019, 156, 136–147. [Google Scholar] [CrossRef]
  26. Zhou, S.; Zhang, K.; Li, M.; Yang, W.; Shen, S. Thermodynamic and exergoeconomic analysis of a combined cooling, desalination, and power system for low-grade waste heat utilization. Therm. Sci. Eng. Prog. 2023, 45, 102079. [Google Scholar] [CrossRef]
  27. Shumiye, W.B.; Ancha, V.R.; Tadese, A.K.; Zeru, B.A. Exergy analysis of solar-geothermal based power plant integrated with boiling, and reverse osmosis water purification. Energy Convers. Manag. X 2022, 15, 100255. [Google Scholar] [CrossRef]
  28. Manesh, M.H.K.; Kabiri, S.; Yazdi, M.; Petrakopoulou, F. Exergoeconomic modeling and evaluation of a combined-cycle plant with MSF and MED desalination. J. Water Reuse Desalination 2020, 10, 158–172. [Google Scholar] [CrossRef]
  29. Moghimi, M.; Emadi, M.; Akbarpoor, A.M.; Mollaei, M. Energy and exergy investigation of a combined cooling, heating, power, generation, and seawater desalination system. Appl. Therm. Eng. 2018, 140, 814–827. [Google Scholar] [CrossRef]
  30. Brahim, T.; Jemni, A. Comparative study of parabolic trough solar collector using sysltherm-800 and therminol-VP1 non-metallic nanofluids. Therm. Sci. Eng. Prog. 2023, 43, 101951. [Google Scholar] [CrossRef]
  31. REFPROP. NIST Reference Thermodynamic and Transport Properties, Version 9.1; Natl Std. Ref. Data Series (NIST NSRDS); National Institute of Standards and Technology: Gaithersburg, MD, USA, 2013. [Google Scholar]
  32. Klein, S.A. Engineering Equation Solver (EES) for Microsoft Windows Operating Systems: Academic Professional Version. F-chart Software, Medison, WI, USA. 2012. Available online: http://www.fchart.com (accessed on 5 February 2025).
  33. Abou Houran, M.; Nutakki, T.U.K.; Albani, A.; Ifseisi, A.A.; Riaz, F.; Peng, F. Energy and exergy analysis of a novel solar-based system merged with power cycle. Appl. Therm. Eng. 2024, 240, 122080. [Google Scholar] [CrossRef]
  34. Kumar, V.; Saini, S.; Sharma, M.; Nigam, K.D.P. Pressure drop and heat transfer study in tube-in-tube helical heat exchanger. Chem. Eng. Sci. 2006, 61, 4403–4416. [Google Scholar] [CrossRef]
  35. Al-Mughanam, T.; Khaliq, A. Development and assessment of the performance of a novel parabolic trough solar collector-driven three-stage cooling cycle. J. Therm. Sci. Eng. Appl. 2024, 16, 111011. [Google Scholar] [CrossRef]
  36. Lawrence, N.; Elbel, S. Theoretical and practical comparison of two-phase ejector refrigeration cycles including first and second law analysis. Int. J. Refrig. 2013, 36, 1220–1232. [Google Scholar] [CrossRef]
  37. Al-Ghamdi, A.; Mustafa, I. Exergy analysis of seawater reverse osmosis plant in Jeddah, Saudi Arabia. Desalination Water Treat. 2022, 264, 1–11. [Google Scholar] [CrossRef]
Figure 1. Schematic layout of the proposed solar-powered cooling-desalination system.
Processes 13 01589 g001
Figure 2. Representative workflow diagram.
Processes 13 01589 g002
Figure 3. Effect of coil curvature ratio on the outlet temperature for the 3 ribs at different DNI.
Processes 13 01589 g003
Figure 4. Temperature contours for 1st Rib, at DNI, 450 W/m2, with different curvature ratios (a) 0.095 (b) 0.08 (c) 0.0625.
Processes 13 01589 g004
Figure 5. Effect of Rib height on the outlet temperature for different DNI (a) 450 W/m2 (b) 700 W/m2 (c) 1000 W/m2.
Processes 13 01589 g005
Figure 6. Temperature contours for coil curvature ratio 0.095 (a) 1st Rib (b) 2nd Rib (c) 3rd Rib.
Processes 13 01589 g006
Figure 7. Percentage increase in the outlet temperature with changing DNI for the three ribs.
Processes 13 01589 g007
Figure 8. Pressure drops against coil curvature ratio for all studied cases.
Processes 13 01589 g008
Figure 9. Effect of varying the DNI on system outputs.
Processes 13 01589 g009
Figure 10. Effect of varying the DNI on system exergetic outputs.
Processes 13 01589 g010
Figure 11. Effect of varying the DNI on energy and exergy efficiencies of the system.
Processes 13 01589 g011
Figure 12. Effect of varying the OFC turbine entry pressure on cooling-desalination system efficiencies.
Processes 13 01589 g012
Figure 13. Effect of varying the dead state temperature on energy and exergy efficiencies of cooling-desalination cogeneration system.
Processes 13 01589 g013
Figure 14. Breaking down the solar exergy supplied to the system into the exergy produced, exergy destroyed, and exergy loss.
Processes 13 01589 g014
Table 1. Some properties of solar heat transfer fluid (Syltherm 800) [30].
Parameter:Syltherm 800
Temperature considered (°C):400
At 100 °C, viscosity (kinematic):2.99
Density of oil at 260 °C (g/mL):0.71396
Thermal conductivity at 260 °C (W/K.m):0.0899
Specific heat (average) (kJ/K.kg):1.8815
Table 2. Geometric and physical properties of the coils under consideration.
Parameter:Details:
Oil type:Syltherm 800
Incident radiation (W/m2):450, 700, 1000
Inner tube diameter, dt (mm):38, 32, 25
Pitch (mm):40
Tube length, L (m):7.539
Coil Diameter, Dc (mm):400
Curvature ratio, dt/Dc:0.095, 0.08, 0.0625
Ribs height (mm)2, 4, 6
Ribs width (mm)1
Table 3. CFD model details.
CategoryParameterValue/Description
Solver settingsSolver typeSteady-state
Pressure–velocity couplingSIMPLE
Convergence criteria10−5, 10−5, and 10−6 for continuity, momentum, and energy
Spatial discretizationPressure, momentum, turbulent kinetic energy (k), turbulent dissipation rate (ε), and energySecond-order scheme
Turbulence modelingModelRealizable k-ε
Wall treatmentStandard wall treatment
Under-relaxation factorsPressure0.3
Momentum0.7
Turbulence (k, ε)0.8
Energy0.95
Boundary conditionsInlet Temperature (92 °C)Mass flow rate (1.1267 kg/s), Turbulence intensity = 5%
OutletPressure outlet (0 Pa gauge)
WallNo-slip conditions
Mesh Quality
dt = 38 mmdt = 32 mmdt = 25 mm
Rib geometryMesh elementsSkewnessMesh elementsRib geometryMesh elementsSkewness
height = 2 mm3,130,0000.843,597,5950.881,915,6680.83
height = 4 mm2,878,8480.823,927,4750.761,968,2320.76
height = 6 mm3,123,1350.824,279,3280.774,500,4160.74
Table 4. Energy balance equations for the proposed model.
ComponentBalance Equations
Super heater (SH) m ˙ 18 h 18 h 19 = m ˙ 22 h 22 h 32
Evaporator (EVA) m ˙ 19 h 19 h 20 = m ˙ 32 h 32 h 31
Economizer (ECO) m ˙ 20 h 20 h 16 = m ˙ 29 h 30 h 29
Solar pump 1 W ˙ P 1 = m ˙ 16 ( h 17 h 16 )
OFC turbine W ˙ T = m ˙ 22 h 22 + m ˙ 35 h 35 + m ˙ 37 h 37 m ˙ 23 h 23
HPF m ˙ 33 a h 33 a = m ˙ 35 h 35 + m ˙ 34 h 34
LPF m ˙ 34 a h 34 a = m ˙ 36 h 36 + m ˙ 37 h 37
Expansion valve 1 h 33 = h 33 a
Expansion valve 2 h 34 = h 34 a
Regenerator m ˙ 23 h 23 h 24 = m ˙ 26 h 27 h 26
Condenser 1 Q ˙ C o n d 1 = m ˙ 24   h 24 h 25
Pump 2   W ˙ P 2 = m ˙ 25 ( h 26 h 25 )
Pump 3   W ˙ P 3 = m ˙ 28 ( h 29 h 28 )
Compressor W ˙ C = m ˙ 1 h 1 h 11
Condenser 2 Q ˙ C o n d 2 = m ˙ 1   h 1 h 2
Heat exchanger (HX) Q ˙ H X = m ˙ 2 h 2 h 3 = m ˙ 11 h 11 h 10
Expansion valve 3 h 3 = h 4
Air conditioner (AC) Q ˙ A C = m ˙ 5   h 5 h 4
Ejector (Eje) m ˙ 5 h 5 + m ˙ 9 h 9 = m ˙ 6 ˙ h 6
Separator (Sep) m ˙ 7 h 7 + m ˙ 10 h 10 = m ˙ 6 ˙ h 6
Expansion valve 4 h 7 = h 8
Refrigerator (ref) Q ˙ r e f = m ˙ 9   h 9 h 8
Seawater pump (SWP) m s w h 21 + W S W P = m s w h 40
RO module m ˙ 40 h 40 = m ˙ 41   h 41 + m ˙ 42   h 42
Table 5. Exergy destruction expression for the proposed model.
ComponentBalance Equations
Super heater (SH) E ˙ x , D ,   S H = m ˙ 18 ( e x , 18 e x , 19 ) + m ˙ 22 ( e x , 32 e x , 22 )
Evaporator (EVA) E ˙ x , D ,   E V A = m ˙ 19 ( e x , 19 e x , 20 ) + m ˙ 32 ( e x , 31 e x , 32 )
Economizer (ECO) E ˙ x , D ,   E C O = m ˙ 20 ( e x , 20 e x , 16 ) + m ˙ 29 ( e x , 29 e x , 30 )
Solar pump (P1) E ˙ x , D ,   P 1 = m ˙ 16 e x , 16 e x , 17 + W ˙ P 1
OFC turbine E ˙ x , D ,   T = m ˙ 22 e x , 22 + m ˙ 35 e x , 35 + m ˙ 37 e x , 37 m ˙ 23 e x , 23 W ˙ T
HPF E ˙ x , D ,   H P F = m ˙ 33 a e x , 33 a m ˙ 35 e x , 35 m ˙ 34 e x , 34
LPF E ˙ x , D ,   L P F = m ˙ 34 a e x , 34 a m ˙ 36 e x , 36 m ˙ 37 e x , 37
Expansion valve 1 E ˙ x , D , E V 1 = m ˙ 33 e x , 33 e x , 33 a
Expansion valve 2 E ˙ x , D , E V 2 = m ˙ 34 e x , 34 e x , 34 a
Regenerator E ˙ x , D , R e g = m ˙ 23 e x , 23 e x , 24 + m ˙ 26 e x , 26 e x , 27
Condenser 1 E ˙ x , D , C o n d 1 = m ˙ 24 ( e x , 24 e x , 25 ) Q ˙ C o n d 1 T 0 T C o n d
Pump (P2) E ˙ x , D ,   P 2 = m ˙ 25 e x , 25 e x , 26 + W ˙ P 2
Pump (P3) E ˙ x , D ,   P 3 = m ˙ 28 e x , 28 e x , 29 + W ˙ P 3
Compressor E ˙ x , D , C = m ˙ 1 e x , 20 e x , 10 + W ˙ C 2
Condenser 2 E ˙ x , D , C o n d 2 = m ˙ 1 ( e x , 1 e x , 2 ) Q ˙ C o n d 1 T 0 T C o n d
Heat exchanger (HX) E ˙ x , D , H X = m ˙ 2 e x , 2 e x , 3 + m ˙ 10 e x , 10 e x , 11  
Expansion valve 3 E ˙ x , D , E V 3 = m ˙ 3 e x , 3 e x , 4
Air conditioner (AC) E ˙ x , D , A C = m ˙ 4 e x , 4 e x , 5 Q ˙ A C T 0 T A C 1
Ejector (Eje) E ˙ x , D , E j e = m ˙ 5 e x , 5 + m ˙ 9 e x , 9 m ˙ 6 e x , 6
Separator (Sep) E ˙ x , D , S e p = m ˙ 6 e x , 6 m ˙ 7 e x , 7 m ˙ 10 e x , 10
Expansion valve 4 E ˙ x , D , E V 4 = m ˙ 7 e x , 7 e x , 8
Refrigerator (ref) E ˙ x , D , r e f = m ˙ 8 e x , 8 e x , 9 Q ˙ r e f T 0 T r e f 1
Seawater pump (SWP) E x D S W P = E 21 + W S W P E 40
RO module E ˙ x , D ,   R O = m ˙ 40 e x , 40 m ˙ 41 e x , 41 m ˙ 42 e x , 42
Table 6. Input data for modelling of the proposed cooling-desalination system.
Solar Heat Transfer FluidSyltherm 800 (Oil)
Working fluid of OFC cycleR124
Working fluid of the two-phase ejector cooling cycleR600a
Ambient temperature (°C)25
Ambient pressure (kPa)101.32
Diameter of coil (mm)400
Rib height (mm)2–6
Heliostat field area (m2)3000
Effectiveness of the heat exchanger0.8
Entry temperature of solar fluid (°C)92
Range of DNI considered (W/m2)400–1000
Concentration ratio of collector250
Aperture area (m2)12
Sun temperature (K)5770
Nozzle efficiency (%)85–95
Refrigeration   evaporator   temperature ( ) (−15)–(−25)
Condenser   temperature   ( ) 30–40
Mixing chamber efficiency (%)90
Diffuser efficiency (%)85
AC   evaporator   temperature   15–25
Pumps, turbines, and compressor efficiency (%)85
Seawater   temperature   ( ) 35
Seawater flows to the plant (kg/s)90.83
Rate of fresh water produced by RO sub-system (kg/hr)5400
Specific enthalpy of freshwater (kJ/kg)153.2
Table 7. Comparison of the computed results with the reported literature results [18,36,37].
Study/ValueLiterature/Value
OFC turbine output kWPresentVarma and Srinivas [18]
12921248
Exergy efficiency of OFCPresentVarma and Srinivas [18]
26.84%26.21%
Cooling outputs of two-phase ejector (refrigeration output kW)PresentLawrence and Elbel [36]
15651558
Cooling outputs of two-phase ejector (air conditioning output kW)PresentLawrence and Elbel [36]
515504
Exergy efficiency of OR unitPresentAl-Ghamdi and Mustafa [37]
29.2%29.4%
Disclaimer/Publisher’s Note: The statements, opinions and data contained in all publications are solely those of the individual author(s) and contributor(s) and not of MDPI and/or the editor(s). MDPI and/or the editor(s) disclaim responsibility for any injury to people or property resulting from any ideas, methods, instructions or products referred to in the content.

