Abstract
The accurate estimation of the entry length required for a flow in a tube to transition from a uniform velocity profile to a fully developed state is crucial in many industrial processes. Although viscoelastic fluids are widely utilized in industrial processes, most studies have concentrated on inelastic fluids. This study employed computational fluid dynamics (CFD) to analyze the developing flow of viscoelastic fluids in a circular tube. An axisymmetric computational domain was employed along with the Giesekus model to represent the viscoelastic fluid flow. The Log Conformation Technique (LCT) was adopted to ensure numerical stability and accuracy at high Weissenberg numbers. The CFD model was first validated against published data for planar contraction flow. After validation and mesh sensitivity analysis for tube geometry, we systematically studied the influence of the Reynolds and Weissenberg numbers, solvent viscosity ratio, and mobility parameter on the entry length. Our results highlight the significant influence of fluid elasticity on flow development. For a constant Wi value, reducing inertia enhances the elastic effects, whereas at a fixed Re number, increasing Wi strongly impacts the developing flow region. Increased elasticity extends the entry length for both velocity and stress fields, with stress typically requiring a longer region to develop fully.
1. Introduction
The accurate prediction of the flow behavior of viscoelastic fluids at both the entrance and in fully developed regions of tubes and channels is crucial for a wide range of industrial applications. These include automotive manufacturing, pulp and paper processing, food and polymer processing, 3D printing, and the design of biomedical devices. A key parameter in designing such systems is the entry length, which is the distance required for fluid particles with a uniform velocity profile at the inlet to transition into a fully developed flow. In long tubes or channels, the effect of the entry region may be negligible. However, in many practical configurations, the entry length is comparable to the overall channel/tube length, making an accurate estimation of this length critically important [1,2]. For instance, in microfluidic applications involving viscoelastic fluids, device performance is often predicated based on flow-field predictions in the fully developed region. An unexpectedly long entrance region may compromise the microfluidic device’s efficiency [3]. Moreover, using a short nozzle to inject complex fluids can result in undesirable flow characteristics at the outlet [4]. Furthermore, the time required to reach a steady flow field is a concern for many applications such as the precision dispensing process [5,6].
While the literature on entry flow is extensive for Newtonian fluids, including analytical, numerical, and experimental investigations [7,8], the developing region in non-Newtonian flows has received less attention. Poole and Ridley [9] examined developing flows in pipes for inelastic, non-Newtonian fluids described by the power-law model and established correlations for various power-law indices (0.4 to 1.5) and Reynolds numbers (0 to 1000). Similarly, Lambride et al. [10] used the finite element method to investigate the entry length for power-law fluids in tubes and channels, demonstrating that velocity-based criteria for fully developed flow may not coincide with stress-based criteria. Their results highlighted that increasing the degree of shear thinning behavior or decreasing the Reynolds number (Re) enlarges the discrepancy between velocity- and stress-based estimates of the entry length. Rehman and Chebbi [11] used an analytical approach to predict the developing flow of both Newtonian and non-Newtonian fluids in the entrance region between parallel plates. Ookawara et al. [12] studied the developing flow of Newtonian, power-law, and Bingham fluids and similarly noted that a steady velocity field does not ensure a fully developed stress field. More recently, Fernandes et al. [13] focused on power-law fluids for 1 ≤ n ≤ 3 and 0 ≤ Re ≤ 100, showing that the entry length increases with higher Re values and with lower power-law indices. Complementary to these, several studies have explored developing flows of viscoplastic fluids [14,15,16,17].
By contrast, investigations into entry flows of viscoelastic fluids remain relatively limited. Most non-Newtonian fluids exhibit some degree of elasticity and ignoring elastic effects while only accounting for their shear-dependent viscosity can lead to inaccurate predictions [18]. In viscoelastic flows, the hydrodynamic entry length is influenced not only by the Reynolds number but also by fluid elasticity, often represented through dimensionless numbers such as the Deborah (De) or Weissenberg (Wi) number [19,20,21]. Liang [22] provided one of the earlier experimental investigations of viscoelastic entry flow in channels, relating entry length to pressure loss. Alves et al. [23] used the Phan-Thien Tanner (PTT) model for viscoelastic flows through a contraction geometry and identified the end of the entry region based on the axial normal stress dropping below a small fraction (1–5%) of its maximum value; they then expressed the entry length as a function of the De number. Na and Yoo [19] also examined the impact of the Re value and fluid elasticity by monitoring the velocity at the channel centerline, proposing that pressure distribution along the channel could serve as an alternative indicator of the entry length. Typically, fully developed flow is considered reached once the velocity gradient along the flow direction becomes zero so that the velocity profile no longer changes with further axial distance.
Focusing on low Weissenberg numbers, Yapici et al. [24] observed, using the PTT model, that the length required for elastic stresses to fully develop can exceed the velocity-based entry length. Teixeira [25] employed μ-PIV to study the transient evolution of the velocity field in a microchannel conveying viscoelastic fluid. Bertoco et al. [26] employed generalized PTT model to study a two-dimensional flow between parallel plates and demonstrated that elasticity significantly affects not only the entry length but also velocity and stress distributions, even at low Reynolds numbers. More recently, Pouraria et al. [27] used a three-dimensional model based on the Giesekus model in OpenFOAM to analyze the developing flow of a viscoelastic fluid in a tube. The obtained results confirmed a strong influence of elasticity on the velocity profile and entry-length estimates. Despite such progress, numerical instabilities still pose a major challenge at high Wi numbers, causing many researchers to either limit Wi or modify the inlet velocity profile to mitigate excessive elastic stresses. However, any alteration of the inlet profile away from a uniform distribution can affect predictions of both velocity and stress development lengths.
In this paper, we present a computational study of the developing flow of viscoelastic fluids in the entry-region of a circular tube. The employed model solves the conservation equations of mass and momentum alongside the Giesekus constitutive equation to capture elastic stress dynamics. To circumvent numerical instabilities commonly encountered at high Weissenberg numbers, we employ the Log Conformation Technique (LCT). The numerical model was initially validated against published data on viscoelastic fluid flow at the entrance of a channel in a contraction geometry. After the validation of the model, we performed mesh sensitivity analysis for an axisymmetric tube geometry to ensure the mesh independence of the results. The main objective of this study was to investigate the effects of varying the Reynolds number, Weissenberg number, solvent viscosity ratio, and shear-thinning effect on the flow behavior in the entry-region of a tube. The influence of each parameter was studied while keeping the others fixed. Through this systematic approach, we investigated how these parameters affect the entry length required to reach a fully developed velocity and stress field.
2. Numerical Methods
2.1. Governing Equations and Boundary Conditions
Numerical simulations were conducted to investigate the behavior of viscoelastic fluids within a circular tube. Governing equations of the flow field were fully resolved to predict the velocity, pressure, and stress distributions. The governing equations of isothermal incompressible fluid flow in the laminar regime are as follows [28,29,30]:
Equations (1) and (2) are continuity and momentum equations where u represents the velocity, p is pressure, and indicates the stress tensor [28]. In the case of viscoelastic fluid, the stress tensor is the composed of the solvent stress () and the polymer stress () as indicated in Equation (3) [28]. To model the polymer stress, the Giesekus model shown in Equation (4) was employed, where λ and represented the polymer relaxation time and polymer viscosity and was a material parameter, namely mobility parameter [28,29,30]. The evolution of elastic stress followed the upper convected derivative , which is shown in Equation (5).
In practical applications, mobility parameter () may range from 0 to 1, and it is determined by fitting experimental data (e.g., shear viscosities and normal stress differences). As α approaches zero, the Giesekus model is reduced to the Oldroyd-B model [28,30]. By adjusting α, both shear thinning behavior and the first and second normal stress differences can be captured [28,30].
To achieve numerical stability and accuracy at high Weissenberg (Wi) numbers, the Log Conformation Technique (LCT) was employed [29,31]. This method reformulates the constitutive equation in terms of the matrix logarithm of the conformation tensor, thereby mitigating the numerical instabilities often encountered when dealing with large elastic stresses.
CFD simulations were performed across a range of total fluid viscosities (0.005 Pa⋅s to 0.5 Pa⋅s) and solvent viscosity ratios. The Reynolds number and Weissenberg number were calculated as follows:
Here, indicates the total shear viscosity, V is the average velocity, and D is the diameter of tube. Furthermore, λ denotes the polymer relaxation time. The influence of Reynolds number was investigated by varying the total viscosity while keeping other parameters fixed. Similarly, the influence of Wi number was investigated by varying the relaxation time while keeping other parameters constant. To isolate the influence of shear thinning behavior of the fluid while investigating the influence of Re and Wi numbers, we investigated a Boger fluid. The influence of solvent viscosity ratio was investigated for both a constant total viscosity as well as Re and Wi numbers. Finally, to explore the influence of shear thinning behavior, mobility parameter (α) was varied at fixed total viscosity, solvent viscosity ratio, and relaxation time. The density of fluid was set to 1000 Kg/m3. When studying the Reynolds number, the viscosity of fluid varied from 0.005 Pa⋅s to 0.1 Pa⋅s. Fluid relaxation time was set to 0.01 s for all simulations, except when studying the Wi number.
While the objective of the present paper is to investigate the developing flow of viscoelastic fluids within a tube, numerical model was first validated against published data [32]. CFD model was employed to predict the flow of viscoelastic fluids in the entrance region of a channel within a contraction geometry shown in Figure 1. Figure 1a shows a schematic of geometry where contraction ratio (CR H1/H2) is 4 and the height of small channel (H2) is 0.01 m. Relatively long distance of inlet and outlet from the contraction region and entrance of narrow channel prevents their influence on flow in this region [32]. Figure 1b shows the employed grid in the contraction region. Due to the symmetry of the geometry, half of physical domain was modeled in CFD simulation. Velocity inlet boundary condition was employed for the inlet (Z = −20H2) and pressure outlet was imposed at the outlet (Z = 20H2). A symmetry plane was considered at x , and no-slip boundary condition was imposed at the walls.
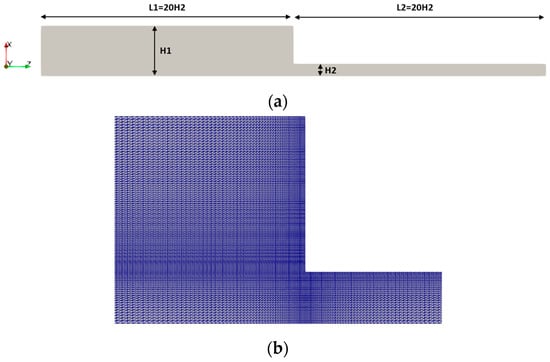
Figure 1.
A schematic of the computational domain for contraction geometry (a) and the adopted mesh in contraction region (b).
Rest of simulations were conducted for an axisymmetric computational domain shown in Figure 2 that represents a tube with a diameter of 5 mm and a length of 200 mm. A mesh sensitivity study was performed to ensure independency of the obtained results with respect to mesh number. According to the obtained results, a computational domain discretized into 50,000 uniform cells could adequately predict the flow field. A uniform inlet velocity profile was imposed at the inlet while the fluid viscosity was adjusted for each test case. Except for the specific cases examining Wi, the relaxation time was held constant at 0.01 s. A pressure outlet boundary condition with zero-gauge pressure was prescribed at the outlet. A no-slip boundary condition was enforced at the tube wall. The FLOW-3D 2023R2 software package was employed for all CFD simulations [33].

Figure 2.
The employed axisymmetric grid in the present study.
2.2. Validation of the CFD Model
CFD simulations were initially conducted for a contraction channel. The geometry and boundary condition for contraction channel have been detailed in the previous section. CFD simulation was performed for viscoelastic fluid with solvent viscosity ratio of zero and the absence of shear thinning behavior. The average inlet and outlet velocities were 0.005 m/s and 0.02 m/s, respectively. Furthermore, the fluid relaxation time, viscosity, and density were set to 1.5 s, 20 Pa⋅s, and 1000 Kg/m3, respectively. Correspondingly, the Re number and De number were 0.01 and 3, respectively. Under these conditions, the Giesekus model effectively represented the upper convected Maxwell (UCM) model.
Figure 3 illustrates contours of velocity within the contraction region obtained from the current CFD model. For Newtonian fluids flowing through a 2D channel, the maximum velocity gradually reached 1.5 times the average velocity at the channel center. However, in viscoelastic fluids, the axial velocity at the center could initially surpass this theoretical maximum before settling. As observed in Figure 3, the axial velocity at the center of channel initially exceeded the theoretical maximum velocity of 0.03 m/s. Furthermore, the flow streamline indicated the formation of both a salient vortex at the corner as well as a lip vortex that are characteristics of viscoelastic fluid flows in contraction geometry [32]. According to the present numerical results for Wi = 3, these vortices remained separated, which agreed with the previous study [32]. To validate the accuracy of present CFD model, we compare the predicted velocity at the center of channel with the published numerical data from the previous studies [32]. Figure 4 illustrates the distribution of axial velocity along the symmetry plane. The horizontal axis shows the distance from the contraction region (−3 < <3) and the vertical axis shows the ratio of axial velocity to the average velocity in the small channel. As observed, there was good agreement between the predicted velocity field by the employed model in the present study and the published data [32].
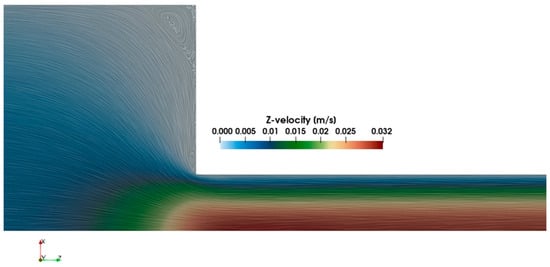
Figure 3.
Axial velocity contours along with flow streamlines as predicted by CFD model (Re = 0.01, Wi = 3).
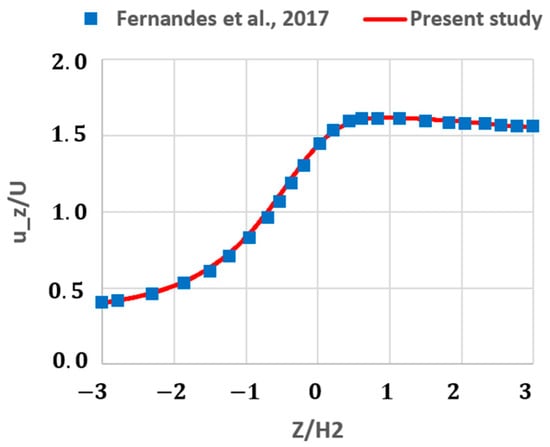
Figure 4.
A comparison of predicted axial velocity using current CFD model and published data at the centerline of channel (Re = 0.01, Wi = 3) [32].
Figure 5 presents the contours depicting the ratio of the first normal stress difference (N1) to the wall shear stress. Although a discernible N1-to- ratio existed at the channel center, the normal stress at the wall significantly dominated. To assess the accuracy of model in predicting the stress field, we also compare the predicted N1/ in this study with those reported by Fernandes et al., 2017 [32]. Figure 6 indicates a good agreement between the results obtained by the present model and the published data.
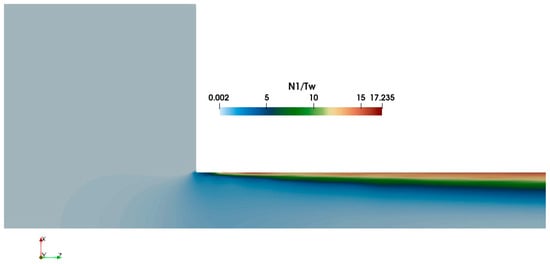
Figure 5.
Predicted first normal stress difference divided by shear stress at the wall of small channel as obtained by current CFD model (Re = 0.01, Wi = 3).
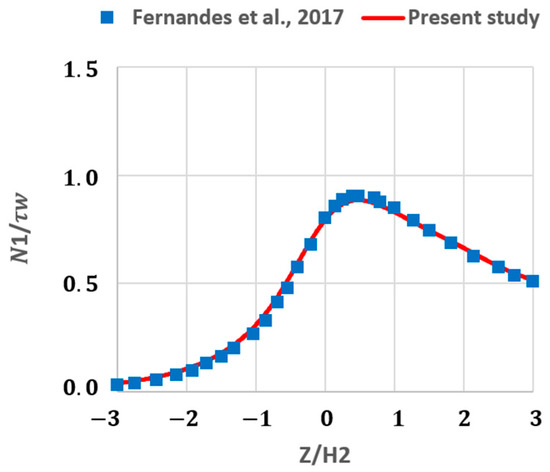
Figure 6.
A comparison of the predicted ratio of first normal stress difference to shear stress at the wall using current CFD model and published data at the centerline of channel (Re = 0.01, Wi = 3) [32].
2.3. Mesh Sensitivity Analysis for Axisymmetric Tube Geometry
Prior to analyzing the influence of various parameters on the flow dynamics in the entry region of a tube, a mesh sensitivity analysis was conducted to ensure the grid independency of the numerical results. CFD simulations were performed to predict the flow behavior within the entry region of a tube with a diameter of 5 mm. The inlet velocity, fluid density, total viscosity, and solvent viscosity ratio were set to 0.1 m/s, 1000 Kg/m3, 0.05 Pa⋅s, and 0.5, respectively. Furthermore, the relaxation time was specified as 0.01 s. Hence, the corresponding Re number and Wi number were 10 and 0.8, respectively. Convergence criteria for pressure and stress tensor were set to be 10−5 and 10−6, respectively.
Figure 7 demonstrates the influence of adopted cell numbers on the prediction of axial velocity along the axis of the tube in the entry region. As observed, increasing the number of cells from 23,100 to 32,000 and subsequently to 50,000 resulted in a slight increase in the predicted maximum velocity. However, further refinement to 72,000 cells showed negligible change in the results. Figure 8 illustrates the impact of mesh refinement on the prediction of elastic stress along the tube axis. Similar to velocity predictions, increasing the cell number beyond 50,000 to 72,000 did not affect the stress predictions. Therefore, a computational mesh consisting of 50,000 cells was selected for all subsequent analyses in this study.
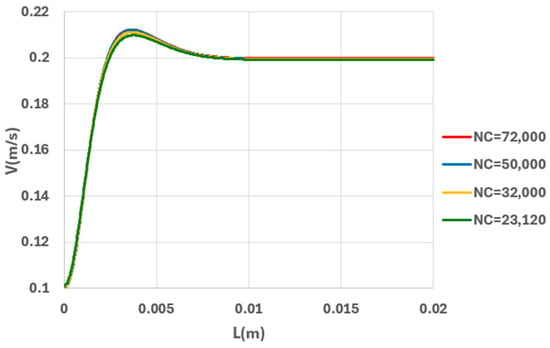
Figure 7.
The influence of number of cells (NC) on prediction of axial velocity along the centerline of tube (, Re = 10, Wi = 0.8).
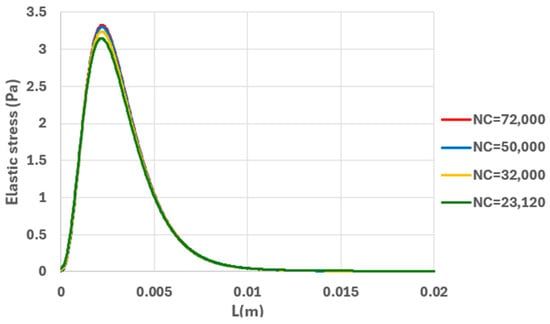
Figure 8.
The influence of number of cells (NC) on prediction of elastic stress ( along the centerline of tube (, Re = 10, Wi = 0.8).
3. Results and Discussion
Following the validation of the numerical model and performing a mesh sensitivity analysis, numerical modeling was carried out to analyze the developing flow in the entry region of a tube with a diameter of 5 mm. CFD simulations were conducted to investigate the effects of the Re number, Wi number, solvent viscosity ratio (, and mobility factor (, which governs the shear thinning behavior of a fluid. When studying the influence of the Re number, Wi number, and solvent viscosity ratio (, the mobility parameter was set to 1 × 10⁻⁶. By employing a mobility factor of 1 × 10⁻⁶, we effectively suppress the shear thinning behavior of a fluid. Simulations were conducted for a constant inlet velocity of 0.1 m/s. The relaxation time was kept constant () in all simulations, except when studying the influence of the Wi number. Section 3.1 discusses the effects of varying the Re number at a constant Wi and , with shear thinning effects suppressed. Section 3.2 addresses the influence of varying the Wi number while the Re number and solvent viscosity ratio are constant. The influence of the solvent viscosity ratio at fixed Re and Wi values is presented in Section 3.3. Finally, Section 3.4 evaluates the impact of the mobility factor that governs the fluid’s shear thinning behavior, with Re, Wi, and the solvent viscosity ratio held constant.
3.1. Influence of Reynolds Number
For a constant inlet velocity of 0.1 m/s, we changed the total viscosity of a fluid to examine a range of Re numbers while the Wi number and solvent viscosity ratio remained unchanged. Figure 9 illustrates the velocity distributions along the axis of a tube for different Re numbers, all at a constant Wi = 0.8. In all these simulations, the solvent viscosity ratio was set to 0.5. As observed in this figure, as the Re number increases, the length of the developing flowoften termed as entry length—also increases. According to Figure 9, at lower Re values, the centerline velocity initially overshoots relative to its fully developed value before gradually decreasing to a steady state. In contrast, at higher Re numbers, the velocity profile smoothly transitions to the fully developed regime with little or no overshoot.
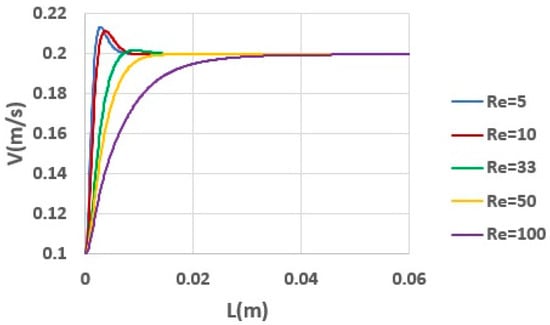
Figure 9.
Development of axial velocity along the centerline of tube for different Reynolds numbers (, Wi = 0.8).
Although the Wi number remains fixed at 0.8, the total and polymer viscosities differ significantly across simulations. At low Re values, the fluid exhibits a higher polymer viscosity component, generating substantial axial elastic stresses and leading to the velocity overshoot at the tube centerline. This behavior is relevant for processes such as dispensing, or the extrusion of high-viscosity materials, where even moderate shear rates can yield large elastic responses. However, as the Re value increases and inertial forces dominate, the axial velocity rises more gradually to its steady value without forming a discernible overshoot.
To quantify the entry length for different Re values, Figure 10 provides a close-up of the axial velocity profiles near their fully developed levels. Note that for a constant Wi, increasing the Re value elevates the ratio of inertial forces to elastic and viscous forces, shifting the flow dynamics from elasticity-dominated to inertia-dominated. This shift is evident in the diminishing velocity overshoot observed with increasing the Re value.
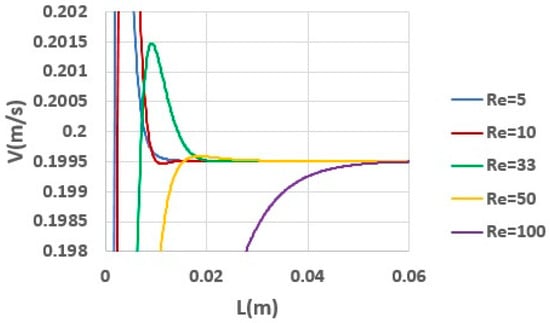
Figure 10.
Close-up view of axial velocity for different Re numbers (, Wi = 0.8).
Figure 11 compares the axial velocity contours within the entrance region for Re = 5 and Re = 100. At Re = 5, a pronounced velocity overshoot occurs near the centerline, whereas at Re = 100, the velocity adjusts more smoothly, closely resembling classical Newtonian entrance flow behavior. This highlights the interplay between inertia and elasticity in controlling entrance-flow characteristics.
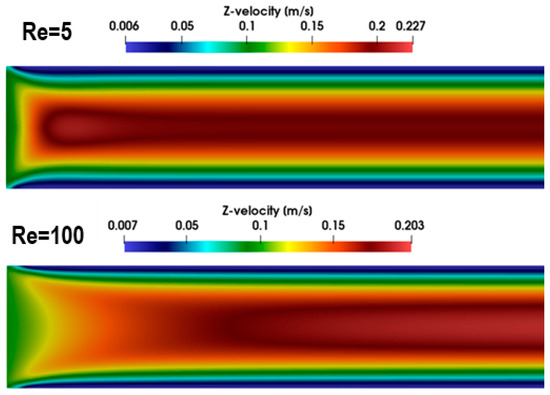
Figure 11.
Contours of velocity distribution at the entrance of tube for Re = 5 (top) and Re = 100 (bottom) (, Wi = 0.8).
Figure 12 presents the distribution of axial elastic stress ( along the centerline for the same set of Re values. At a fixed Wi = 0.8, a higher Re value results in a lower peak elastic stress, although the distance required for stress to reach its steady value generally increases. Figure 13 shows the corresponding contours of elastic stress in the entrance region for Re = 5 and Re = 100. When Re = 5, a substantially higher elastic stress develops compared to when Re = 100, which is on the order of ten times greater at the tube wall. While the average velocity and relaxation time remain the same, the higher total and polymer viscosities at Re = 5 amplify elastic effects, leading to a notable stress overshoot at the centerline. In contrast, for Re = 100, the elastic stress distribution exhibits a smoother progression without a pronounced overshoot.
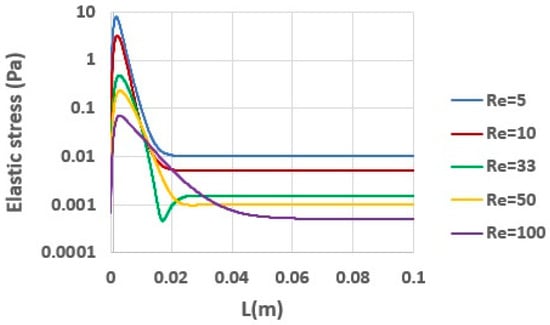
Figure 12.
Development of axial elastic stress () along the centerline of tube for different Reynolds numbers (, Wi = 0.8).
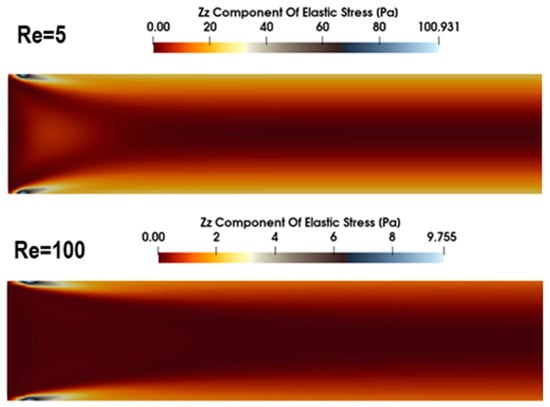
Figure 13.
Contours of elastic stress () at the entrance of tube for Re = 5 (top) and Re = 100 (bottom) (, Wi = 0.8).
These observations underscore that even moderate changes in Re can significantly modify the interplay between elastic and inertial forces, leading to substantial variations in both velocity and stress profiles. In addition to shear, the fluid elements undergo extensional deformation upon entering the tube, which can greatly enhance elastic stresses—particularly under conditions of high polymer viscosity and relatively low Re values.
Figure 14 highlights the critical lengths (measured from the inlet) required for both velocity and elastic stress fields to achieve steady values across the range of Re, tested in this study. At low Re values, the distance for the stress field to stabilize exceeded that of the velocity field. By contrast, at higher Re values, the discrepancy between velocity-based and stress-based entry lengths became smaller. Overall, these results confirmed that the distances required for velocity and stress to reach fully developed states can differ, with stress typically requiring a longer development region. These results agreed well with the previous studies regarding the entry length for velocity and stress fields in viscoelastic fluids [24,27].
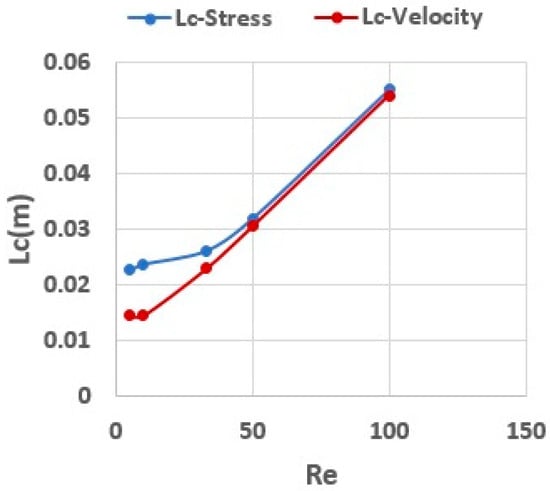
Figure 14.
Critical length to achieve steady velocity and stress distributions (, Wi = 0.8).
It is worth mentioning that the maximum viscosity adopted in these simulations was 0.1 Pa⋅s, corresponding to Re = 5. Considering relatively low viscosities in the present study, we neglected the viscous heating effects. However, for significantly high viscosities, viscous heating may affect the dynamics of developing flow [34,35].
3.2. Influence of the Weissenberg Number
The CFD Figure 15 illustrates the influence of the Weissenberg number (Wi) on the axial velocity profile for a fixed Reynolds number (Re = 10). In all simulations, the total fluid viscosity and solvent viscosity ratio () were maintained at μ = 0.05 Pa⋅s, and , while the inlet velocity was held constant at 0.1 m/s. The Wi number was varied exclusively by adjusting the polymer relaxation time, thereby altering the ratio of elastic to viscous and inertial forces under otherwise identical flow conditions.
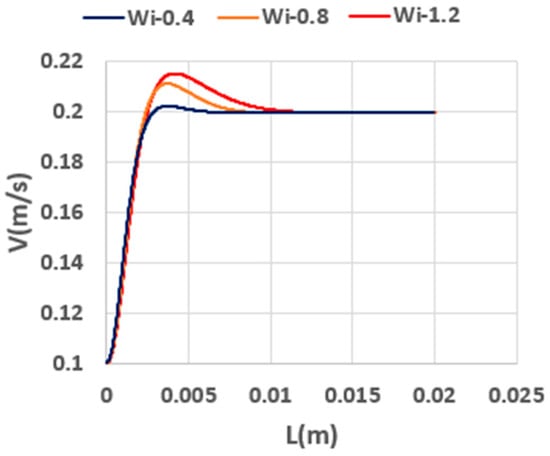
Figure 15.
Development of axial velocity along the centerline of tube for different Wi numbers (, Re = 10).
The results in Figure 15 demonstrate that increasing the Wi value leads to a pronounced entry length over which the velocity profile develops before reaching a steady, fully developed form. Moreover, as Wi increases, an overshoot emerges in the velocity profile, reflecting the heightened elastic stresses near the entrance region, which cannot be rapidly dissipated by viscous forces.
Figure 16 depicts the distribution of the axial elastic stress () along the tube centerline in the entrance region. Notably, even though flows at higher Wi are more elastic overall, their peak centerline stress can be lower than that observed at lower Wi values. In particular, the flow at Wi = 0.4 exhibits the largest maximum stress, located closer to the inlet compared with flows at Wi = 0.8 or Wi = 1.2. This behavior arises from the shorter relaxation time associated with lower Wi values, causing the polymer molecules to respond and stretch more rapidly under high deformation rates near the inlet. Conversely, at higher Wi, the longer relaxation time postpones the point of maximum stretch (and hence maximum stress) to a location further downstream where the deformation rates are lower, ultimately extending the distance required for the stress to reach its fully developed distribution.
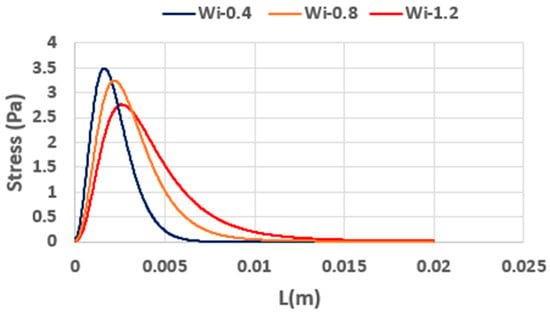
Figure 16.
Development of axial elastic stress () along the centerline of tube for different Wi numbers (, Re = 10).
Despite the higher elastic stress encountered near the inlet at Wi = 0.4, the flow attains its steady-state stress distribution more quickly, consistent with a shorter relaxation time. By contrast, at elevated Wi values, the development of the elastic stress field is delayed, leading to a longer entry length. As illustrated in Figure 17, which shows contours of the axial elastic stress () for Wi = 0.4 and Wi = 1.2, the maximum centerline stress is indeed higher at a lower Wi value whereas the wall stress is larger at a higher Wi value. This outcome underscores the interplay between flow kinematics and viscoelastic effects as polymer relaxation characteristics govern both the magnitude and spatial distribution of elastic stresses. It is worth mentioning that such decay in extensional stress at the entry region of a tube can be used as a rough estimate for measuring the characteristic time scale of complex viscoelastic materials [36,37].
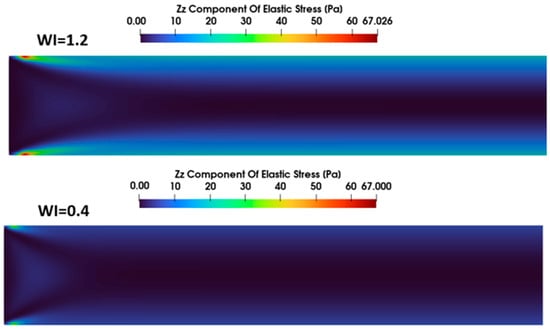
Figure 17.
Contours of elastic stress () at the entrance of tube for Wi = 1.2 (top) and Wi = 0.4 (bottom) (, Re = 10).
Figure 18 quantifies the effect of Wi on the critical length required to achieve steady velocity and stress fields. As Wi increases, the distance needed for both the velocity profile and the stress field to reach their respective steady states also increases. However, the stress field generally requires a greater distance than the velocity field to fully stabilize, indicating that polymer relaxation dynamics dominate the flow evolution over extended regions of the entrance zone. According to this figure, for low Wi numbers, the difference between the entry length of velocity and the stress field is negligible. However, as we increase the Wi number, the entry length for the stress field becomes significantly longer than that of the velocity field. Overall, these findings highlight the pivotal role of elasticity in determining the flow development length and underscore the sensitivity of viscoelastic flows to the relative magnitudes of elastic, viscous, and inertial forces.
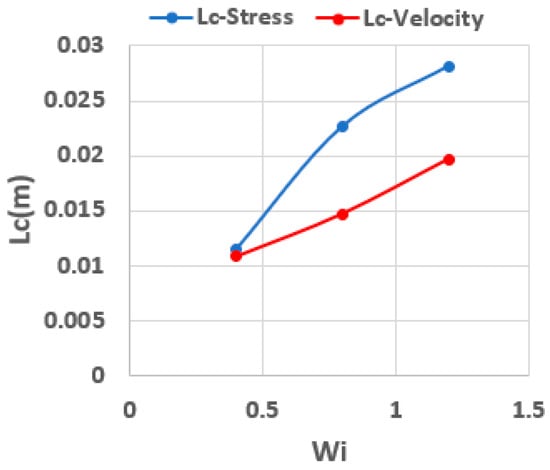
Figure 18.
The influence of Wi number on the critical length to achieve steady velocity and stress distributions (, Re = 10).
3.3. Influence Solvent Viscosity Ratio
The total viscosity of viscoelastic materials can often be viewed as arising from two main contributions, which are a base fluid or matrix that governs much of the viscous dissipation and polymeric or structural components, which impart both viscous and elastic characteristics. Although the total viscosity is commonly used in defining the Reynolds number (Re), the distinct roles of these constituent viscosities in flow behavior are not fully captured by relying solely on Re and the Weissenberg number (Wi). In polymer solutions, the solvent viscosity primarily influences energy dissipation through viscous effects, whereas the polymer viscosity plays a dual role, contributing to both viscous dissipation and the elastic stresses that result from material deformation.
Figure 19 illustrates the effect of the solvent viscosity ratio (i.e., the ratio of solvent viscosity to the total viscosity) on the development of the axial velocity profile along the centerline of the tube. In this set of simulations, Wi and Re are 0.8 and 5, respectively. As depicted, increasing the solvent viscosity ratio results in a more gradual transition to the final, steady velocity profile. Conversely, holding the total viscosity constant while decreasing the solvent viscosity effectively increases the polymer contribution. In this scenario, the enhanced polymer viscosity leads to stronger elastic forces, which, in turn, augment the extensional stress in the entrance region of the tube.
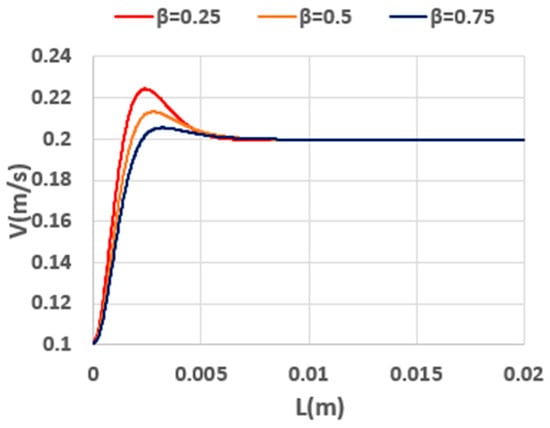
Figure 19.
Development of axial velocity along the centerline of tube for different viscosity ratios ( (Re = 5, Wi = 0.8).
A closer view of the axial velocity evolution is provided in Figure 20, highlighting the development of velocity near the downstream region as the flow approaches its steady state. The data show that reducing the solvent viscosity ratio intensifies the fluid’s elasticity, manifested by overshoots in the velocity profile during the development process. These overshoots reflect the heightened elastic stresses generated by the polymer chains under strong deformation in the entry region.
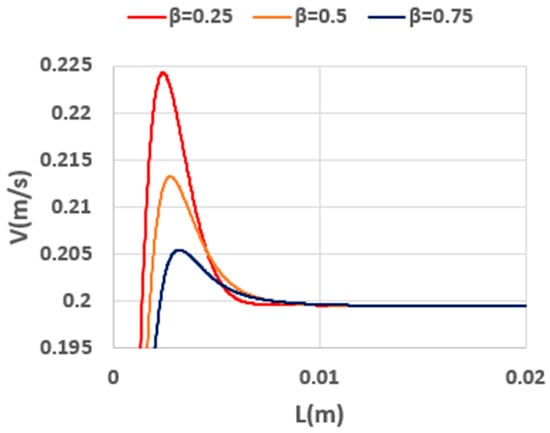
Figure 20.
Close-up view of axial velocity for different solvent viscosity ratios (Re = 5, Wi = 0.8).
Further insights can be gleaned from Figure 21, where velocity contours are shown for fluids with varying solvent viscosity ratios. The higher elasticity of the fluid with β = 0.25 (i.e., a lower solvent viscosity ratio) is evident in the more pronounced velocity overshoot. This is consistent with the observations in Figure 19 and Figure 20, affirming the correlation between lower solvent viscosity and enhanced elastic effects.
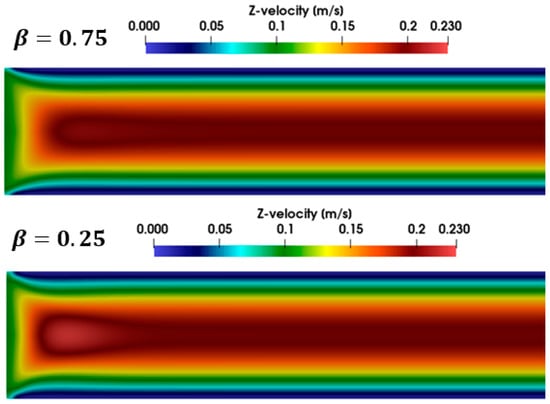
Figure 21.
Contours of velocity in the entrance of tube for fluids with different solvent viscosity ratios = 0.75 (top) and = 0.25 (bottom) (Re = 5, Wi = 0.8).
Elastic stress development is depicted in Figure 22, which shows the axial stress distribution () along the centerline in the entrance region of the tube. At a fixed Wi value, decreasing the solvent viscosity ratio (i.e., increasing the polymer contribution) elevates the magnitude of elastic stresses. Moreover, a reduction in the solvent viscosity ratio leads to a longer distance before the stress distribution attains its steady value, underscoring the more robust elastic response and slower relaxation dynamics at higher polymer contributions. Interestingly, because all simulations employ the same relaxation time, the location of the maximum axial stress remains nearly the same among the different fluid compositions.
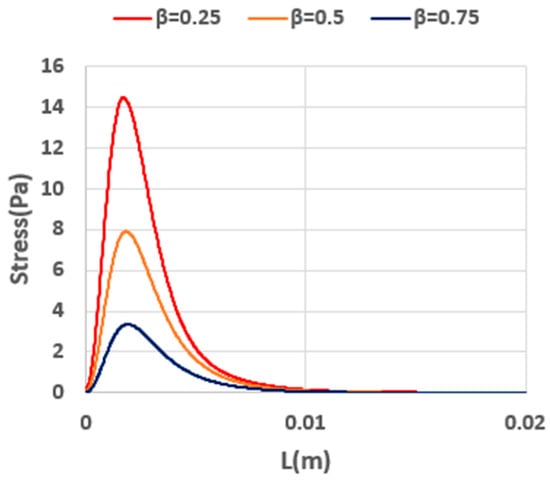
Figure 22.
Development of axial elastic stress () along the centerline of tube for fluids with different solvent viscosity ratios (Re = 5, Wi = 0.8).
Figure 23 provides contour plots of the elastic stress () at the tube entrance for two distinct solvent viscosity ratios. As expected, the fluid with the lower solvent viscosity ratio (β = 0.25) exhibits substantially higher elastic stress magnitudes in both the central region and near the wall. This outcome emphasizes the pivotal influence of polymer-induced elasticity, which becomes increasingly pronounced as the solvent proportion decreases and the polymer fraction—and thus the polymer viscosity—dominates the overall rheological response.
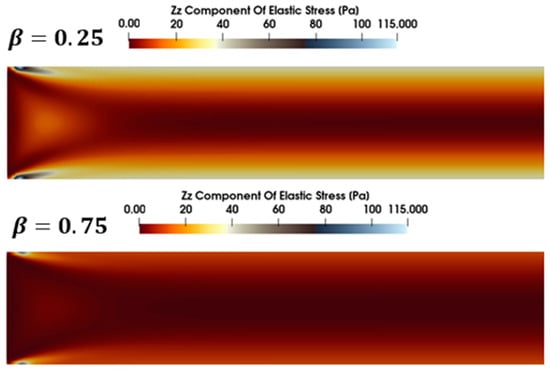
Figure 23.
Contours of elastic stress () at the entrance of tube for = 0.25 (top) and = 0.75 (bottom) (Re = 5, Wi = 0.8).
Figure 24 presents the critical length required for the velocity and stress fields to reach their steady state. Notably, an increase in the solvent viscosity ratio results in a negligible change in the entry length for velocity. Conversely, an increase in solvent viscosity ratio results in a decrease in the entry length of the stress field, which is attributed to the lower elasticity of fluids with a higher solvent viscosity ratio ().
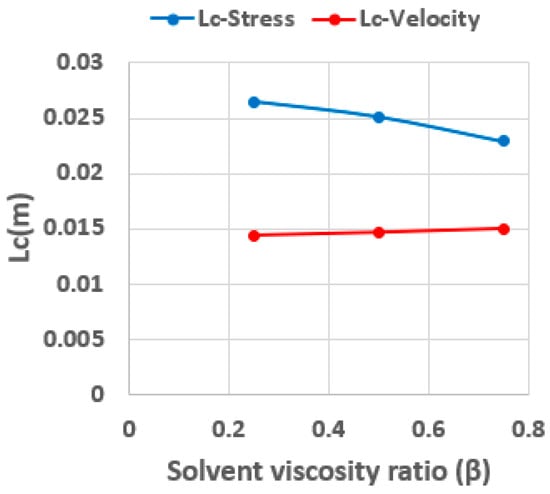
Figure 24.
The influence of solvent viscosity ratio on the critical length to achieve steady velocity and stress distributions (Re = 5, Wi = 0.8).
3.4. Influence Shear Thinning Behavior
Complex viscoelastic materials often exhibit shear thinning behavior, wherein polymer chains deform and align along the flow streamlines as the shear rate increases. This chain reorientation reduces the apparent polymer viscosity at higher shear rates, an effect well captured by the Giesekus model, which incorporates a mobility parameter (α) to represent the anisotropic drag on polymer chains.
Figure 25 illustrates the shear viscosity curves for fluids that share the same zero-shear viscosity but differ in the extent of shear thinning. Here, the polymer and solvent viscosities each equal 0.01 Pa⋅s, and the solvent viscosity ratio (), Reynolds number (Re), and Weissenberg number (Wi) are held constant at 0.5, 25, and 0.80, respectively. As observed in Figure 25, an increase in the mobility parameter leads to more pronounced shear thinning. At shear rate around of 100 s−1, the reduction in viscosity is minimum for α = 0.01, whereas raising α to 0.1 or 0.5 yields a substantial viscosity drop at the same shear rate.
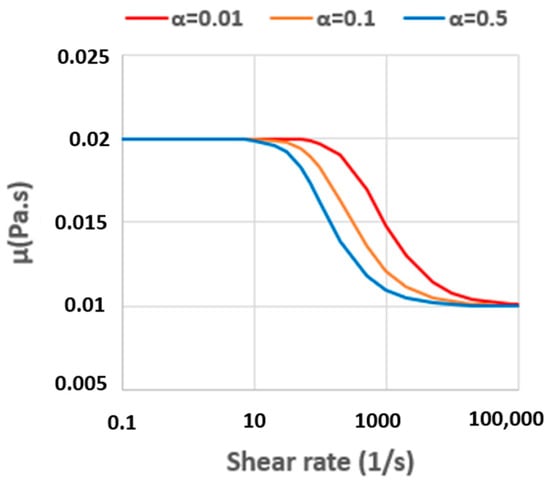
Figure 25.
Viscosity curves for fluids with different mobility parameters.
Figure 26 presents the axial velocity distribution in the entrance region of the tube for viscoelastic fluids with varying mobility parameters (). Increasing the degree of shear thinning (i.e., increasing α) diminishes the velocity overshoot, reflecting a decrease in polymer viscosity—and hence elastic effects—in the entry zone. Consequently, the critical length needed to establish a steady velocity profile is reduced. Moreover, at higher α values, the ultimate steady velocity at the center of the tube decreases while the velocity profile flattens. This behavior arises because the viscosity at the wall is lower under higher shear rates whereas the center region, experiencing smaller shear rates, retains a relatively higher viscosity. Figure 27 further highlights these shear-thinning-induced changes to the velocity profile. A comparison of velocity contours for and at a constant inlet velocity of 0.1 m/s reveals that a stronger shear thinning behavior () produces a smoother transition to a lower steady-velocity profile than that observed for the fluid with weaker shear thinning behavior (.
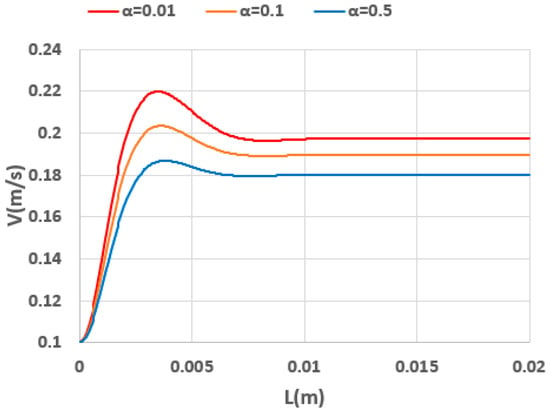
Figure 26.
Development of axial velocity along the centerline of tube for fluids with different mobility parameters () (Wi = 0.8, Re = 25).
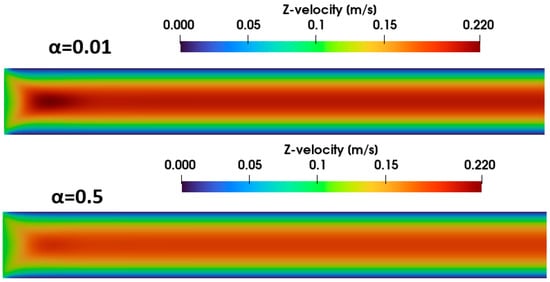
Figure 27.
Contours of velocity distribution at the entrance of tube for α = 0.01 (top) and α = 0.5 (bottom) (Wi = 0.8, Re = 25).
Figure 28 shows the distribution of elastic stress () along the axis of the tube. As observed, raising the mobility parameter reduces the axial elastic stress at the centerline, consistent with the overall decrease in polymer viscosity. Additionally, the length scale required for the stress distribution to reach its steady value also diminishes under stronger shear thinning. Figure 29 shows a comparative view of the elastic stress () contours near the inlet for a fluid with two different mobility parameters. A comparison of predicted elastic stress for fluids with α = 0.01 and α = 0.5 reveals a marked decrease in elastic stress associated with the higher shear-thinning fluid.
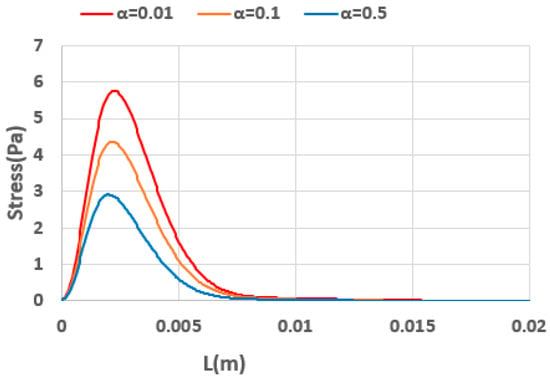
Figure 28.
Development of axial normal stress () along the centerline of tube for fluids with different mobility parameters.
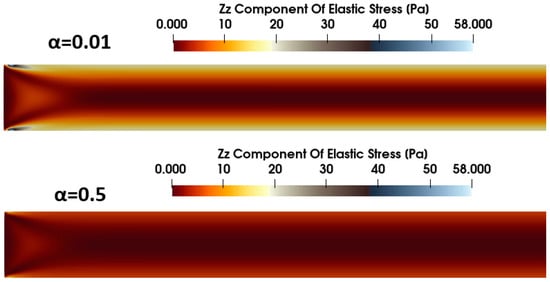
Figure 29.
Contours of elastic stress () at the entrance of tube for α = 0.01 (top) and α = 0.5 (bottom) (Wi = 0.8, Re = 25).
Figure 30 examines the critical entry length to achieve steady velocity and stress fields across different mobility parameters. An increase in α leads to a shorter distance over which both the velocity and stress distributions stabilize, although the flow consistently attains a steady velocity profile before the stress field fully equilibrates. These findings, together with the previous observations concerning Re, Wi, and the solvent viscosity ratio (), underscore that in viscoelastic flows, the distance required to establish a steady velocity field does not necessarily guarantee a steady stress distribution.
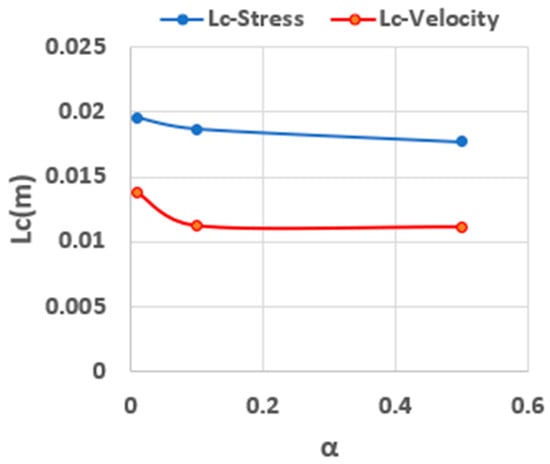
Figure 30.
Critical length to reach steady velocity and stress distributions (Wi = 0.8, Re = 25).
In the CFD simulations examining the influence of the mobility parameter, the inlet velocity, zero-shear viscosity, and relaxation time were held constant. Nevertheless, the effective Reynolds number (Re), Weissenberg number (Wi), and solvent viscosity ratio () all change with different values of the mobility parameter [38]. This occurs because increasing the mobility parameter reduces the effective viscosity of the fluid, which, in turn, raises the effective Reynolds number. Moreover, due to the fluid’s nonlinearity, its apparent relaxation time diminishes at higher shear rates. Therefore, the observed dependence of the entry length (for both velocity and stress fields) on the mobility parameter reflects a combined effect of heightened inertia and reduced fluid elasticity as the degree of shear thinning increases.
While the present study focused on entry-region flow dynamics in tubes, the employed approach can be extended to other geometries, such as channels with different cross-sectional shapes. Unlike Newtonian fluids, viscoelastic fluids may generate secondary flows when flowing in the channels. Such secondary flows can be effectively captured by the Giesekus model [39]. The accurate prediction of the entry length to reach steady axial velocity, a fully developed stress field, and stable secondary flow patterns is critical for a wide range of applications such as microfluidics devices used for particle separation, focusing, and related processes [39,40,41,42].
4. Conclusions
In this study, we presented an axisymmetric CFD simulation of developing viscoelastic fluid flows within a tube. The viscoelastic fluid was modeled using the Giesekus model, which considers the shear thinning behavior of fluids. Furthermore, the LCT approach was employed to avoid numerical instabilities at high Wi numbers. The numerical model was initially validated against published data of planar contraction geometry. After performing a mesh sensitivity study for tube geometry, we systematically investigated the influence of four key parameters—the Reynolds number (Re), Weissenberg number (Wi), solvent viscosity ratio (), and mobility parameter ()—on the developing flow in the entry-region of a tube.
The obtained results regarding the influence of Re number indicate that at a constant Wi number and solvent viscosity ratio, and with the absence of a shear thinning effect as we increase the Re number, the entry lengths to reach steady velocity and stress fields increase. At low Re values, the distance for the stress field to stabilize exceeds that of the velocity field. However, at higher Re values, the discrepancy between velocity-based and stress-based entry lengths becomes smaller. Furthermore, the velocity and stress profile along the axis of tube indicate an overshoot at low Re numbers. However, as we increase the Re number, the overshoot diminishes.
The obtained results regarding the influence of the Wi number indicate that at a constant Re number and solvent viscosity ratio and with the absence of a shear thinning effect, an increase in Wi results in an increase in entry length for both velocity and stress fields, with stress typically requiring a longer development region. Furthermore, an increase in the Wi number results in an overshoot in the velocity profile, reflecting the heightened elastic stresses near the entrance region.
CFD simulations indicated that for constant Re and Wi numbers, an increase in the solvent viscosity ratio results in a smoother transition to the fully developed region. By increasing the solvent viscosity ratio, the elasticity of the fluid decreases, which, in turn, lowers the intensity of elastic stress in the developing region of the flow. According to the present results, an increase in the solvent viscosity ratio resulted in a negligible change in the entry length for velocity and a more pronounced change in the entry length of the stress field.
The influence of the mobility parameter on the developing flow was investigated and it was observed that by increasing the shear thinning behavior, the polymer stress at the entrance region decreases and a smoother transition to the steady velocity is observed. According to the present results, an increase in the mobility parameter results in a shorter entry length for both velocity and elastic stress fields. Nevertheless, the entry length for the stress field remains longer than that of the velocity field for all mobility parameters.
Author Contributions
Conceptualization, H.P., D.G. and S.W.; methodology, H.P.; software, H.P., D.G. and S.W.; formal analysis, H.P., D.G. and S.W.; writing—original draft, H.P.; writing—review and editing, H.P., D.G. and S.W.; visualization, H.P.; supervision, D.G.; project administration, D.G.; funding acquisition, D.G. All authors have read and agreed to the published version of the manuscript.
Funding
This research received no external funding.
Data Availability Statement
The original contributions presented in this study are included in the article. Further inquiries can be directed to the corresponding author.
Conflicts of Interest
The authors declare no conflict of interest.
References
- Grotberg, J.B. Biofluid Mechanics: Analysis and Applications; Cambridge University Press: Cambridge, UK, 2021. [Google Scholar]
- Clark, A.R.; Lin, M.; Tawhai, M.; Saghian, R.; James, J.L. Multiscale modelling of the feto–placental vasculature. Interface Focus 2015, 5, 20140078. [Google Scholar] [CrossRef] [PubMed]
- Li, Z.; Haward, S.J. Viscoelastic flow development in planar microchannels. Microfluid. Nanofluid. 2015, 19, 1123–1137. [Google Scholar] [CrossRef]
- Kim, B.; Park, S. Study on in-nozzle flow and spray behavior characteristics under various needle positions and length-to-width ratios of nozzle orifice using a transparent acrylic nozzle. Int. J. Heat Mass Transf. 2019, 143, 118478. [Google Scholar] [CrossRef]
- Hatzikiriakos, S.G.; Dealy, J.M. Start-up pressure transients in a capillary rheometer. Polym. Eng. Sci. 1994, 34, 493–499. [Google Scholar] [CrossRef]
- Wang, S.; Gao, D.; Wester, A.; Beaver, K.; Wyke, K. Analytical and computational modeling of relaxation times for non-Newtonian fluids. Fluids 2024, 9, 165. [Google Scholar] [CrossRef]
- Durst, F.; Ray, S.; Ünsal, B.; Bayoumi, O.A. The development lengths of laminar pipe and channel flows. ASME J. Fluids Eng. 2005, 127, 1154–1160. [Google Scholar] [CrossRef]
- Mohanty, A.K.; Asthana, S.B.L. Laminar flow in the entrance region of a smooth pipe. J. Fluid Mech. 1979, 90, 433–447. [Google Scholar] [CrossRef]
- Poole, R.J.; Ridley, B.S. Development-length requirements for fully developed laminar pipe flow of inelastic non-Newtonian liquids. ASME J. Fluids Eng. 2007, 129, 1281–1287. [Google Scholar] [CrossRef]
- Lambride, C.; Syrakos, A.; Georgiou, G.C. Entrance length estimates for flows of power-law fluids in pipes and channels. J. Non-Newton. Fluid Mech. 2023, 317, 105056. [Google Scholar] [CrossRef]
- Rehman, S.; Chebbi, R. Power-law fluid flow in the entrance region between two parallel plates. Results Eng. 2024, 24, 103066. [Google Scholar] [CrossRef]
- Ookawara, S.; Ogawa, K.; Dombrowski, N.; Amooie-Foumeny, E.; Riza, A. Unified entry length correlation for Newtonian, power law and Bingham fluids in laminar pipe flow at low Reynolds number. J. Chem. Eng. Japan. 2000, 33, 675–678. [Google Scholar] [CrossRef]
- Fernandes, C.; Ferrás, L.L.; Araujo, M.S.; Nóbrega, J.M. Development length in planar channel flows of inelastic non-Newtonian fluids. J. Non-Newton. Fluid Mech. 2018, 255, 13–18. [Google Scholar] [CrossRef]
- Syrakos, A.; Gryparis, E.; Georgiou, G.C. A revisit of the development of viscoplastic flow in pipes and channels. arXiv 2024, arXiv:2409.00842. [Google Scholar] [CrossRef]
- Soto, R.J.; Shah, V.L. Entrance flow of a yield-power law fluid. Appl. Sci. Res. 1976, 32, 73–85. [Google Scholar] [CrossRef]
- Poole, R.J.; Chhabra, R.P. Development length requirements for fully developed laminar pipe flow of yield stress fluids. J. Fluids Eng. 2010, 132, 034501. [Google Scholar] [CrossRef]
- Philippou, M.; Kountouriotis, Z.; Georgiou, G.C. Viscoplastic flow development in tubes and channels with wall slip. J. Non-Newton. Fluid Mech. 2016, 234, 69–81. [Google Scholar] [CrossRef]
- Poole, R.J. Inelastic and flow-type parameter models for non-Newtonian fluids. J. Non-Newton. Fluid Mech. 2023, 320, 105106. [Google Scholar] [CrossRef]
- Na, Y.; Yoo, J.Y. A finite volume technique to simulate the flow of a viscoelastic fluid. Comput. Mech. 1991, 8, 43–55. [Google Scholar] [CrossRef]
- Missirlis, K.A.; Assimacopoulos, D.; Mitsoulis, E. A finite volume approach in the simulation of viscoelastic expansion flows. J. Non-Newton. Fluid Mech. 1998, 78, 91–118. [Google Scholar] [CrossRef]
- Al Moatssime, H.; Esselaoui, D.; Hakim, A.; Raghay, S. Finite volume multigrid method of the planar contraction flow of a viscoelastic fluid. Int. J. Numer. Methods Fluids 2001, 36, 885–902. [Google Scholar] [CrossRef]
- Liang, J.Z. Determination of the entry region length of viscoelastic fluid flow in a channel. Chem. Eng. Sci. 1998, 53, 3185–3187. [Google Scholar] [CrossRef]
- Alves, M.A.; Oliveira, P.J.; Pinho, F.T. Benchmark solutions for the flow of Oldroyd-B and PTT fluids in planar contractions. J. Non-Newton. Fluid Mech. 2003, 110, 45–75. [Google Scholar] [CrossRef]
- Yapici, K.; Karasozen, B.; Uludag, Y. Numerical analysis of viscoelastic fluids in steady pressure-driven channel flow. J. Fluids Eng. 2012, 134, 051206. [Google Scholar] [CrossRef]
- Teixeira, D.F.M. Determination of the Entrance Length for Viscoelastic Fluid Flows in Microchannels. Master’s Thesis, Universidade do Porto, Porto, Portugal, 2022. [Google Scholar]
- Bertoco, J.; Leiva, R.T.; Ferrás, L.L.; Afonso, A.M.; Castelo, A. Development length of fluids modelled by the gptt constitutive differential equation. Appl. Sci. 2021, 11, 10352. [Google Scholar] [CrossRef]
- Pouraria, H.; Gao, D.; Wang, S. Numerical investigation of developing flow of viscoelastic fluids in a tube. In ASTFE Digital Library; Begel House Inc.: Danbury, CT, USA, 2025. [Google Scholar] [CrossRef]
- Alves, M.A.; Oliveira, P.J.; Pinho, F.T. Numerical methods for viscoelastic fluid flows. Annu. Rev. Fluid Mech. 2021, 53, 509–541. [Google Scholar] [CrossRef]
- Giesekus, H. A simple constitutive equation for polymer fluids based on the concept of deformation-dependent tensorial mobility. J. Non-Newton. Fluid Mech. 1982, 11, 69–109. [Google Scholar] [CrossRef]
- Bird, R.B.; Armstrong, R.C.; Hassager, O. Dynamics of Polymeric Liquids, Volume 1: Fluid Mechanics; Wiley: Hoboken, NJ, USA, 1987. [Google Scholar]
- Fattal, R.; Kupferman, R. Time-dependent simulation of viscoelastic flows at high Weissenberg number using the log-conformation representation. J. Non-Newton. Fluid Mech. 2005, 126, 23–37. [Google Scholar] [CrossRef]
- Fernandes, C.; Araujo, M.S.B.; Ferrás, L.L.; Nóbrega, J.M. Improved both sides diffusion (iBSD): A new and straightforward stabilization approach for viscoelastic fluid flows. J. Non-Newton. Fluid Mech. 2017, 249, 63–78. [Google Scholar] [CrossRef]
- Flow Science, Inc. FLOW-3D. Version 2023R2. Flow Science, Inc.: Pasadena, CA, USA, 2023. Available online: https://www.flow3d.com/ (accessed on 14 May 2025).
- Dunstan, D.E. The viscosity-radius relationship for concentrated polymer solutions. Sci. Rep. 2019, 9, 543. [Google Scholar] [CrossRef]
- Ananyev, D.V.; Halitova, G.R.; Vachagina, E.K. Hydrodynamics and heat transfer in a laminar flow of viscoelastic fluid in a flat slot channel. Thermo-Phys. Aeromechanics 2015, 22, 49–60. [Google Scholar] [CrossRef]
- Litvinov, S.; Hu, X.; Ellero, M.; Adams, N. Mesoscopic simulation of the transient behavior of semi-diluted polymer solution in a microchannel following extensional flow. Microfluid. Nanofluid. 2014, 16, 257–264. [Google Scholar] [CrossRef]
- Kleßinger, U.A.; Wunderlich, B.K.; Bausch, A.R. Transient flow behavior of complex fluids in microfluidic channels. Microfluid. Nanofluid. 2013, 15, 533–540. [Google Scholar] [CrossRef][Green Version]
- Casanellas, L.; Alves, M.A.; Poole, R.J.; Lerouge, S.; Lindner, A. The stabilizing effect of shear thinning on the onset of purely elastic instabilities in serpentine microflows. Soft Matter 2016, 12, 6167–6175. [Google Scholar] [CrossRef]
- Maklad, O.; Poole, R.J. A review of the second normal-stress difference; its importance in various flows, measurement techniques, results for various complex fluids and theoretical predictions. J. Non-Newton. Fluid Mech. 2021, 292, 104522. [Google Scholar] [CrossRef]
- Li, Y.K.; Zheng, Z.Y.; Zhang, H.N.; Li, F.C.; Qian, S.; Joo, S.W.; Kulagina, L.V. Numerical study on secondary flows of viscoelastic fluids in straight ducts: Origin analysis and parametric effects. Comput. Fluids 2017, 152, 57–73. [Google Scholar] [CrossRef]
- Pouraria, H.; Foudazi, R.; Houston, J.P. Exploitation of elasto-inertial fluid flow for the separation of nano-sized particles: Simulating the isolation of extracellular vesicles. Cytom. Part A 2023, 103, 786–795. [Google Scholar] [CrossRef]
- Wang, P.; Yu, Z.; Lin, J. Numerical simulations of particle migration in rectangular channel flow of Giesekus viscoelastic fluids. J. Non-Newton. Fluid Mech. 2018, 262, 142–148. [Google Scholar] [CrossRef]
Disclaimer/Publisher’s Note: The statements, opinions and data contained in all publications are solely those of the individual author(s) and contributor(s) and not of MDPI and/or the editor(s). MDPI and/or the editor(s) disclaim responsibility for any injury to people or property resulting from any ideas, methods, instructions or products referred to in the content. |
© 2025 by the authors. Licensee MDPI, Basel, Switzerland. This article is an open access article distributed under the terms and conditions of the Creative Commons Attribution (CC BY) license (https://creativecommons.org/licenses/by/4.0/).