
Can Intelligent Equipment Optimization Improve the Carbon Emissions Efficiency of the Equipment-Manufacturing Industry?

Abstract
1. Introduction
2. Literature Review and Hypothesis Development
2.1. The Level of Intelligent Equipment Upgrades and the Carbon Emissions Efficiency of Equipment-Manufacturing Enterprises
2.2. Mediating Effect: Cost-Saving Mechanism
2.3. Moderating Effect: Energy Intensity as a Mechanism
3. Research Design
3.1. Model Construction
3.2. Measurement and Description of Variables
3.2.1. Measurement of Carbon Emissions Efficiency in Equipment-Manufacturing Enterprises
3.2.2. Level of Intelligent Equipment Upgrades
3.2.3. Control Variables
4. Results
4.1. Descriptive Statistical Results
4.2. Baseline Regression Results
4.3. Test for Mediation by the Cost-Saving Effect
4.4. Test for a Moderating Effect of Energy Intensity
4.5. Robustness Test
4.5.1. Narrowing the Sample Scope
4.5.2. Replacing the Independent Variable
4.5.3. Instrumental Variable Method
5. Conclusions and Implications
5.1. Conclusions
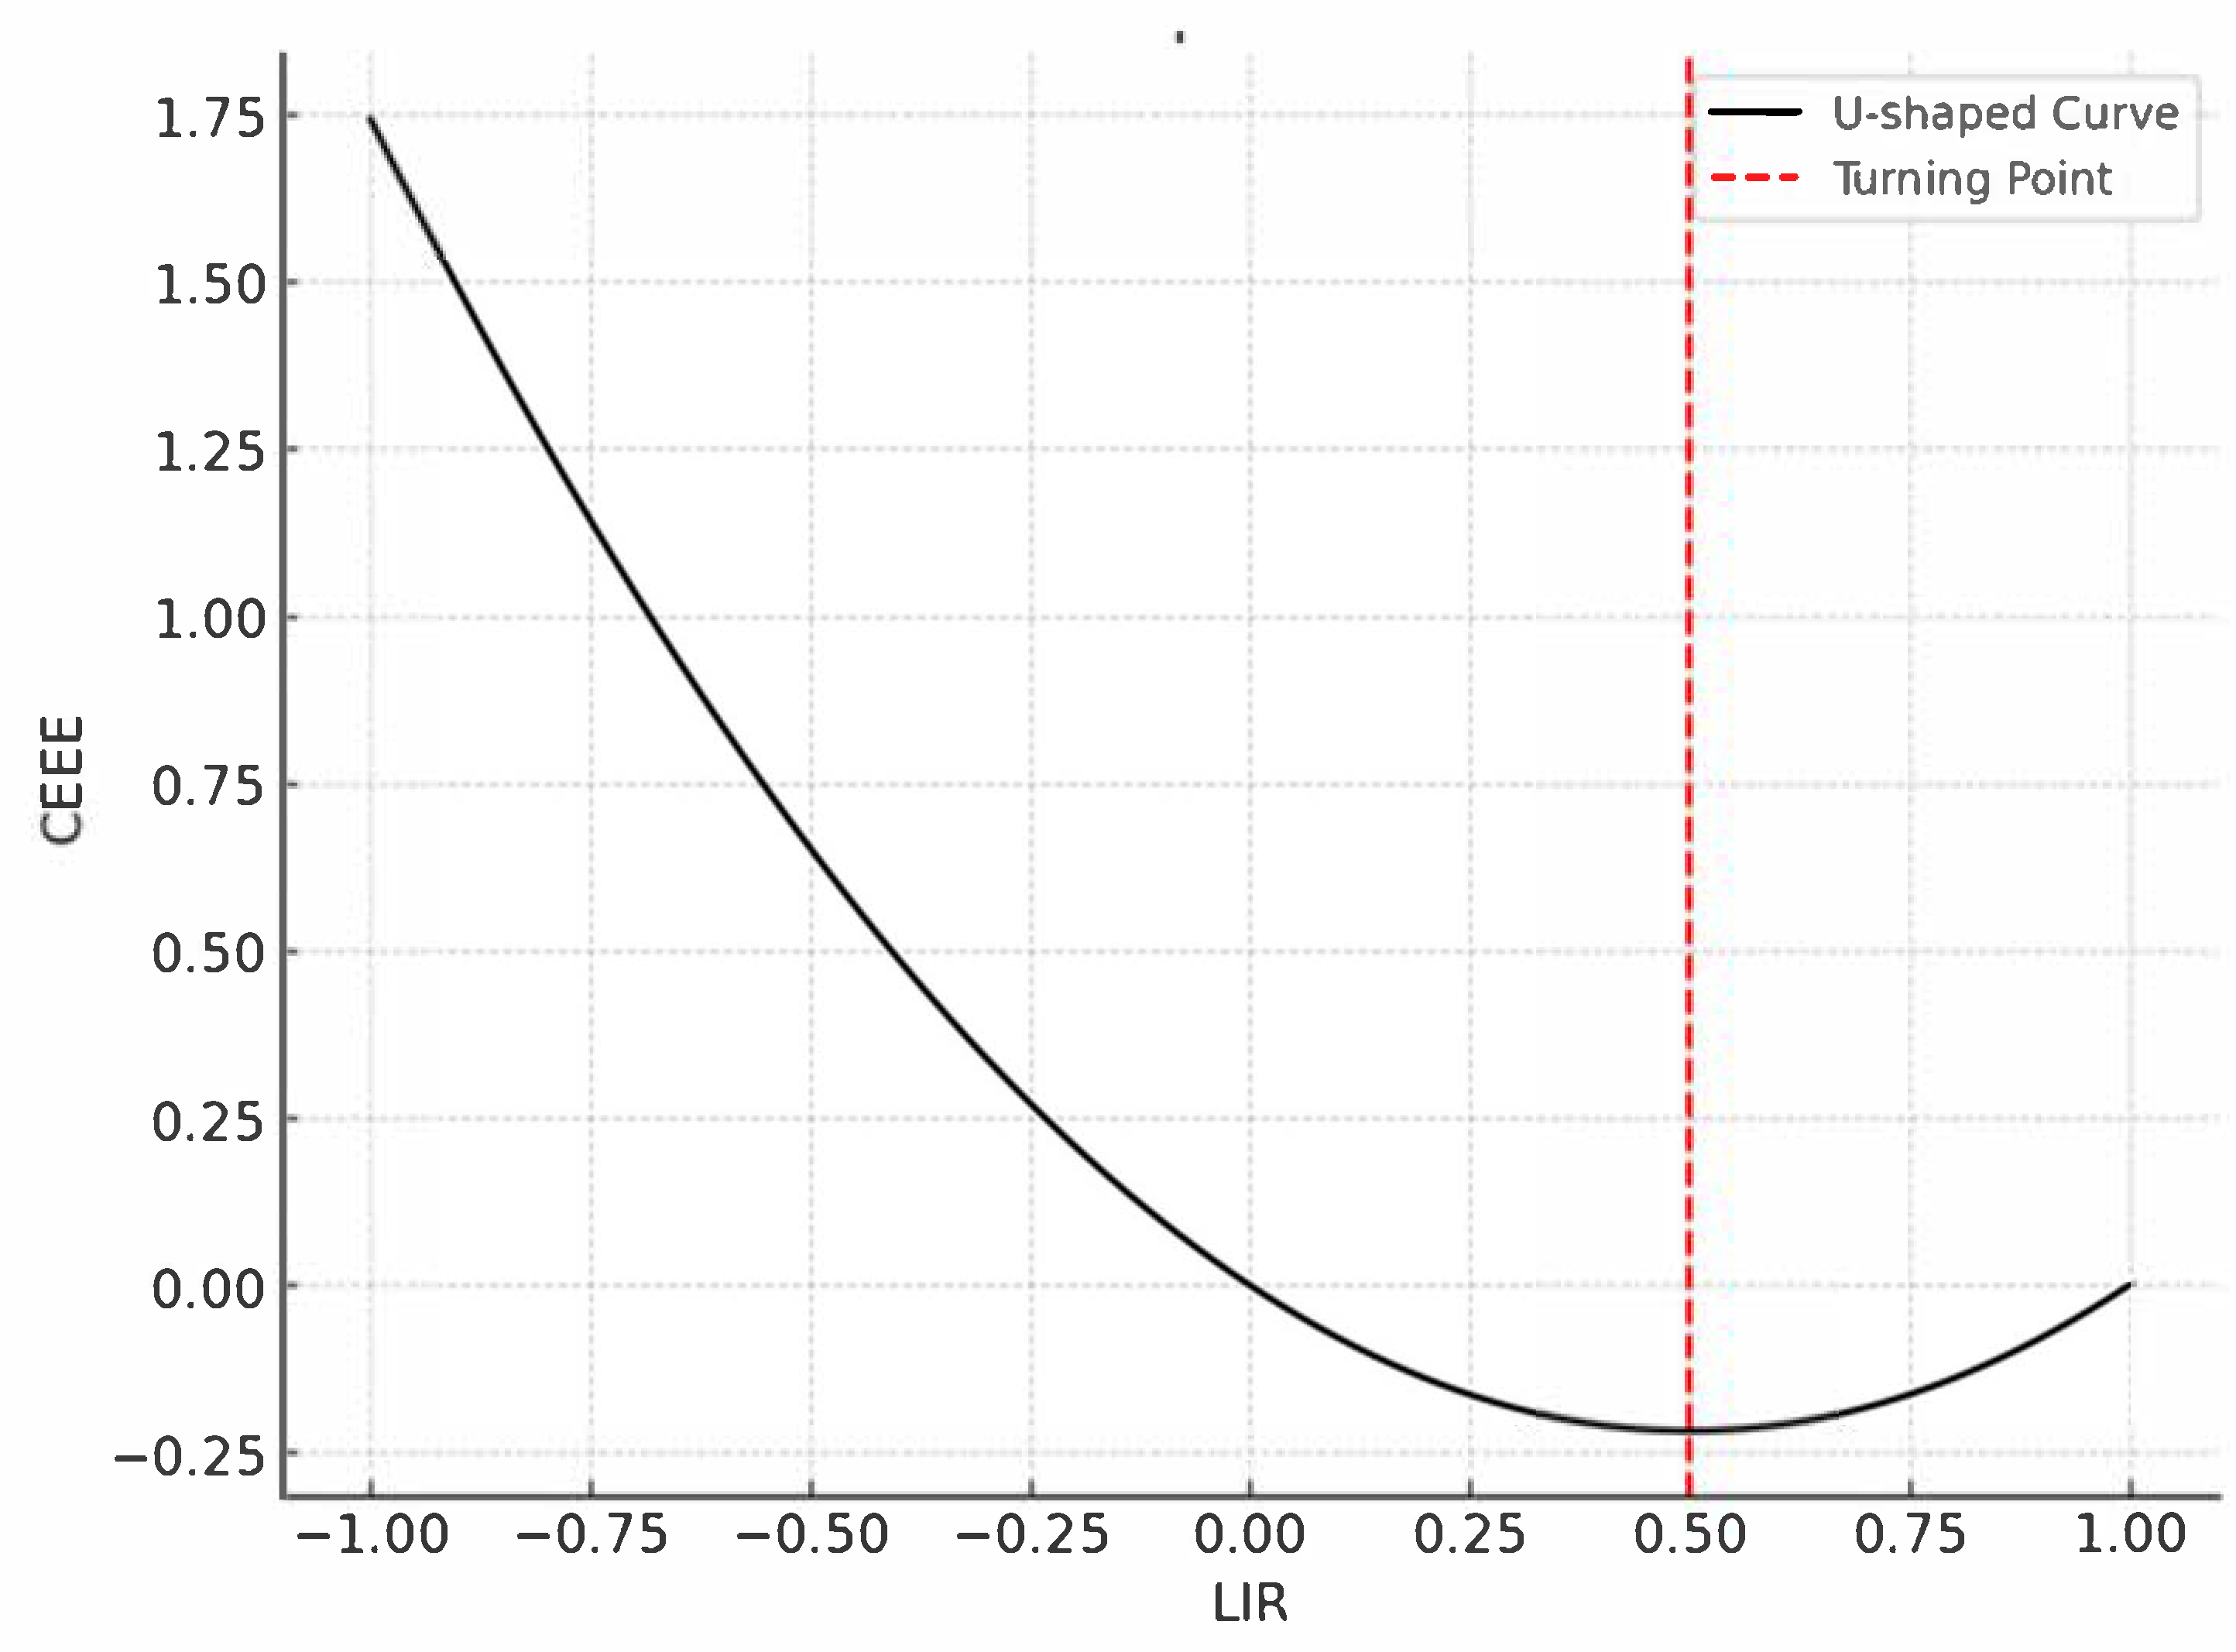
5.1.1. The U-Shaped Impact of Intelligent Upgrades on Carbon Emissions Efficiency
5.1.2. The Mediating Effect of Cost-Saving
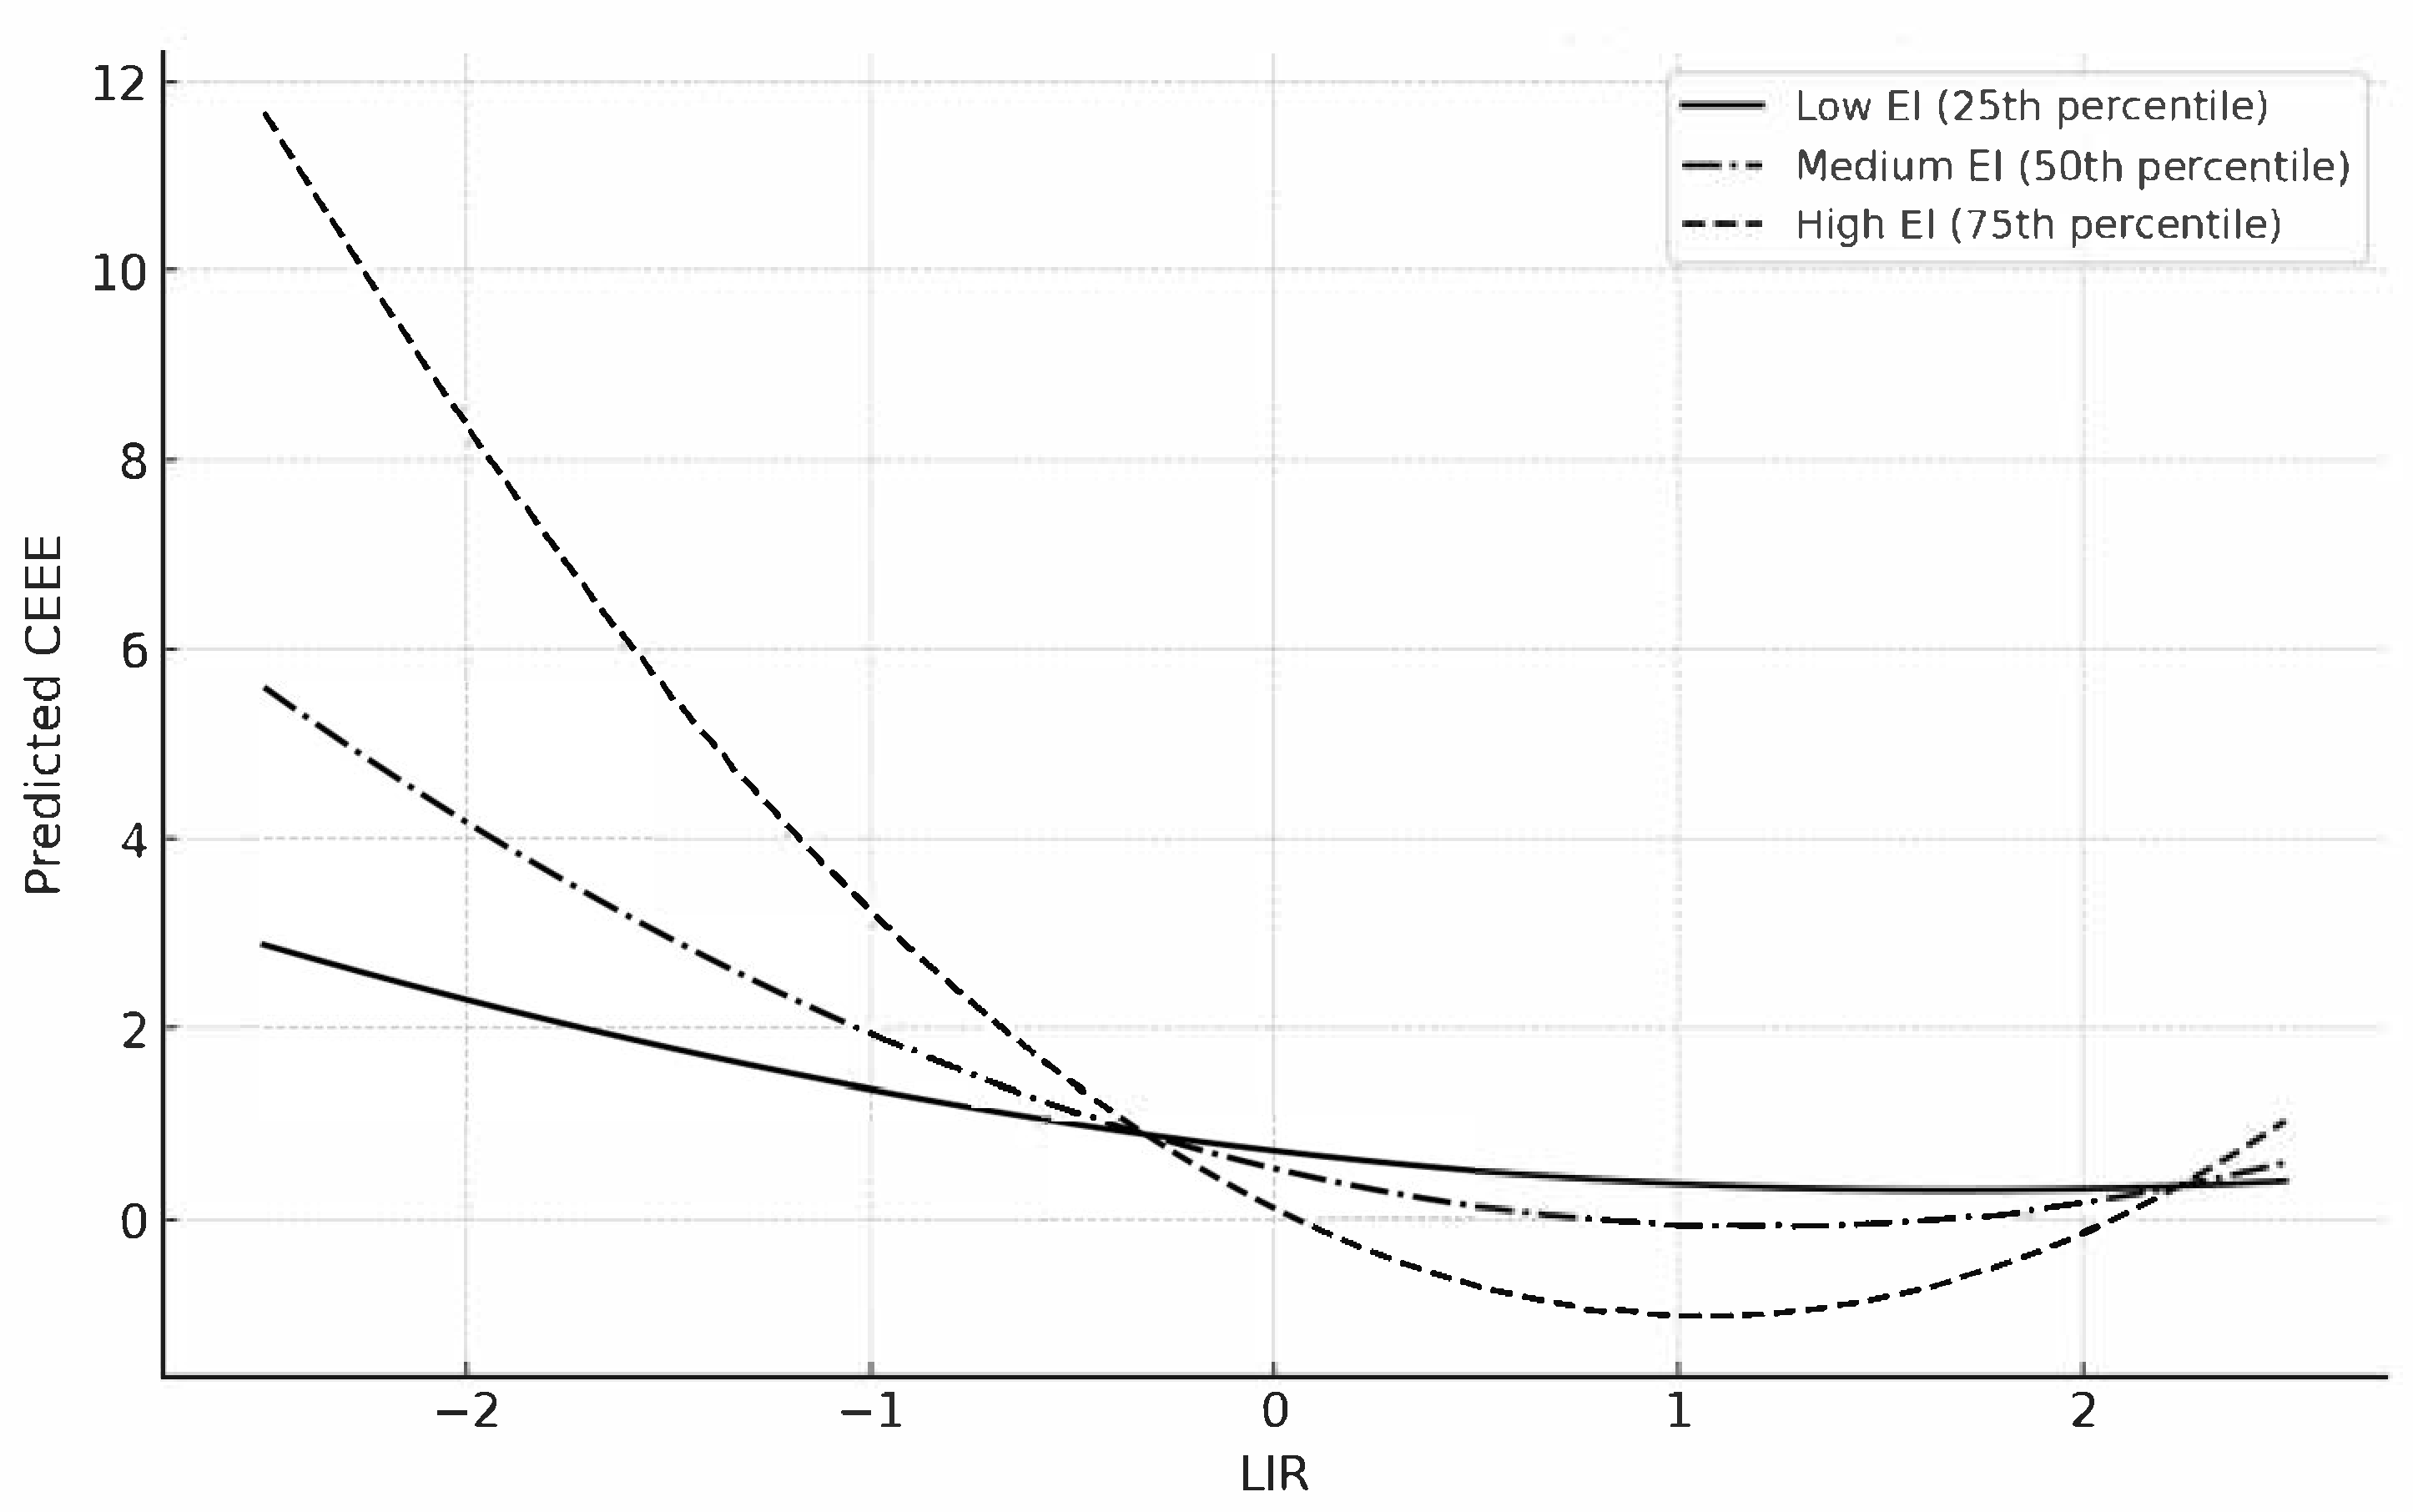
5.1.3. The Moderating Role of Energy Intensity
5.2. Recommendations
5.2.1. Increase Financial Support and Incentives for Intelligent Upgrades
5.2.2. Optimize Policies for Intelligent Upgrades and Cost Management
5.2.3. Strengthen Energy-Intensity Management and Promote Green Manufacturing
5.2.4. Establish Long-Term Mechanisms to Ensure Policy Continuity and Effectiveness
5.3. Limitations
Author Contributions
Funding
Data Availability Statement
Conflicts of Interest
References
- Waltersmann, L.; Kiemel, S.; Stuhlsatz, J.; Sauer, A.; Miehe, R. Artificial intelligence applications for increasing resource efficiency in manufacturing companies—A comprehensive review. Sustainability 2021, 13, 6689. [Google Scholar] [CrossRef]
- Hu, X.; Liu, C. Carbon productivity: A case study in the Australian construction industry. J. Clean. Prod. 2016, 112, 2354–2362. [Google Scholar] [CrossRef]
- Xie, Q.; Hu, P.; Jiang, A.; Li, Y. Carbon emissions allocation based on satisfaction perspective and data envelopment analysis. Energy Policy 2019, 132, 254–264. [Google Scholar] [CrossRef]
- Taleb, M. Modelling environmental energy efficiency in the presence of carbon emissions: Modified oriented efficiency measures under polluting technology of data envelopment analysis. J. Clean. Prod. 2023, 414, 137743. [Google Scholar] [CrossRef]
- Li, H.; Fang, K.; Yang, W.; Wang, D.; Hong, X. Regional environmental efficiency evaluation in China: Analysis based on the Super-SBM model with undesirable outputs. Math. Comput. Model. 2013, 58, 1018–1031. [Google Scholar] [CrossRef]
- Lin, X.; Zhu, X.; Han, Y.; Geng, Z.; Liu, L. Economy and carbon dioxide emissions effects of energy structures in the world: Evidence based on SBM-DEA model. Sci. Total Environ. 2020, 729, 138947. [Google Scholar] [CrossRef] [PubMed]
- Cui, T.; Zhang, Y. Research on the impact of circular economy on total factor carbon productivity in China. Environ. Sci. Pollut. Res. 2022, 29, 78780–78794. [Google Scholar] [CrossRef]
- Edgar, T.F.; Pistikopoulos, E.N. Smart manufacturing and energy systems. Comput. Chem. Eng. 2018, 114, 130–144. [Google Scholar] [CrossRef]
- Sarc, R.; Curtis, A.; Kandlbauer, L.; Khodier, K.; Lorber, K.E.; Pomberger, R. Digitalisation and intelligent robotics in value chain of circular economy oriented waste management—A review. Waste Manag. 2019, 95, 476–492. [Google Scholar] [CrossRef]
- Demestichas, K.; Daskalakis, E. Information and communication technology solutions for the circular economy. Sustainability 2020, 12, 7272. [Google Scholar] [CrossRef]
- Zhou, P.; Han, M.; Shen, Y. Impact of intelligent manufacturing on total-factor energy efficiency: Mechanism and improvement path. Sustainability 2023, 15, 3944. [Google Scholar] [CrossRef]
- Zong, Z.; Guan, Y. AI-driven intelligent data analytics and predictive analysis in Industry 4.0: Transforming knowledge, innovation, and efficiency. J. Knowl. Econ. 2024, 16, 864–903. [Google Scholar] [CrossRef]
- Wang, L.; Chen, Q.; Dong, Z.; Cheng, L. The role of industrial intelligence in peaking carbon emissions in China. Technol. Forecast. Soc. Change 2024, 199, 123005. [Google Scholar] [CrossRef]
- Shen, Y.; Yang, Z. Chasing green: The synergistic effect of industrial intelligence on pollution control and carbon reduction and its mechanisms. Sustainability 2023, 15, 6401. [Google Scholar] [CrossRef]
- Cao, B.; Li, L.; Zhang, K.; Ma, W. The influence of digital intelligence transformation on carbon emission reduction in manufacturing firms. J. Environ. Manag. 2024, 367, 121987. [Google Scholar] [CrossRef]
- Lv, H.; Shi, B.; Li, N.; Kang, R. Intelligent manufacturing and carbon emissions reduction: Evidence from the use of industrial robots in China. Int. J. Environ. Res. Public Health 2022, 19, 15538. [Google Scholar] [CrossRef] [PubMed]
- Liu, Y.; Zhang, X.; Shen, Y. Technology-driven carbon reduction: Analyzing the impact of digital technology on China’s carbon emission and its mechanism. Technol. Forecast. Soc. Change 2024, 200, 123124. [Google Scholar] [CrossRef]
- Zhou, M.S.; Zhao, S.S. Research on the Impact of Digitization Level on Carbon Emissions from the Perspective of Industry Correlation. J. Univ. Jinan (Soc. Sci. Ed.) 2025, 35, 124–140. [Google Scholar]
- Jin, F.; Xu, C.L. Research on the Nonlinear Impact of Digital Economy Development on Carbon Emissions. Mod. Econ. Res. 2022, 11, 14–23. [Google Scholar]
- Xu, L.; Wang, C. Sustainable manufacturing in a closed-loop supply chain considering emission reduction and remanufacturing. Resour. Conserv. Recycl. 2018, 131, 297–304. [Google Scholar] [CrossRef]
- Wang, Y.Q.; Tao, S.J. Research on the impact and spatial effect of industrial intelligence on industrial carbon emission efficiency in China. Technol. Econ. 2023, 42, 130–140. [Google Scholar]
- Camilleri, M.A. Closing the loop for resource efficiency, sustainable consumption and production: A critical review of the circular economy. Int. J. Sustain. Dev. 2018, 21, 1–17. [Google Scholar] [CrossRef]
- Li, Z.; Zhu, J.; Wang, S. Environmental regulation, intelligent manufacturing and corporate investment & financing: Evidence from industrial robot investment. Pac. Basin Financ. J. 2024, 87, 102477. [Google Scholar]
- Shang, M.; Liu, D.; Cao, J.; Liu, Y.; Jia, C. Influence factors of digital economy on the willingness of equipment manufacturing industry to green production in the era of artificial intelligence. J. Electr. Syst. 2024, 20, 1128–1141. [Google Scholar] [CrossRef]
- MacDuffie, J.P.; Krafcik, J.F. Integrating technology and human resources for high performance manufacturing: Evidence from the international auto industry. In Transforming Organizations; Oxford University Press: New York, NY, USA, 1992; pp. 209–225. [Google Scholar]
- Wang, Y.Y.; Tang, C.X. How can intelligent manufacturing improve the carbon total factor productivity of enterprises? ——From the perspective of factor input cost and structure. J. Technol. Econ. 2025, 2, 1–17. [Google Scholar]
- Carneiro, A. The role of intelligent resources in knowledge management. J. Knowl. Manag. 2001, 5, 358–367. [Google Scholar] [CrossRef]
- Han, S.Z.; Wang, C.F.; Zhang, H.S.; Li, H. Intelligent Manufacturing Promotes Green Innovation in Enterprises: Analysis of the Regulating Effect Based on External Pressure and Support. J. Manag. 2025, 38, 114–133. [Google Scholar]
- Zhang, X.; Liu, P.; Zhu, H. The impact of industrial intelligence on energy intensity: Evidence from China. Sustainability 2022, 14, 7219. [Google Scholar] [CrossRef]
- Wang, F.; Sun, X.; Reiner, D.M.; Wu, M. Changing trends of the elasticity of China’s carbon emission intensity to industry structure and energy efficiency. Energy Econ. 2020, 86, 104679. [Google Scholar] [CrossRef]
- Chen, Y.; Xu, W.; Zhou, Q.; Zhou, Z. Total factor energy efficiency, carbon emission efficiency, and technology gap: Evidence from sub-industries of Anhui province in China. Sustainability 2020, 12, 1402. [Google Scholar] [CrossRef]
- Liu, L.; Yang, K.; Fujii, H.; Liu, J. Artificial intelligence and energy intensity in China’s industrial sector: Effect and transmission channel. Econ. Anal. Policy 2021, 70, 276–293. [Google Scholar] [CrossRef]
- Wan, L.; Wang, Z.L.; Ng, J.C. Measurement research on the decoupling effect of industries’ carbon emissions—Based on the equipment manufacturing industry in China. Energies 2016, 9, 921. [Google Scholar] [CrossRef]
- Li, J.; Ma, S.; Qu, Y.; Wang, J. The impact of artificial intelligence on firms’ energy and resource efficiency: Empirical evidence from China. Resour. Policy 2023, 82, 103507. [Google Scholar] [CrossRef]
- Schroeder, P.; Anggraeni, K.; Weber, U. The relevance of circular economy practices to the sustainable development goals. J. Ind. Ecol. 2019, 23, 77–95. [Google Scholar] [CrossRef]
- Zhang, W.; Zeng, M. Is artificial intelligence a curse or a blessing for enterprise energy intensity? Evidence from China. Energy Econ. 2024, 134, 107561. [Google Scholar] [CrossRef]
- Yin, Z.H.; Zeng, W.P. The effects of industrial intelligence on China’s energy intensity: The role of technology absorptive capacity. Technol. Forecast. Soc. Change 2023, 191, 122506. [Google Scholar] [CrossRef]
- Mei, B.; Khan, A.A.; Khan, S.U.; Ali, M.A.S.; Luo, J. Variation of digital economy’s effect on carbon emissions: Improving energy efficiency and structure for energy conservation and emission reduction. Environ. Sci. Pollut. Res. 2023, 30, 87300–87313. [Google Scholar] [CrossRef] [PubMed]
- Tone, K. A slacks-based measure of efficiency in data envelopment analysis. Eur. J. Oper. Res. 2001, 130, 498–509. [Google Scholar] [CrossRef]
- Shao, L.; Guan, D.; Zhang, N.; Shan, Y.; Chen, G.Q. Carbon emissions from fossil fuel consumption of Beijing in 2012. Environ. Res. Lett. 2016, 11, 114028. [Google Scholar] [CrossRef]
- Wang, H.; Liu, J.Z.; Zhang, L.H. Carbon Emissions and Asset Pricing: Evidence from Chinese Listed Companies. China J. Econ. 2022, 9, 28–75. [Google Scholar] [CrossRef]
- Jia, N.; Yan, X.; Yu, S. Does increasing robot density exacerbate wealth inequality? J. Asian Econ. 2024, 95, 101830. [Google Scholar] [CrossRef]
- Shen, K.R.; Qiao, G.; Lin, J.W. Intelligent Manufacturing policies and high quality development of Chinese enterprises. J. Quant. Technol. Econ. 2024, 41, 5–25. [Google Scholar]
- Wang, D.; Wang, J.Y. The impact of China’s carbon trading policy on green total factor productivity of enterprises. China Bus. Mark. 2025, 39, 70–85. [Google Scholar]
- Wang, Y.Q.; Dong, W. How does the rise of robots affect the Chinese labor market?—Evidence from manufacturing listed companies. Econ. Res. J. 2020, 55, 159–175. [Google Scholar]
- Acemoglu, D.; Restrepo, P. Robots and jobs: Evidence from US labor markets. J. Political Econ. 2019, 128, 2188–2244. [Google Scholar] [CrossRef]
- Yao, W.W.; Zhang, K.P.; Guo, L.P. How can artificial intelligence improve enterprise productivity?—From the perspective of labor skill structure adjustment. J. Manag. World 2024, 40, 101–116+133+117–122. [Google Scholar]

| Variable Name | Variable Symbol | Variable Description | |
|---|---|---|---|
| Dependent Variable | Carbon Emissions Efficiency of Equipment-Manufacturing Enterprises | CEEE | Carbon emissions efficiency, calculated using the super-efficiency SBM model. |
| Independent Variable | Level of Intelligent Equipment Upgrades | LIR | Robot density at the firm level, calculated by formulas (8) and (9). |
| Mediating Variable | Cost-Saving Effect | CER | Ln (total operating costs). |
| Moderating Variable | Energy Intensity | EI | Energy consumption of the enterprise/operating income. |
| Control Variables | Company Age | Age | Observation year − year of establishment + 1. |
| Company Size | Size | Ln (total assets). | |
| Return on Equity | Roe | Net profit/shareholders’ equity balance. | |
| Leverage Ratio | Lev | Total liabilities/total assets. | |
| Revenue Growth Rate | Growth | (Operating income for this quarter–operating income for the previous quarter)/(Operating income for the previous quarter). | |
| Ownership Concentration | Top1 | Shareholding ratio of the largest shareholder. | |
| Board Size | Board | Ln (number of board members). | |
| Firm Dummy Variable | Industry | 243 firms involved, generating 243 dummy variables. | |
| Year Dummy Variable | Year | 14 years involved, generating 14 dummy variables. |
| Variable | Observations | Mean | Standard Deviation | Min | Max | |
|---|---|---|---|---|---|---|
| Dependent Variable | CEEE | 3402 | 0.125 | 0.197 | −0.065 | 1.880 |
| Independent Variable | LIR | 3402 | 0.0113 | 0.0357 | 1.22 × 10⁻⁶ | 0.951 |
| Control Variables | Age | 3402 | 22.190 | 1.316 | 18.157 | 27.468 |
| Size | 3402 | 2.782 | 0.389 | 1.099 | 4.143 | |
| Roe | 3402 | −0.017 | 1.854 | −76.764 | 0.938 | |
| Lev | 3402 | 0.501 | 0.179 | 0.044 | 0.995 | |
| Growth | 3402 | 0.262 | 1.891 | −0.955 | 58.487 | |
| Top1 | 3402 | 34.181 | 14.195 | 5.278 | 83.827 | |
| Board | 3402 | 8.916 | 1.698 | 2.000 | 19.000 |
| Variable | CEEE | |||
|---|---|---|---|---|
| (1) | (2) | (3) | (4) | |
| LIR | −0.232 *** (−3.29) | −0.525 *** (−4.03) | −0.35 *** (−4.99) | −0.870 *** (−6.54) |
| LIR2 | 0.507 ** (2.67) | 0.873 *** (4.58) | ||
| Age | 0.033 *** (7.70) | 0.036 *** (8.41) | ||
| Size | 0.021 (0.80) | 0.014 *** (0.53) | ||
| Roe | 0.001 (0.85) | 0.001 (0.90) | ||
| Lev | 0.067 *** (3.39) | 0.070 *** (3.55) | ||
| Growth | 0.0001 (0.24) | 0.0001 (0.12) | ||
| Top1 | 0.0006 ** (2.29) | 0.0006 ** (2.29) | ||
| Board | −0.002 (−1.52) | −0.003 (−1.56) | ||
| cons | 0.422 *** (14.79) | 0.455 *** (15.05) | −0.422 *** (−3.64) | −0.468 *** (−4.04) |
| Year | YES | YES | YES | YES |
| Industry | YES | YES | YES | YES |
| R2 | 0.726 | 0.727 | 0.735 | 0.7368 |
| F | 32.61 | 32.57 | 33.10 | 33.26 |
| Observations | 3402 | 3402 | 3402 | 3402 |
| Lower Bound | Upper Bound | |
|---|---|---|
| Range of Values | 1.22 × 10⁻⁶ | 0.9514 |
| Slope | −0.87 | 0.79 |
| t-value | −4.845 | 1.990 |
| Significance | 0.000 | 0.000 |
| Variable | CER | CEEE |
|---|---|---|
| (1) | (2) | |
| CER | 0.817 *** (19.777) | |
| LIR | −0.090 *** (−7.572) | −0.136 *** (−6.106) |
| LIR2 | 0.004 *** (3.849) | 0.078 *** (4.163) |
| Size | 0.330 *** (27.169) | −0.444 *** (−10.068) |
| Age | 0.012 (1.717) | 0.019 (0.385) |
| Roe | 0.007 *** (3.500) | 0.003 (0.286) |
| Lev | 0.045 (7.500) | 0.025 (1.483) |
| Growth | −0.004 ** (−2.000) | −0.011 (−1.190) |
| Top1 | 0.025 ** (2.500) | 0.027 (1.339) |
| Board | −0.009 (−1.800) | −0.026 (−1.680) |
| cons | −0.372 (−7.019) | 0.053 (−7.019) |
| Year | YES | YES |
| Industry | YES | YES |
| R2 | 0.845 | 0.846 |
| F | 125.6194 | 125.6194 |
| Observations | 3402 | 3402 |
| Variable | CEEE | ||
|---|---|---|---|
| (1) | (2) | (3) | |
| LIR | −0.870 *** (−6.54) | −0.152 *** (−6.42) | −2.436 *** (−5.74) |
| LIR2 | 0.873 *** (4.58) | 0.006 *** (4.49) | 1.160 *** (3.25) |
| EI | −0.010 (−0.74) | −3.526 *** (−5.90) | |
| LIR×EI | −9.462 *** (−5.23) | ||
| LIR2×EI | 4.937 *** (3.23) | ||
| Size | 0.036 *** (8.41) | 0.240 *** (7.87) | 0.206 *** (6.72) |
| Age | 0.014 *** (0.53) | 0.031 (0.59) | 0.054 (1.03) |
| Roe | 0.001 (0.90) | 0.009 (0.90) | 0.007 (0.77) |
| Lev | 0.070 *** (3.55) | 0.063 *** (3.55) | 0.064 *** (3.62) |
| Growth | 0.0001 (0.12) | 0.001 (0.09) | 0.002 (0.21) |
| Top1 | 0.0006 ** (2.29) | 0.047 ** (2.26) | 0.052 ** (2.51) |
| Board | −0.003 (−1.56) | −0.026 (−1.57) | −0.022 (−1.32) |
| cons | −0.468 *** (−4.04) | 1.461 *** (8.29) | 0.722 *** (3.33) |
| Year | YES | YES | YES |
| Industry | YES | YES | YES |
| R2 | 0.73 | 0.736 | 0.7387 |
| F | 33.26 | 32.9991 | 33.1889 |
| Observations | 3402 | 3402 | 3402 |
| Variable | Narrowing the Sample Scope | Replacing the Independent Variable | Instrumental Variable Method |
|---|---|---|---|
| (1) | (2) | (3) | |
| LIR | −0.227 *** (−7.908) | −0.584 *** (−9.004) | −0.231 *** (−9.066) |
| LIR2 | 0.153 *** (5.268) | 0.313 *** (6.339) | 0.131 *** (6.339) |
| Size | 0.227 *** (7.331) | 0.041 *** (9.298) | 0.272 *** (9.298) |
| Age | −0.028 (−0.437) | 0.007 (0.281) | 0.015 (0.281) |
| Roe | 0.015 (1.132) | 0.001 (0.911) | 0.009 (0.911) |
| Lev | 0.078 *** (4.231) | 0.074 *** (3.790) | 0.067 *** (3.790) |
| Growth | 0.008 (0.852) | 0.001 (0.006) | 0.001 (0.006) |
| Top1 | 0.040 (1.834) | 0.001 ** (2.301) | 0.048 ** (2.301) |
| Board | −0.020 (−1.129) | −0.003 (−1.586) | −0.026 (−1.586) |
| cons | −0.011 *** (−1.328) | −0.515 *** (−4.462) | −0.520 *** (−4.500) |
| Year | YES | YES | YES |
| Industry | YES | YES | YES |
| R2 | 0.774 | 0.740 | 0.740 |
| F | 34.636 | 33.866 | 33.866 |
| Observations | 1816 | 2284 | 2284 |
Disclaimer/Publisher’s Note: The statements, opinions and data contained in all publications are solely those of the individual author(s) and contributor(s) and not of MDPI and/or the editor(s). MDPI and/or the editor(s) disclaim responsibility for any injury to people or property resulting from any ideas, methods, instructions or products referred to in the content. |
© 2025 by the authors. Licensee MDPI, Basel, Switzerland. This article is an open access article distributed under the terms and conditions of the Creative Commons Attribution (CC BY) license (https://creativecommons.org/licenses/by/4.0/).
Share and Cite
Su, Y.; Xu, G. Can Intelligent Equipment Optimization Improve the Carbon Emissions Efficiency of the Equipment-Manufacturing Industry? Processes 2025, 13, 1543. https://doi.org/10.3390/pr13051543
Su Y, Xu G. Can Intelligent Equipment Optimization Improve the Carbon Emissions Efficiency of the Equipment-Manufacturing Industry? Processes. 2025; 13(5):1543. https://doi.org/10.3390/pr13051543
Chicago/Turabian StyleSu, Yifan, and Guanghua Xu. 2025. "Can Intelligent Equipment Optimization Improve the Carbon Emissions Efficiency of the Equipment-Manufacturing Industry?" Processes 13, no. 5: 1543. https://doi.org/10.3390/pr13051543
APA StyleSu, Y., & Xu, G. (2025). Can Intelligent Equipment Optimization Improve the Carbon Emissions Efficiency of the Equipment-Manufacturing Industry? Processes, 13(5), 1543. https://doi.org/10.3390/pr13051543