Article

Investigation of Foam Mobility Control Mechanisms in Parallel Fractures

1
Sinopec Northwest Company of China Petroleum and Chemical Corporation, Urumqi 830011, China
2
Sinopec Key Laboratory of Enhanced Oil Recovery for Fractured Vuggy Reservoirs, Urumqi 830011, China
3
School of Petroleum Engineering, China University of Petroleum (East China), Qingdao 266580, China
4
Key Laboratory of Unconventional Oil & Gas Development, China University of Petroleum (East China), Ministry of Education, Qingdao 266580, China
5
School of Petroleum and Natural Gas Engineering, Changzhou University, Changzhou 213164, China
*
Authors to whom correspondence should be addressed.
Processes 2025, 13(5), 1527; https://doi.org/10.3390/pr13051527
Submission received: 25 March 2025 / Revised: 9 May 2025 / Accepted: 13 May 2025 / Published: 15 May 2025

Abstract

:
Fractured vuggy reservoirs exhibit intricate fracture networks, where large fractures impose significant shielding effects on smaller ones, posing formidable challenges for efficient exploitation. A systematic evaluation of foaming volume, drainage half-life, decay behavior, and viscosity under varying temperatures and salinities was conducted for conventional foam, polymer-enhanced foam, and gel foam. The results yield the following conclusions: Compared to conventional foam, polymer-enhanced foam exhibits markedly improved stability. In contrast, gel foam, cross-linked with chemical agents, maintains stability for over one week at elevated temperatures, albeit at the expense of reduced foaming capacity. The three-dimensional network structure formed post-gelation enables gel foam to retain a thicker liquid film, exhibiting exceptional foam stability. As salinity increases, the base liquid viscosity of conventional foam remains largely unaffected, whereas polymer foam shows marked viscosity reduction. Gel foam displays a non-monotonic viscosity response—initially increasing due to ionic cross-linking and subsequently declining from excessive charge screening. All three systems exhibit significant viscosity decreases under high-temperature conditions. Visualized plate fracture model experiments revealed distinct flow patterns and mobility control performance; narrow fractures exacerbate bubble coalescence under shear stress, leading to enlarged bubble sizes and diminished plugging efficiency. Among the three systems, gel foam exhibited superior mobility control characteristics, with uniform bubble size distribution and enhanced stability. Integrating the findings from the foam mobility control experiments in parallel fracture systems with the diversion outcomes of mobility control and flooding, distinct performance trends emerge. It can be seen that the stronger the foam stability, the stronger the mobility control ability, and the easier it is to start the shielding effect. Combined with the stability of different foam systems, understanding the mobility control ability of a foam system is the key to increasing the sweep coefficient of a complex fracture network and improve oil-washing efficiency.

1. Introduction

Fractured vuggy reservoirs constitute a highly intricate hydrocarbon system, distinguished by multi-scale storage spaces encompassing pores, fractures, and dissolution cavities. These reservoirs are marked by pronounced heterogeneity in their original porosity and permeability, with storage spaces exhibiting irregular development and distribution. During conventional water and gas injection processes, significant quantities of residual oil remain trapped within these heterogeneous interstices. The foundational structure of fractured vuggy comprises three primary components as follows: the matrix (host rock), fracture networks, and karstic vugs [1,2,3]. Within these reservoirs, crude oil is predominantly stored in large dissolution cavities and fractures, which serve as the principal conduits for oil and gas flow in fractured systems. Fractures not only function as storage spaces for crude oil but also act as critical flow pathways, exerting substantial shielding effects. The bedrock, characterized by extremely low permeability, lacks significant storage or diversion capacity [4,5]. Gas injection has proven to be an effective strategy for enhancing recovery in fractured reservoirs, as it sustains formation pressure while improving oil displacement efficiency [6,7]. The density contrast between injected gas and crude oil induces gravitational segregation underground, facilitating the displacement of “attic oil” situated at the reservoir’s apex. However, conventional nitrogen injection encounters limitations stemming from the high gas/oil mobility ratio and fracture shielding effects, which promote preferential flow through larger fractures. This often manifests as gas channeling or water breakthrough, bypassing oil in smaller fractures and consequently diminishing overall recovery efficiency [8]. Foam fluid, distinguished by its high apparent viscosity, offers robust mobility control. Additionally, its selective “plugging water without plugging oil” property endows it with potent oil-washing capabilities [9,10,11].
Concurrently, foam fluid demonstrates notable diversion potential. Compared to fractured cores saturated with water, the seepage resistance of foam fluid in oil-bearing cores is relatively lower, significantly enhancing the diversion capacity of the oil-bearing matrix. This enables the effective regulation of fluid mobility across high- and low-permeability layers, achieving selective sealing [12]. Nevertheless, identifying the scale of fractures responsible for gas channeling during field-scale mobility control remains challenging, introducing a degree of uncertainty into the design of mobility control strategies. When channeling fractures are excessively wide and foam sealing strength is inadequate, sealing becomes unfeasible; conversely, excessively high sealing strength risks obstructing all flow pathways [13].
As a mobility control and flooding agent, foam effectively seals channeling conduits. Conventional water-based foam can mitigate uneven production from fractures post-gas flooding, yet its low viscosity, poor resistance to temperature and salinity, and rapid defoaming rate render it prone to channeling. Polymer-enhanced foam increases viscosity, decelerates defoaming, and enhances stability; however, prolonged injection can lead to channeling in high-permeability layers, resulting in mobility inversion [14]. Gel foam, integrating the dual attributes of foam and colloid, overcomes the limitations of both systems. Domestic and international studies affirm that colloidal foam exhibits greater stability and superior sealing capacity compared to conventional foam, effectively curbing channeling [15,16,17,18].
Interfracture interference in these reservoirs is inherently complex. While some studies have explored interference patterns under water or gas injection, elucidating key influencing factors, research on leveraging foam to modulate interfracture interference and achieve progressive fracture sweep expansion remains scarce [19,20,21]. Extensive laboratory investigations utilizing visual fracture models have laid the foundational understanding, with numerous studies examining water drive, gas injection, and interference factors in fracture flow [22,23,24,25,26]. However, these investigations exhibit limitations, with a notable paucity of analyses addressing the flow dynamics of polymer foam and gel foam in multi-stage fractures, as well as the impact of foam system stability on mobility control efficacy.
Through the design of a visual flat fracture model, this study investigates the mobility control characteristics of conventional foam, polymer foam, and gel foam within parallel multi-stage fractures. By integrating stability assessments of the three foam systems with detailed observations of foam morphology evolution during fracture flow, the influence of foam stability on mobility control capability is systematically characterized. This approach delineates the respective mobility control capacity limits of the three foam systems. The findings bear significant theoretical and practical implications, offering a pathway to achieve effective oil and gas displacement across all fracture scales’ infractured vuggy, thereby enhancing fracture oil displacement efficiency.

2. Materials and Methods

2.1. Instruments and Materials

An ISCO dual plunger metering pump (model number 100DX, Tridan, Danville, IL, USA) was used to inject the aqueous surfactant solution. The plunger volume is 106.00 mL, the flow range is 0.01–50.00 mL/min, and the pressure range is 0–68.95 MPa with flow accuracy and pressure accuracy of ±0.3% and ±0.5%, respectively. A VHX-6000 ultradeep-field-of-view 3D optical microscope (Keyence Ltd., Osaka, Japan) with a maximum resolution of 100 nm was also used to capture foam evolution. Youpu Pure Water Instrument (model UPT-I-10T, Youpu Ultra-Pure Technology Co., Ltd., Chengdu, China) was used to prepare the foaming agent solution. A high speed mixer (model GJ-3S, Haitongda Co., Ltd., Qingdao, China, speed range 0~15,000 r·min−1) was used to stir the foaming liquid to produce foam. An electric constant temperature blast drying oven (model DHG-9070B, Yunan Instrument Co., Ltd. Shanghai, China) was used to age the gel foam foaming liquid to obtain the gel foam. An Anton Paar rheometer (model MCR 302, Antonpa Shanghai Trading Co., Ltd., Shanghai, China) was used to measure the viscosity change in foam. A gas flowmeter (manufactured by Brooks, model 5850E, maximum flow rate of 50 mL/min under standard conditions, maximum working pressure of 15 MPa, accuracy ± 1% FS) was used in the experiments to control the N2 gas flow rate. A balance (PL3002, Mettler Toledo Instruments Ltd., Shanghai, China) with a range up to 3100 g and accuracy of 0.005 g was used to weigh the polymer and cross-linking agent. Other supporting devices include a foam generator, high-speed cameras, computers, and LED lighting boards.
N2, purity of 99.99% (produced by Xinke Yuan Technology Co., Ltd. Qingdao, China). Foaming agent: YF-1 surfactant (Shengli Oilfield, anionic nonionic surfactant). Polymer: QC-9 (Sinopec Northwest Company of China Petroleum and Chemical Corporation, Urumqi, China, AM-AMPS binary copolymer, with a relative molecular weight of 6 × 10⁶ and an AMPS mole fraction of 30%). Cross-linking agent (Sinopec Northwest Company of China Petroleum and Chemical Corporation, Urumqi, China, CZ-S06, hydroquinone and urotropin). Simulated formation water: it is configured by NaCl, NaHCO3, CaCl2, and MgCl2·6H2O with different specified contents, and the salinity is 22.4 × 10⁴. Parallel fracture model, made of PMMA material, with good transparency, and model processing accuracy at the micrometer level. The flat slab model is shown in Figure 1 and it consists of the following three parts: a base plate, a cover plate, and a sealing rubber ring. The cover plate is perforated at a suitable position as the injection and liquid production end of the model. The base plate and cover plate are fastened with screws. The fracture is 300 mm long and has four fractures with openings of 0.2 mm, 0.6 mm, 1.0 mm, and 2.0 mm, respectively.

2.2. Experimental Methods

2.2.1. Foam Stability and Decay Mechanism

The preferred surfactant concentration is 0.8%, the polymer concentration is 0.4%, and the concentration of the cross-linking agent used for configuring the gel foam is 0.5%. Preparation of ordinary foam blowing solution: a certain proportion of the foaming agent is added to deionized water and placed in a high-speed stirrer for 10 min at a stirring speed of 300 r·min−1. Preparation of polymer foam blowing solution: a certain proportion of QC-9 is placed in deionized water and stirred for 8 h at 1500 r·min−1 to configure the polymer solution. Put the foaming agent into the polymer solution and stir under 300 r·min−1 for 10 min to obtain a uniform polymer foaming liquid. Preparation of gel foam: add cross-linking agent on the basis of the obtained polymer foam foaming solution, stir at 1500 r·min−1 for 2 h to obtain uniform jelly foam body foaming solution, and put the foaming solution into the oven at 130 °C for 24 h to obtain the jelly foam after gel formation. The Waring Blender method was used to determine the solution foam stability. The foam stability was characterized by placing 100 mL of foaming solution into a high-speed stirrer at 8000 r·min−1, and the time required to precipitate 50 mL of the solution was the half-life of the foam. The viscosity changes in the three foams were measured by an Anton Paar rheometer at different temperatures and mineralization levels to investigate the effects of temperature and mineralization level on the foam stability, and the foam morphology was observed by a 3D microscope at intervals of 5 min to investigate the liquid film decay mechanism of the three foam systems.

2.2.2. Mobility Control Experiments of the Foam in a Parallel Fracture Model

The experimental configuration for the parallel fracture foam mobility controlling experiment is illustrated in Figure 2. Optimal concentrations of the surfactant, polymer-surfactant solution, and gelled foam solution were prepared. As illustrated in Figure 1, a flat fracture model was positioned horizontally, and a camera was directly employed to capture the experimental process. The model, depicted in Figure 2, was saturated with simulated oil (hydraulic oil is formed by oil red staining) using a syringe. The gas flow meter was set to a flow rate of 0.5 mL·min−1. Initially, N2 was injected into the model. Following the gas injection phase, the surfactant solution flow rate was adjusted to 1 mL·min−1, and the gas flow rate was maintained at 0.5 mL·min−1, allowing the simultaneous passage of liquid and gas through the foam generator. The foam’s mobility control behavior was observed, with the liquid output from each fracture at the outlet recorded every 10 s. Upon completion, the flat fracture model was cleaned, and the foam system and fractures with varying opening ratios were substituted as required for subsequent experiments.

3. Results

The foam decay mechanism and the effects of temperature and salinity factors on foam stability were analyzed through the viscosity tests of three foam systems. The transport pattern of the foams in the cracks and the limits of the profiling ability of the foams of different systems were characterized using a visual flat slab fracture model.

3.1. Foam Stability and Decay Mechanisms

3.1.1. Influence of the Temperature and Salinity

Table 1 elucidates the marked disparities in foaming volume and foam drainage half-life the three foam systems evaluated under ambient temperature and pressure conditions. Conventional foam, owing to the efficacy of surfactants in substantially reducing interfacial tension, promotes bubble nucleation and rapid expansion, achieving a foaming volume more than four times greater. However, the low viscosity of the base liquid in conventional foam, coupled with a lack of structural reinforcement, results in minimal resistance to liquid flow. This structural deficiency renders the base liquid susceptible to rupture, facilitating bubble coalescence and rapid coarsening. Consequently, the drainage of the base liquid is accelerated, manifesting in a notably brief foam drainage half-life of approximately 476 s.
In contrast, polymer foam incorporates polymer chains to establish a viscoelastic network, which impedes gas diffusion and mitigates the rate of foam coarsening. This enhancement in base liquid viscosity increases resistance to liquid flow, significantly prolonging the drainage process. Relative to conventional foam, polymer foam exhibits superior stability, with a foam drainage half-life approaching 2 h. Nevertheless, this increased viscosity imposes a constraint on bubble expansion, as the foaming process must overcome substantial viscous resistance in high-viscosity solutions, resulting in a foaming volume considerably lower than that of conventional foam.
The integration of cross-linking agents with polymers forms a three-dimensional gel network, which further restricts bubble migration and gas diffusion. While this structure markedly reduces foaming volume, it provides a robust skeletal framework that nearly eliminates base liquid drainage, conferring exceptional stability. Consequently, the foam drainage half-life of this system surpasses that of conventional foam, extending beyond 2 h and, in some instances, exceeding 1 week. In summary, the selection of an appropriate foam system should be guided by the specific requirements of the application context, balancing the trade-offs between foaming volume and stability.
For the conventional foam and polymer foam base liquid (before foaming) prepared by different concentrations of salinity, the base liquid and polymer foam base liquid show little difference due to the high-temperature gelation process of the gel foam, so the gel foam after transaction is measured, and the experimental results are shown in Figure 3. The base liquid viscosity of conventional foam is notably low, a consequence of its limited stability. Accordingly, with increasing salinity, the viscosity of the base liquid exhibits negligible variation. In contrast, as shown in Figure 3b, the base liquid viscosity of polymer foam demonstrates a progressive decline as salinity rises. Under conditions of high salinity, the viscosity diminishes to a mere 260 mPa·s. Figure 3c shows that under low mineralization conditions, the incorporation of a small quantity of inorganic salt facilitates enhanced entanglement of chain segments, thereby increasing the cross-linking density within the gel network and elevating the viscosity of the gel foam. However, as the degree of mineralization continues to escalate, an excess of inorganic salt competes with the cross-linking agent for binding sites, attenuating the original cross-linking effect and resulting in a subsequent decrease in viscosity.
As depicted in Figure 4, the viscosity of the three foam systems—conventional foam, polymer foam, and gel foam—demonstrates a consistent decline as temperature increases. This temperature-dependent behavior arises from a confluence of physical and chemical mechanisms that collectively undermine the structural integrity and rheological properties of the base liquids within these foam systems.
A primary factor contributing to this viscosity reduction is the diminished adsorption capacity of surfactants at elevated temperatures. Surfactants play a critical role in stabilizing foam by reducing interfacial tension and forming a protective layer at the gas–liquid interface. However, as temperature rises, thermal energy disrupts the molecular interactions between surfactant molecules and the base liquid surface, weakening their adsorption efficiency.
Simultaneously, high temperatures exert a destabilizing effect on the polymeric components within polymer foam and gel foam systems. In the case of polymer foam, elevated temperatures accelerate the hydrolysis of polymer chains, a process driven by the increased kinetic energy of water molecules that facilitates the cleavage of polymer bonds. This degradation shortens the chain length and reduces molecular weight, impairing the polymer’s ability to enhance base liquid viscosity through entanglement and network formation.
For gel foam, the impact of the temperature is even more pronounced due to the additional complexity of its cross-linked structure. The gel network, formed through the interaction of polymer chains and cross-linking agents, provides a three-dimensional scaffold that enhances foam stability and viscosity. However, at high temperatures, this cross-linking structure undergoes thermal degradation. The increased thermal energy disrupts the chemical bonds within the cross-links, causing a partial disintegration of the gel network. This breakdown not only reduces the network’s capacity to entrap liquid and sustain film thickness but also diminishes its resistance to flow, resulting in a sharp drop in viscosity.

3.1.2. Decay Mechanism of the Foam System

Figure 5 presents morphological images illustrating the temporal evolution of three distinct foam systems. Relative to its initial state, conventional foam exhibits significant liquid separation after 5 min, accompanied by the pronounced coarsening of surface foam. Under the influence of Ostwald ripening, gas is progressively released, forming larger bubbles, and the bubble morphology transitions from spherical to polyhedral. By 10 min, with a sustained increase in liquid drainage, the outer foam walls thin considerably, leading to a collapse in foam volume and an imminent rupture, characteristic of a “dry foam” state.
In contrast, polymer foam demonstrates greater stability. At 30 min, compared to its initial state, the base liquid retains a rounded shape and maintains a measurable thickness. However, by 60 min, substantial liquid separation occurs, and the bubble population diminishes significantly. The foam structure shifts from dense to open, with the liquid film exhibiting marked thinning.
When comparing conventional foam, polymer foam, and colloidal foam, photographic evidence at 2 min reveals distinct behaviors within the same field of view. Conventional foam displays severe liquid separation at 2 min, with significant surface foam coarsening. Gas release under Ostwald ripening results in larger bubbles, and the morphology shifts from spherical to polyhedral. Polymer foam, while relatively stable, exhibits considerable variation in bubble diameter and a thinner base liquid. In contrast, colloidal foam features a thicker base liquid, with more uniform bubble size and shape. This thickness persists up to 120 min, attributable to the three-dimensional network structure formed post-gelation. This gel skeleton encapsulates the bubbles, substantially slowing the liquid film drainage rate. The thicker liquid film in the colloidal foam system significantly impedes inter-bubble mass transfer, thereby controlling the foam coarsening rate and enhancing overall foam stability.

3.2. Mechanism of Enhanced Oil Recovery by Foam Control Mobility

3.2.1. Foam Release Shielding Effect

The viscosity of the saturated simulated oil within the model is 20 mPa·s, with N2 injected into four fractures at a rate of 0.5 mL·min−1. As evidenced in Figure 6, the two narrower fractures, measuring 0.2 mm and 0.6 mm, are fully shielded. Subsequently, as the oil within the 2 mm fractures is entirely displaced, the 1 mm fractures also become shielded. Following this, foam is introduced into the model, with the outcomes of the foam injection presented in Figure 7.
As observed in Figure 7, following foam injection, the foam preferentially enters the larger fractures, facilitating the further displacement of residual oil. As oil saturation diminishes, the stability of the foam increases, resulting in heightened flow resistance. Consequently, the foam is redirected into smaller fractures, initiating the mobilization of remaining oil within small- to medium-sized fractures and progressively expanding its sweep [27]. This foam propagation process entails continuous foam injection accompanied by a gradual escalation of the pressure gradient, necessitating a substantial slug injection. Fundamentally, the foam flow generates a sustained high pressure gradient, prompting the reactivation of flow within secondary fractures. With continued foam injection, the foam sequentially engages fractures of 1 mm, 0.6 mm (at 6.9 pore volumes, PV), and 0.2 mm (at 17.3 PV). The efficacy of the foam’s plugging performance directly influences its mobility control capacity. Accordingly, subsequent investigations employ fractures with varying opening ratios to further assess the mobility control capabilities of different foam systems.

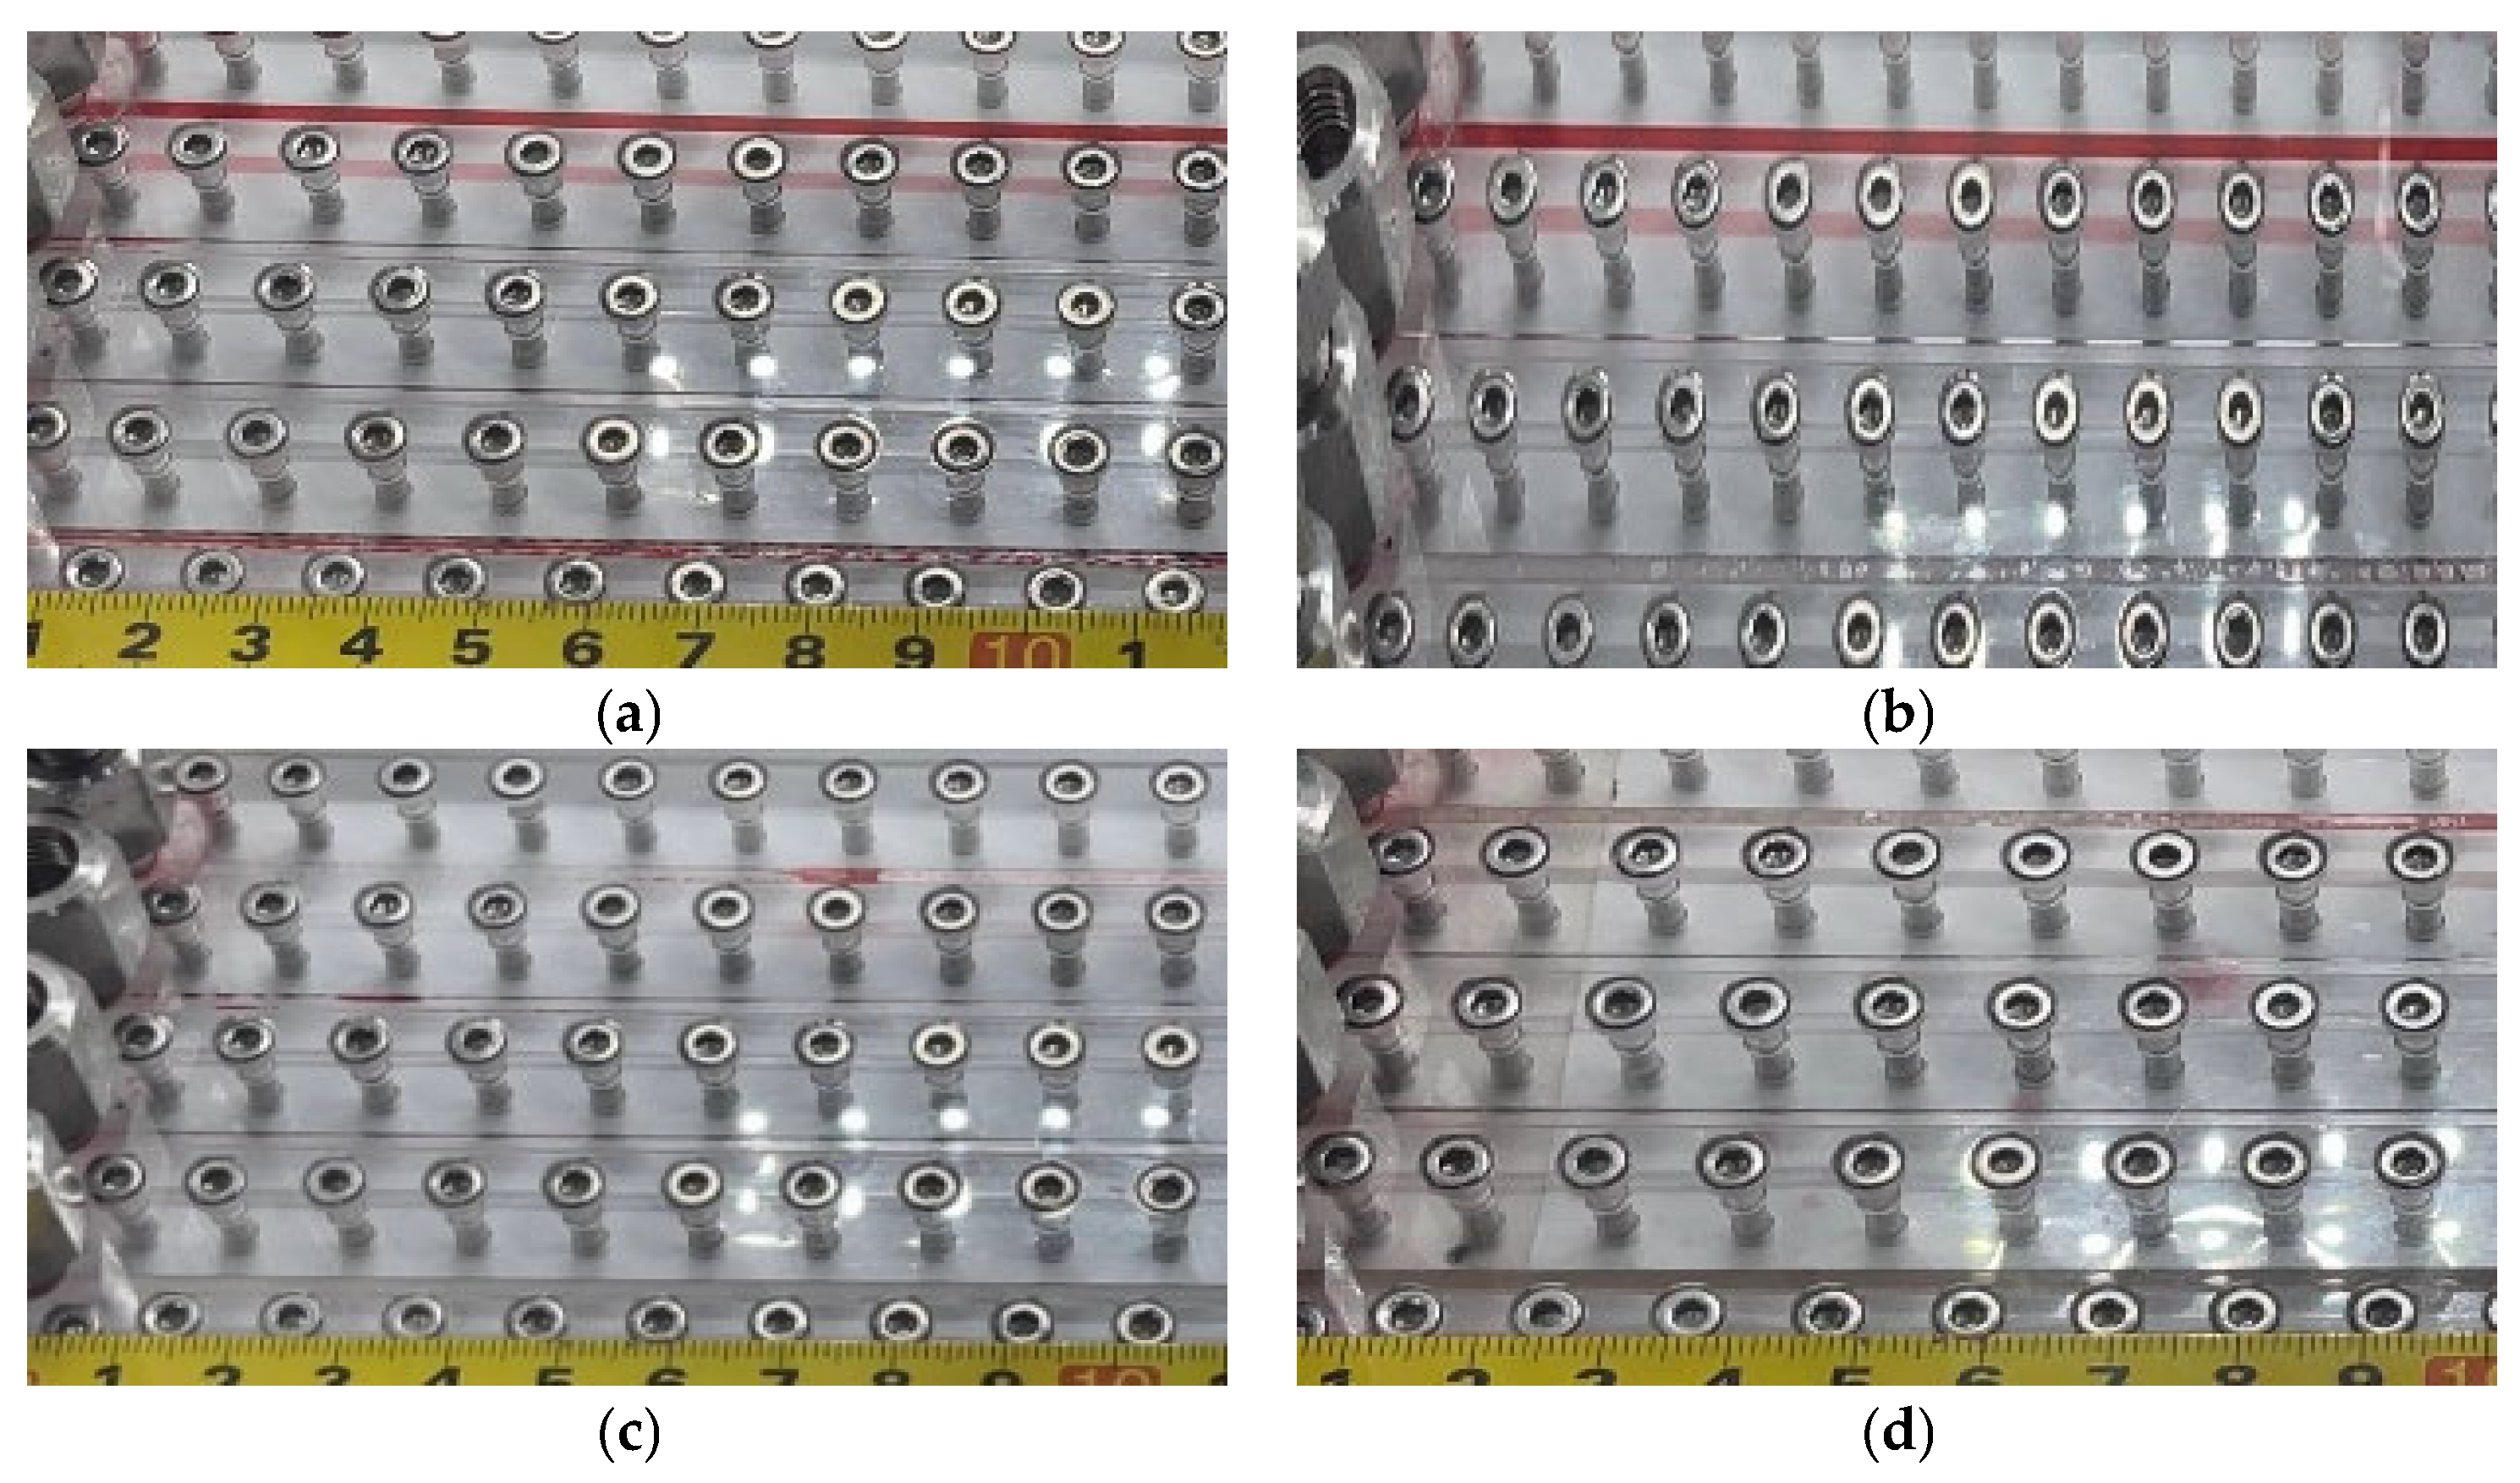
3.2.2. Mobility Control with Foam Under Different Fracture Opening Ratios

Using four different combinations of fractures, namely different fracture opening ratios (ratio of large fracture opening to small fracture opening). The experimental findings are presented in Figure 8, Figure 9, Figure 10 and Figure 11. It can be seen from (a) in Figure 8, Figure 9, Figure 10 and Figure 11 that after gas drive, small fractures are shielded. Only when the fracture opening ratio is 2 are the small fractures not completely shielded. An increase in the opening ratio necessitates greater foam injection volumes to initiate flow within small-opening fractures across various foam systems.
For the conventional foam system, as illustrated in Figure 10b and Figure 11b, small-aperture fractures remain inactivated at an opening ratio exceeding 5, even with an injection volume of 27.6 pore volumes (PV). In contrast, Figure 8b and Figure 9b demonstrate that at opening ratios of 2 and 3.3, small usable fractures can be effectively engaged with injection volumes of 3.6 and 6.6 PV, respectively. These findings indicate that the upper limit of the opening ratio for the mobility control capability of the conventional foam system is approximately 5.
For the polymer-enhanced foam system, Figure 11c demonstrates that small-aperture fractures can be activated at an opening ratio of 10 with an injection volume of 24.6 pore volumes (PV), achieving a utilization degree of approximately 50%. Furthermore, as shown in Figure 8c, Figure 9c, and Figure 10c, at opening ratios of 2, 3.3, and 5, polymer foam injections of 3, 4.8, and 19.2 PV, respectively, are sufficient to bridge small-aperture fractures. These results suggest that the upper limit of the opening ratio for the mobility control capability of this system lies between 5 and 10.
In comparison, the gel-enhanced foam system exhibits superior mobility control performance. As shown in Figure 11d, at an opening ratio of 10, an injection volume of 20.4 PV is sufficient to fully activate small-opening fractures, though the stable liquid production rate from these fractures is limited to approximately 10%. Under other opening ratio conditions, as shown in Figure 8d, Figure 9d, and Figure 10d, the injection volume required to initiate fracture flow is significantly lower than that observed in the conventional and polymer-enhanced systems. This behavior underscores the gel foam system’s enhanced selective plugging capacity, attributable to its higher gel network density and structural strength, with a critical opening ratio for mobility control capability reaching 10.
The experimental data further corroborate that greater foam stability corresponds to enhanced mobility control ability. Consequently, the adaptability and mobility control efficiency of the gel foam system in complex fracture networks markedly surpass those of both the conventional foam and polymer-enhanced foam systems.

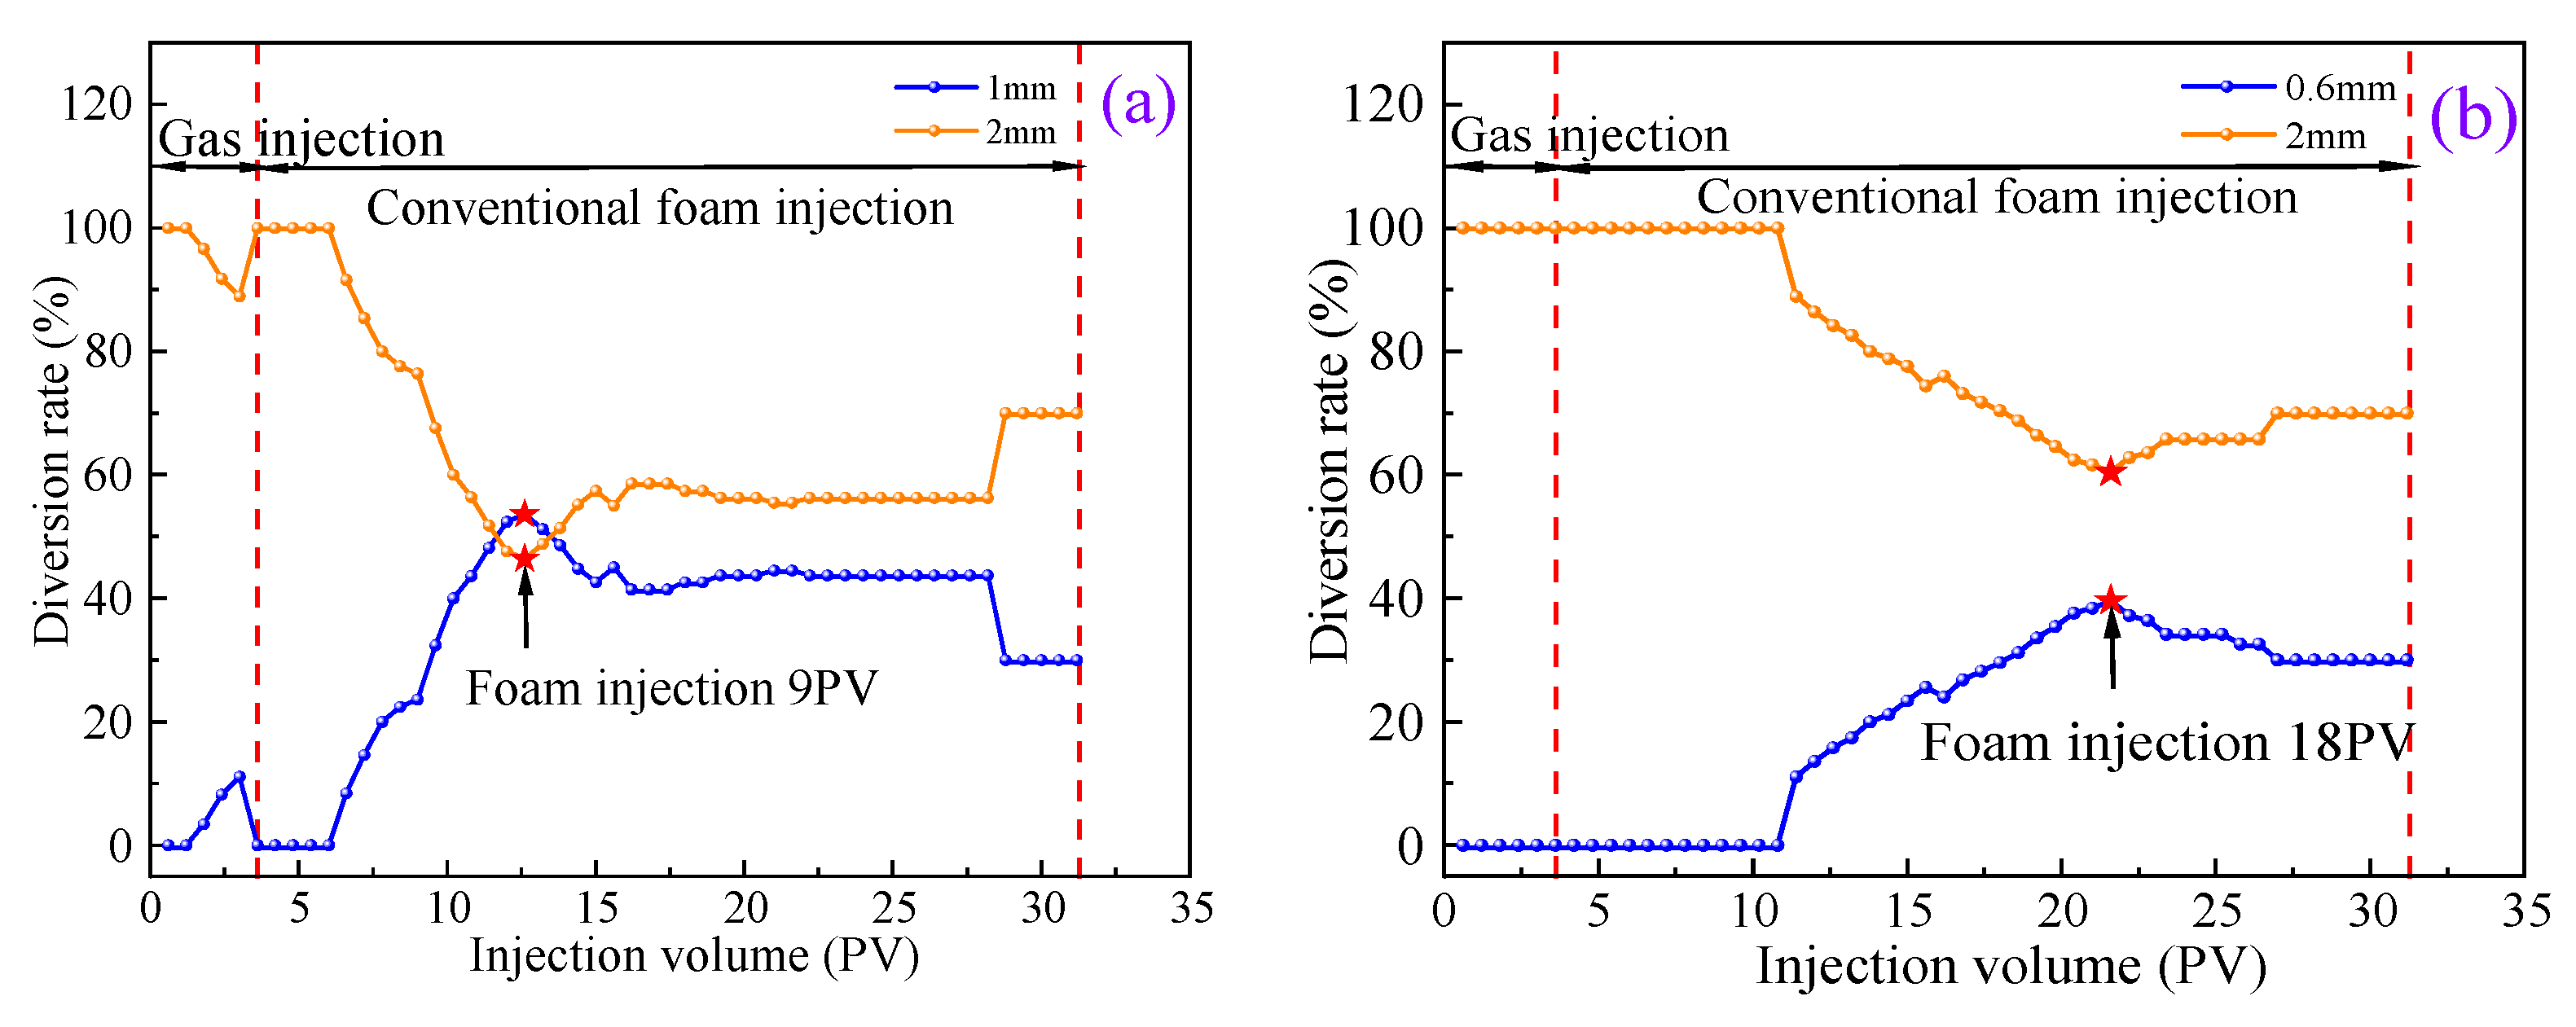
3.2.3. Adjustment of the Foam Injection on the Diversion Rate

During the process of oil–water migration, the width of fractures exerts a profound influence on fluid flow dynamics, with wider fractures predominating due to their inherently lower resistance to fluid movement. This dominance enables wide fractures to preferentially channel the majority of the fluid, thereby imposing a suppressive effect on oil–water migration within narrower fractures. As the volume of injected foam increases incrementally, the diversion rate within narrow fractures exhibits a characteristic pattern of initial rise followed by a subsequent decline. The underlying mechanism can be explained as follows: during the early stages of injection, foam preferentially infiltrates fractures with larger openings, where lower fluid resistance facilitates easier penetration and accumulation. However, as injection progresses, the accumulation of foam within these large-opening fractures significantly elevates local flow resistance. This shift in pressure gradient redirects the foam toward smaller-opening fractures, temporarily augmenting both the foam volume and diversion rate within narrow fractures. Yet, once resistance in the large-opening fractures reaches a critical threshold, the distribution of foam in narrow fractures may diminish due to the rebalancing of the overall flow field, resulting in a decline in the diversion rate.
As shown by the experimental data in Figure 12, Figure 13 and Figure 14, at an opening ratio of 10, for example, the conventional foam system fails to initiate the shielding effect in small-opening fractures, even after injecting up to 27.6 PV, underscoring its inadequate stability to counteract the prevailing influence of wide fractures under high opening ratio conditions. This limitation reflects the restricted capacity of conventional foam to generate sufficient flow resistance. By contrast, the polymer-enhanced foam system, upon injecting 25.8 PV, achieves a maximum diversion rate in small-opening fractures of less than 10%. While this indicates an improvement in stability over conventional foam, it remains insufficient to fully mobilize fluid within narrow fractures. In stark contrast, the gel-enhanced foam system, with an injection of 24 PV, attains a maximum diversion rate of 12.8% in small-opening fractures, demonstrating superior performance.
As shown in Figure 12, Figure 13 and Figure 14, where the injection amount of foam marked with an asterisk, as the fracture opening ratio—defined as the ratio of wide to narrow fracture widths—increases, the foam injection volume required to achieve the peak diversion rate in small-opening fractures also rises, while the maximum liquid output from these fractures trends downward. This pattern arises because an elevated opening ratio amplifies the dominant role of wide fractures in oil–water migration, enhancing their capacity to attract and transport fluids. Conversely, narrow fractures, constrained by their relatively lower permeability, experience a more pronounced shielding effect. Specifically, a higher opening ratio intensifies the preferential flow channel effect of wide fractures, necessitating greater resistance to be overcome before foam can effectively penetrate narrow fractures. Simultaneously, the intensified “competitive” fluid adsorption by wide fractures restricts the maximum liquid output from narrow fractures, leading to its progressive reduction.
The gel foam system, bolstered by its high-density gel network, markedly enhances liquid film viscosity and flow resistance, enabling more effective sealing. This capability allows foam to infiltrate small-opening fractures earlier and more efficiently. Thus, in complex fracture systems, foam stability emerges as a critical determinant of mobility control efficacy and a key factor in optimizing the recovery of residual oil from narrow fractures.
As shown in Figure 15, by documenting the flow patterns of foam within fractures during the foam mobility control process, distinct behaviors are observed across fractures of varying widths. In large-opening fractures, foam occupies a substantial spatial volume and maintains a higher gas volume fraction, resulting in a more compact structure.
Conversely, as foam transitions into narrower fractures, the liquid film becomes more susceptible to disruption due to increased resistance. This vulnerability compromises foam stability, leading to an increase in foam particle size within the fracture and a subsequent deterioration of its plugging capacity. The heightened resistance in narrower fractures exacerbates the breakdown of the liquid film, destabilizing the foam and reducing its effectiveness as a mobility control agent.
In fractures with an opening ratio of 10, only polymer foam and gel foam demonstrate the ability to penetrate the 0.2 mm fracture. However, the polymer foam exhibits limited infiltration, penetrating only partially and suffering from significant dehydration. With continued injection, this foam fails to mobilize additional crude oil, indicating a constrained mobility control capability. In contrast, conventional foam, due to its inherently poor mobility control performance, is unable to flow into the 0.2 mm fracture altogether. Across the 0.6 mm, 1.0 mm, and 2.0 mm fractures, gel foam consistently displays a denser structure compared to both conventional and polymer foams, underscoring its superior performance.
The enhanced mobility control characteristics of gel foam are evident in its ability to maintain a more uniform and stable foam particle size distribution. This uniformity, coupled with its robust structural stability, enables gel foam to effectively navigate and seal fractures of varying widths. Consequently, gel foam outperforms both conventional and polymer foams in terms of mobility control efficiency, demonstrating greater adaptability and effectiveness in managing flow within complex fracture systems.

4. Conclusions

Insights derived from the foam stability experiments and foam mobility control assessments conducted in flat fracture models have yielded the following conclusions.
(1)
Gel foam sustains a substantial liquid film thickness for up to 120 min. This durability is attributable to the three-dimensional network structure established post-gelation, which confers superior foam stability compared to the other two foam systems evaluated.
(2)
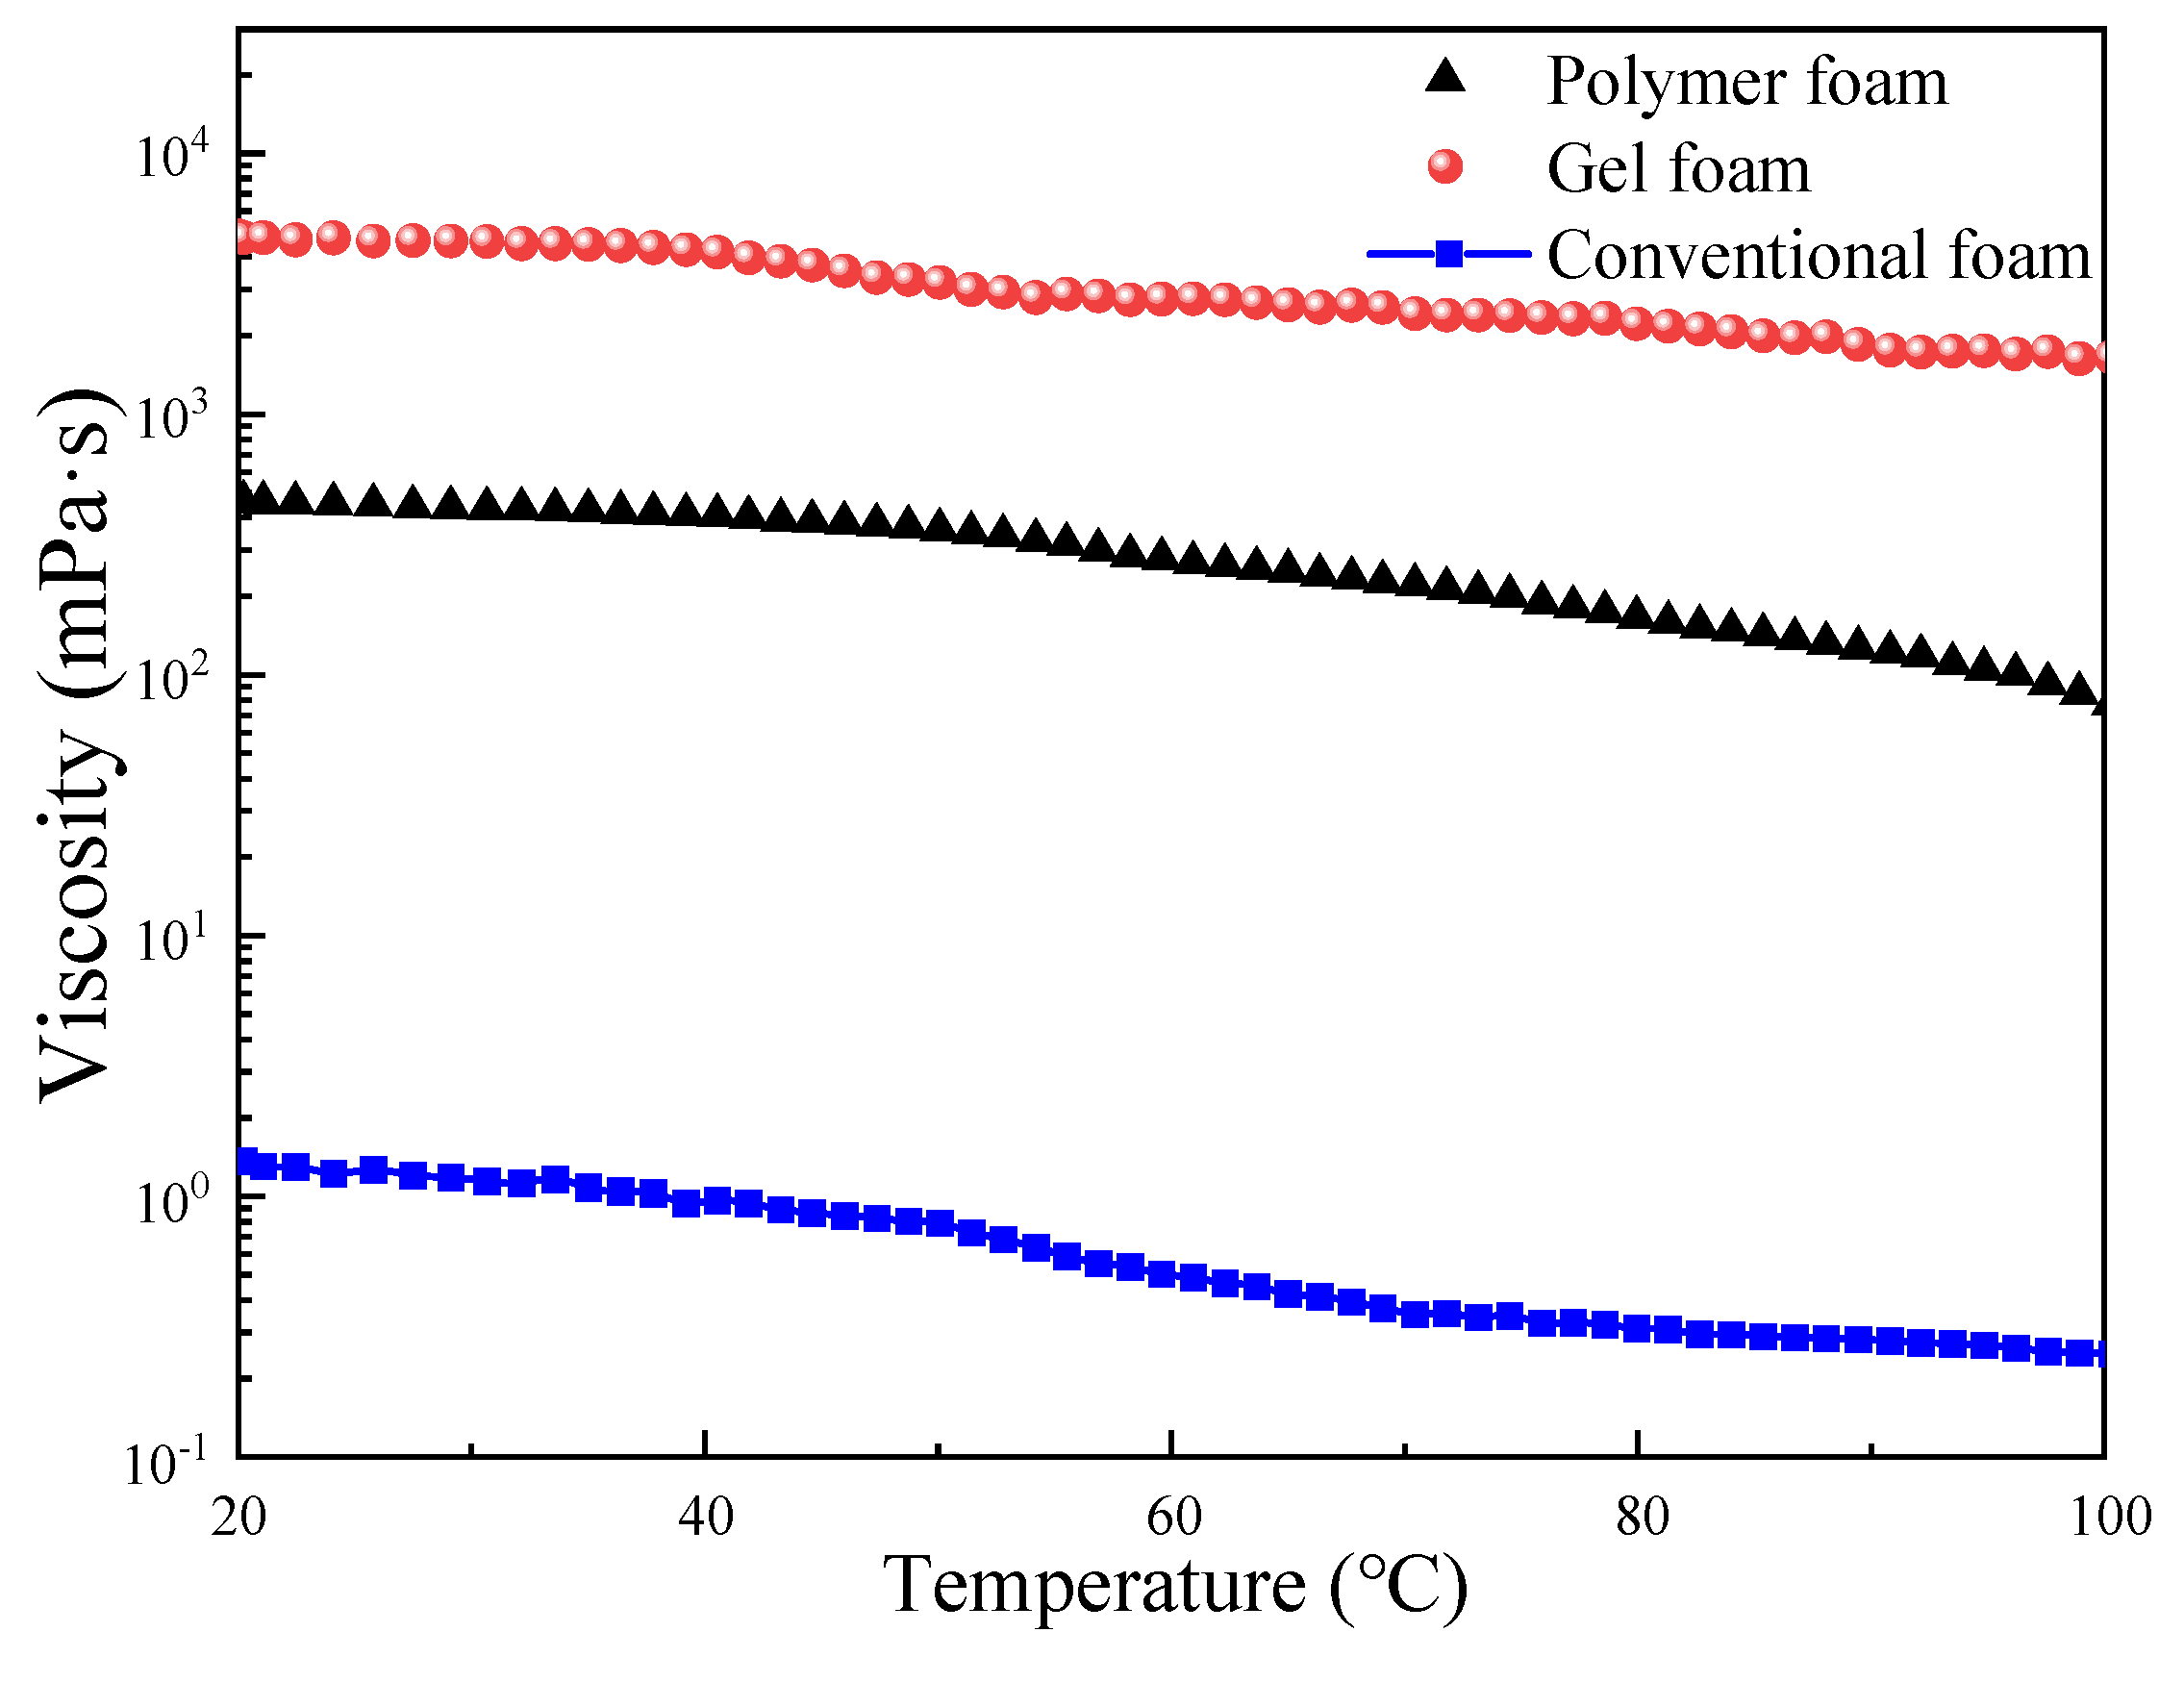
As salinity increases, the viscosity of the base liquid in conventional foam exhibits minimal variation. In contrast, the viscosity of the polymer foam base liquid undergoes a substantial decline at high salinity, dropping below 100 mPa·s, while the viscosity of the gel foam base liquid initially increases before subsequently decreasing. Furthermore, at elevated temperatures, the base liquid viscosity of all three foam systems demonstrates a pronounced reduction.
(3)
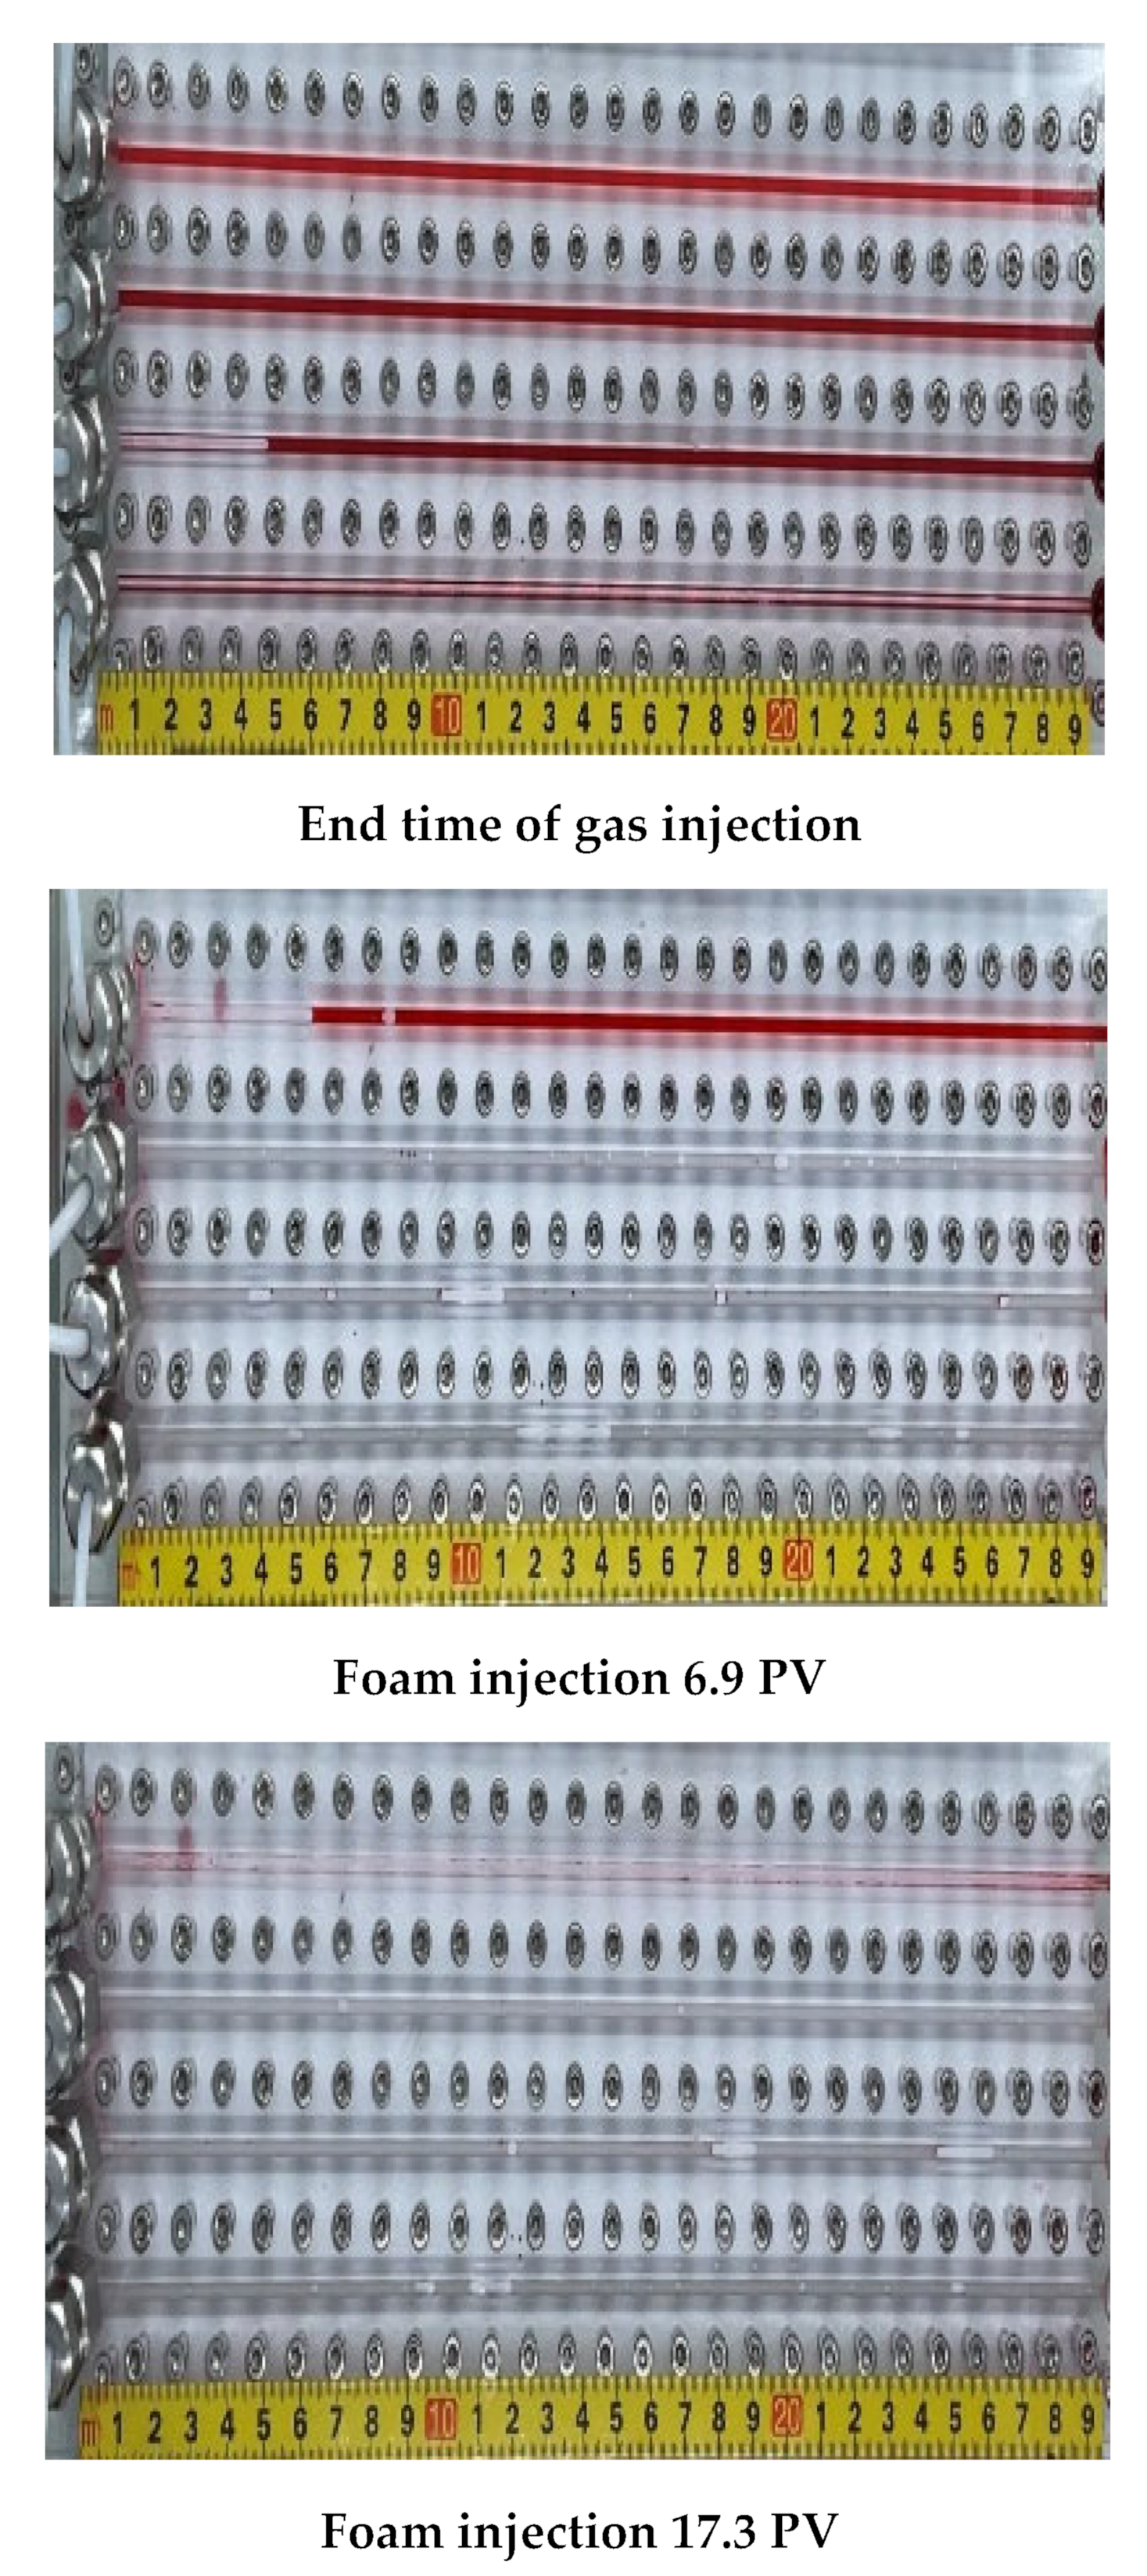
Greater foam stability corresponds to enhanced mobility control capability. At a fracture opening ratio of 10, conventional foam fails to initiate flow in small fractures. In contrast, polymer-enhanced foam, with an injection volume of 25.8 pore volumes, achieves a maximum diversion rate in small-opening fractures of less than 10%. Gel foam, however, with an injection of 24 PV, attains a maximum diversion rate of 12.8% in small-opening fractures.
(4)
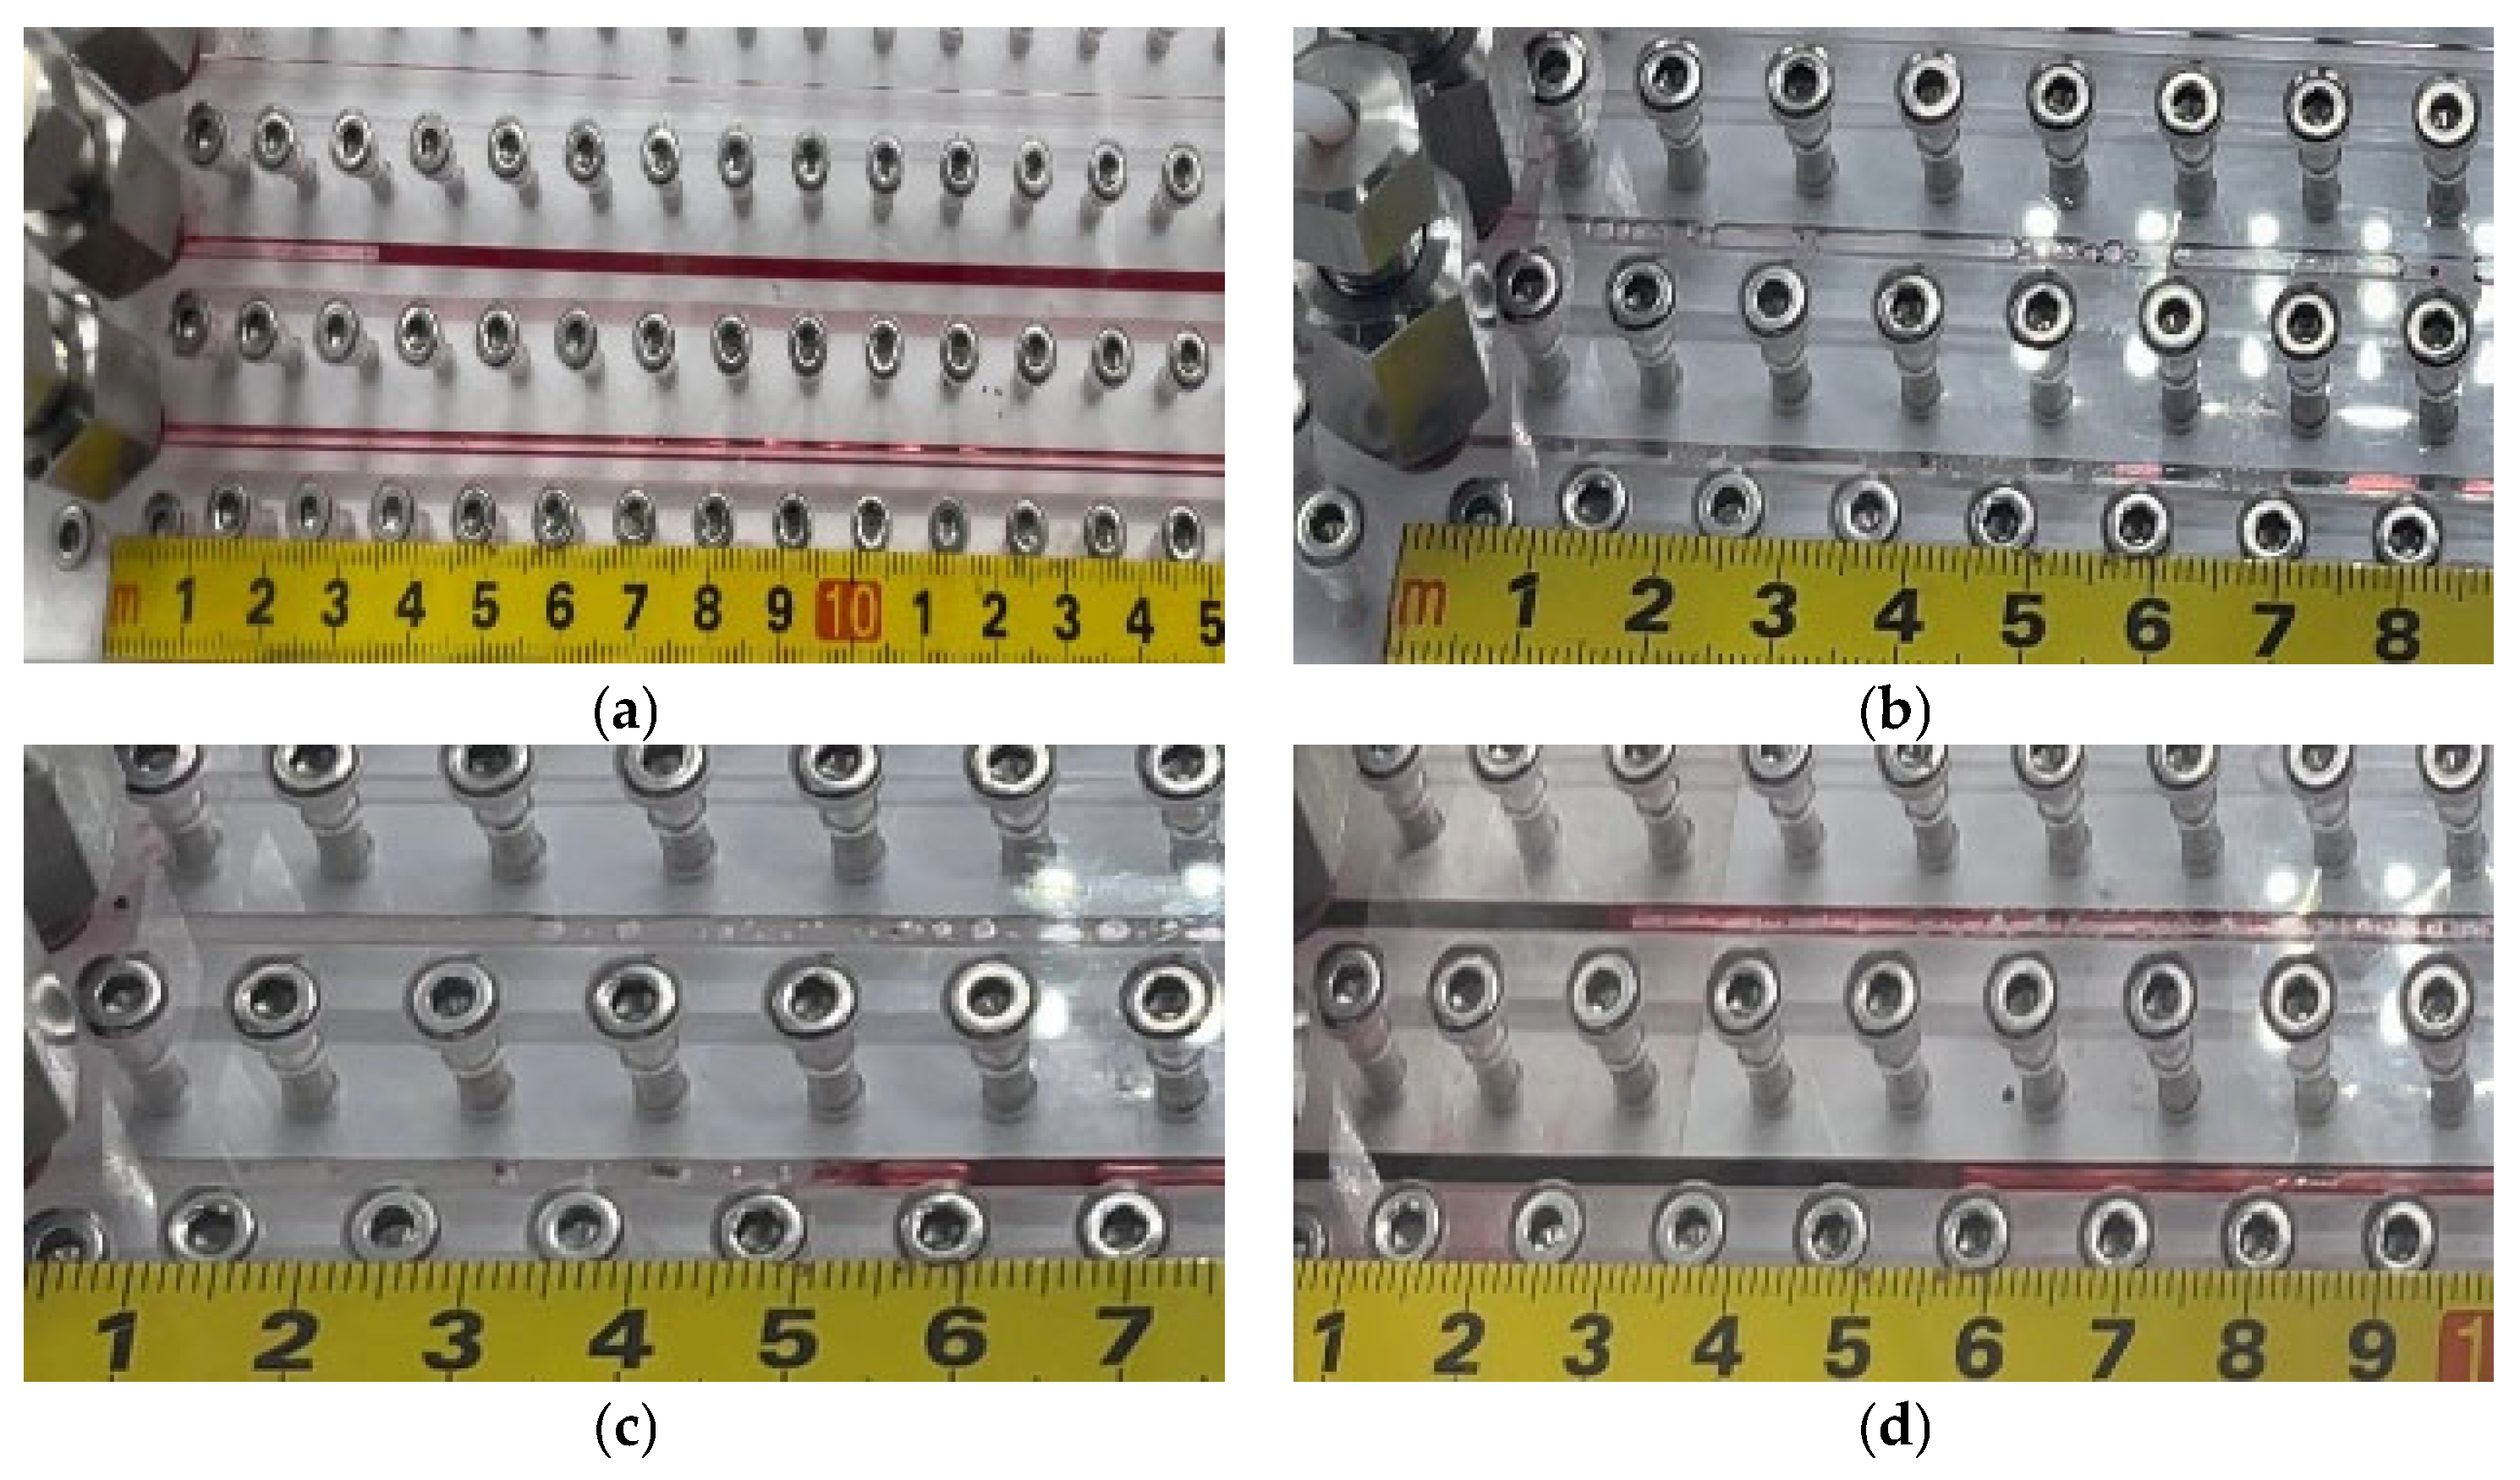
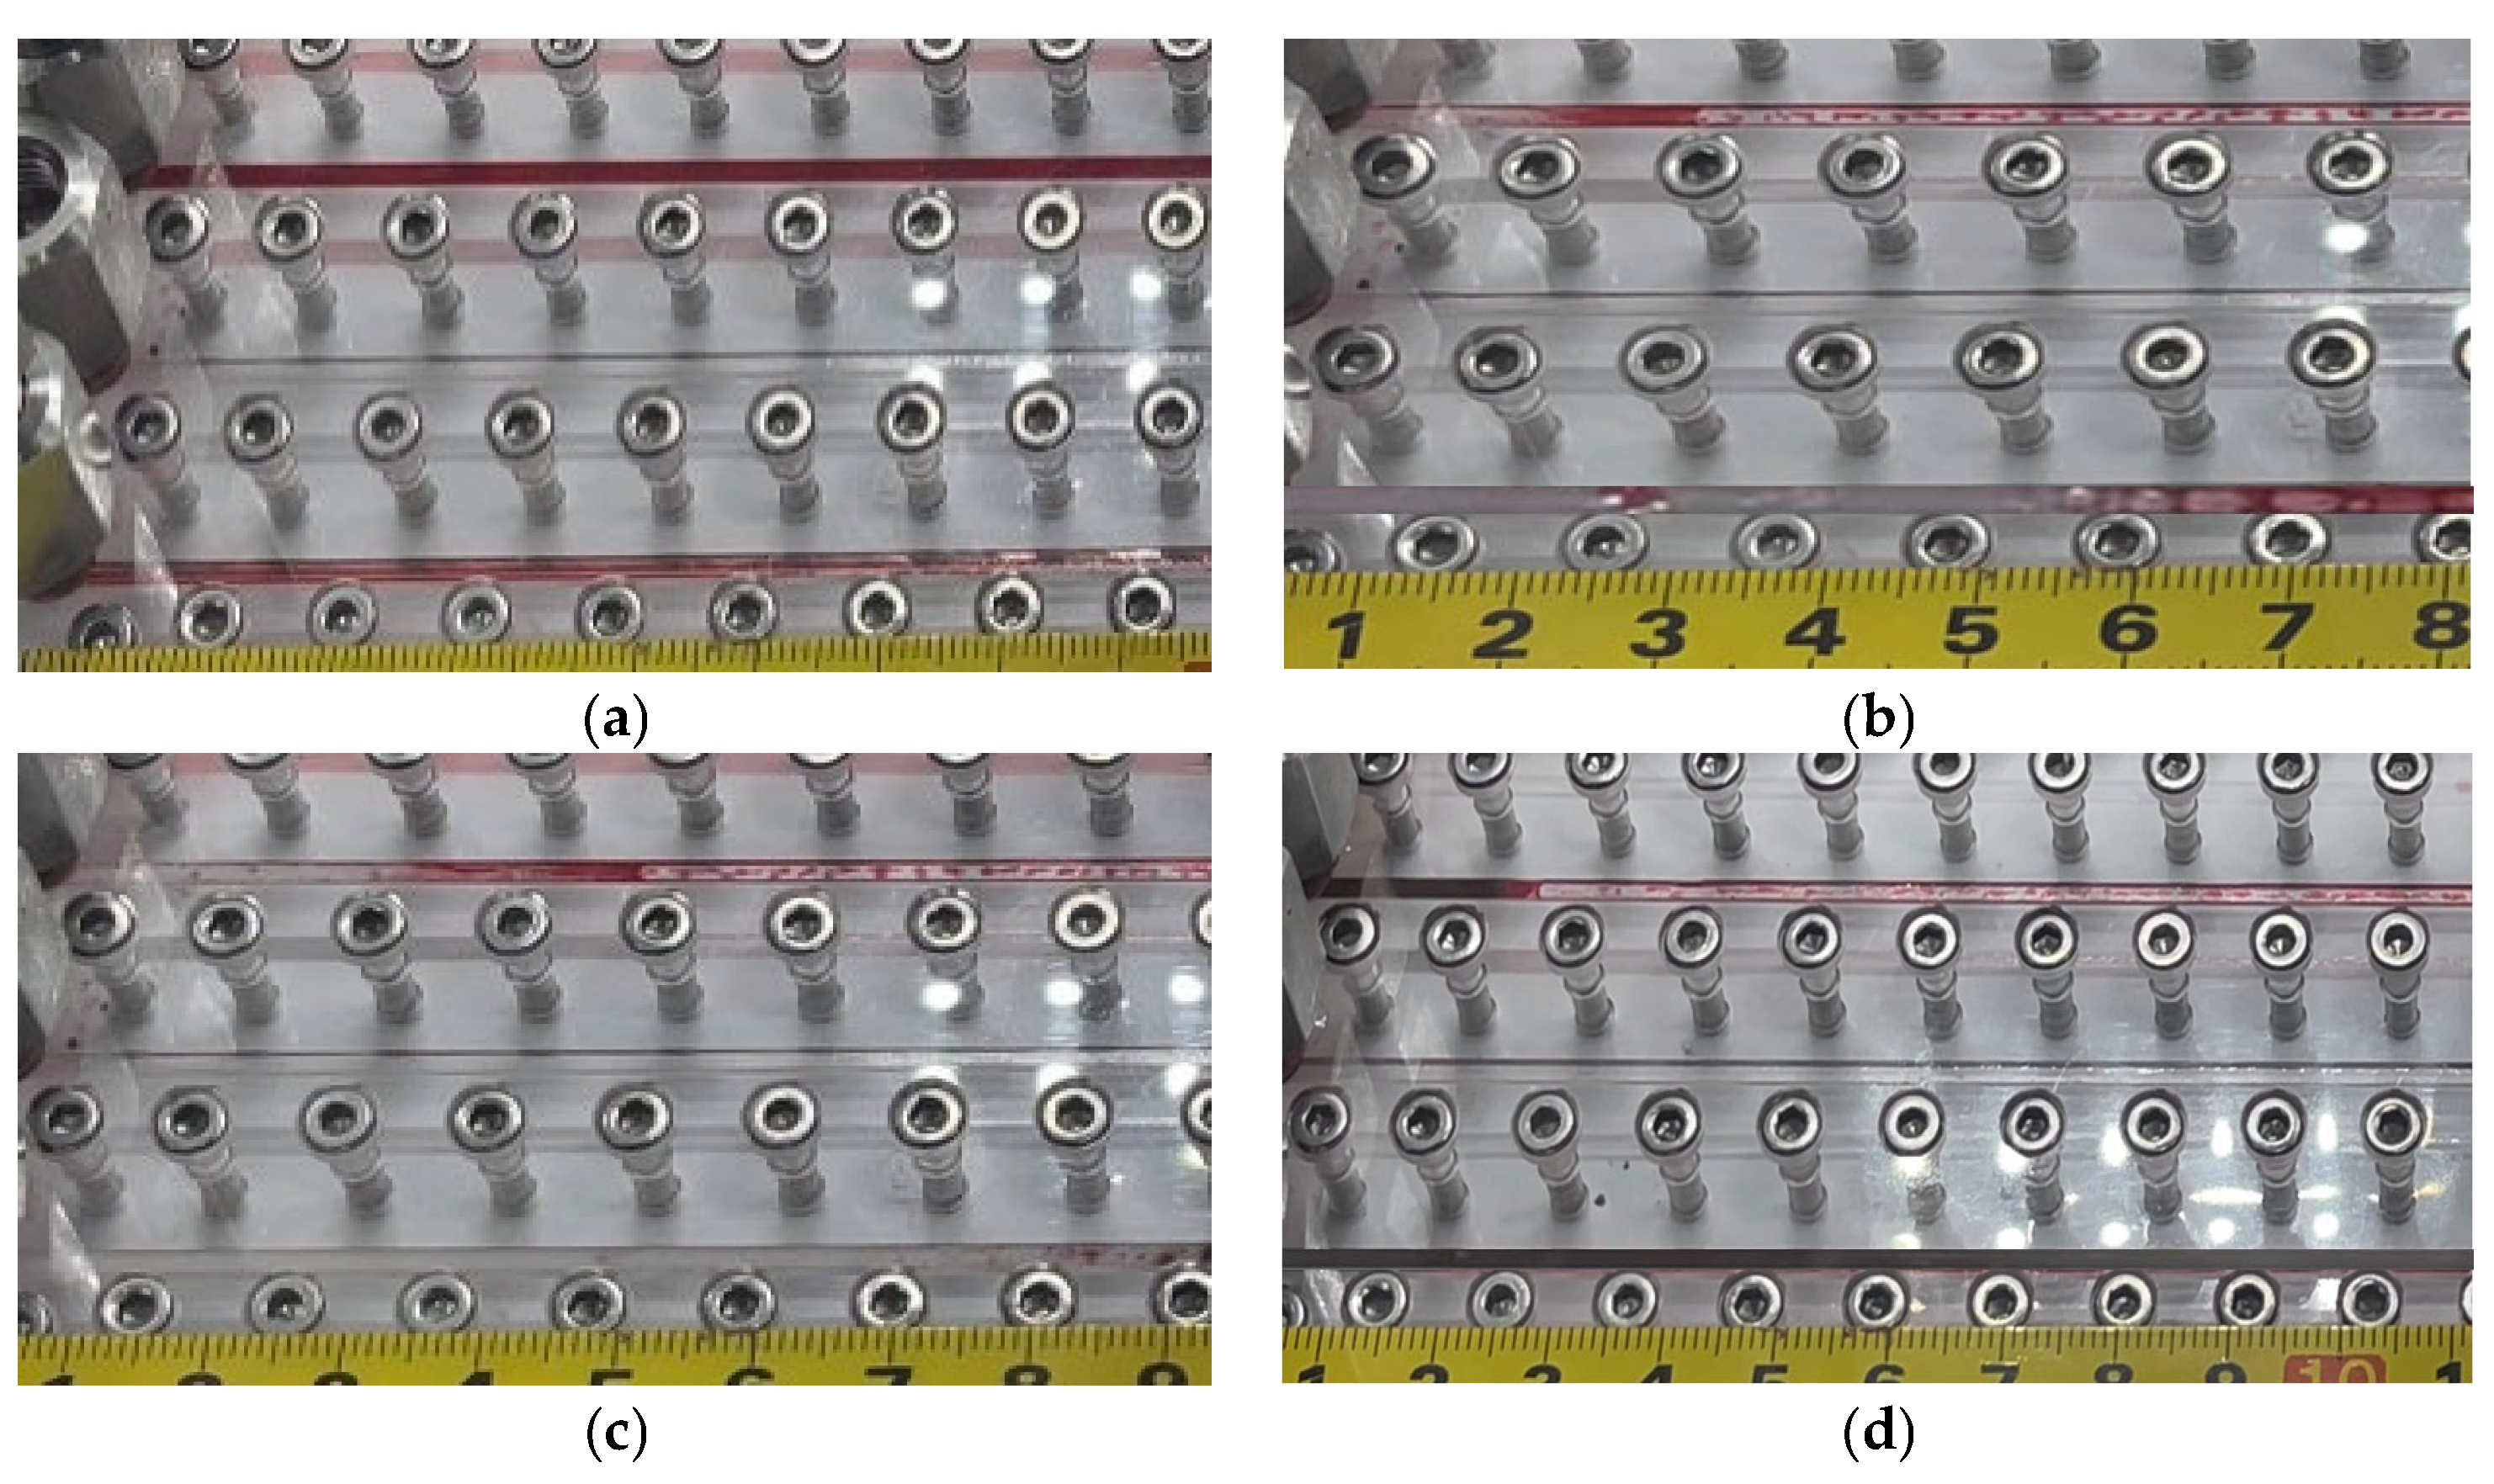
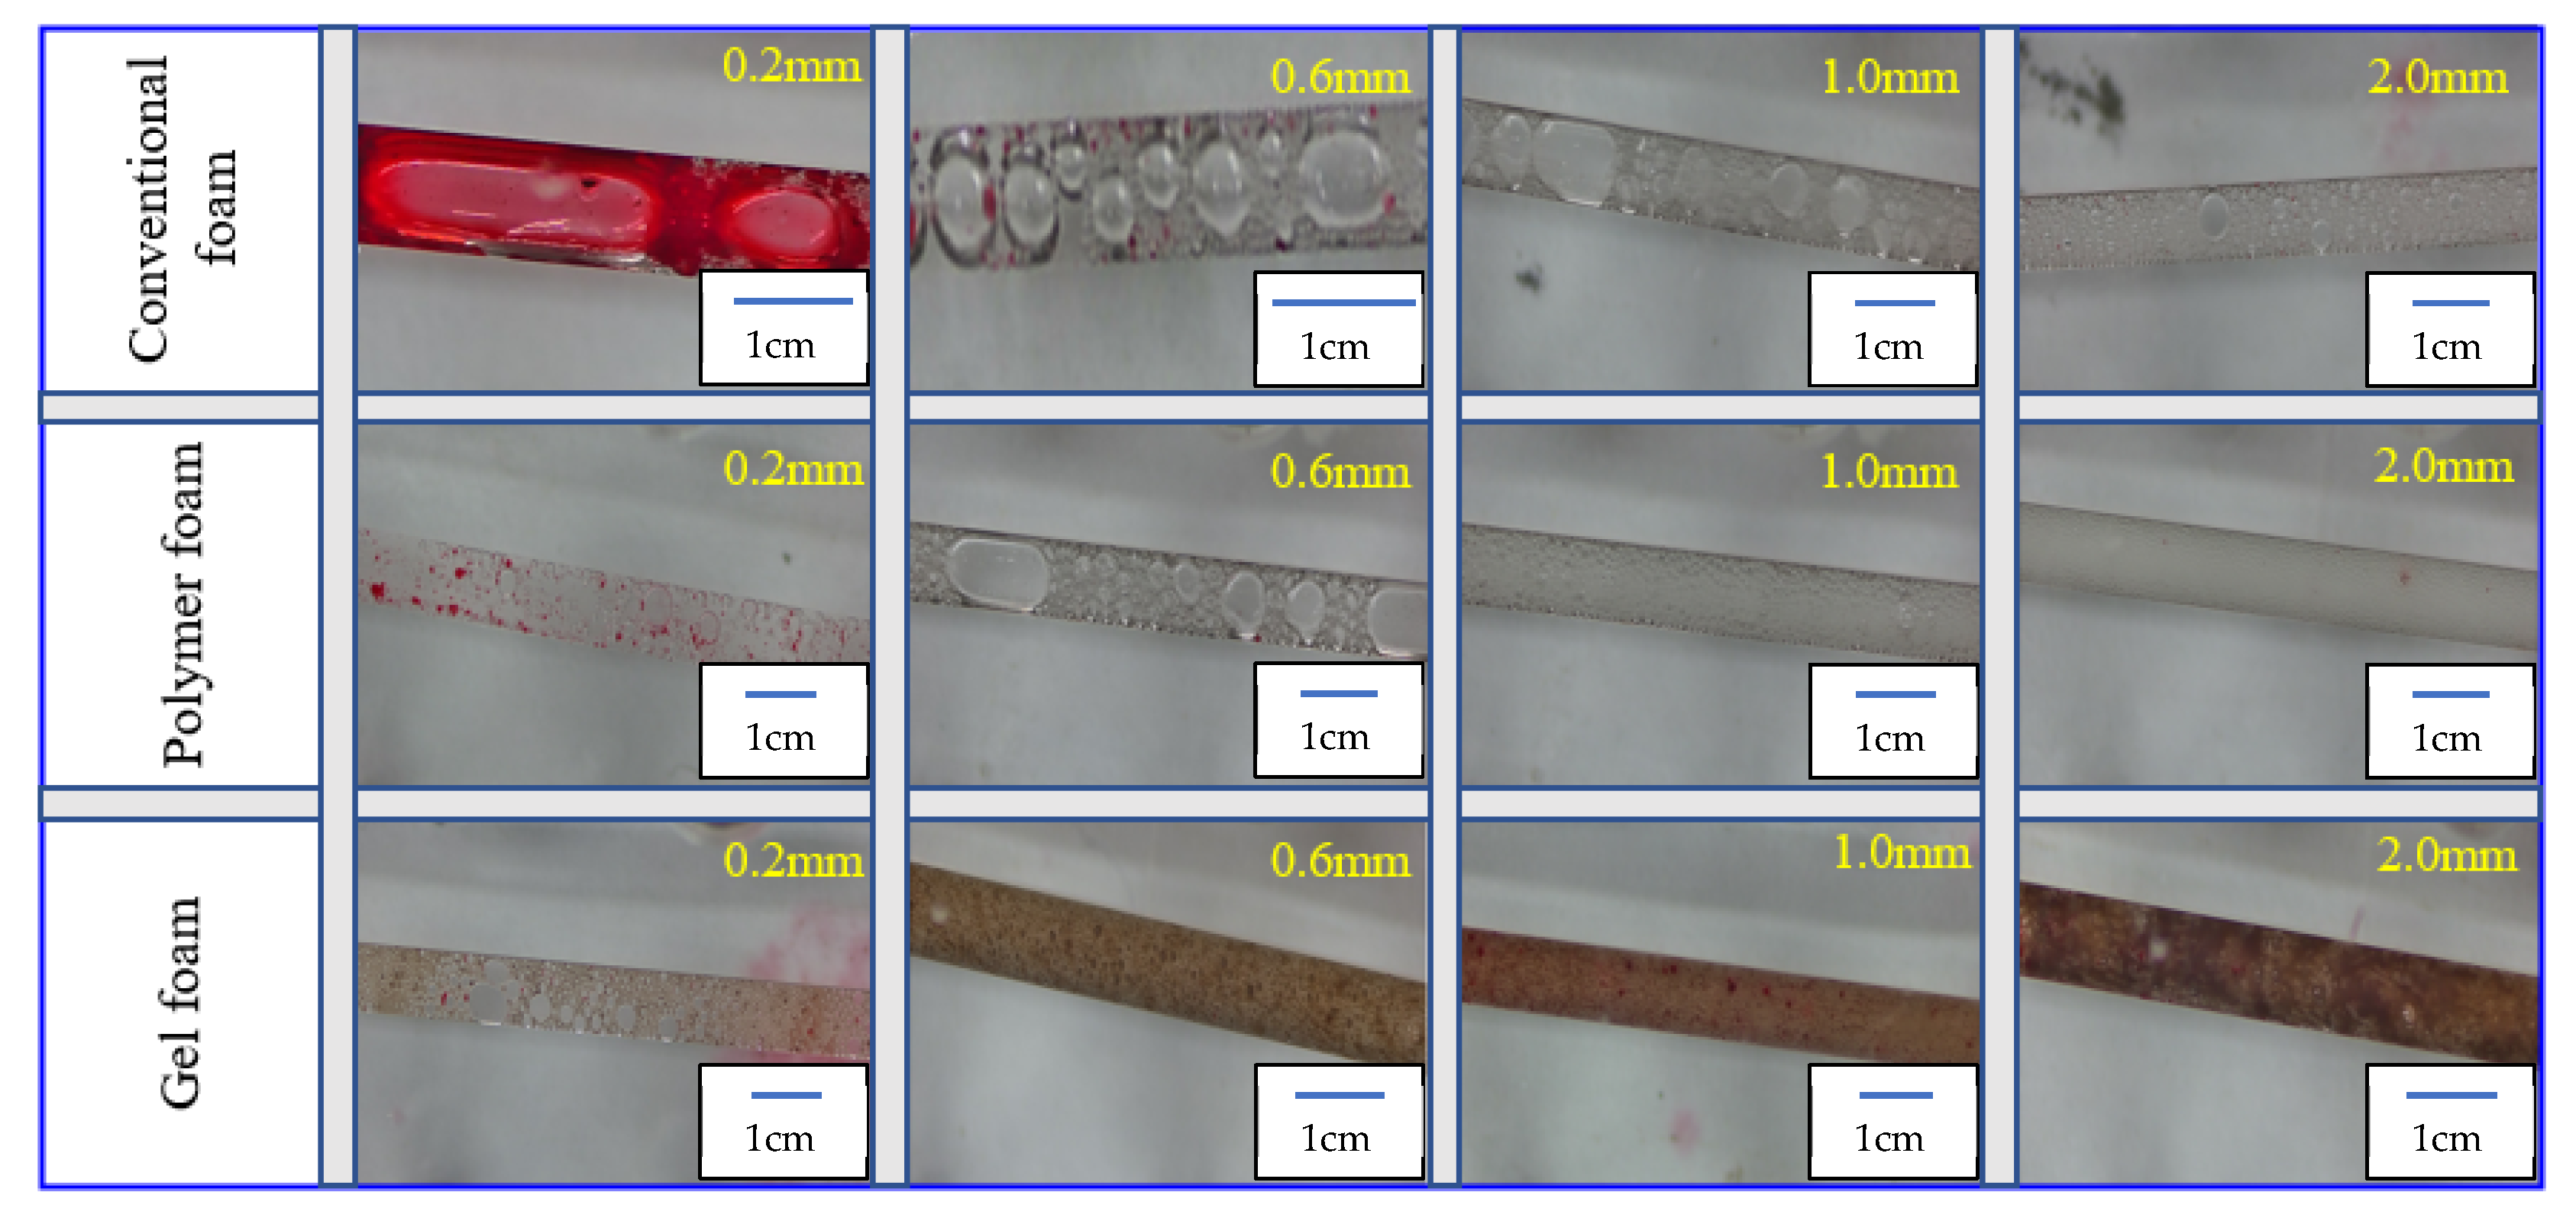
Foam between 0.2 mm and 0.6 mm fractures is more susceptible to disruption by resistance forces. This vulnerability results in an increase in foam particle size within these fractures, consequently diminishing its plugging efficacy. In contrast, gel foam exhibits superior mobility control characteristics, characterized by a more uniform and stable foam particle size distribution.

Author Contributions

Conceptualization, X.L. and Y.F.; Methodology, X.L., Y.F. and J.W.; Validation, J.W.; Formal analysis, X.L., Y.F., B.W. and J.W.; Writing—original draft, B.W. and Y.X.; Writing—review & editing, Y.X.; Supervision, B.L. and Z.X.; Project administration, B.L. All authors have read and agreed to the published version of the manuscript.

Funding

This research received no external funding.

Data Availability Statement

The original contributions presented in this study are included in the article. Further inquiries can be directed to the corresponding authors.

Acknowledgments

We are grateful to the Shandong Engineering Research Center of Carbon Dioxide Utilization and Storage and the UPC-COSL Joint Laboratory on Heavy Oil Recovery for their assistance with the experimental research.

Conflicts of Interest

Authors Xiongwei Liu, Yibo Feng and Jianhai Wang were employed by the Sinopec Northwest Company of China Petroleum and Chemical Corporation and Sinopec Key Laboratory of Enhanced Oil Recovery for Fractured Vuggy Reservoirs. The remaining authors declare that the research was conducted in the absence of any commercial or financial relationships that could be construed as a potential conflict of interest.

References

  1. Song, Z.J.; Yang, L.; Hou, J.R.; Wang, Y. Study on the characteristics of oil-water two-phase flow in fractures of fractured vuggy reservoirs. J. Xi’an Pet. Univ. (Nat. Sci. Ed.) 2018, 33, 49–54. [Google Scholar]
  2. Chen, Z.H.; Liu, C.H.; Yang, J.; Huang, G.; Lu, X. Development strategies for fractured vuggy carbonate oil and gas reservoirs: A case study of the Ordovician reservoir in the main development area of Tahe Oilfield. Petrol. Geol. Oilfield Dev. 2005, 26, 623–629. [Google Scholar]
  3. Han, G.H.; Qi, L.X.; Li, Z.J.; Fan, Z.J. Prediction technology for Ordovician carbonate fractured vuggy in Tahe Oilfield. Petrol. Geol. Oilfield Dev. 2006, 27, 860–870+878. [Google Scholar]
  4. Tang, H.; Xie, L.; Su, B.; Han, T. Fracture and cavity characteristics of Ordovician carbonate reservoirs in Tazhong area. J. China Univ. Pet. (Nat. Sci. Ed.) 2013, 37, 7–13. [Google Scholar]
  5. Guo, P.; Li, S.L.; Du, Z.M.; Yang, X.-F.; Liu, J.-Y. Evaluation of gas injection for enhanced oil recovery in low-permeability reservoirs. J. Southwest Pet. Inst. 2002, 24, 46–50+2. [Google Scholar]
  6. Guo, W.K.; Liao, G.Z.; Han, P.H. Techniques for Enhanced Oil Recovery by Gas Injection; Petroleum Industry Press: Beijing, China, 2003. [Google Scholar]
  7. Li, Y.H.; Li, J.L. Fractures and classified hierarchical modeling of carbonate fractured vuggy reservoirs. Pet. Explor. Dev. 2016, 43, 655–662. [Google Scholar] [CrossRef]
  8. Yang, Z.H.; Luo, Z.Y.; Lin, M.Q.; Lv, Q.C.; Li, X.C. Construction of a temperature-resistant foam gel system to improve CO2 flooding efficiency in low-permeability reservoirs. Oilfield Chem. 2020, 37, 86–92. [Google Scholar]
  9. Li, Z.M.; Li, B.F.; Xu, Y.H.; Lin, R.Y.; Shang, Z.H. Study on foam diversion characteristics and its application. J. Xi’an Pet. Univ. (Nat. Sci. Ed.) 2007, 116–118. [Google Scholar]
  10. Meng, F.L. Study on Water Production Patterns and Water Shutoff Strategies in Carbonate Reservoirs. Ph.D. Thesis, China University of Petroleum (Beijing), Beijing, China, 2019. [Google Scholar]
  11. Lu, X.G.; He, X.; Cao, B.; Wang, X.; Gao, J.; Liu, Y.; Cao, W. Mechanism, countermeasures, and practical effects of mobility inversion in polymer flooding. Acta Pet. Sin. 2023, 44, 962–974. [Google Scholar]
  12. Chen, J.; Liu, T.J.; Wu, H.R.; Hou, G.G.; Li, Z.; Kang, W.L. Screening and performance evaluation of gel/foam combined flooding system for high-permeability reservoirs. In Proceedings of the 16th Colloid and Interface Chemistry Conference of the Chinese Chemical Society—Session 6: Applied Colloid and Interface Chemistry, Qingdao, China, 25–28 July 2017; pp. 117–118. [Google Scholar]
  13. Li, Y. Development theory and methods for carbonate fractured vuggy in Tahe Oilfield. Pet. Rep. 2013, 34, 115–121. [Google Scholar]
  14. Wassmuth, F.R.; Hodgins, L.A.; Schramm, L.L.; Kutay, S.M. Screening and coreflood testing of gel foams to control excessive gas production in oil wells. In SPE Improved Oil Recovery Conference; SPE: Calgary, AB, Canada, 2000. [Google Scholar]
  15. Dai, Q.; Zhao, W.S.; Fan, C.S.; Liu, J.M.; Zhu, L.L.; Wu, X.Y. Rheological properties of foam gel mobility control system. Oil Gas Field Surf. Eng. 2010, 29, 15–16. [Google Scholar]
  16. Feng, X. Optimization and Interface Property Study of Gel Foam Water Shutoff System for Thin-Layer Bottom-Water Reservoirs. Ph.D. Thesis, China University of Petroleum (East China), Qingdao, China, 2014. [Google Scholar]
  17. Li, S.; Li, Z.; Li, B. Experimental study on foamed gel flow in porous media. J. Porous Media 2015, 18, 519–536. [Google Scholar] [CrossRef]
  18. Jin, J.F.; Wang, Y.; Wei, M.; Ma, H.; Wang, K. Coreflooding and pore-scale visualization of foamed gel flowed in porous network media. J. Dispers. Sci. Technol. 2016, 37, 1436–1443. [Google Scholar] [CrossRef]
  19. Lai, N.; Zhao, J.; Wang, J.; Gao, L.; He, Q. Influence of external conditions on the stability of inorganic gel foam and exploration of the mechanism of action. J. Mol. Liq. 2023, 369, 120873. [Google Scholar] [CrossRef]
  20. Du, R.F.; Zhang, Y.B.; Ge, S.; Li, W.; Dong, H.; Shan, Y.; Bian, Y. Optimization and laboratory evaluation of gel foam system for Weizhou high-permeability reservoir. Contemp. Chem. Ind. 2024, 53, 1519–1524. [Google Scholar]
  21. Moumni, Y.; Msaddek, M.H.; Chermiti, A.; Chenini, I.; Mercier, E.; Dlala, M. Quantitative analysis of fractured carbonate reservoir and hydrodynamic implications: Case study of Horchane-Braga basin (central Tunisia). J. Afr. Earth Sci. 2016, 124, 311–322. [Google Scholar] [CrossRef]
  22. Chen, L.M.; Kang, Y.S.; Zhu, J.C. Processing and information extraction of oil migration experimental images in fracture media. J. Pet. Univ. (Nat. Sci. Ed.) 2000, 115–116+122–133. [Google Scholar]
  23. Kang, Y.S.; Guo, Q.J.; Zhu, J.C.; Chen, L.M.; Zeng, L.B. Experimental study on oil migration simulation in fracture media. Acta Pet. Sin. 2003, 24, 44–47. [Google Scholar]
  24. Liu, Z.C.; Li, J.L.; Lü, C.Y.; Tan, Z.L.; Luo, M. Experimental study on the influence of storage space types on water cut in fractured vuggy reservoirs. Acta Pet. Sin. 2009, 30, 271–274. [Google Scholar]
  25. Long, Q.L. Study on Water Shutoff Mechanism in Fractured Vuggy Carbonate Reservoirs of Tahe Oilfield. Ph.D. Thesis, China University of Geosciences (Beijing), Beijing, China, 2009. [Google Scholar]
  26. Li, A.F.; Zhang, D.; Yao, J. Physical simulation of water injection development in fractured vuggy reservoirs. J. China Univ. Pet. (Nat. Sci. Ed.) 2012, 36, 130–135. [Google Scholar]
  27. Liu, Z.C.; Wang, Y.; Hou, J.R. Feasibility study on foam-assisted gas flooding technology for enhancing oil recovery in fractured vuggy reservoirs. J. China Univ. Pet. (Nat. Sci. Ed.) 2018, 42, 113–118. [Google Scholar]
Figure 1. Schematic diagram of the flat slab fracture model.
Processes 13 01527 g001
Figure 2. Schematic diagram of the experimental setup for parallel fracture foam mobility control.
Processes 13 01527 g002
Figure 3. (a,b) Viscosity changes in the base liquid of conventional foam and polymer foam under different salinity. (c) Viscosity changes in gel foam under different salinities.
Processes 13 01527 g003
Figure 4. Viscosity of conventional foam and polymer foam base liquid and gel foam changes with temperature (salinity is 0 mg/L).
Processes 13 01527 g004
Figure 5. Morphological transformations of the following three foam systems over time, observed at a 50× magnification: conventional foam, polymer foam, and gel foam. Panels (ac) depict the morphological transformations in conventional foam at the initial time, 5 min, and 10 min, respectively. Panels (df) depict the morphological transformations in polymer foam at the initial time, 30 min, and 60 min, respectively. Lastly, panels (gi) depict the morphological transformations in gel foam at the initial time, 60 min, and 120 min.
Processes 13 01527 g005
Figure 6. Shielding effect of parallel fracture gas injection.
Processes 13 01527 g006
Figure 7. Parallel fracture foam mobility control.
Processes 13 01527 g007
Figure 8. The foam mobility control experiment with the parallel connection of 2 mm and 1 mm fractures and an opening ratio of 2 is selected. (a) End time of gas injection, (b) conventional foam injection 3.6 PV, (c) polymer foam injection 3 PV, and (d) gel foam injection 2.4 PV.
Processes 13 01527 g008
Figure 9. The foam mobility control experiment with the parallel connection of 2 mm and 0.6 mm fractures and an opening ratio of 3.3 is selected. (a) End time of gas injection, (b) conventional foam injection 6.6 PV, (c) polymer foam injection 4.8 PV, and (d) gel foam injection 4.2 PV.
Processes 13 01527 g009
Figure 10. The foam mobility control experiment with the parallel connection of 1 mm and 0.2 mm fractures and an opening ratio of 5 is selected. (a) End time of gas injection, (b) conventional foam injection 27.6 PV, (c) polymer foam injection 19.2 PV, and (d) gel foam injection 13.8 PV.
Processes 13 01527 g010
Figure 11. The foam mobility control experiment with the parallel connection of 2 mm and 0.2 mm fractures and an opening ratio of 10 is selected. (a) End time of gas injection, (b) conventional foam injection 27.6 PV, (c) polymer foam injection 24.6 PV, and (d) gel foam injection 20.4 PV.
Processes 13 01527 g011
Figure 12. Schematic diagram of diversion of conventional foam parallel fracture mobility control and flooding under different opening ratios: (a) opening ratio is 2; (b) opening ratio is 3.3.
Processes 13 01527 g012
Figure 13. Polymer foam parallel fracture mobility control and displacement diversion diagram under different opening ratios: (a) opening ratio is 2; (b) opening ratio is 3.3; (c) opening ratio is 5; and (d) opening ratio is 10.
Processes 13 01527 g013
Figure 14. Schematic diagram of gel foam parallel fracture mobility control and displacement diversion under different opening ratios: (a) opening ratio is 2; (b) opening ratio is 3.3; (c) opening ratio is 5; and (d) opening ratio is 10.
Processes 13 01527 g014
Figure 15. Foam morphology of the three foam systems in different opening fractures.
Processes 13 01527 g015
Table 1. Foaming volume and liquid evolution half-life of different foam systems.
Foam SystemFoam Volume/mLHalf-Life/s
Conventional foam435476
Polymer foam2806156
Gel foam (after gelation)165>604,800
Disclaimer/Publisher’s Note: The statements, opinions and data contained in all publications are solely those of the individual author(s) and contributor(s) and not of MDPI and/or the editor(s). MDPI and/or the editor(s) disclaim responsibility for any injury to people or property resulting from any ideas, methods, instructions or products referred to in the content.

