Article

Study of Mechanisms and Protective Strategies for Polymer-Containing Wastewater Reinjection in Sandstone Reservoirs

1
School of Petroleum Engineering, Changjiang University, Wuhan 430100, China
2
Key Laboratory of Drilling and Production Engineering for Oil and Gas, Yangtze University, Wuhan 430100, China
3
Department of Petroleum Engineering, China University of Petroleum (East China), Qingdao 266580, China
*
Author to whom correspondence should be addressed.
Processes 2025, 13(5), 1511; https://doi.org/10.3390/pr13051511
Submission received: 10 April 2025 / Revised: 8 May 2025 / Accepted: 8 May 2025 / Published: 14 May 2025
(This article belongs to the Special Issue Recent Developments in Enhanced Oil Recovery (EOR) Processes)

Abstract

:
Wastewater reinjection is an important measure for balancing the sustainable development of petroleum resources with environmental protection. However, the polymer-containing wastewater generated after polymer injection presents challenges such as reservoir damage and waterflooded zone identification in oilfields. To address this, this study systematically examined the impact of injection water with varying salinities on the flow characteristics and electrical responses of low-permeability reservoirs, based on rock-electrical and multiphase displacement experiments. Additionally, this study analyzed the factors influencing the damage to reservoirs during polymer-containing wastewater reinjection. Mass spectrometry, chemical compatibility tests, and SEM-based micro-characterization techniques were employed to reveal the micro-mechanisms of reservoir damage during the reinjection process, and corresponding protective measures were proposed. The results indicated the following: (1) The salinity of injected water significantly influences the electrical response characteristics of the reservoir. When low-salinity wastewater is injected, the resistivity–saturation curve exhibits a concave shape, whereas high-salinity wastewater results in a linear and monotonically increasing trend. (2) Significant changes were observed in the pore-throat radius distribution before and after displacement experiments. The average frequency of throats within the 0.5–2.5 µm range increased by 1.894%, while that for the 2.5–5.5 µm range decreased by 2.073%. In contrast, changes in the pore radius distribution were relatively minor. Both the experimental and characterization results suggest that pore-throat damage is the primary form of reservoir impairment following wastewater reinjection. (3) To mitigate formation damage during wastewater reinjection, a combined physical–chemical deblocking strategy was proposed. First, multi-stage precision filtration would be employed to remove suspended solids and oil contaminants. Then, a mildly acidic organic-acid-based compound would be used to inhibit the precipitation of metal ions and dissolve the in situ blockage within the core. This integrated approach would effectively alleviate the reservoir damage associated with wastewater reinjection.

1. Introduction

China accounts for a significant proportion of global waterflooding in oilfield development, with approximately 90% of crude oil reserves relying on this method [1,2]. Currently, most domestic oilfields have entered the high-water-cut development stage, exhibiting complex characteristics such as highly dense well networks, interbedded reservoir layers, and multi-directional water breakthrough [3,4,5]. Based on this situation, major oilfields have systematically conducted research on waterflooding dynamic characteristics, residual oil distribution patterns, waterflooded zone identification technologies, dynamic evaluation methods, and protective measures. Wastewater reinjection, as the core method for handling production wastewater in oilfields, not only enables the reduction and resource utilization of wastewater, but also complies with environmental protection requirements, making it the most economically efficient disposal method currently available. However, with the widespread application of polymer-flooding technology, the presence of high concentrations of polymers in the produced fluids has significantly increased the difficulty of treating production wastewater. This type of polymer-containing wastewater is characterized by a strong viscoelasticity, a high stability, and an outstanding oil-carrying capacity [6,7]. During reinjection, it is prone to causing issues such as pore-throat adsorption blocking, permeability reductions, and an increased injection pressure [8,9]. Therefore, in the process of reinjecting polymer-containing wastewater, how to accurately identify dynamic changes in waterflooded zones, optimize water quality control techniques to reduce reservoir damage risks, and establish effective pore-throat blockage early-warning and prevention systems have become key technical bottlenecks in the sustainable development of high-water-cut oilfields.
The current techniques for identifying waterflooded zones primarily rely on an integrated analysis of well-logging responses, core experiments, and dynamic monitoring data [10,11,12]. Among these, resistivity—a key parameter for evaluating reservoir saturation—is significantly influenced by rock wettability [13,14]. Rock-electrical experiments, which measure the variations in the electrical conductivity and resistivity of rocks under the influence of an electric field, can provide the electrical response characteristics of reservoir rocks under different injection water conditions. This is crucial for evaluating the waterflooding efficiency, identifying waterflooded zones, monitoring porosity changes, and understanding the impact of injection water with varying salinities on reservoir permeability. Especially during polymer-flooding and wastewater reinjection processes, rock-electrical experiments can effectively identify reservoir damage and its micro-mechanisms caused by water quality changes. Studies have shown that the electrical conductivity of low-permeability oil-wet sandstones is governed by both wettability and pore structure, providing an essential theoretical foundation for further research [15,16]. Notably, during produced water reinjection, interactions between the injected water and formation fluids can lead to the formation of cementing substances between sandstone grains [17]. These secondary minerals often exhibit a high resistivity, thereby significantly altering the reservoir’s electrical conductivity. In terms of the conduction mechanisms, the electrical properties of sedimentary rocks are jointly controlled by pore structure parameters and the resistivity of formation fluids. When the pore structure improves (e.g., increased porosity or better connectivity) or the fluid resistivity decreases, the electrical conductivity is enhanced and the resistivity tends to decrease. Conversely, when the pore structure becomes tighter or the fluid resistivity increases, the conductivity diminishes and the resistivity rises accordingly [18,19,20]. Based on this theory, in-depth investigations of the resistivity variation patterns in waterflooded zones is not only critical for accurately estimating residual oil saturation, but it also provides a scientific basis for understanding the evolution of well-logging responses during waterflooding development.
Numerous researchers have conducted displacement experiments and numerical simulations under produced water reinjection conditions to investigate the impact of reinjection on reservoir properties and development performance. Early studies primarily focused on the influence of the injected water quality on well productivity [21,22]. Gheissary et al. and Van den Hoek et al. [23] were among the first to develop numerical prediction models, although their work was limited to productivity variations under fractured well conditions. As understanding deepened, researchers recognized that produced water reinjection is not merely a wastewater disposal method, but also an effective strategy for enhancing oil recovery [24,25]. The research focus has since shifted to the coupling effects of water quality parameters and the injection pressure, enabling the refined simulation of the reinjection process through improved numerical algorithms [26,27,28]. Recent studies have begun to address the comprehensive influence of the physicochemical properties of produced water. In experimental investigations, key parameters such as the water composition [29,30] and oil content [31,32] have been systematically studied to understand their role in reservoir damage mechanisms. Currently, studies on polymer-containing produced water reinjection remain limited, particularly in terms of understanding the microscopic mechanisms involved. Due to its unique rheological properties and chemical composition, polymer-containing produced water tends to cause polymer molecule adsorption and retention at pore throats, resulting in a continuous decline in reservoir permeability. Although this phenomenon has been observed in existing studies, there is still a lack of systematic experimental validation and theoretical explanation regarding its underlying mechanisms.
This study, based on rock-electricity–phase displacement experiments, systematically investigated the effects of produced water reinjection on the seepage characteristics and reservoir properties in the mature zones of the Xinli Oilfield during waterflooding development. Laboratory simulations were conducted to examine how the resistivity of rock samples changed during simulated produced water reinjection under displacement by injection water of varying salinity levels. The core of the experiments was to analyze the relationship between rock resistivity and water saturation, followed by the observation of changes in the pore and throat radius distributions before and after displacement. CT imaging data under different displacement conditions were provided, offering new experimental evidence for understanding reservoir damage mechanisms and identifying waterflooded zones. In addition, this study employed displacement experiments to analyze reservoir damage caused by polymer-containing produced water of varying mixing ratios and oil contents. The physical and chemical characteristics of the produced water were thoroughly investigated using mass spectrometry, compatibility testing, and SEM imaging to capture the microscopic mechanisms during the experimental process. Finally, considering the specific geological conditions and reinjection development needs of the Xinli Oilfield, appropriate reservoir protection measures were proposed to mitigate reservoir damage caused by produced water reinjection and to provide scientific and technical support for future reinjection strategies.

2. Overview of the Study Area and Experimental Method Design

2.1. Overview of the Study Area

The Xinli Oilfield is located in the central part of Jilin, bordered to the east by the Mutou-Fuyu oilfield group and extending northward to the Xinbei Oilfield. The regional topography is primarily plains, with natural lakes such as Chaganpao and Xinmiao Pao located on the west and south sides. Structurally, it belongs to the western extension of the Fuxin uplift zone in the central depression belt of the Songliao Basin, with the eastern part closely adjacent to the Mutou structural nose and the north, west, and south directions dipping into the Gulong and Changling depressions. The main development intervals include the Lower Cretaceous Qiantou Group 3 and 4 sections of the Fuyu oil layer, as well as the upper section of the Yangdachengzi oil layer.

2.2. Experimental Methods and Principles

The core resistivity can reflect the core porosity, which in turn can indicate the formation’s oil storage capacity and permeability. This is of great significance in the field of electrical well logging and oil extraction. This study followed the SY/T5385-2007 standard specification (Laboratory Testing Procedure for Rock Resistivity Parameters), and based on the principle of oil displacement by water, systematically measured the resistivity parameters of core samples under different water saturation conditions, clarifying the relationship between formation resistivity and changes in water saturation [33]. The processing method was based on the Archie equation:
F = R 0 R w = a m
In the equation, F —formation resistivity factor; R 0 —resistivity of the rock when fully saturated with water, Ω·m; R w —resistivity of brine in the Archie equation, Ω·m; a —lithology coefficients; —porosity of the core sample, %; and m —cementation index.
I = R t R 0 = b S w n
In the equation, I —resistivity increase rate; R t —resistivity of the core sample when partially saturated with brine, Ω·m; b —lithology coefficients; S w —water saturation; and n —saturation index.

2.3. Experimental Sample

Representative natural rock samples from the Xinli Oilfield in Jilin were used in this study. The core samples were taken from the Xinli Oilfield, with reservoir depths ranging from 2500 to 3500 m. The measured permeability of the reservoir ranged from 3 mD to 32 mD, and the porosity varied from 12% to 18.52%.
The water samples used in this study were taken from the production well area of the Xinli Oilfield, with significant variations in mineralization characteristics. The in situ formation water has a mineralization of up to 8700 mg/L, while the injection water system shows a broader mineralization range, from 700 mg/L to 5500 mg/L. The produced fluid has an even wider mineralization distribution, ranging from 2000 mg/L to 9500 mg/L. Based on these significant mineralization differences, the experiment designed injection water systems with varying mineralization levels, specifically set at 500 mg/L, 3000 mg/L, 6000 mg/L, and 10,000 mg/L, to systematically study the effect of mineralization changes on the reservoir properties and fluid flow characteristics. Detailed experimental types and parameter data are provided in Appendix A, Table A1, Table A2 and Table A3.

2.4. Test Steps

Figure 1 shows the experimental process. The main experimental procedures in this article are as follows:
(1)
The preparation process for core samples was as follows: For the rock samples collected in the field, drilling and cutting operations were carried out to produce standard cores, with a length of 2.5 to 5 cm and a diameter of 2.5 cm.
(2)
The core oil-washing, salt-washing, and drying steps were as follows: Using a solvent extraction method, residual oil and salts were removed from the core. After solvent cleaning, the rock samples were first placed at room temperature for 10 h and then transferred to a constant temperature drying oven, where they underwent ≥24 h of continuous heat drying under simulated formation temperature and pressure conditions. This dual drying process ensured the complete removal of residual pore fluids. The baseline mass parameters of the rock samples were then calibrated using a precision balance.
(3)
Basic data measurement: According to the industry standards, such as the SY/T5336-2006 “Core Analysis Methods”, the physical property parameters of the core were measured [34], including the porosity, permeability, and others.
(4)
The core saturation process included two key stages: First, the pore fluid was replaced using vacuum saturation with formation water. During the displacement process, dynamic monitoring was carried out to obtain resistivity response data, which were then used to invert the rock electrical parameters (resistivity, resistivity index) using the Archie equation.
(5)
The resistivity–saturation monitoring scheme for displacement experiments was as follows: Four characteristic mineralization gradient injection water systems were selected for the experiments, with each system used for multiple rounds of displacement experiments on different rock samples. During the experiments, SEM imaging and CT scanning were used to obtain micro-mechanism evidence.
Figure 1. Experimental testing flow chart.
Processes 13 01511 g001

3. Results and Discussion

3.1. Experimental Results and Characterization of Rock Electric-Phase Drive Analysis Results and Discussion

3.1.1. Analysis of the Results of Rock Electric-Phase Drive Experiments

Figure 2 reveals the rock electrical phase and displacement experiment data under the multi-mineralization gradient injection wastewater conditions, specifically characterizing the dynamic response of resistivity parameters and water saturation during the displacement process. As shown in Figure 2a, when the mineralization of the wastewater was low, the degree of contamination in the core by the injected water was relatively limited, and the resistivity of the three cores with different permeabilities showed consistency. The low-mineralization injection water had a weak effect on the core’s pore structure and mineral composition, and the resistivity changes between them were not significant. As shown in Figure 2b–d, as the mineralization of the wastewater increased, cores with a higher permeability exhibited a higher resistivity. High-mineralization injection water underwent ion exchange or chemical reactions with clay minerals in the core, generating new cementing agents or precipitates with a higher resistivity and significantly affecting the electrical conductivity.
As shown in Figure 3, the relationship curve of resistivity affected by injection water with different mineralization levels is presented. Taking the A21-4 core as an example, as the salinity of the injected water increased from freshwater to wastewater, the resistivity–saturation curve exhibited a clear salinity dependence: when low-salinity wastewater was injected, the curve showed a concave shape; as the salinity of the injected water increased, the curve no longer showed a concave feature, but instead presented a steady upward trend with increasing water saturation. As the water saturation increased, the resistivity increased more, and the final resistivity at the residual oil saturation was also higher. This means that, in the case of high-mineralization waterflooding, after the injection water floods the reservoir, the electrical response characteristics of the flooded layer will change significantly as the flooding degree deepens, specifically showing a gradual increase in resistivity and thus presenting a high-resistivity phenomenon. The formation resistivity is not only closely related to the mineralization of the injection water, but is also significantly affected by the water saturation. Therefore, in actual reservoirs, the waterflooding condition can be determined based on the electrical response characteristics, and the flooded layers can be interpreted, leading to effective adjustment measures.

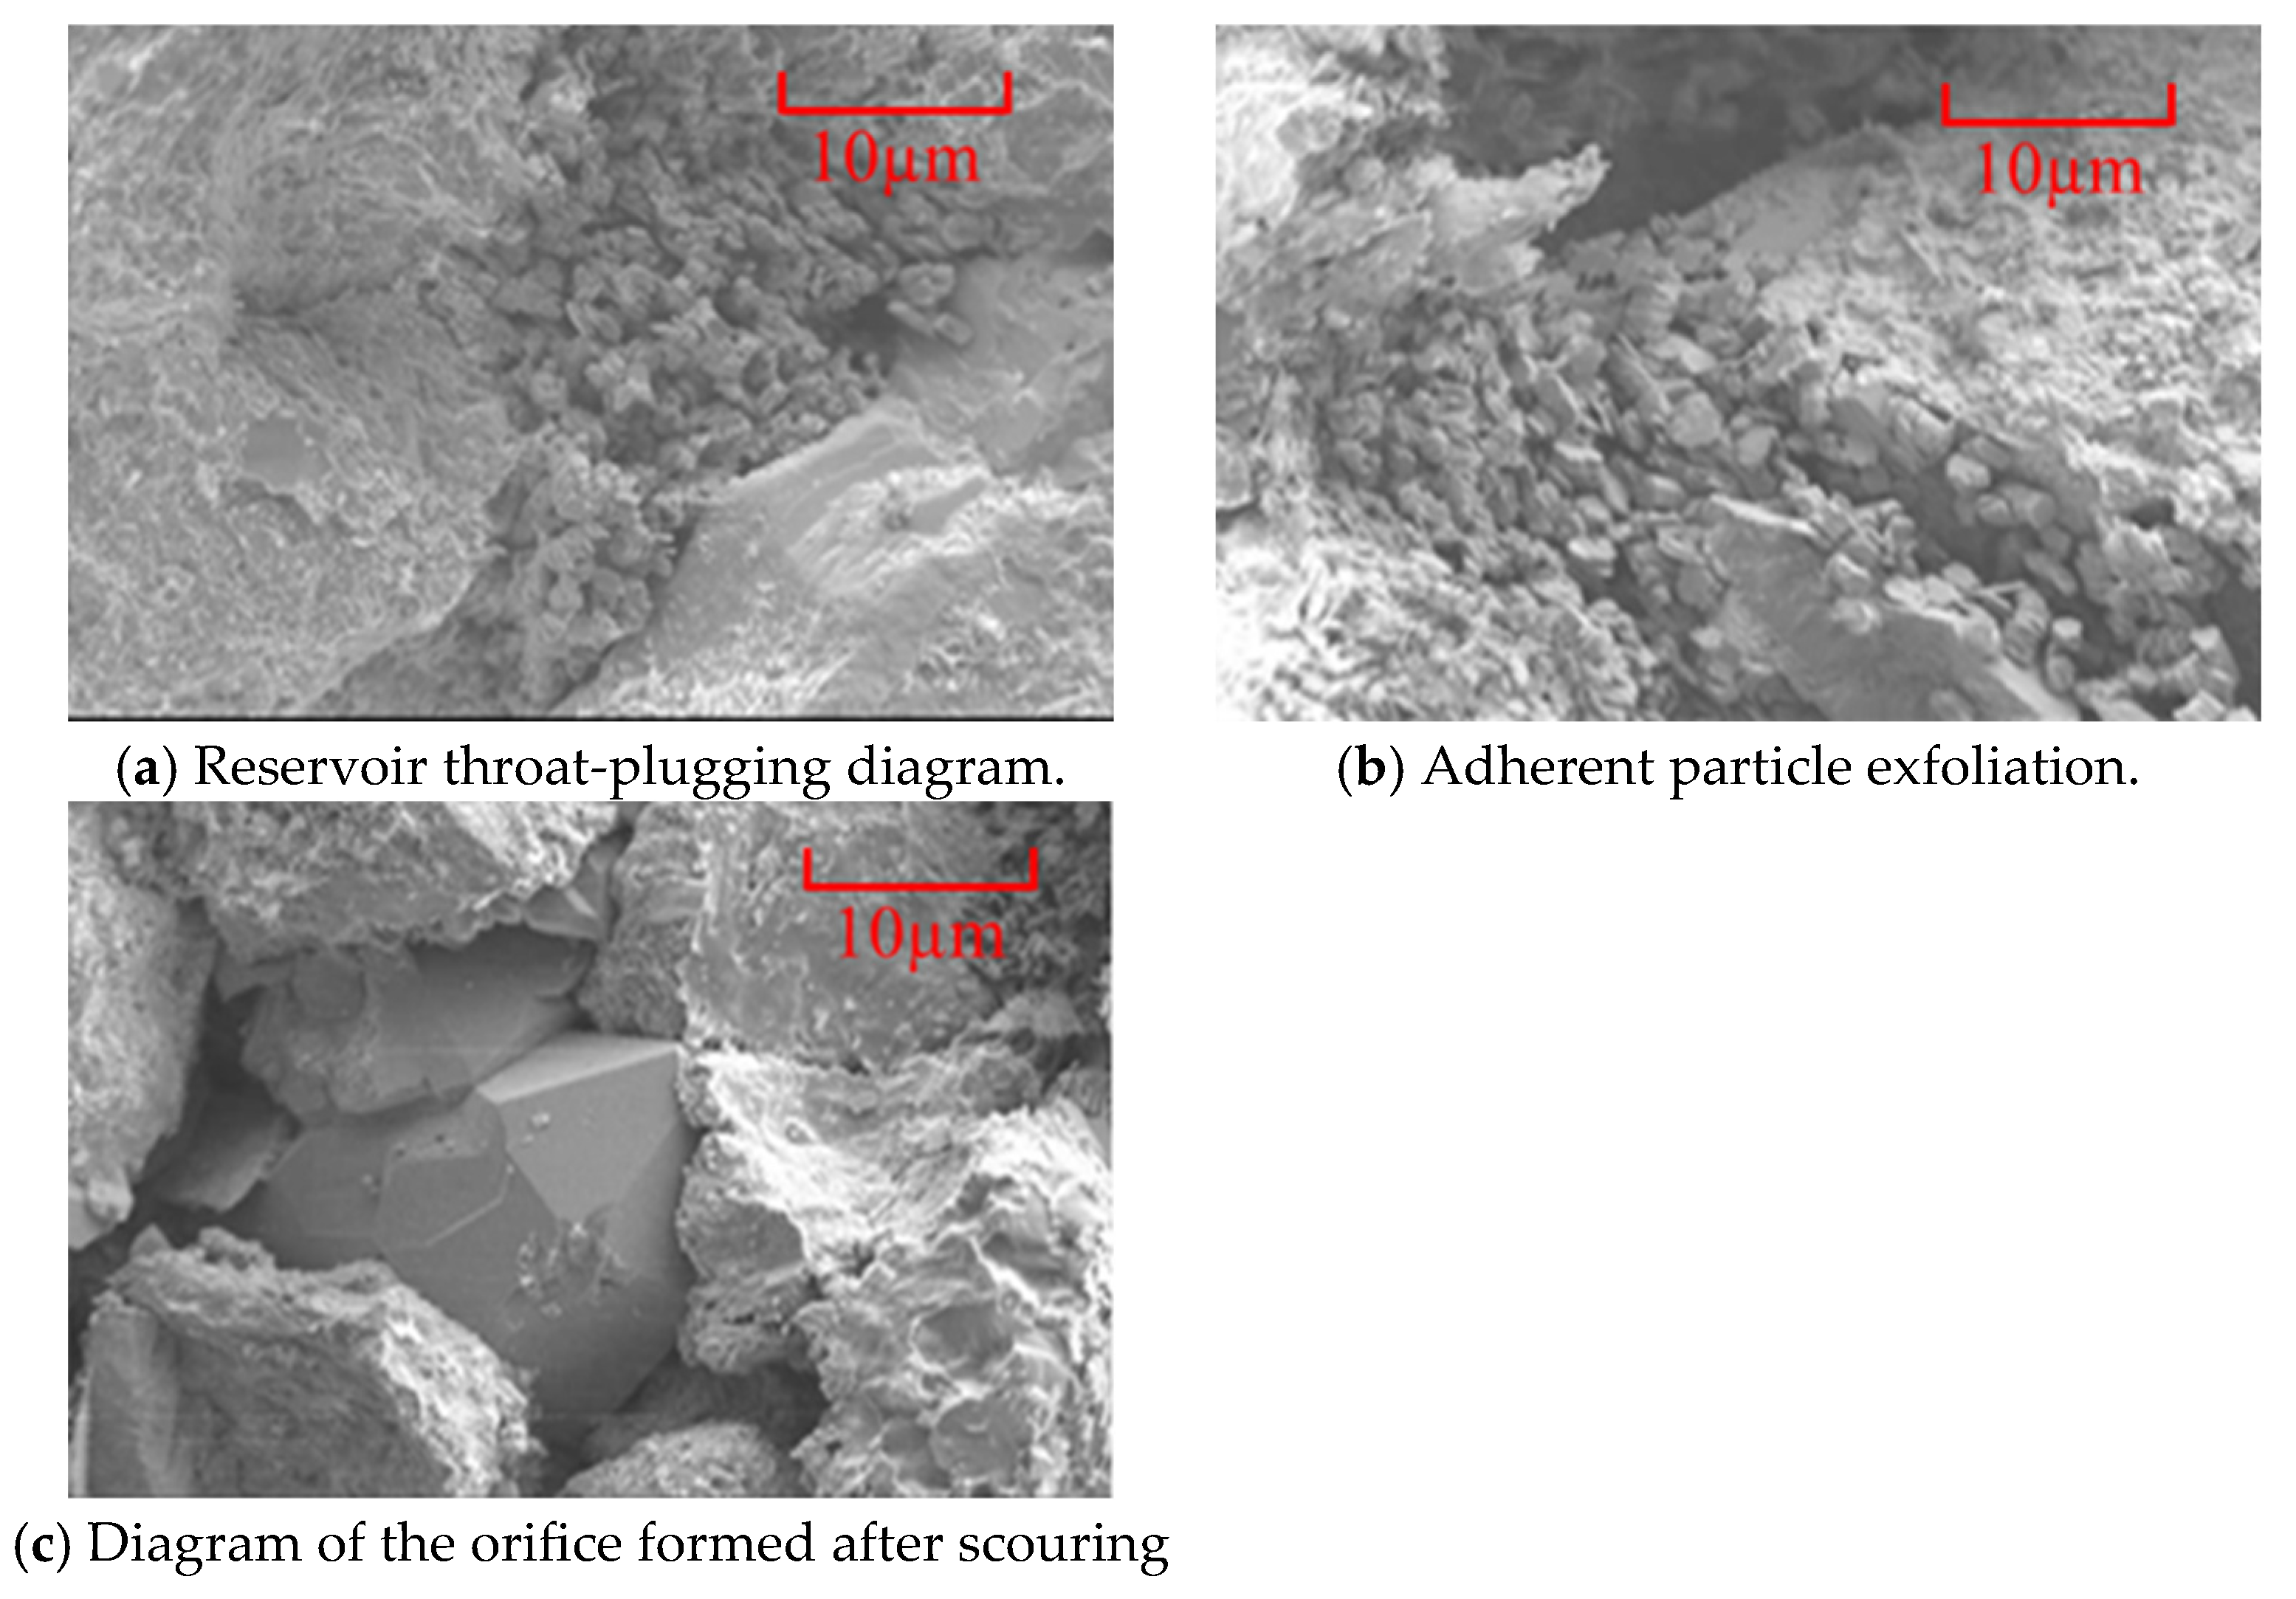
3.1.2. Analysis of Core Throat Changes and Characterization

The study of the A21-4 core revealed changes in the throat radius distribution frequency before and after the displacement experiment, as shown in Figure 4. The displacement experiment with a salinity of 5000 mg/L was taken as an example for the analysis, as high-salinity fluids have a more pronounced effect on pore-throat structures and thus more clearly reflect the patterns of physical property changes under reservoir conditions. Prior to the experiment, the throat radius distribution of the core samples exhibited a uniform characteristic, with most of the radii falling in the range of 0.5–5.5 µm, accounting for 94.37%. After the experiment, the throat radius distribution shifted significantly, with a marked increase in the number of throats in the 0.5–2.5 µm range, and with the average frequency rising by 1.894%. Meanwhile, the number of throats in the 2.5–5.5 µm range decreased significantly, with the average frequency dropping by 2.073%. Notably, the change in the pore radius distribution frequency was small, with relative changes of less than 5%. This result indicates that the wastewater displacement process mainly affected the throat structure of the core sample, causing a shift from medium-scale throats (2.5–5.5 µm) to small-scale throats (0.5–2.5 µm).
To characterize the changes in the throat and pore radius distribution in the core samples mentioned above, a data volume of 100 × 100 × 100 μm was extracted from the core samples before and after the displacement experiment. By comparing the pore network models before and after the displacement experiment, the connectivity of the throats, the evolution of the pore space, and the trend in the changes in throats of different scales could be visually observed. This further revealed the impact of wastewater displacement on the microstructure of the reservoir. To display the 3D view of the pore network model, spheres and cylinders were used to represent pores and throats, respectively, as shown in Figure 5. The pore-throat distribution was densest in the bound water state of the core, indicating the good connectivity of the pore network. After the wastewater displacement experiment, the pore-throat distribution significantly decreased, with a particularly notable reduction in the number of larger throats. Therefore, in subsequent protective studies, attention should be focused on the structural changes of the throats and protection measures.

3.2. Analysis of Factors Affecting Reservoir Damage Induced by Wastewater Displacement

3.2.1. Damage Analysis with Different Water Content Ratios

With the expansion of polymer injection in oilfields, the amount of wastewater produced by polymer flooding in oilfields has increased, while freshwater is limited. To further determine the damage caused by wastewater flooding, and in combination with the actual field conditions, this study mainly evaluated the damage to the reservoir caused by mixed water, with polymer-containing wastewater as the dominant component.
Table 1 shows the evaluation results of the damage to the permeability of simulated reservoir sandstone cores after mixing freshwater and polymer-containing wastewater in different volume ratios. When the freshwater/wastewater ratio was 1:1, the damage rates of the two cores were 23.36% and 27.41%, respectively. When the ratio was 1:5, the corresponding damage rates were 31.54% and 34.72%. After mixing freshwater and wastewater in different ratios, the damage rates to the cores were higher than those caused by single wastewater, especially when the freshwater/wastewater ratio was 1:5, where the damage to the core permeability was the highest and far exceeded the damage rates caused by either pure freshwater or pure wastewater. As the proportion of wastewater increased, the damage rate to the cores also rose, which also indicates that there is some degree of incompatibility between polymer-containing wastewater and freshwater.

3.2.2. Analysis of Oil Content Damage to Core Permeability

The method for simulating oil-containing wastewater is as follows: a certain amount of crude oil from the oilfield (water content < 0.3%) is added to simulated formation water. The oil-containing wastewater is emulsified using a high-speed emulsification shear machine, with a set rotational speed. The emulsified droplets are observed under a microscope to determine the droplet size distribution, which is adjusted to be between 2 µm and 4 µm by adjusting the rotational speed and emulsification time of the shear machine. The oil content is then measured and used for core displacement experiments.
Table 2 shows the evaluation results of the permeability damage caused by wastewater with different oil contents. When the oil content was 20 mg/L, the permeability damage index was relatively low, ranging from 4.58% to 5.32%, indicating that the core permeability was slightly damaged and the reservoir damage was minimal. When the oil content increased to 40 mg/L, the permeability damage index rose to 8.74% to 9.62%, indicating a significant increase in damage. When the oil content further increased to 60 mg/L, the permeability damage index increased significantly to 16.27% to 17.41%, indicating that severe pore plugging occurred in the reservoir. The oil content in the injected wastewater had a significant impact on the permeability damage of the reservoir, showing a clear positive correlation.

3.3. Damage Mechanism Analysis

3.3.1. Wastewater Mass Spectrometry

A suitable amount of each freshwater filter membrane sample was placed on a glass slide, dried, and then subjected to calcination before undergoing an energy spectrum analysis. The analysis results are shown in Figure 6. The main impurities in the wastewater were O, Si, and Fe, with their contents being 37.2%, 24.4%, and 17.7%, respectively. In addition, the Ca content was 9.52%, and Al and C each accounted for approximately 5%.
The relatively high Fe content in the wastewater required an analysis of its particle chemical changes. The concentration of Fe²⁺ ions in the wastewater was detected to be 1.437 mg/L. When the wastewater is reinjected into the reservoir along with freshwater, attention should be paid to its chemical precipitation changes. Initially, due to the low pH of the wastewater, Fe ions are easily oxidized to Fe(OH)3. As freshwater is injected, the pH of the liquid gradually rises to around 7–8, and it is highly likely that Fe(OH)2 will form.

3.3.2. Experiment on the Compatibility of Sewage Water and Freshwater

Experiments were conducted to evaluate the compatibility of wastewater with freshwater and the compatibility with core samples, using electron microscope scanning images for micro verification. After removing the oil film floating on the wastewater surface, a centrifuge was used to stir the wastewater, and a glass column was employed to collect the polymer from the wastewater. The results are shown in Figure 7a. Figure 7b shows the microscopic image after the wastewater and freshwater compatibility experiment. It was clearly observed that organic substances in the wastewater underwent significant aggregation or crystallization under the effect of freshwater, forming flaky, blocky, or flocculent suspended particles. The particle size of these suspended particles was generally ≥10 µm. The scattered aggregation was mainly due to the presence of oil-based contaminants in the wastewater, typically composed of various organic and inorganic components, including asphaltenes, waxes, resins, clay minerals, and chemical additives, which are incompatible with freshwater.

3.3.3. Sewage–Core Compatibility Test

In order to clearly observe the compatibility of wastewater with the core and its impact on the reservoir properties, this experiment focused on the microscopic dynamic changes on the surface and inside the core. Figure 8a shows microscopic images after the wastewater and core compatibility experiment, taken from the core surface. It can be clearly observed that the organic polymers and inorganic components in the wastewater underwent significant flocculation on the core surface, forming larger-sized adhesive particles that intertwined and tightly adhered to the core surface. The formation of these adhesive particles not only changed the microstructure of the core surface, but may have also further blocked the pore throats. Figure 8b shows images taken from inside the core after the compatibility experiment. Organic polymers and clay particles flocculated together through the bonding effect, forming irregularly shaped particles. These particles were partially flaky or blocky, with particle sizes primarily ranging from 10 to 80 µm. The distribution of particles within the core’s pores was complex, with some particles gathered on the pore wall surface, while others mainly blocked the pore throats. The overall internal structure was loose, presenting porous or layered features, indicating that the formation process underwent several stages, including adsorption, aggregation, and deposition.

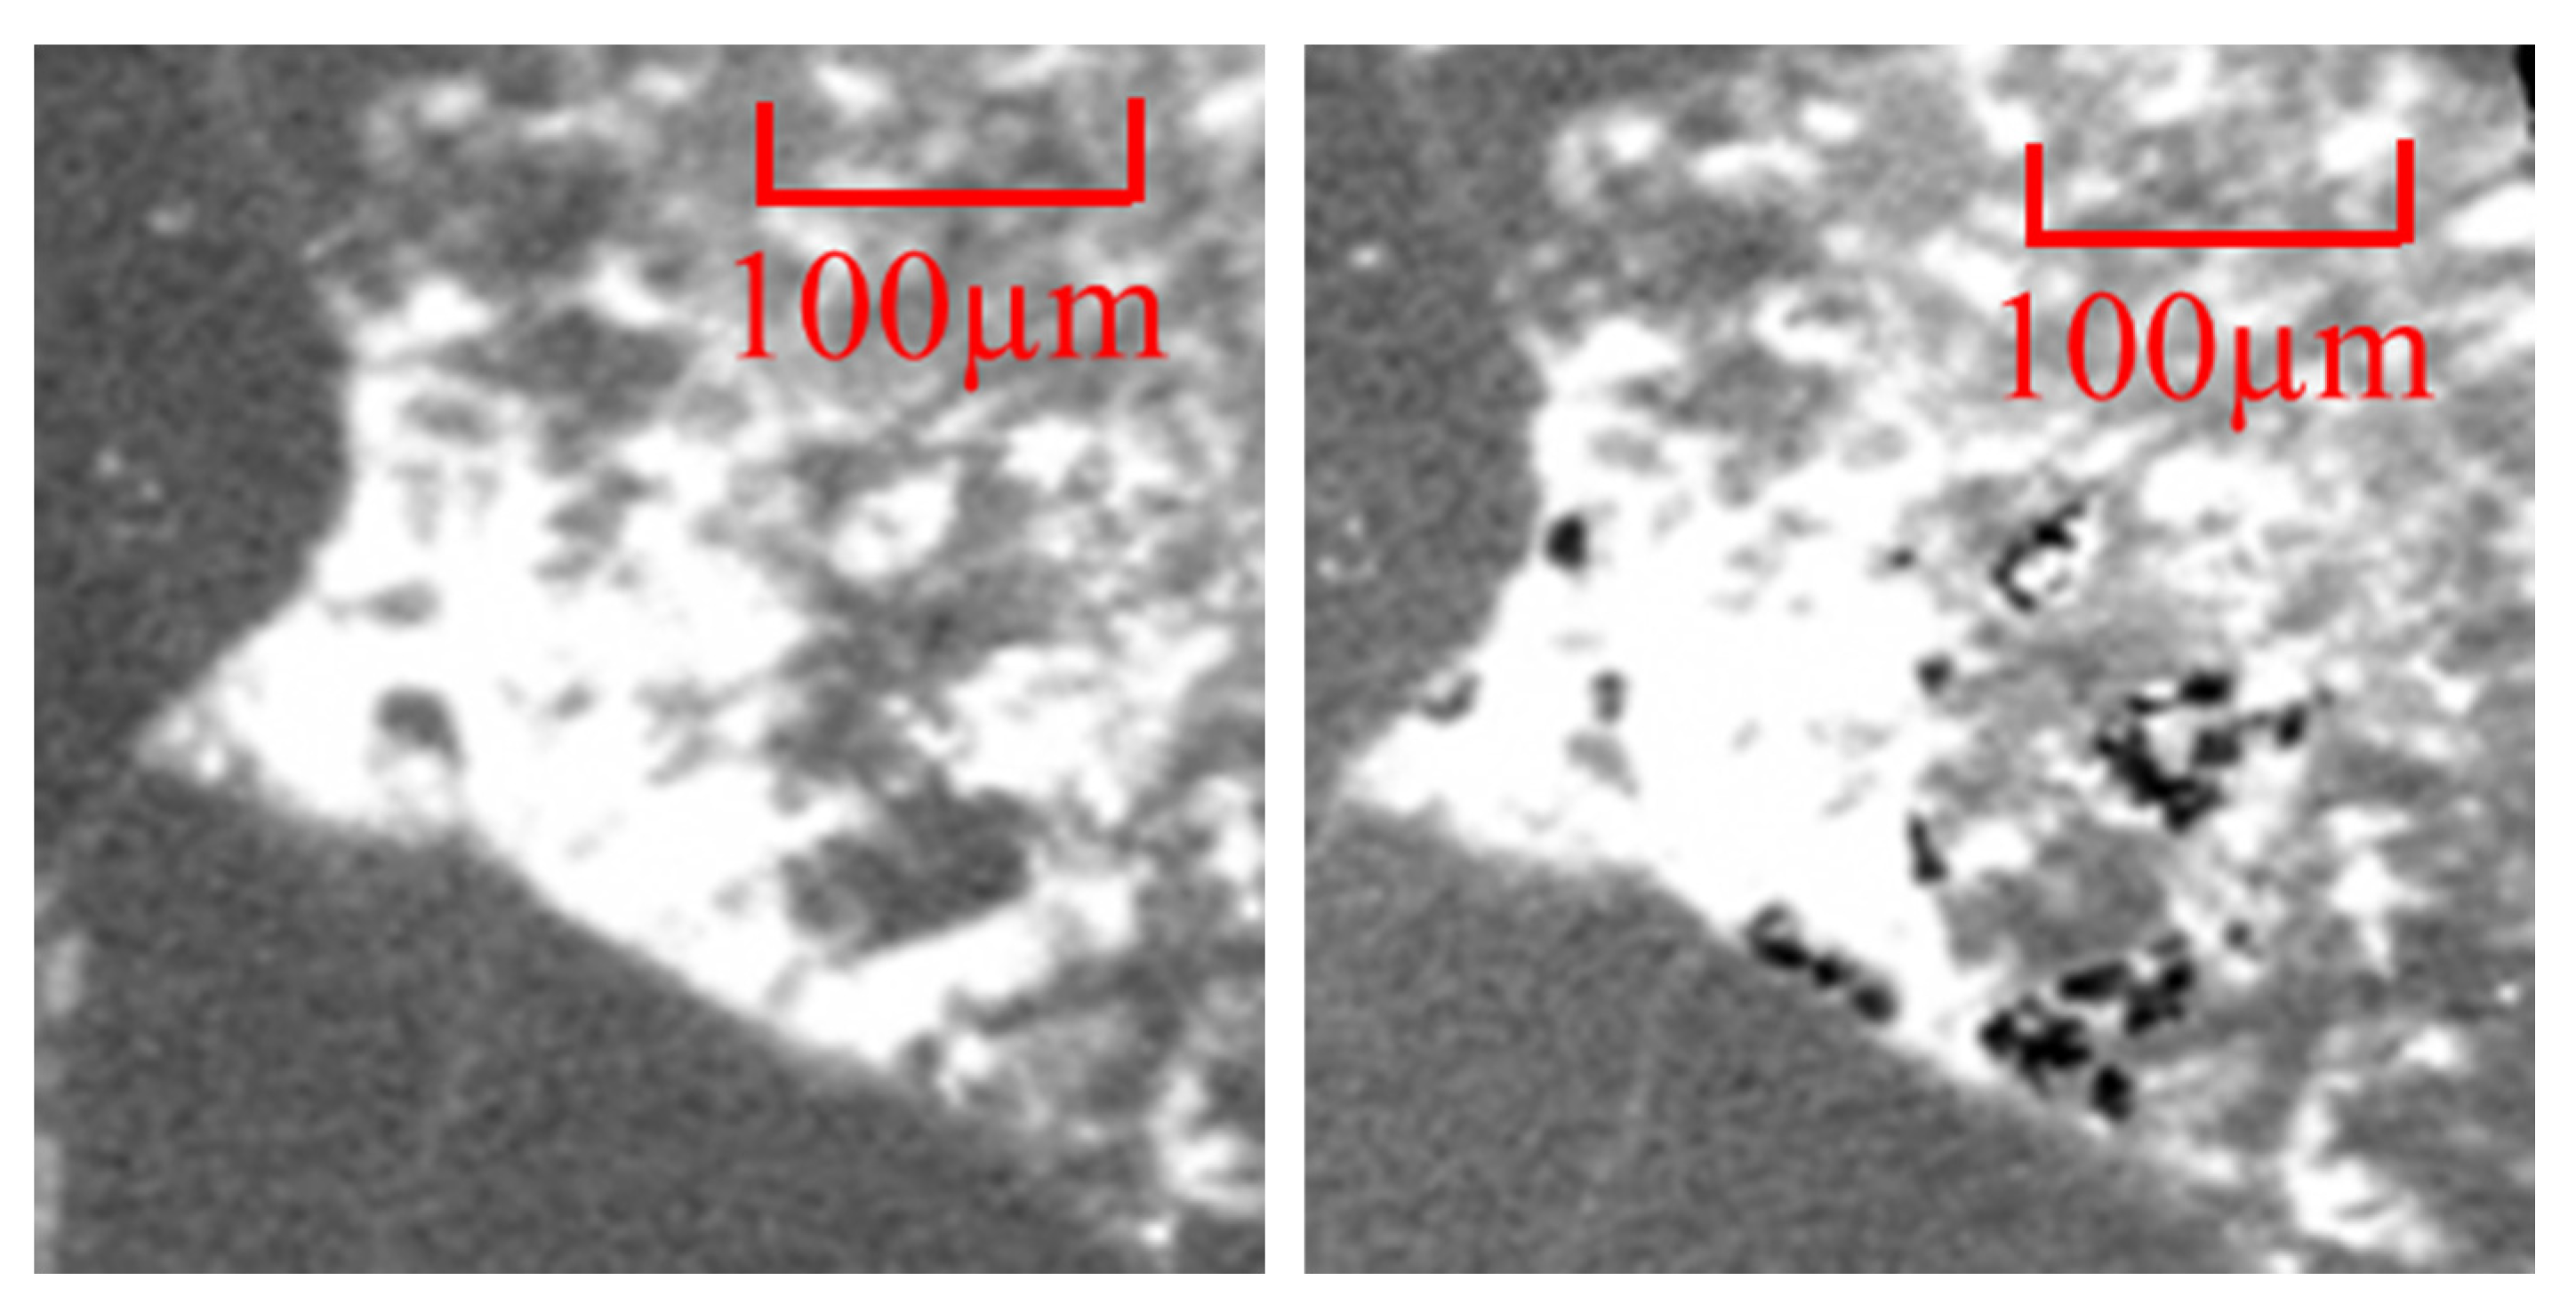
3.3.4. CT Tomography Pressure Occlusion Damage Mechanism

In order to verify the damage to the core permeability caused by oil-containing fluids, the A1-12 core was subjected to a simulated method using oil-containing wastewater, with an oil concentration of 60 mg/L. CT scan images of the core samples were taken before and after the displacement experiment. The results, shown in Figure 9, indicate that, prior to displacement, the core’s internal pore structure exhibited a good connectivity and a relatively uniform pore development. After displacement, the images revealed significant blockage in some pore channels, a reduction in pore connectivity, and diminished pore development. Localized low-density regions resembling “shadows” were observed, suggesting the deposition of organic matter or impurities that blocked the pores. This phenomenon further confirms that high-oil-content water causes the adsorption and deposition of oil fractions on the pore surfaces during displacement, leading to the narrowing or even sealing of pore channels. Consequently, this results in a decline in permeability and exacerbates reservoir damage.

3.4. Research on Wastewater Reinjection Treatment Processes

3.4.1. Wastewater Reinjection Treatment Technologies in Chinese Oilfields

Based on the characteristics and treatment requirements of wastewater, various oilfields in China have adopted differentiated reinjection treatment processes, emphasizing practicality. Class I oilfields (e.g., Daqing Oilfield) follow the “Daqing Oilfield Surface Engineering Construction Design Specifications” (Q/SY DQ 0639-2015) and use a biochemical treatment process of “efficient flotation + microbial degradation + solid-liquid separation + primary filtration” [35,36]. Class II oilfields mainly process oil-containing wastewater separated by the oil treatment system, oil sludge generated by the oil–water separator and the air flotation device in the water treatment system, and complex components such as backwash liquid from pre-filtration tanks and dual-media filters [37,38]. These are processed through targeted combinations of treatment techniques to achieve standard-compliant wastewater reinjection.
For a long time, produced water treatment processes have often come at the cost of a high energy consumption, high chemical usage, and large amounts of sludge production, in exchange for ideal separation results. This approach has led to a series of issues, including lengthy treatment processes, high carbon emissions, and high operational costs. Under the “dual-carbon” context, high-water-content chemical flooding oilfields are transitioning towards a greener, low-carbon model. The core idea is to improve the wastewater treatment efficiency, reduce sludge production, and minimize the waste of freshwater and polymer chemical agents [39,40,41,42]. To this end, new demulsification and separation technologies are being developed, the treatment and reinjection processes for polymer-containing wastewater are being optimized, and polymer resources remaining in the wastewater are being fully recovered. This reduces the use of fresh polymer chemicals and minimizes sludge generation from the source, achieving the collaborative treatment and resource utilization of polymer-driven wastewater.

3.4.2. Research on Optimization of Reinjection Treatment Processes

In the wastewater reinjection operations of the Xinli Oilfield, the reservoir is highly susceptible to contamination, posing a challenge for efficient oilfield development. Based on previous research, the various impurities and clay minerals in the wastewater negatively affect the pore-throat structure of the reservoir during the reinjection process. This study used SEM scanning electron microscopy to analyze the pore-throat structure from a microscopic perspective. As shown in Figure 10a, the pore throats were completely blocked by adhesive clay particles. The wastewater contained complex chemical components and metal ions such as calcium ( C a 2 + ) and magnesium ( M g 2 + ) ions, which, during the reinjection process, can react with carbonate ( C O 3 2 ) and sulfate ( S O 4 2 ) ions to form precipitates. The chemical reaction formula is as follows:
C a 2 + + C O 3 2   C a C O 3
C a 2 + + S O 4 2   C a S O 4  
These precipitates continuously accumulate in the reservoir, leading to an increasing degree of pore-throat blockage. This not only severely obstructs fluid flow, but also significantly alters the electrical properties of the waterflooded zones, interfering with the oil–water displacement efficiency and making it difficult to accurately identify and interpret the waterflooded zones. To address this issue, targeted protective measures should be implemented. Firstly, the strict treatment of the injected water should be carried out, using a multi-stage fine filtration process to remove suspended solids and clay particles, while adjusting the chemical composition of the injected water to suppress clay mineral hydration, swelling, and migration. Simultaneously, layered injection should be conducted. When a reservoir blockage occurs, physical–chemical combined descaling technology can be employed [43,44]. As shown in Figure 10b, after treatment, the clay minerals on the particle surface are stripped away. Physical methods such as high-pressure pulse water injection can be used to impact the blocking material and loosen it. Specific chemical scale inhibitors are then injected, reacting with minerals like kaolinite to weaken the adsorption forces between the minerals and the rock surface, promoting the detachment of clay minerals from the particle surface. The chemical scale inhibitor used is a weak-acidity organic acid composite agent, containing mainly formic acid ( H C O O H ), acetic acid ( C H 3 C O O H ), etc. [45]. This weak acidic characteristic gives it a unique advantage when reacting with the blocking material, effectively dissolving the blockage while minimizing the excessive corrosion of the reservoir rock, thus providing maximum protection for the reservoir structure. When kaolinite ( A L 2 S i 2 O 5 ( O H ) 4 ) causes blockage, the reaction formula between the acid in the chemical scale inhibitor and kaolinite is as follows:
A L 2 S i 2 O 5 ( O H ) 4 + 6 H C O O H 2 A l ( H C O O )   3 + 2 S i O 2 + 5 H 2 O
In this reaction process, kaolinite reacts with formic acid to produce soluble formic acid aluminum ( A l ( H C O O ) 3 ) and silica ( S i O 2 ) , which can be washed away during subsequent water injections, achieving the purpose of removing blockages. In addition, components such as acetic acid in the composite agent can react with other potential blocking substances, such as metal hydroxides, further enhancing the deblocking effect. As the clay minerals peel off, the originally blocked pore channels gradually open, as shown in Figure 10c, where new channels are formed after the removal of particles. This effectively restores the reservoir’s permeability, allowing injected water to more evenly displace crude oil, thus improving the oil–water displacement efficiency, stabilizing the electrical response of the waterflooded zone, and providing favorable conditions for the accurate identification of waterflooded zones.

4. Conclusions

This paper was based on the study of the reservoir damage mechanism and waterflooded zone identification method in water injection development, with the Jilin Xinli Oilfield as the research object. It focused on the changes in the reservoir’s physical properties and adhesion characteristics during water injection, and conducted systematic rock-electric phase-drive experiments and water compatibility experiments. Through experimental data and SEM electron microscope scanning verification, the following main conclusions were drawn:
(1)
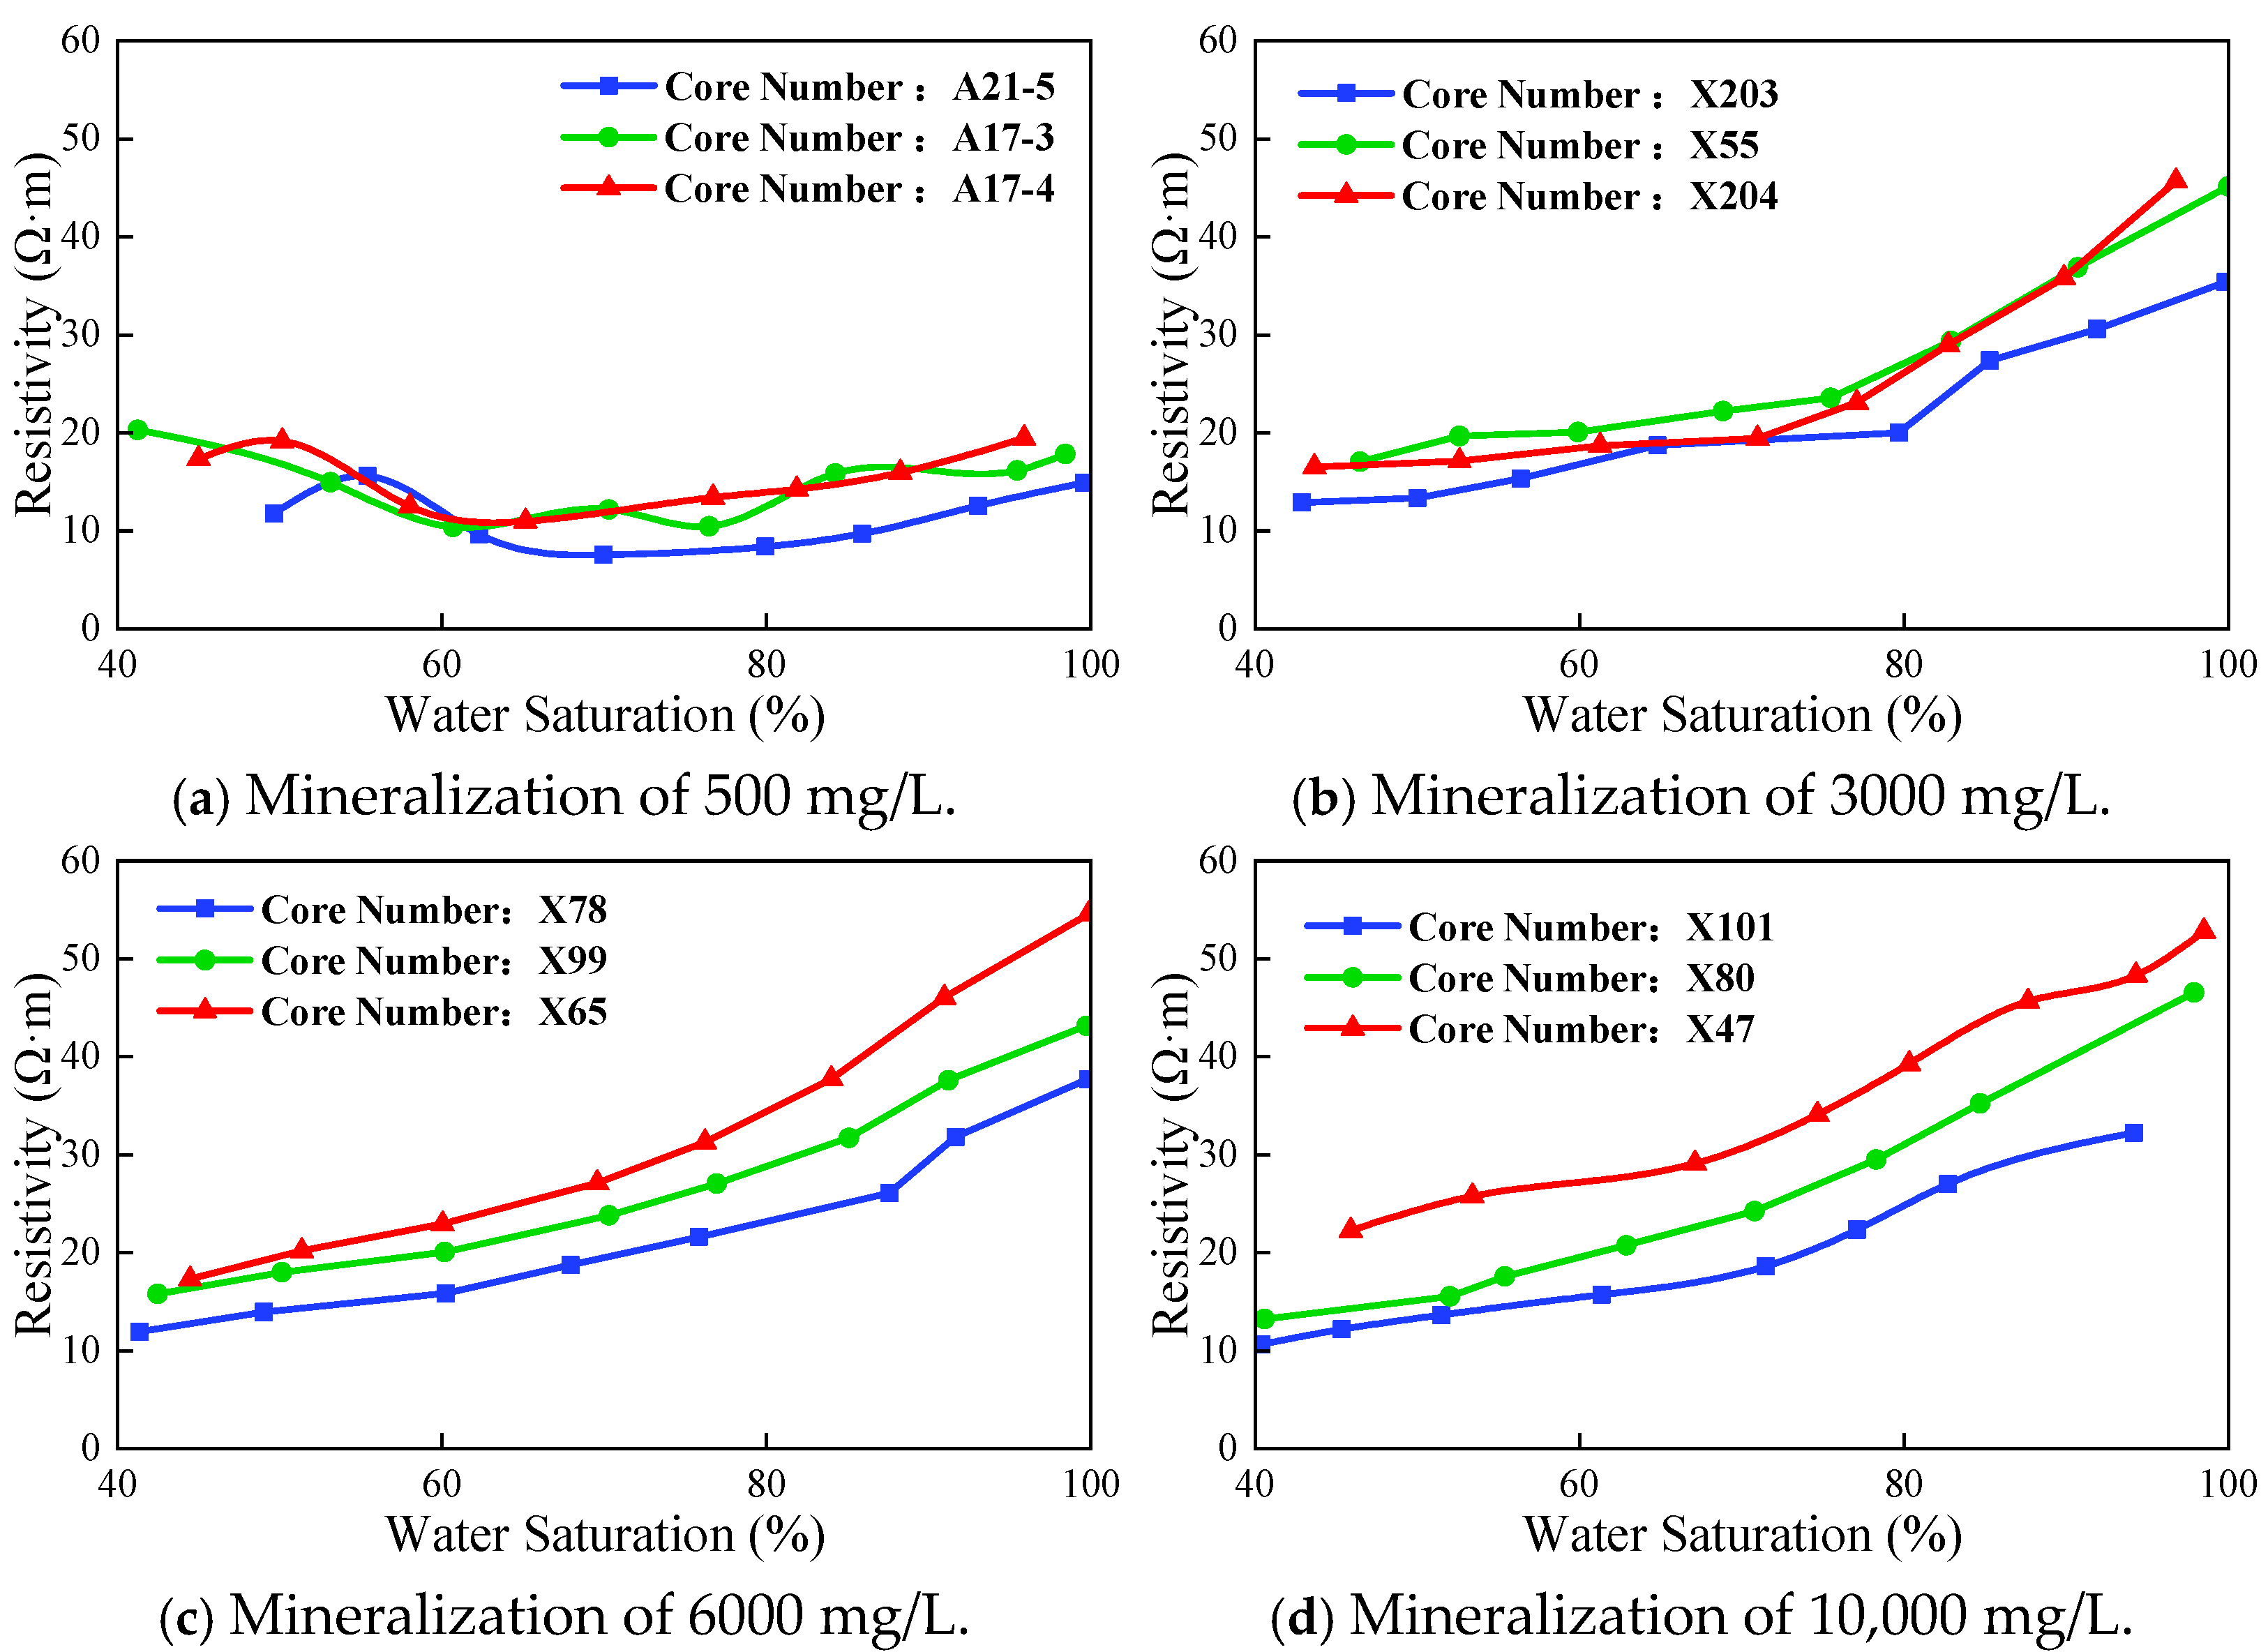
The salinity of the injected water significantly affects the resistivity response. When low-salinity wastewater is injected, the curve exhibits a concave shape; under high-salinity injection conditions, the formation resistivity increases significantly with water saturation, showing a distinct high-resistivity characteristic. Regardless of the salinity level, strong waterflooded zones were observed, and due to the lower salinity of the injection water compared to the original formation water, a significant high-resistivity response was detected. After eliminating the influence of calcium-bearing layers, the high-resistivity feature can serve as an important indicator for identifying strongly waterflooded zones.
(2)
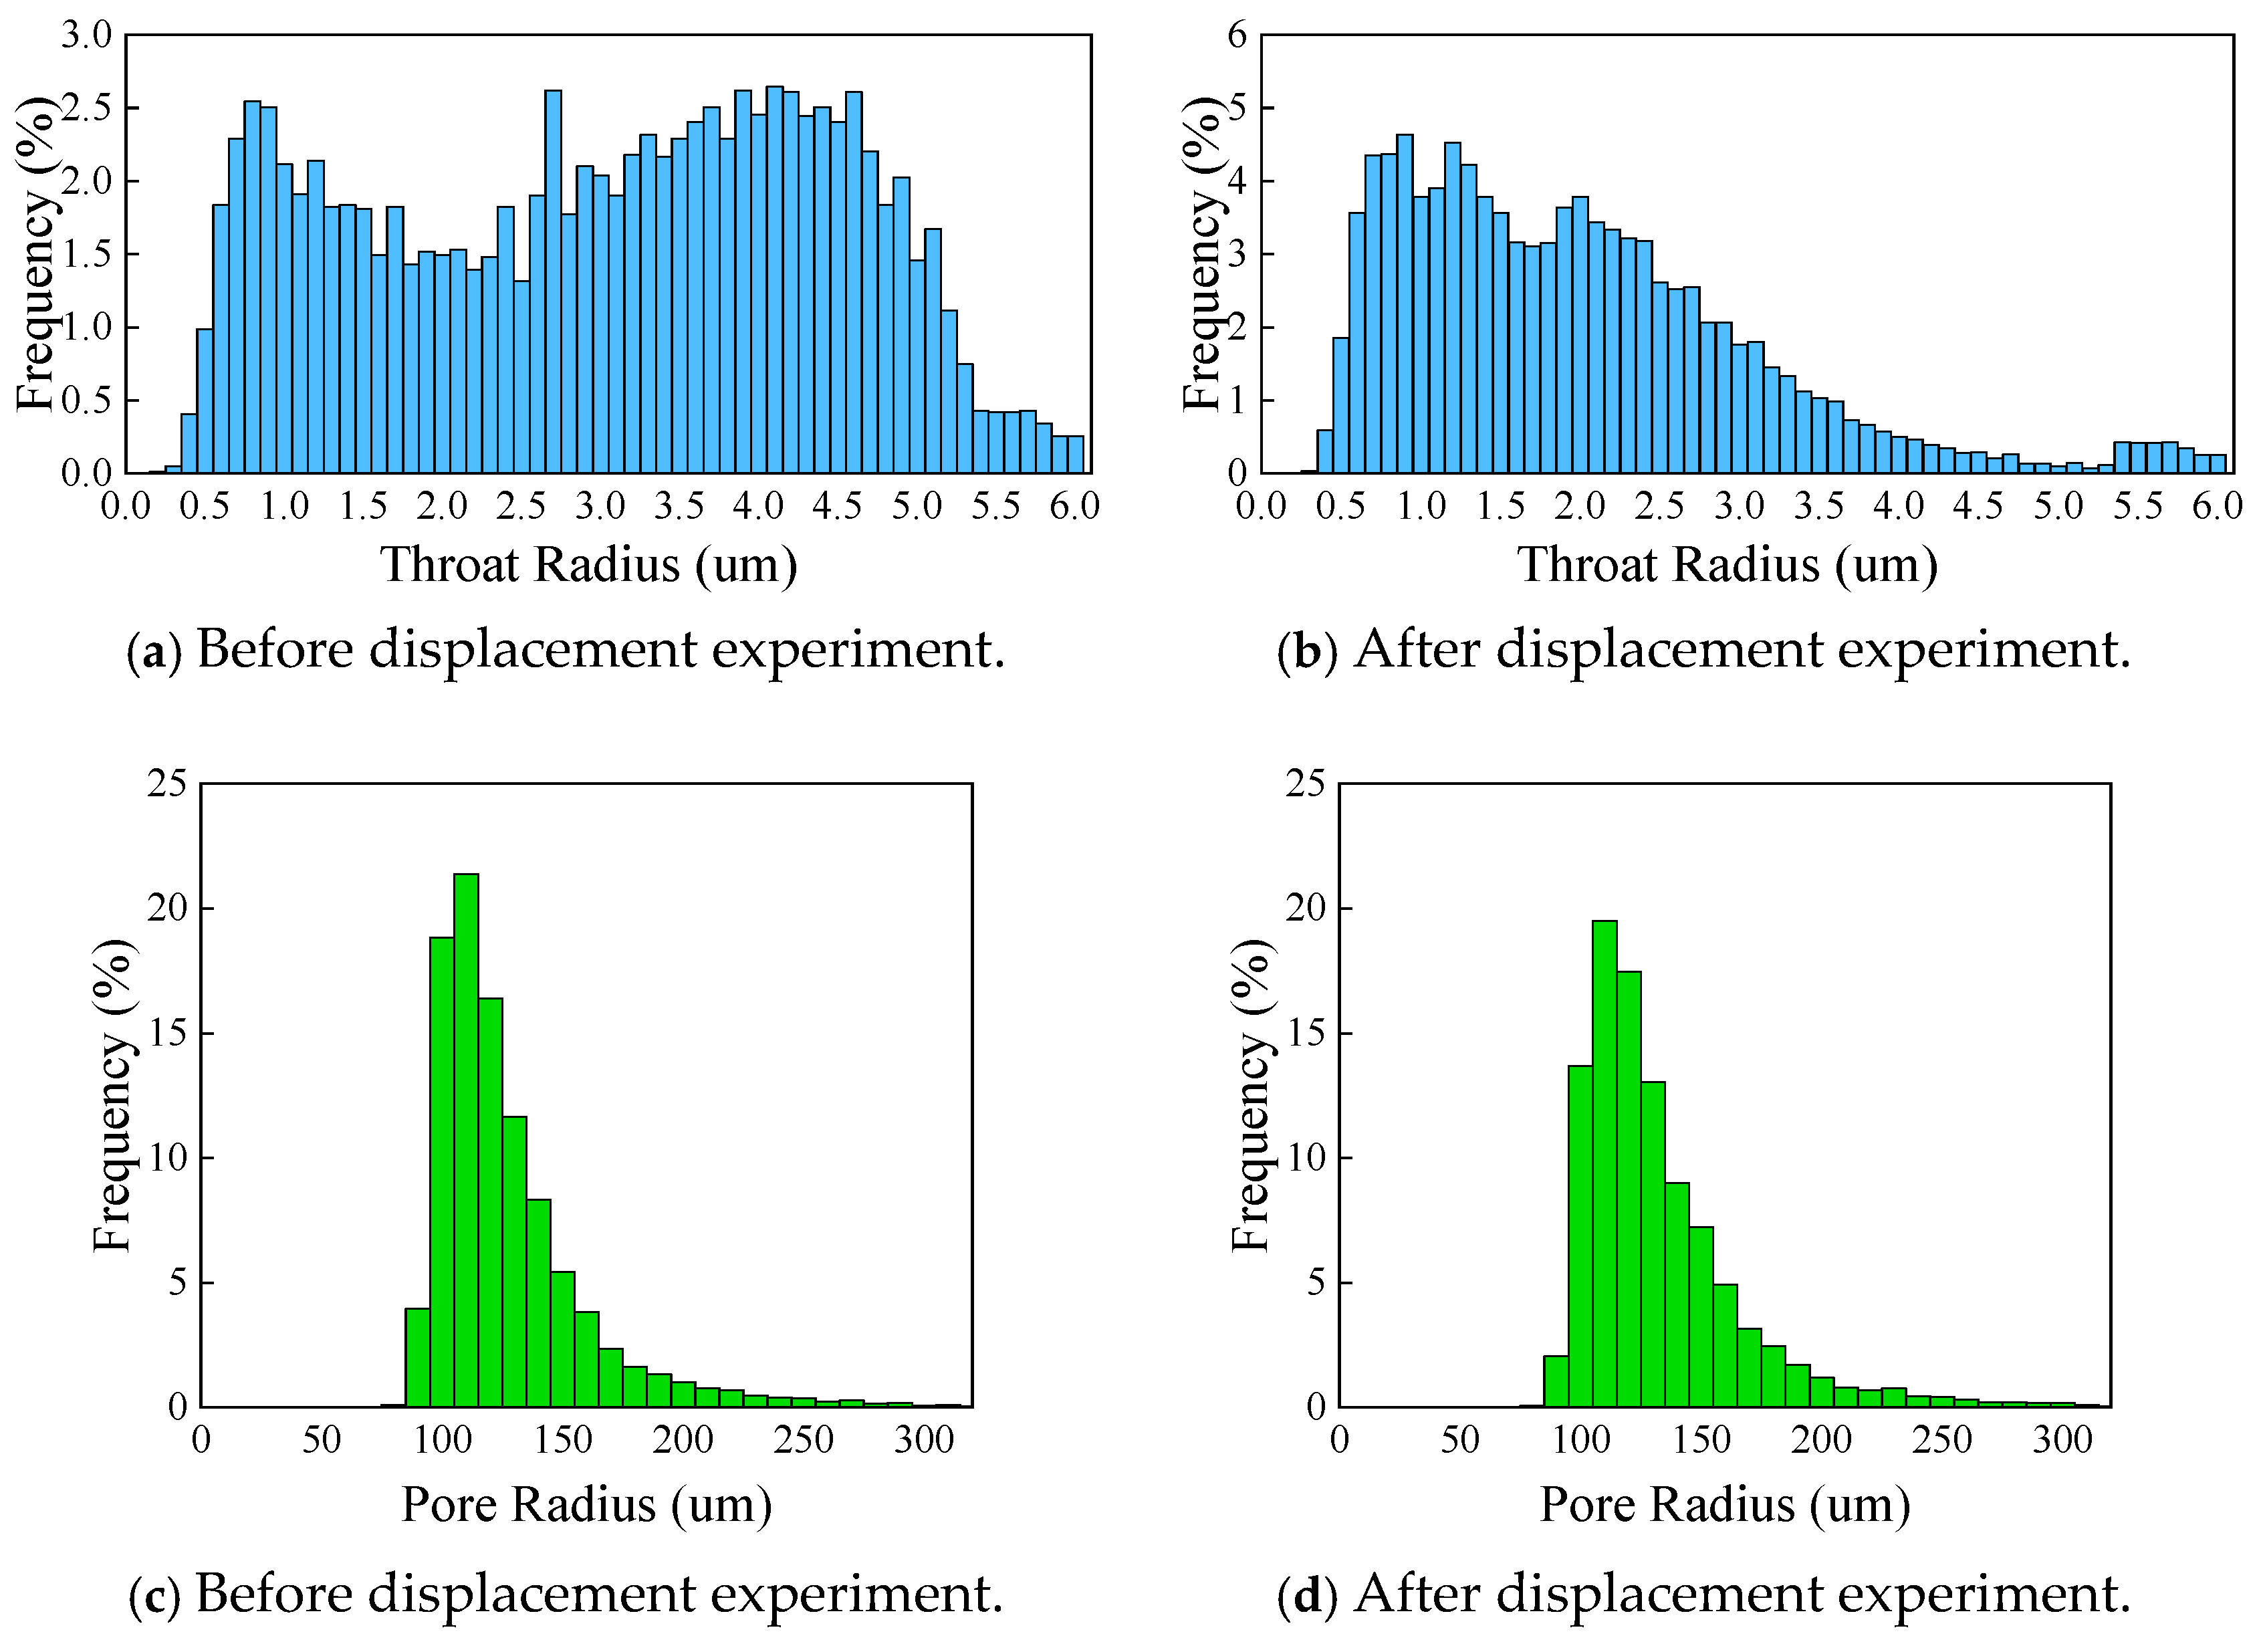
Wastewater reinjection primarily affected the pore-throat structure of the rock samples, leading to the transformation of medium-sized pore throats (2.5–5.5 µm) into smaller ones (0.5–2.5 µm). The number of small-sized throats increased significantly, with an average frequency rise of 1.894%, while the number of medium-sized throats decreased notably, with an average frequency decline of 2.073%.
(3)
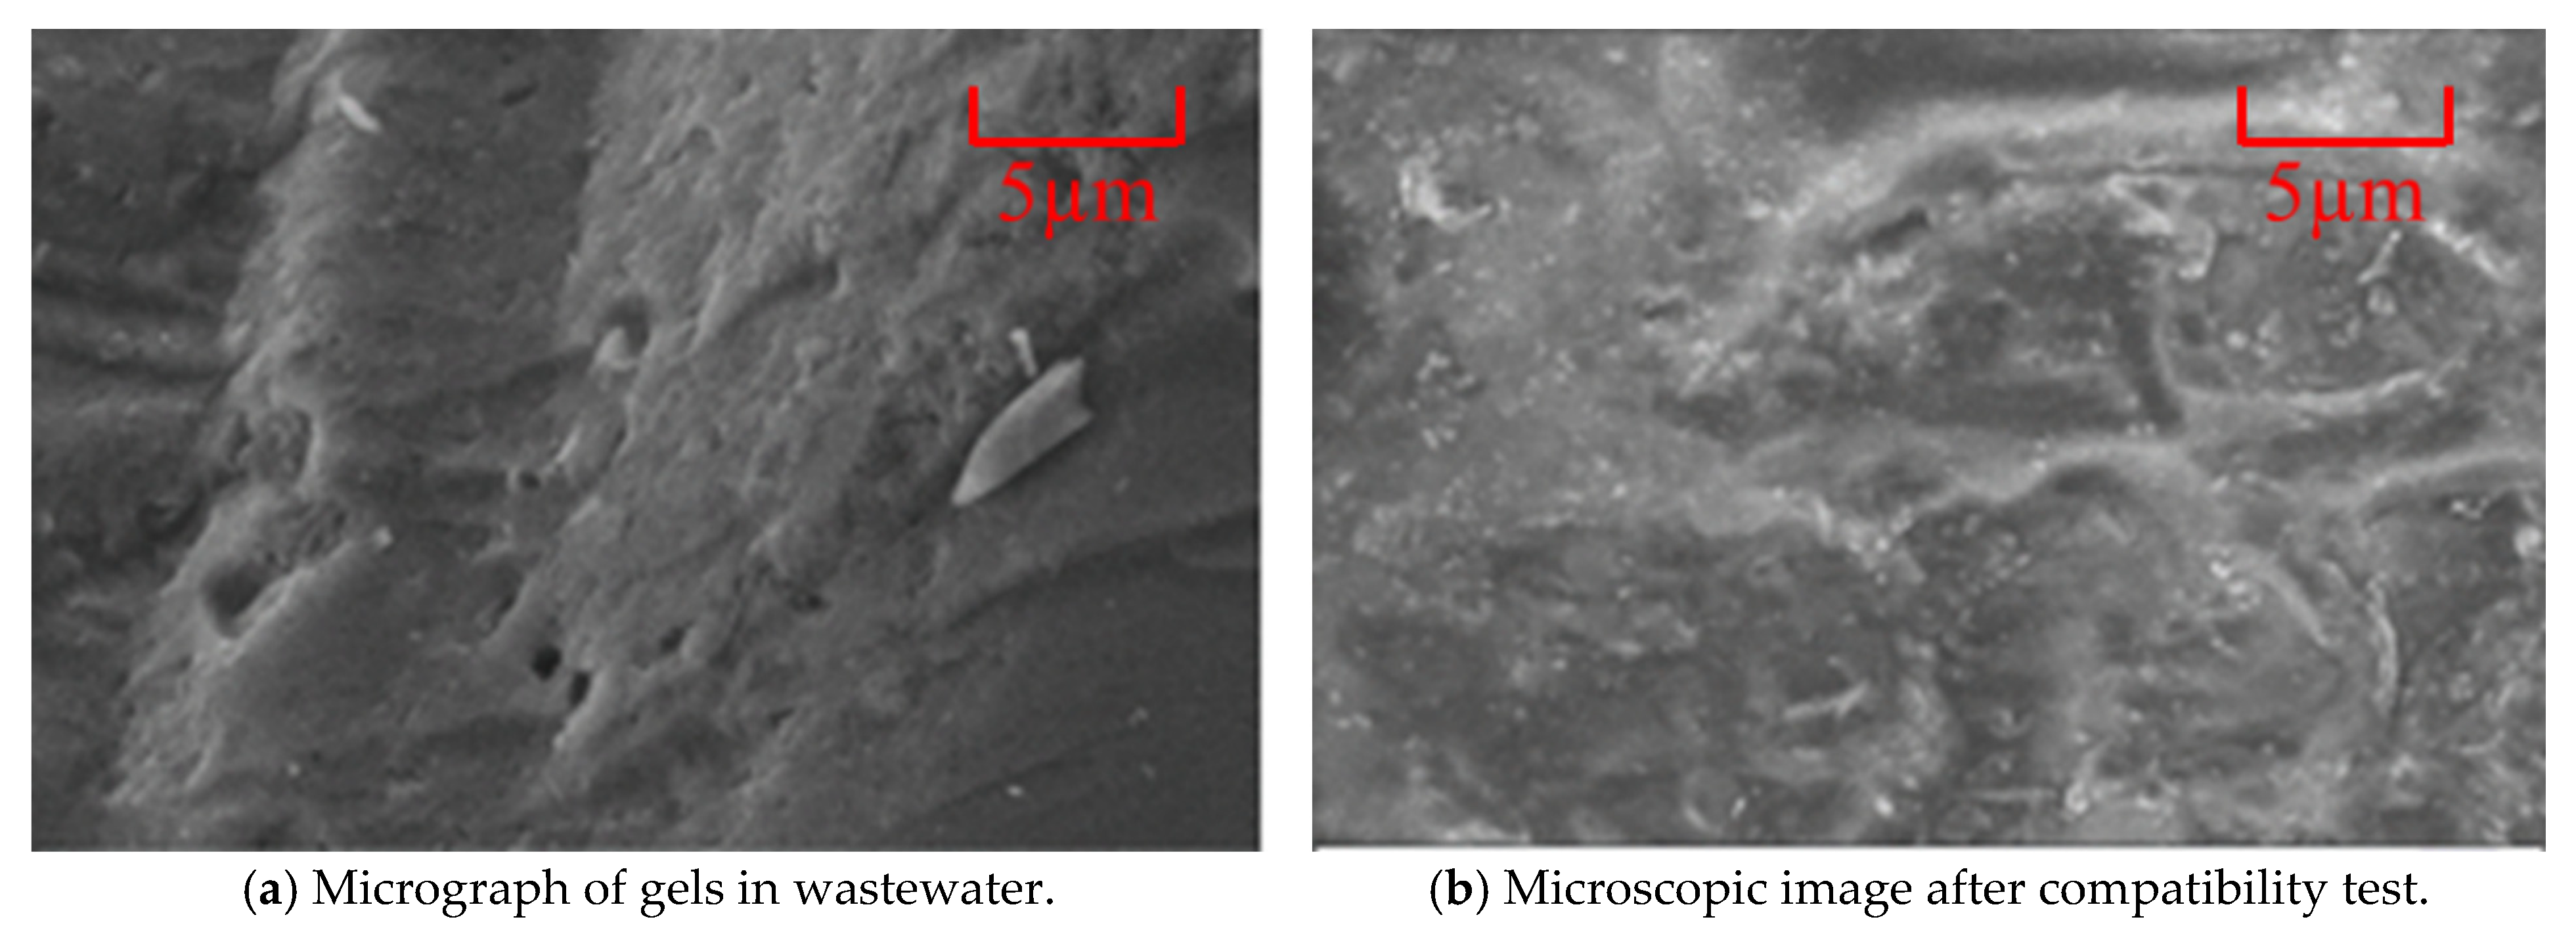
The compatibility tests of wastewater and freshwater indicated that, during the mixing process, flake-like, block-like, or flocculent suspensions with particle sizes greater than 10 µm were formed. In the core compatibility tests, the particles formed mainly had sizes ranging from 10 to 80 µm. After undergoing processes such as adsorption, aggregation, and deposition, the overall structure became loose and exhibited porous or layered characteristics. These findings suggest that, in the process of wastewater reinjection, analyzing the morphology and particle size distribution of suspended particles can aid in determining the waterflooding status of the reservoir, thus providing a theoretical basis for identifying flooded layers and optimizing injection and production adjustments.
(4)
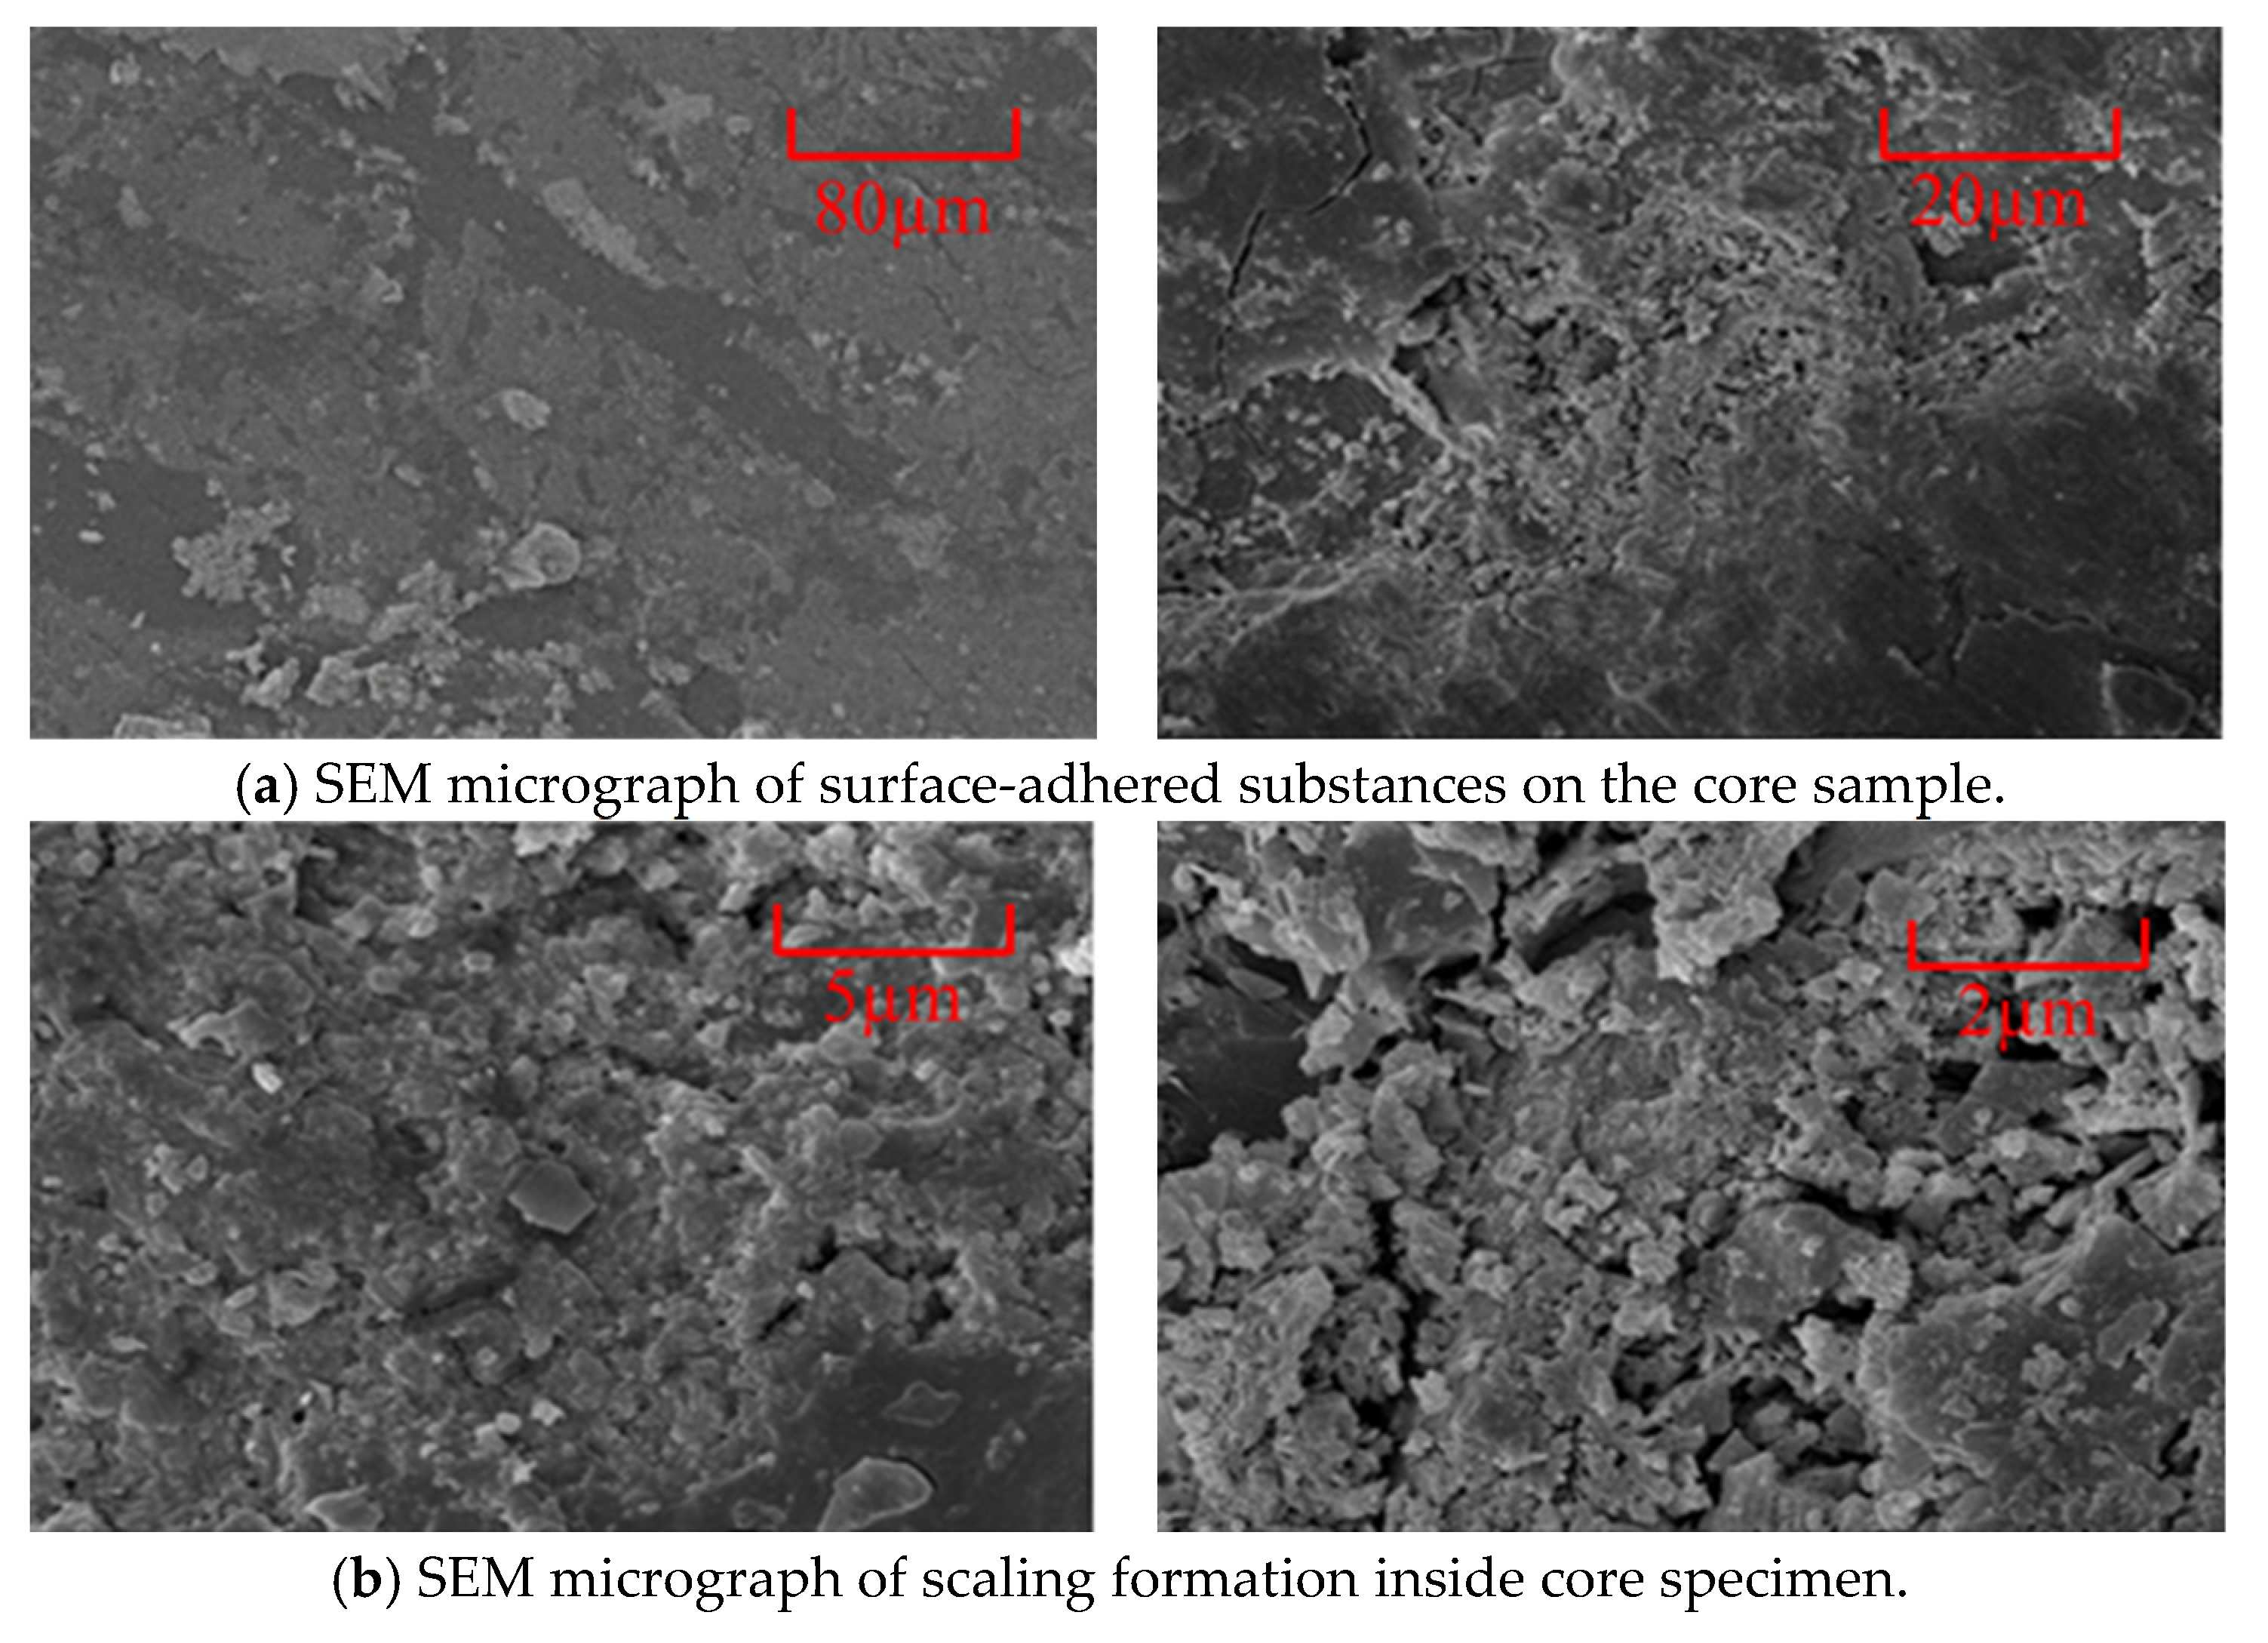
Using comprehensive methods such as water compatibility experiments, wastewater mass spectrometry analyses, and core-scaling characteristics, the primary and secondary causes of reservoir damage in wastewater injection wells were identified. The cascading mechanism of reservoir damage due to wastewater injection was systematically clarified: ① throat blockages caused by suspended solids; ② the chemical precipitation of metal ions; and ③ the expansion of clay minerals. To address these damage issues, a physical–chemical combined deblocking technology was proposed, which first removes suspended solids and particles through multi-stage fine filtration and then uses a weak-acidity organic acid composite agent to inhibit metal ion precipitation and dissolve blockages in the core.

Author Contributions

Methodology, J.C.; software, L.D.; validation, J.C.; data curation, L.W.; writing—original draft preparation, J.C.; writing—review and editing, Y.W.; visualization, L.W.; supervision, L.W.; funding acquisition, Y.W. All authors have read and agreed to the published version of the manuscript.

Funding

This study was supported by the National Natural Science Foundation of China (grant number 51874045).

Data Availability Statement

The raw data supporting the conclusions of this article will be made available by the authors upon request.

Acknowledgments

The authors would like to thank the editor and the anonymous referees for their helpful comments and suggestions.

Conflicts of Interest

The authors declare no conflicts of interest.

Appendix A

Table A1. Properties of injected water and physical properties of core samples.
Mineral Content
(mg/L)
Sample Properties
Well NumberSub-Layer NumberSample NumberDepth
(m)
Length
(cm)
Diameter
(cm)
Porosity
(%)
Permeability
(mD)
Ji+12A21-42633.205.9862.51212.3210.67
500Ji+12A21-52633.776.0622.52513.926.95
500Ji+16B17-33377.673.7592.51515.2310.98
500Ji+16B17-43243.707.9302.50816.4522.15
3000Ji+119X2032674.624.1902.47513.883.10
3000Ji+113X552681.854.5432.49314.9913.25
3000Ji+119X2042531.657.0232.51817.1219.88
6000Ji+114X782516.006.8602.50214.555.42
6000Ji+116X993239.635.3182.49715.0111.95
6000Ji+114X652778.406.1182.48816.0235.60
10000Ji+116X1013004.295.6622.49514.753.05
10000Ji+114X802650.753.5492.53217.308.12
10000Ji+113X472934.067.2222.48913.6515.03
Table A2. Core parameters for compatibility experiments between polymer-containing clean-produced water mixtures and the reservoir.
Freshwater/
Produced Water Ratio
Sample Properties
Well NumberSub-Layer NumberSample NumberDepth
(m)
Length
(cm)
Diameter
(cm)
Porosity
(%)
Permeability
(mD)
Ji+21A1-128545.9862.51211.129.20
1:0Ji+21A1-22854.56.0622.52512.7612.68
1:0Ji+21A1-328553.7592.51514.2112.85
1:1Ji+21A1-42855.57.9302.50814.4513.02
1:1Ji+21A1-528564.1902.47514.1213.15
1:3Ji+21A1-62856.54.5432.49315.9313.24
1:3Ji+21A1-728577.0232.51816.0113.33
1:5Ji+21A1-82857.56.8602.50212.3413.41
1:5Ji+21A1-928585.3182.49711.8913.47
0:1Ji+21A1-102858.56.1182.48813.1213.50
0:1Ji+21A1-1128595.6622.49514.1113.08
Table A3. Core parameters for permeability damage evaluation experiments of reservoir sand under varying oil saturations.
Oil Concentration
(mg/L)
Sample Properties
Well NumberSub-Layer NumberSample
Number
Depth
(m)
Length
(cm)
Diameter
(cm)
Porosity
(%)
Permeability
(mD)
60Ji+21A1-1228604.5622.50211.8812.88
20Ji+21A1-132860.54.8622.51212.9112.91
20Ji+21A1-1428614.7602.51113.1312.05
40Ji+21A1-152861.55.8222.50012.4413.33
40Ji+21A1-1628624.6302.87212.2213.12
60Ji+21A1-172862.54.9892.49214.4112.22
60Ji+21A1-1828635.2222.54211.1513.02

References

  1. Liu, H.; Pei, X.H.; Luo, K.; Sun, F.C.; Zheng, L.C.; Yang, Q.H. Current status and trend of separated layer water flooding in China. Petrol. Explor. Dev. 2013, 40, 785–790. [Google Scholar] [CrossRef]
  2. Sun, H.; Yang, Y.; Wang, H.; Wang, J.; Wu, G.; Cui, Y.; Yu, Q. Distribution characteristics of remaining oil in extra-high water cutreservoirs and new technologies for enhancing oil recovery. J. China Univ. Pet. 2023, 47, 90–102. (In Chinese) [Google Scholar]
  3. Rajbongshi, A.; Gogoi, S.B. A review on oilfield produced water and its treatment technologies. Pet. Res.-China 2024, 9, 640–656. [Google Scholar] [CrossRef]
  4. Zhao, C.S.; Ren, Q.L.; Li, P.J. Low permeability reservoir water displacing oil and water flooding characteristic curve theory. Appl. Mech. Mater. 2014, 556–562, 4701–4704. [Google Scholar] [CrossRef]
  5. Hu, W.R.; Wei, Y.; Bao, J.W. Development of the theory and technology for low permeability reservoirs in China. Petrol. Explor. Dev. 2018, 45, 685–697. [Google Scholar] [CrossRef]
  6. Chen, B.; Zhao, L.; Wang, C.S.; Chen, S.J.; Wu, X.Y.; Li, Q.; Zuo, Q.Q. The analysis of formation of polymer-containing oily sludge produced during the wastewater treatment in offshore oilfield. Energy Sci. Eng. 2018, 6, 675–682. [Google Scholar] [CrossRef]
  7. Liu, Y.G.; Chen, H.X.; Tang, H.M.; Feng, Y.T.; Pang, M. Mechanism of scaling on reservoir formation damage by polymer-containing wastewater re-injection. Desalination Water Treat. 2019, 139, 7–13. [Google Scholar] [CrossRef]
  8. Chen, H.X.; Tang, H.M.; Duan, M.; Liu, Y.G.; Liu, M.; Zhao, F. Oil-water separation property of polymer-contained wastewater from polymer-flooding oilfields in Bohai Bay, China. Environ. Technol. 2015, 36, 1373–1380. [Google Scholar] [CrossRef]
  9. Peng, P.; Guo, S.H.; Li, L.H.; Jin, H.; Ge, Z.W.; Guo, L.J. Supercritical water gasification mechanism of polymer-containing oily sludge. Int. J. Hydrogen Energy 2021, 46, 26834–26847. [Google Scholar] [CrossRef]
  10. Jia, J. Identification of Water-Flooded Layers and Evaluation of Flooded Levels in Fractured Tight Sand Oil Reservoir. Processes 2024, 12, 2426. [Google Scholar] [CrossRef]
  11. Liu, J.Z.; Liu, X.Y.; Guo, L.F.; Shi, G.N.; Du, H. Application of Random Forests Classifier in Water Flooded Layer Identification. In Proceedings of the 2nd IYSF Academic Symposium on Artificial Intelligence and Computer Engineering, Xi’an, China, 8–10 October 2021; Volume 12079. [Google Scholar]
  12. Yi, X.D.; Zhang, M.L.; Qin, L.B.; Lin, J.H. Reservoir water flooding evaluation based on electromagnetic wave logging permittivity and conductivity inversion. J. Appl. Geophys. 2023, 216, 105159. [Google Scholar]
  13. Gomaa, S.; Soliman, A.A.; Mohamed, A.; Emara, R.; Attia, A.M. New Correlation for Calculating Water Saturation Based on Permeability, Porosity, and Resistivity Index in Carbonate Reservoirs. ACS Omega 2022, 7, 3549–3556. [Google Scholar] [CrossRef] [PubMed]
  14. Guo, Y.H.; Pan, B.Z.; Zhang, L.H.; Lei, J.; Fan, Y.F.; Ruhan, A.; Yan, D.D.; Zhao, Y.Q. A study on water saturation predictions in igneous reservoirs based on the relationship between the transverse relaxation time and the resistivity index. J. Petrol. Sci. Eng. 2022, 208, 109519. [Google Scholar] [CrossRef]
  15. Han, Y.J.; Zhou, C.C.; Yu, J.; Li, C.L.; Hu, F.L.; Xu, H.J.; Yuan, C. Experimental investigation on the effect of wettability on rock-electricity response in sandstone reservoirs. Fuel 2019, 239, 1246–1257. [Google Scholar] [CrossRef]
  16. Liu, G.F.; Wang, H.L.; Tang, J.C.; Liu, Z.K.; Yang, D.Y. Effect of wettability on oil and water distribution and production performance in a tight sandstone reservoir. Fuel 2023, 341, 127680. [Google Scholar] [CrossRef]
  17. Wu, F.; Wen, Z.; Yao, C.; Wang, X.H.; Xi, Y.P.; Cong, L.L. Numerical Simulation of the Influence of Pore Structure on Resistivity, Formation Factor and Cementation Index in Tight Sandstone. Acta Geol. Sin.-Engl. 2020, 94, 290–304. [Google Scholar] [CrossRef]
  18. Sun, Z.H.; Mehmani, A.; Torres-Verdín, C. Pore-Scale Investigation of the Electrical Resistivity of Saturated Porous Media: Flow Patterns and Porosity Efficiency. J. Geophys. Res.-Solid Earth 2021, 126, e2021JB022608. [Google Scholar] [CrossRef]
  19. Suman, R.J.; Knight, R.J. Effects of pore structure and wettability on the electrical resistivity of partially saturated rocks—A network study. Geophysics 1997, 62, 1151–1162. [Google Scholar] [CrossRef]
  20. Bian, H.L.; Guan, J.; Mao, Z.Q.; Ju, X.D.; Han, G.Q. Pore structure effect on reservoir electrical properties and well logging evaluation. Appl. Geophys. 2014, 11, 374–383. [Google Scholar] [CrossRef]
  21. Frota, R.A.; Tanscheit, R.; Vellasco, M. Fuzzy logic for control of injector wells flow rates under produced water reinjection. J. Petrol. Sci. Eng. 2022, 215, 110574. [Google Scholar] [CrossRef]
  22. Delanka-Pedige, H.M.K.; Zhang, Y.Y.; Young, R.B.; Wang, H.Y.; Hu, L.; Danforth, C.; Xu, P. Safe reuse of treated produced water outside oil and gas fields? A review of current practices, challenges, opportunities, and a risk-based pathway for produced water treatment and fit-for-purpose reuse. Curr. Opin. Chem. Eng. 2023, 42, 100973109057. [Google Scholar] [CrossRef]
  23. van den Hoek, P.J.; Matsuura, T.; de Kroon, M.; Gheissary, G. Simulation of produced water reinjection under fracturing conditions. SPE Prod. Oper. 1999, 14, 166–176. [Google Scholar] [CrossRef]
  24. Ochi, J.; Dexheimer, D.; Corpel, P.V. Produced-Water-Reinjection Design and Uncertainties Assessment. SPE Prod. Oper. 2014, 29, 192–203. [Google Scholar] [CrossRef]
  25. Abou-Sayed, A.S.; Zaki, K.S.; Wang, G.; Sarfare, M.D.; Harris, M.H. Produced water management strategy and water injection best practices: Design, performance, and monitoring. SPE Prod. Oper. 2007, 22, 59–68. [Google Scholar] [CrossRef]
  26. Sun, Z.X.; Xu, Y.; Yao, J.; Sun, Z.L.; Liu, J.R. Numerical simulation of produced water reinjection technology for water-soluble gas recovery. J. Nat. Gas. Sci. Eng. 2014, 21, 700–711. [Google Scholar] [CrossRef]
  27. Wrobel, J.S.; Nachbin, A.; Marchesin, D. Numerical simulation of injectivity loss in stratified reservoirs. Commun. Numer. Methods Eng. 2007, 23, 507–520. [Google Scholar] [CrossRef]
  28. Yin, S. Numerical analysis of thermal fracturing in subsurface cold water injection by finite element methods. Int. J. Numer. Anal. Methods Geomech. 2013, 37, 2523–2538. [Google Scholar] [CrossRef]
  29. Jin, X.; Wei, Y.X.; Hu, S.Y.; Li, K.Q.; Xu, L.Z.; Shang, Y.B.; Zong, Y.K.; Shi, X.; Xu, L.; Bai, X.; et al. Significance of ozonation on surfactant-polymer flooding produced water coagulation: Water quality deterioration inhibition, high-standard reinjection and mechanism. Sep. Purif. Technol. 2024, 328, 125035. [Google Scholar] [CrossRef]
  30. Alhomadhi, E.S.; Almobaraky, M.A.; Alahaidib, I.A. Using polyester fiber media for treating produced oily water at different oil concentrations. Oil Gas-Eur. Mag. 2019, 45, 174–179. [Google Scholar]
  31. Buret, S.; Nabzar, L.; Jada, A. Water Quality and Well Injectivity: Do Residual Oil-in-Water Emulsions Matter? SPE J. 2010, 15, 557–568. [Google Scholar] [CrossRef]
  32. Azizov, I.; Dudek, M.; Oye, G. Emulsions in porous media from the perspective of produced water re-injection-A review. J. Pet. Sci. Eng. 2021, 206, 109057. [Google Scholar] [CrossRef]
  33. SY/T 5385-2007; Geological Technical Requirements for Trial Production of Conventional Oil Reservoirs. National Development and Reform Commission: Beijing, China, 2007.
  34. SY/T 5336-2023; Core Analysis Methods. National Energy Administration: Beijing, China, 2023.
  35. Daqing Oilfield, CNPC. Design Code for Surface Engineering Construction of Daqing Oilfield (Q/SY DQ 0639-2015) [S]; Daqing Oilfield Co., Ltd.: Daqing, China, 2015. [Google Scholar]
  36. Chen, Q.; Gao, Q.; Wang, X.P.; Xia, J.C.; Zhang, S.D.; Tang, K.; Li, C.T. Research Progress and Prospect of Polymerized Wastewater Treatment Technology. Water & Wastewater Engineering. Water Wastewater Eng. 2025, 61, 169–176. (In Chinese) [Google Scholar]
  37. Chen, W.J.; Jing, B.; Tan, G.R.; Meng, F.X.; Zhang, J.; Yin, X.Q. Research on the optimization of polymer-bearing wastewater treatment process in offshore oilfields. Ind. Water Treat. 2016, 36, 80–83. (In Chinese) [Google Scholar]
  38. Li, Q.; Yin, X.Q.; Zhai, L.; Jing, B. Field Test of Electrochemical Treatment of Wastewater Containing Polymer in Offshore Oilfield. Oil Gas Field Surf. Eng. 2016, 42, 78–81. [Google Scholar]
  39. Wang, S.; Yu, Z.C.; Zhong, L.B.; Han, L.; Niu, Y.L.; Li, Z.; Wu, J. Degradation of Polymer-Containing Produced Water by Fe Complex-UV Catalyzed Ozonation. Acta Pet. Sin. (Pet. Process. Sect.) 2016, 32, 981–986. (In Chinese) [Google Scholar]
  40. Lv, Z.F.; Zhan, F.T.; Wang, Z.X.; Zhang, S.D. Separation and composition characterization of acidic components in waterproduced by polymer flooding in Gudao Oilfield. J. Fuel Chem. Technol. 2008, 36, 588–593. (In Chinese) [Google Scholar]
  41. Wang, Q.J.; Yang, X.Y.; Li, J.; Wang, Q.H.; Gui, Y.f.; Pei, M.; Shi, Q.; Chen, C.M. Thoughts and suggestions on collaborative treatment of pollutant sources in oilfield production processes: An example taking the inhibition of oil mud formation in the treatment process of polymer flooding produced water. Chin. J. Environ. Eng. 2024, 18, 1475–1479. (In Chinese) [Google Scholar]
  42. Jia, C.Q.; Hu, J.C.; Sepehrnoori, K. Numerical Studies of Unstable Fingering Flow in a Water-Oil System. In Proceedings of the SPE Improved Oil Recovery Conference, Tulsa, Oklahoma, USA, 21–23 April 2024; p. D031S016R002. [Google Scholar]
  43. Mohammadi, L.; Rahdar, A.; Bazrafshan, E.; Dahmardeh, H.; Susan, M.A.; Kyzas, G.Z. Petroleum Hydrocarbon Removal from Wastewaters: A Review. Processes 2020, 8, 447. [Google Scholar] [CrossRef]
  44. Yu, J.F.; Chen, H.; Cao, Y.F.; Wen, M.; Zhai, X.P.; Zhang, X.T.; Hao, T.C.; Peng, J.L.; Zhu, W.T. Experimental Evaluation of Blockage Resistance and Position Caused by Microparticle Migration in Water Injection Wells. Processes 2024, 12, 2275. [Google Scholar] [CrossRef]
  45. Wen, H.; Guo, X.M.; Zhang, D.; Wei, G.M.; Wang, W.; Fan, S.X.; Zhang, W.J. Response characteristics of coal microstructure with liquid CO2 acidizing treatment: An experimental study. J. Loss Prev. Process 2023, 85, 105175. [Google Scholar] [CrossRef]
Figure 2. Variation in resistivity with water saturation during the displacement process.
Processes 13 01511 g002
Figure 3. Relationship curves of resistivity affected by injection water with different salinities.
Processes 13 01511 g003
Figure 4. Pore throat and pore radius distribution frequency of rock samples before and after the displacement experiment.
Processes 13 01511 g004
Figure 5. CT processed images under different displacement states.
Processes 13 01511 g005
Figure 6. Mass spectrum of sewage.
Processes 13 01511 g006
Figure 7. Diagram of compatibility experiment process between sewage and clean water.
Processes 13 01511 g007
Figure 8. Microscopic diagram after compatibility experiment of sewage and core.
Processes 13 01511 g008
Figure 9. CT scan images before and after oil-containing contamination displacement.
Processes 13 01511 g009
Figure 10. Damage and recovery of reservoir microstructure caused by sewage reinjection.
Processes 13 01511 g010
Table 1. Results of reservoir damage evaluation experiments with polymer-containing clean and produced water mixtures.
Core NumberClear Water/
Sewage Ratio
Ka
(mD)
Kr
(mD)
I
(%)
A1-21:012.689.2027.41%
A1-31:012.859.5225.89%
A1-41:113.029.9723.36%
A1-51:113.159.5427.41%
A1-61:313.249.3429.40%
A1-71:313.3310.0824.37%
A1-81:513.419.1831.54%
A1-91:513.478.7934.72%
A1-100:113.5010.9918.52%
A1-110:113.0811.0415.54%
Table 2. Results of reservoir permeability damage evaluation experiments under different oil saturations.
Core NumberOil Content
(mg/L)
Ka
(mD)
Kr
(mD)
I
(%)
A1-132012.9112.225.32%
A1-142012.0511.494.58%
A1-154013.3312.049.62%
A1-164013.1211.978.74%
A1-176012.2210.0917.41%
A1-186013.0210.9016.27%
Disclaimer/Publisher’s Note: The statements, opinions and data contained in all publications are solely those of the individual author(s) and contributor(s) and not of MDPI and/or the editor(s). MDPI and/or the editor(s) disclaim responsibility for any injury to people or property resulting from any ideas, methods, instructions or products referred to in the content.

