Article

Effect of Precipitated Bubbles on the Behavior of Gas–Liquid Two-Phase Flow in Ruhrstahl Heraeus Refining

1
School of Materials Science and Engineering, Taiyuan University of Science and Technology, Taiyuan 030024, China
2
Shanxi Jianbang Group Co., Ltd., Linfen 043000, China
*
Author to whom correspondence should be addressed.
Processes 2025, 13(5), 1484; https://doi.org/10.3390/pr13051484
Submission received: 14 April 2025 / Revised: 6 May 2025 / Accepted: 7 May 2025 / Published: 12 May 2025
(This article belongs to the Special Issue Advanced Ladle Metallurgy and Secondary Refining)

Abstract

:
In this study, through RH water model simulation experiments, the effects of precipitation bubbles on the two-phase flow pattern, liquid steel flow behavior, and flow characteristics in an RH reactor during the whole decarburization process were comparatively investigated and analyzed by using quasi-counts that reflected the similarity of the precipitation bubble phenomenon. The experimental results show that an increase in precipitation bubbles is positively related to an increase in circulating flow rate, a reduction in mixing time, and an increase in gas content and negatively related to the residence time of liquid steel in the vacuum chamber. The two-phase flow pattern of the rising tube under the influence of precipitation bubbles includes bubble flow, slug flow, mixing flow, and churn flow. Under the influence of precipitation bubbles, the liquid surface spattering inside the vacuum chamber is reduced, the fluctuation amplitude is reduced, the efficiency of liquid steel processing is improved, it is not easy for cold steel to form, and the fluctuation frequency is increased, which is conducive to increasing the surface area of the vacuum chamber; the bubbles’ rising, aggregating, and crushing behavior increases the stirring effect inside the vacuum chamber, which is conducive to improving the decarburization and mass transfer rate. Under the influence of the precipitated bubbles, the concentration gradient between the ladle and the vacuum chamber is increased, which accelerates the mixing speed of the liquid steel in the ladle, and the volume of the dead zone is reduced by 50%. The lifting gas flow rate can be appropriately reduced in the plant.

1. Introduction

With the rapid development of industries such as transportation and automotive, the demand for high-performance steel materials is increasing. The RH (Ruhrstahl Heraeus) refining process, as a key technology for producing high-strength steel with zero energy consumption, is widely used due to its advantages of a good refining effect, short processing cycle, high processing efficiency, wide application range, economic benefits, and high controllability [1,2,3,4,5]. It is considered the main technique for reducing the carbon content of molten steel. However, there is still a gap between its stable manufacturing level and the advanced international level [6,7,8,9,10].
The core design idea of the RH (Ruhrstahl Heraeus) process is to utilize the principle of physicochemical reactions in a vacuum environment. This is achieved through a sophisticated vacuum chamber system and immersion pipe configuration to realize the circulatory treatment of molten steel [11,12,13,14,15,16]. Through multiple such circulatory operations, it is possible to effectively remove non-metallic inclusions and excess gas content from the molten steel, thereby obtaining purer molten steel with better performance [11,17,18,19,20,21,22,23].
Lifeng Zhang et al. [24] studied the fluid flow and mixing phenomena in the RH (Ruhrstahl Heraeus) refining process through physical simulation. Bohong Zhu et al. [25] investigated the gas–liquid two-phase flow behavior in the RH reactor through numerical simulation, exploring the influence of different interphase forces on the flow field. Yihong Li et al. [26] researched the influence of molten steel flow patterns in the vacuum chamber on rapid decarburization and summarized the corresponding flow pattern diagrams. Gujun Chen et al. [27] analyzed the fluid flow and inclusion behavior in the RH refining process through numerical simulation. Chang Liu et al. [28] systematically studied the transport phenomena in the RH vacuum refining process through physical and numerical simulations, including fluid flow and homogenization phenomena, bubble behavior, and decarburization reactions. Jiandu Yuan et al. [29] studied the arrangement of side-blown argon nozzles and the volume of blown gas on the gas–liquid two-phase circulatory flow in the RH system. Pengkai Yu et al. [30] studied the dissolution of oxygen on the surface of molten steel in the vacuum chamber. The changes in concentration [C] in the RH (Ruhrstahl Heraeus) reactor and the decarburization reaction rates in various regions were determined. Without oxygen blowing, the internal decarburization reaction in the molten steel of the vacuum chamber contributed the most to the total decarburization amount, accounting for 55.9%, while the proportions of the argon bubble surface and the free surface of the molten steel in the vacuum chamber were 32.5% and 11.6%, respectively. Table 1 shows the dimensions of RH prototypes and their corresponding geometric similarity ratios in select existing studies.
However, in the RH reactor, there are not only argon bubbles acting as lifting bubbles but also CO bubbles precipitated by the decarburization reaction. The formation and growth of CO bubbles, as well as the collision and breakage of different bubbles under the action of a circulatory driving force, is a complex process. At present, most physical simulation studies on RH ignore the precipitation of CO bubbles, which leads to differences between the simulated decarburization process and the prototype RH decarburization process. Therefore, this paper presents RH water model simulation experiments using dimensionless numbers that can reflect similar phenomena to bubble precipitation to simulate the gas precipitation amount at different stages of RH decarburization. A comparative study and analysis are conducted on the influence of bubble precipitation at different decarburization times on the two-phase flow pattern, molten steel flow behavior, and flow characteristics in the main reaction areas within the RH reactor during the entire decarburization process.

2. Materials and Methods

2.1. Experimental Principles

Since the physical properties of water at 20 °C and standard atmospheric pressure are very similar to those of steel at steelmaking temperatures, as shown in Table 2, the ratio of their densities and the ratio of their absolute viscosities are both about 7:1, the kinematic viscosity of the two fluids is basically the same, and the momentum diffusion of the two substances is relatively low. Due to the thermal radiation, chemical reactions, and high-temperature erosion effects of molten steel under extreme conditions, these phenomena cannot be replicated by water models at room temperature. Furthermore, in high-temperature environments, the solubility of gases is significantly lower, resulting in reduced viscous drag on rising bubbles and facilitating gas escape. Water models therefore also inherently have certain limitations.

2.1.1. Geometric Similarity

This experiment is based on the principle of similarity, using the flow state of water at 20 °C to simulate the flow state of liquid steel in actual production. Taking the 300-ton RH refining unit of a certain steel plant as the prototype, a test model was developed according to the scale of λ = 1/6 for simulation research. The dimensions and physical parameters of the RH prototype and the model are shown in Table 3.

2.1.2. Dynamic Similarity

In water simulation experiments, besides ensuring geometric similarity, it is also necessary to ensure that the decisive similarity criteria of the model and the prototype are equal. Therefore, in the process of RH water simulation, it is also necessary to ensure the similarity of the fluid flow state and the bubble formation process. Experimental studies show that in the low Reynolds number interval of Re < 2300, the flow state is dominated by the viscous force, presenting laminar characteristics; when Re enters the critical transition interval of 2300–4000, the flow instability triggers a turbulence transition, and the sensitivity of the Reynolds number to the turbulence intensity and the velocity gradient distribution is gradually reduced; when Re breaks through the threshold of 4000 and enters the fully developed turbulence area, the flow structure presents self-modeling characteristics. When Re exceeds the 4000 threshold and enters the fully developed turbulence zone, the flow field structure shows self-modeling characteristics, and the correlation between the Reynolds number, the turbulent kinetic energy dissipation rate, and the time-averaged velocity field weakens significantly. When the model and prototype are within the same self-modeling regime, the effect of the Reynolds number on the fluid flow characteristics can be disregarded.
This experiment uses the method of blowing air into water to simulate the process of blowing argon gas into liquid steel on site. It is only necessary to determine that the Froude number of the prototype is equal to that of the model to ensure the similarity of their flow behaviors. Based on this principle, the gas flow rate in the riser of the model can be determined. The definition of the modified Froude number is as follows:
F r = ρ g v 2 g H ρ l = c o n s t
where v is the characteristic velocity, m/s; H is the height of the blowhole from the liquid surface, m; g is the gravitational acceleration, m/s2; Qg is the gas density, kg/m3; and Ql is the liquid density, kg/m3.
After the inversion, the ratio of the modeled gas volume to the actual gas volume can be obtained:
Q air 0 Q A r 0 = λ 5 ρ A r 0 ρ a i r 0 ρ w a t e r ρ s t e e l ( P v , m + ρ w a t e r g H m ) ( P v , p + ρ s t e e l g H p ) T p T m
where Q0air is the model blowing the standard flow of air, NL/min; Q0Ar is the prototype blowing the standard flow of argon, NL/min; λ is the ratio of the model size to the size of the prototype; Q0air is the standard density of air, kg/m3; Q0Ar is the standard density of argon, kg/m3; Qwater is the density of water, kg/m3; Qsteel is the density of molten steel, kg/m3; Pv,m is the model vacuum chamber pressure, Pa; Pv,p is the prototype vacuum chamber pressure, Pa; g is the acceleration of gravity, m/s2; Hm is the height of the model blowhole from the liquid surface, m; Hp is the height of the prototype blowhole from the liquid surface, m; Tm is the temperature of the blown gas and water in the model, °C; Tp is the temperature of the blown gas and steel in the prototype, °C; and T0 is the temperature of the standard state, °C.

2.1.3. Precipitated Bubble Similarity Criteria

For the precipitated bubbles, the experiment uses the method of blowing air into the water to simulate the carbon monoxide gas precipitated by the carbon–oxygen reaction in the actual refining process in the field and to ensure that the behaviors of the actual precipitated bubbles are similar to the flow behaviors of the simulated bubbles in the model vacuum chamber and the rising tube. By applying the Pi theorem to the 9 physically independent quantities with distinct dimensions, we obtained 6 dimensionless π terms, which were then combined with established similarity criteria related to surface tension, inertial forces, buoyancy, and gravity for calculation purposes, as shown in Table 4:
The ratio of buoyancy to gravity is obtained by combining the Galileo number with the Grashof number:
F b G = ρ ρ 0 g l 3 ρ g l 3
Considering surface tension, inertial force, buoyancy, and gravity at the same time, then the following is true:
σ Δ ρ g l 2 × 16 Q 2 ρ g π 2 g l 5 ρ l × Δ ρ g l 3 ρ l g l 3 = σ 16 Q 2 ρ g π 2 ρ l 2 g 2 l 7
The physical significance of this is the simultaneous consideration of the ratio of surface tension, inertial force, and buoyancy to gravity, which is used in this paper to indicate that the model is similar to the behavior of fluid flow under the influence of a prototypical precipitated bubble.
P b = σ 16 Q 2 ρ g π 2 ρ l 2 g 2 l 7
The following is derived from quantitative analysis:
Q p Q m = σ m 16 ρ c o 2 π 2 ρ s t e e l 2 g 2 σ p 16 ρ c o π 2 ρ w a t e r 2 g 2 λ 7
where Qm is the flow rate of air blown into the model, L/min; Qp is the flow rate of argon gas blown into the prototype, L/min; λ is the ratio of the size of the prototype to the size of the model; ρco2 is the density of carbon dioxide gas, kg/m3; ρco is the density of carbon monoxide gas, kg/m3; ρwater is the density of water, kg/m3; ρsteel is the density of liquid steel, kg/m3; g is the acceleration of gravity, m/s2; σp describes the prototype with liquid steel and the surface tension of carbon monoxide, N/m; and σm describes the model with water and the surface tension of carbon dioxide, N/m.

2.1.4. Vacuum Degree Similarity

RH refining is conducted under vacuum conditions; therefore, ensuring similarity in vacuum degree between the model and the prototype is critical. Since the vacuum degree correlates with the liquid level height in the vacuum chamber, water model experiments can indirectly regulate vacuum degree by adjusting the liquid level height.
A pressure balance relationship exists as follows in both the model and the prototype:
ρ w g h m + P m = P 0
ρ s g h p + P p = P 0
Since the geometric similarity of the liquid level height in the vacuum chamber must be maintained at hm/hp = λ = 1/6, substituting this into the above equation yields the following:
Δ p m Δ p p = p 0 p m p 0 p p = ρ w g h m ρ s g h p = 1000 × 1 7000 × 6 = 1 42
P m = P 0 Δ P p / 28
where ρw is the density of water, kg/m3; ρs is the density of steel, kg/m3; hm is the height difference between the vacuum chamber liquid level and the ladle liquid level in the model, mm; hp is the height difference between the vacuum chamber liquid level and the ladle liquid level in the prototype, mm; pm is the vacuum chamber pressure in the model, Pa; pp is the vacuum chamber pressure in the prototype, Pa; Δpm is the pressure difference in the model, Pa; and Δpp is the pressure difference in the prototype, Pa.

2.2. Experimental Setup

The schematic diagram of the experimental model of the 300-ton RH refining unit is shown in Figure 1. It mainly includes experimental devices such as the RH model vacuum chamber blowing plate; experimental auxiliary devices, including an electric hoist, support frame, gas separation chamber, and air compressor; and detecting devices, including a gas flow meter, pressure gauge, conductivity meter, wave height meter, data acquisition system, and so on.
During the experiment, the CO bubble precipitation was simulated inside the rising tube and vacuum chamber, which are the main locations for the RH decarbonization reaction. Part of the precipitated bubbles in the rising tube entered the RH circulation system through 16 blowholes in the rising tube, and part of the precipitated bubbles in the vacuum chamber were uniformly blown into the RH circulation system through the bottom of the vacuum chamber, as shown in Figure 1b.

2.3. Experimental Measurement Methods

(1)
Circulation flow
In the experiment, the circulating flow rate was measured using a portable ultrasonic flow meter. Two sensors were attached to both sides of the wall of the RH descending pipe at regular intervals in a Z-connection. This configuration is characterized by the fact that the sensors are not in contact with the fluid and do not have any effect on the fluid flow behavior. The principle is to use ultrasonic waves in different fluid states of different propagation speeds and generate a time difference; through the measurement of the time difference, the average flow rate of the liquid cross-section is calculated. When an ultrasonic flow meter is used to measure the flow rate of the falling pipe, the flow rate value is displayed in the display window in real time. After the fluid flow under the experimental conditions is stabilized, the flow rate value is recorded every 5 s, and then the average of 25 flow rate measurements is used as the cyclic flow rate value under the experimental conditions.
(2)
Mixing time
In the experiment, the mixing time was measured using a conductivity probe connected to a DJ800 experimental data acquisition system (University of Science and Technology Beijing, Beijing, China), with eight electrode probes fixed at different positions on the ladle. The conductivity probe was calibrated using a two-point method with standard solutions of lower and higher concentrations, covering the range of the experimental samples. Employing the stimulation–response technique, a saturated sodium chloride solution was dispensed through a drop tube, and conductivity measurements were gathered using a data acquisition system under varying experimental parameters. Subsequently, the temporal evolution of these conductivity values was analyzed. When the conductivity |Kt − K| ≤ 0.005 mS·cm−1, the steel solution was considered to have reached a sufficient degree of mixing under this experimental condition. For each set of parameters, five experiments were conducted. The maximum and minimum values from these experiments were excluded, and the average of the remaining data points was calculated to determine the final mixing duration for that specific parameter set.
(3)
Vacuum chamber dwell time
The flow behavior of the fluid inside the vacuum chamber determines the flow state of the fluid inside the ladle, and the decarburization process mainly occurs inside the vacuum chamber, which must be studied in depth. The residence time of the vacuum chamber is measured by the stimulus–response method. A tracer was injected in the rising tube near the bottom of the vacuum chamber, and three conductivity probes were installed at the outlet of the vacuum chamber to monitor the tracer concentration change. The vacuum chamber residence time was considered the average of the response time of the three point electrode probes. Five trials were conducted for each condition, and the highest and lowest results were discarded. The average of the three remaining values was then calculated to determine the final vacuum chamber dwell time for that specific condition.
(4)
Gas content
While there are many ways to measure the gas content of the liquid phase, this paper adopts the most commonly used method, that is, measuring the liquid level height HL before ventilation and the liquid level height HM after ventilation and using the ratio of the two to calculate the gas content β; the specific formula is shown in the following equation.
β = 1 H L H M

2.4. Experimental Program

The decarbonization reaction in the RH refining process can be expressed as follows:
[ C ] + [ O ] = CO   ( g )
According to the sampling results for carbon content in the whole process of decarbonization in the RH refining unit of a steel plant, the carbon content of the reaction in each time period is obtained, and using the above chemical equation, the CO gas flow rate precipitated by the reaction in each decarbonization time period can be obtained through the quasi-count of precipitated bubbles derived from the previous section and converted by the similarity principle, as shown in Table 5 below.
The gas blowing regime, pressure drop regime, and corresponding liquid level height in the vacuum chamber for each time period during the entire decarbonization process of the RH refining unit at a certain steel plant are shown in Table 6.
During the experiment, to simplify the procedure and ensure significant effects from evolved gas bubbles, the 2–8 min period of decarbonization was selected for designing the experimental scheme. The parameters of the model, including lift gas flow rate, gas bubble evolution flow rate, and vacuum chamber liquid level height, were derived from actual industrial data based on similarity principles and a scaling ratio. These values are presented in Table 7.

3. Results

3.1. Analysis of Gas–Liquid Two-Phase Flow in the Rising Tube Under the Influence of Precipitated Bubbles

Gas–liquid two-phase flow refers to the phenomenon of mixed gas and liquid flow in the same flow system, as well as its flow pattern based on the gas–liquid distribution pattern, interface characteristics, and flow dynamics. Shown in Table 8 are common flow patterns and their features.
The whole decarburization process under the influence of precipitated bubbles in the rising tube gas–liquid two-phase flow can be divided into four types of flow: At a decarburization time of 2 min, the liquid steel only exists in the rising tube, the decarburization rate is slow, the bubble pattern is mainly an ellipsoidal rise manifested as a few small bubbles adhering to the rise, and bubbles show the stable morphology of a bubble flow, as shown in Figure 2a. Upon an increase in the decarburization time of 2 min, with the increase in vacuum degree and lifting gas volume, the small bubbles start to collide and become large bubbles, and these bubbles are elongated into the shape of a bullet or plug; the liquid steel enters into the vacuum chamber through the ascending tube, and at this time, the liquid level of the vacuum chamber is relatively low, the bubble stroke is relatively short, and the time of the interaction of the bubbles is relatively short, representing a slug flow, as shown in Figure 2b. After a decarburization time of 3–5 min, with the further reduction in vacuum degree, the lifting volume further increases, the gas content inside the rising tube and vacuum chamber is higher, and small bubbles grow quickly and gather into big bubbles; in the process of the big bubbles rising, the liquid pressure on the bubbles decreases, and the big bubbles appear to be crushed, which generates more stirring energy in the vacuum chamber and improves the decarbonization rate inside the chamber, making it difficult for the bubble morphology to stabilize, representing a mixing flow, as shown in Figure 2c. After decarburization for 5 min, as the gas flow rate and gas content further increase, the collision between the bubbles inside the vacuum chamber is more intense, and the volumes of liquid and gas reach the same order of magnitude, creating a large number of bubbles in the liquid in the form of a torn mesh, with the larger bubbles containing liquid droplets; the flow of the gas phase and the liquid phase entangle with each other in the stirring process, creating a churn flow, as shown in Figure 2d.
The shape of bubbles is typically determined by combining the dimensionless Eötvös number and Reynolds number, as shown in Equations (1) and (2). Bubbles are captured using a high-speed camera and measured with image analysis software. The bubble shapes at different decarbonization times are summarized in Table 9.
E o = Δ ρ g d B 2 σ
R e = ρ B v B d B μ L
where the subscripts L and B denote the liquid and bubbles, respectively; ρ is the density; μ is the viscosity coefficient; σ is the surface tension; d is the bubble diameter; and v is the velocity.
In order to better identify and control the gas–liquid two-phase flow pattern in the updraft tube, it is necessary to study the critical transition conditions, since the change in the flow pattern in the updraft tube is closely related to the gas content change rate in the updraft tube. In the bubble flow area, the interaction between bubbles is small, and the gas content change rate increases with an increase in apparent gas velocity; when the flow pattern enters the transition zone and the mixing flow area, the interaction between bubbles increases, the small bubbles aggregate to form large bubbles, and the trend of the gas content change rate with the increase in apparent gas velocity is gradually flattened. Therefore, the different rates of change in the gas content with the apparent gas velocity can be used to identify the transition conditions of the flow pattern. Three wave height gauges were placed above the rising tube to measure the liquid surface height before and after aerating the rising tube, as shown in Figure 3, to determine the variation in gas content with apparent gas velocity at different liquid surface heights under the influence of precipitated bubbles. When the apparent gas velocity increases from 0.5 × 10⁻² m·s−1 to 1.5 × 10⁻² m·s−1, the gas content change rate grows the fastest, and at this time, a bubble flow is observed; when the apparent gas velocity is greater than 1.5 × 10⁻² m·s−1, the gas content change rate grows faster, and at this time, the flow pattern in the rising tube changes from a bubble flow to a slug flow. When the apparent gas velocity increases to 3.0 × 10⁻² m·s−1, the increase in gas content becomes slow, and then the slug flow changes into a mixed flow; when the apparent gas velocity increases to 5.0 × 10⁻² m·s−1, the increase in gas content becomes slow, and then the two-phase flow type changes from a mixed flow to a stirred flow.

3.2. Analysis of Gas–Liquid Two-Phase Flow in a Vacuum Chamber Under the Influence of Precipitated Bubbles

When the fluid first enters the vacuum chamber cycle, the vacuum chamber liquid level height is low, the circulation flow is low, the bubble stroke is short, and a large number of bubbles rise to the vacuum chamber after the violent outpouring, driven by a small amount of liquid inside the vacuum chamber violent splashing; at this time the decarbonization reaction is small, the amount of precipitated bubbles is small, and the liquid flow inside the vacuum chamber has less impact, as shown in Figure 4a. Precipitated bubbles show a small ellipsoidal rise, and the role of bubbles at the broken liquid surface is smaller, as shown in Figure 4d. When the decarburization is carried out for 3–5 min, the liquid level in the vacuum chamber rises, the circulation flow rate becomes faster, more bubbles pour into the vacuum chamber, the gas column disperses and forms a dispersed bubble flow in the direction of the descending tube, and the splashing above the ascending tube is reduced, as shown in Figure 4b. Under the influence of the precipitated bubbles, the number of bubbles inside the vacuum chamber increases, and as the force between the two phases increases, the precipitated bubbles and lifting bubbles get together and break, and the stirring energy increases, as shown in Figure 4e. When decarburization is carried out for 5 min, the argon bubble column is more dispersed, and the small dispersed bubbles formed in the rising tube are more crushed; the liquid surface splashing in the vacuum chamber disappears, and the liquid surface fluctuates violently but regularly, as shown in Figure 4c. Under the influence of the precipitated bubbles, the number of small bubbles inside the vacuum chamber increases, the bubbles cover a larger area, and the stirring energy of the bubbles is greater. Under the influence of the precipitated bubbles, the liquid surface fluctuation frequency increases and the fluctuation amplitude decreases, which is conducive to accelerating the decarburization rate of the vacuum chamber surface, as shown in Figure 4f. The flow pattern of the liquid steel in the vacuum chamber can be divided into three types: boiling flow, transitional flow, and fluctuating flow.
Table 10 shows the three basic flow patterns of molten steel in the vacuum chamber and their characteristics: boiling flow pattern, transitional flow pattern, and fluctuating flow pattern.
Similarly, after determining the two-phase flow pattern inside the vacuum chamber, in order to more accurately identify the flow pattern inside the vacuum chamber and control it, the average gas content with the change in the liquid surface height in the vacuum chamber is used to analyze the effect of precipitated bubbles under the influence of different average gas contents of the lifting gas flow, as shown in Figure 5. With the increase in the vacuum chamber liquid level, the average gas content in the lifting gas flow rate is reduced, and the average gas content reduction rate gradually slows down. The critical conversion conditions of the three types of flow are the boiling flow state to the transitional flow state critical for the vacuum chamber liquid level height of 50 mm and the transitional flow state to the fluctuating flow state of the critical vacuum chamber liquid level height of 80 mm.
Figure 6 shows a gas–liquid two-phase flow pattern schematic diagram, in which the blue arrow represents the lifting bubble movement direction and the red arrow represents the precipitated bubble movement direction. Through the comparison in Figure 6a,b, it can be seen that the maximum splashing height without precipitated bubbles is 40 mm, and the average fluctuation amplitude of the whole decarburization process is 25 mm; under the influence of the precipitated bubbles, the liquid surface splashing inside the vacuum chamber decreases, the fluctuation amplitude decreases with the increase in fluctuation frequency, the maximum splattering height is reduced to 18 mm, the average fluctuation amplitude of the whole decarburization process is reduced to 10 mm, and the fluctuation amplitude of the liquid surface of the vacuum chamber is reduced to 10 mm, which is more conducive to increasing the decarburization area. Vacuum chamber liquid surface fluctuations are more conducive to increasing the decarburization area. In the case of serious splattering, the same amount of liquid steel needs to be processed several times, and it is easy to form a cold steel. Precipitated bubbles in the direction of the liquid steel flow accelerate the liquid steel flow rate and reduce the eddy current in the vacuum chamber, and because the liquid steel stays too long in the vacuum chamber, the liquid steel content of carbon and oxygen elements that reduce the difficulty of decarburization will increase. The hold time in the vacuum chamber should not be too long. And the, aggregation and crushing processes of rising precipitation bubbles play a stirring role conducive to improving the decarbonization mass transfer rate.

3.3. Analysis of Molten Steel Flow Behavior in the Ladle Under the Influence of Precipitated Bubbles

For the ink tracer experiment to determine the RH liquid steel flow with or without precipitated bubbles, Figure 7 shows the flow from the descending tube as it meets the tracer after 3 s, 8 s, 13 s, or 18 s of liquid steel flow.
A saturated NaCl solution was used as a tracer, and the conductivity was measured at eight positions using the ‘stimulus–response’ method, with the conductivity probes installed at the positions shown in Figure 8b. And using the experimental data acquisition system to generate each position within the ladle response time cloud diagram, as shown in Figure 8a,c for the same decarburization time with or without precipitated bubbles for each probe response time, according to the response time of each conductivity probe, the tracer trajectory can be assessed so as to determine the flow behavior of the liquid steel inside the ladle. The tracer is first added in the descending pipe and flows through No. 6 and No. 3 in turn, and a portion of it is spread out at the bottom of the ladle to flow along the bottom of the ladle to the No. 4 probe and then through the No. 8 probe, and then it slowly rises up and then enters into the vacuum chamber through the ascending pipe; there is also a small amount of it that spreads to the inside of the ladle and flows through the No. 2 and No. 1 conductivity probes, and the remainder spreads to the No. 7 probe in the opposite direction. The obtained steel flow line diagram is shown in Figure 8d, which is basically consistent with the one obtained above. Under the influence of precipitated bubbles, the concentration of tracer flowing through the vacuum chamber decreases faster, and the kinetic energy and stirring energy of liquid steel entering the ladle from the descending tube are greater, which increases the concentration gradient between the ladle and the vacuum chamber, as well as the concentration gradient between each position, such that the diffusion speed from the position of high concentration to the position of low concentration increases, which accelerates the diffusion of the tracer in the ladle, accelerates the mixing speed of the steel liquid in the ladle and making the effect of the mixing better. The dynamic dead zone was quantified by calculating the area of the non-responsive region in the RTD curve. The results indicate that the dynamic dead zone area decreased by 50% under the influence of evolved gas bubbles.
Figure 9 shows the RTD (residence time distribution) curve of molten steel flow characteristics in the ladle. As illustrated, the molten steel reaches a homogeneous state after two circulation cycles. The mixing process is divided into three areas: Area I spans from the start of circulation to the end of the peak. This stage is critical for mixing, as a faster outlet velocity promotes a higher mixing rate. Area II extends from the peak to the end of the first cycle. During this phase, the molten steel velocity decreases, and significant diffusion from high to low concentration gradients occurs. Area III approaches complete mixing with minimal concentration gradients.
Under the influence of evolved gas bubbles, the concentration inside the ladle becomes lower, indicating better mixing efficiency, a smaller dead zone, and shorter transition times between regions. Compared to conditions without gas bubble evolution, the total mixing time is reduced by 8 s.

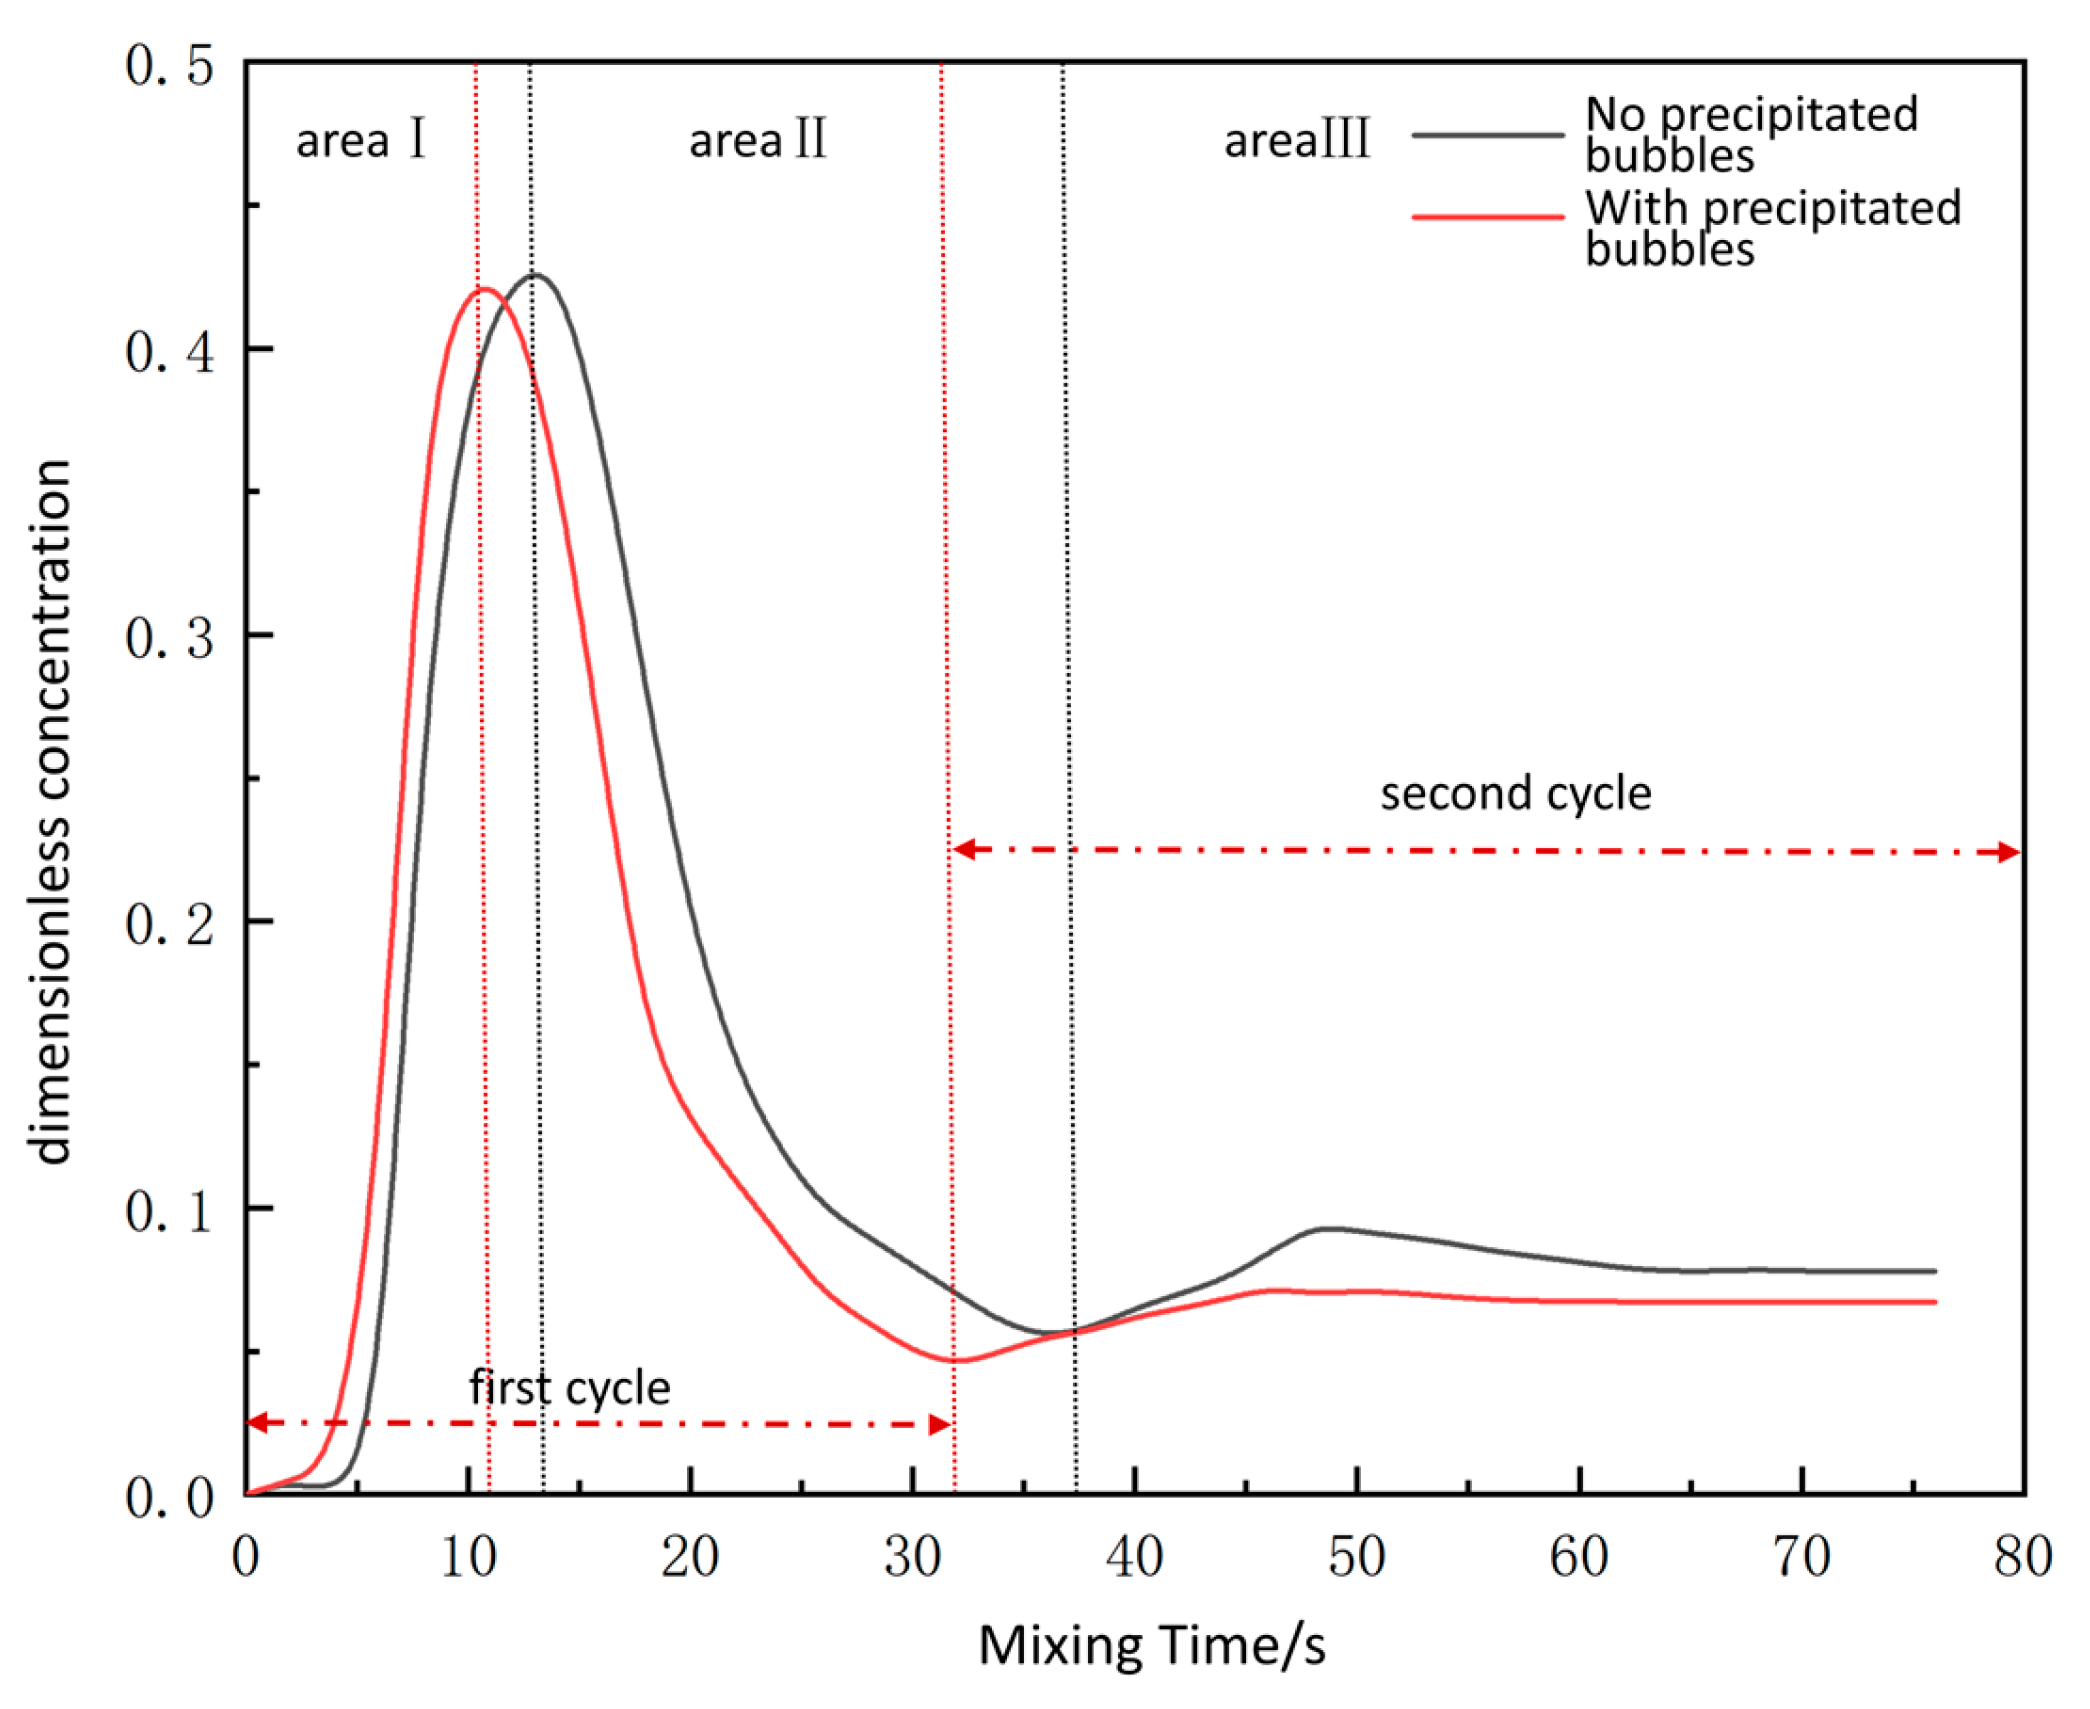
3.4. Analysis of Evaluation Indicators Under the Influence of Precipitated Bubbles

In order to compare more intuitively and accurately determine the effect of the presence or absence of precipitated bubbles on the behavioral characteristics of RH gas–liquid two-phase flow, the widely used evaluation indexes of RH refining efficiency were calculated. The results are shown in Figure 10 and Figure 11, with an error bar chart for the corresponding sample data. Figure 10a,b shows the fitted curve plots of the circulating flow rate and mixing time under the influence of the presence or absence of precipitated bubbles, respectively. It is not difficult to see that as decarburization proceeds, the amount of lifting gas continues to increase, and the vacuum decreases, which leads to an increase in the number of bubbles and an increase in the stirring energy of bubbles in the steel. And it can be seen that with the increase in decarburization time, the circulating flow rate with or without the precipitated bubbles increases, the mixing time decreases [31], and the flow rate of the gas–liquid two-phase refinery increases with the increase in decarburization time, while the mixing time decreases. Between 3 and 5 min of decarburization, as decarburization proceeds rapidly, the carbon content decreases rapidly, and at this time, the amount of precipitated bubbles is large, and a large number of precipitated bubbles is generated in the rising tube and vacuum chamber before becoming aggregated and broken; the stirring energy of the liquid steel is increased, the circulating flow rate is increased by up to 42%, and the mixing time is shortened by up to 28%. The mixing time can be reduced to less than 60 s in 3 min. After decarburization for 5 min, the carbon content is reduced, the amount of precipitated bubbles continues to reduce, with or without precipitated bubbles under the circulating flow rate, and the mixing time for the difference between the values continue to shrink, eventually trending toward a ‘saturation state’. It seems that in order to comprehensively analyze the effect of precipitated bubbles in detail, the two traditional indicators for evaluating the efficiency of RH refining are far from being sufficient; therefore, two new indicators, namely, the gas content and the residence time in the vacuum chamber, were added in the present study [32].
The decarburization reaction mainly occurs in the vacuum chamber to ensure that the flow through the liquid steel in the vacuum chamber has sufficient time for the reaction, so the residence time of liquid steel and bubbles in the vacuum chamber can be an intuitive response to the efficiency of the RH refining. Figure 10c shows time-fitted curve graphs for the presence or absence of precipitated bubbles based on the vacuum chamber residence time; from the figure, it can be seen that regardless of whether it is the effect of the addition of precipitated bubbles, the residence time in the vacuum chamber changes as the liquid surface height increases and eventually reaches a stable trend. The liquid surface height increases and eventually reaches a stable trend, but from the comparison of the two fitting curves, it can be seen that the precipitation of bubbles in the vacuum chamber leads to a certain reduction in the residence time in the vacuum chamber, especially at a decarburization time of 3–5 min; at this time, the amount of precipitated bubbles is the largest, and the effect is also the most obvious, as the residence time in the vacuum chamber is shortened by 14%. At this time, the gas–liquid two-phase flow in the vacuum chamber is in the transition state, and the precipitation of bubbles in the direction of the liquid steel flow accelerates the speed of the liquid steel flow through the vacuum chamber. After 5 min of decarburization, as the decarburization reaction proceeds, the carbon content decreases, the amount of precipitated bubbles decreases, and the difference between the residence times in the vacuum chamber with and without precipitated bubbles decreases, eventually converging to the ‘saturation state’. Compared to the improvement in other indicators, the effect of precipitated bubbles on the shortening of the residence time in the vacuum chamber is smaller, and the precipitated bubbles improve the alloying and decarburization efficiency of RH refining at all decarburization times.
Gas content β, that is, the proportion of air bubbles, as bubbles are the main power source of gas–liquid two-phase flow within the RH, affects the gas–liquid two-phase flow behavior, which indirectly affects the decarburization efficiency of RH refining, and the amount of precipitated bubbles directly affects the change in the gas content rate. As shown in Figure 10d, during decarburization, the vacuum degree rises; the volume of steel liquid inside the vacuum chamber increases; the phenomenon of bubble escape is observed; the overall gas content demonstrates a decreasing trend, with the precipitation of bubbles affecting gas content increasing at each decarburization time; and the fitting curve is first increased and then decreased because the decarburization reaction mainly occurs in the 3–5 min range. At this time, the amount of precipitated bubbles is greater, allowing the gas content in the vacuum chamber β to reach the biggest value. The greater gas content indicates that the kinetic energy and stirring energy of the liquid steel at this time are larger, which is more conducive to the decarburization reaction.

4. Conclusions

(1)
In order to ensure the similarity of fluid flow behavior under the influence of precipitation bubbles, the effects of surface tension, inertial force, buoyancy, and gravity are taken into account to obtain quasi-numbers that reflect the similarity of the phenomena of the precipitated bubbles:
P b = σ 16 Q 2 ρ g π 2 ρ l 2 g 2 l 7
(2)
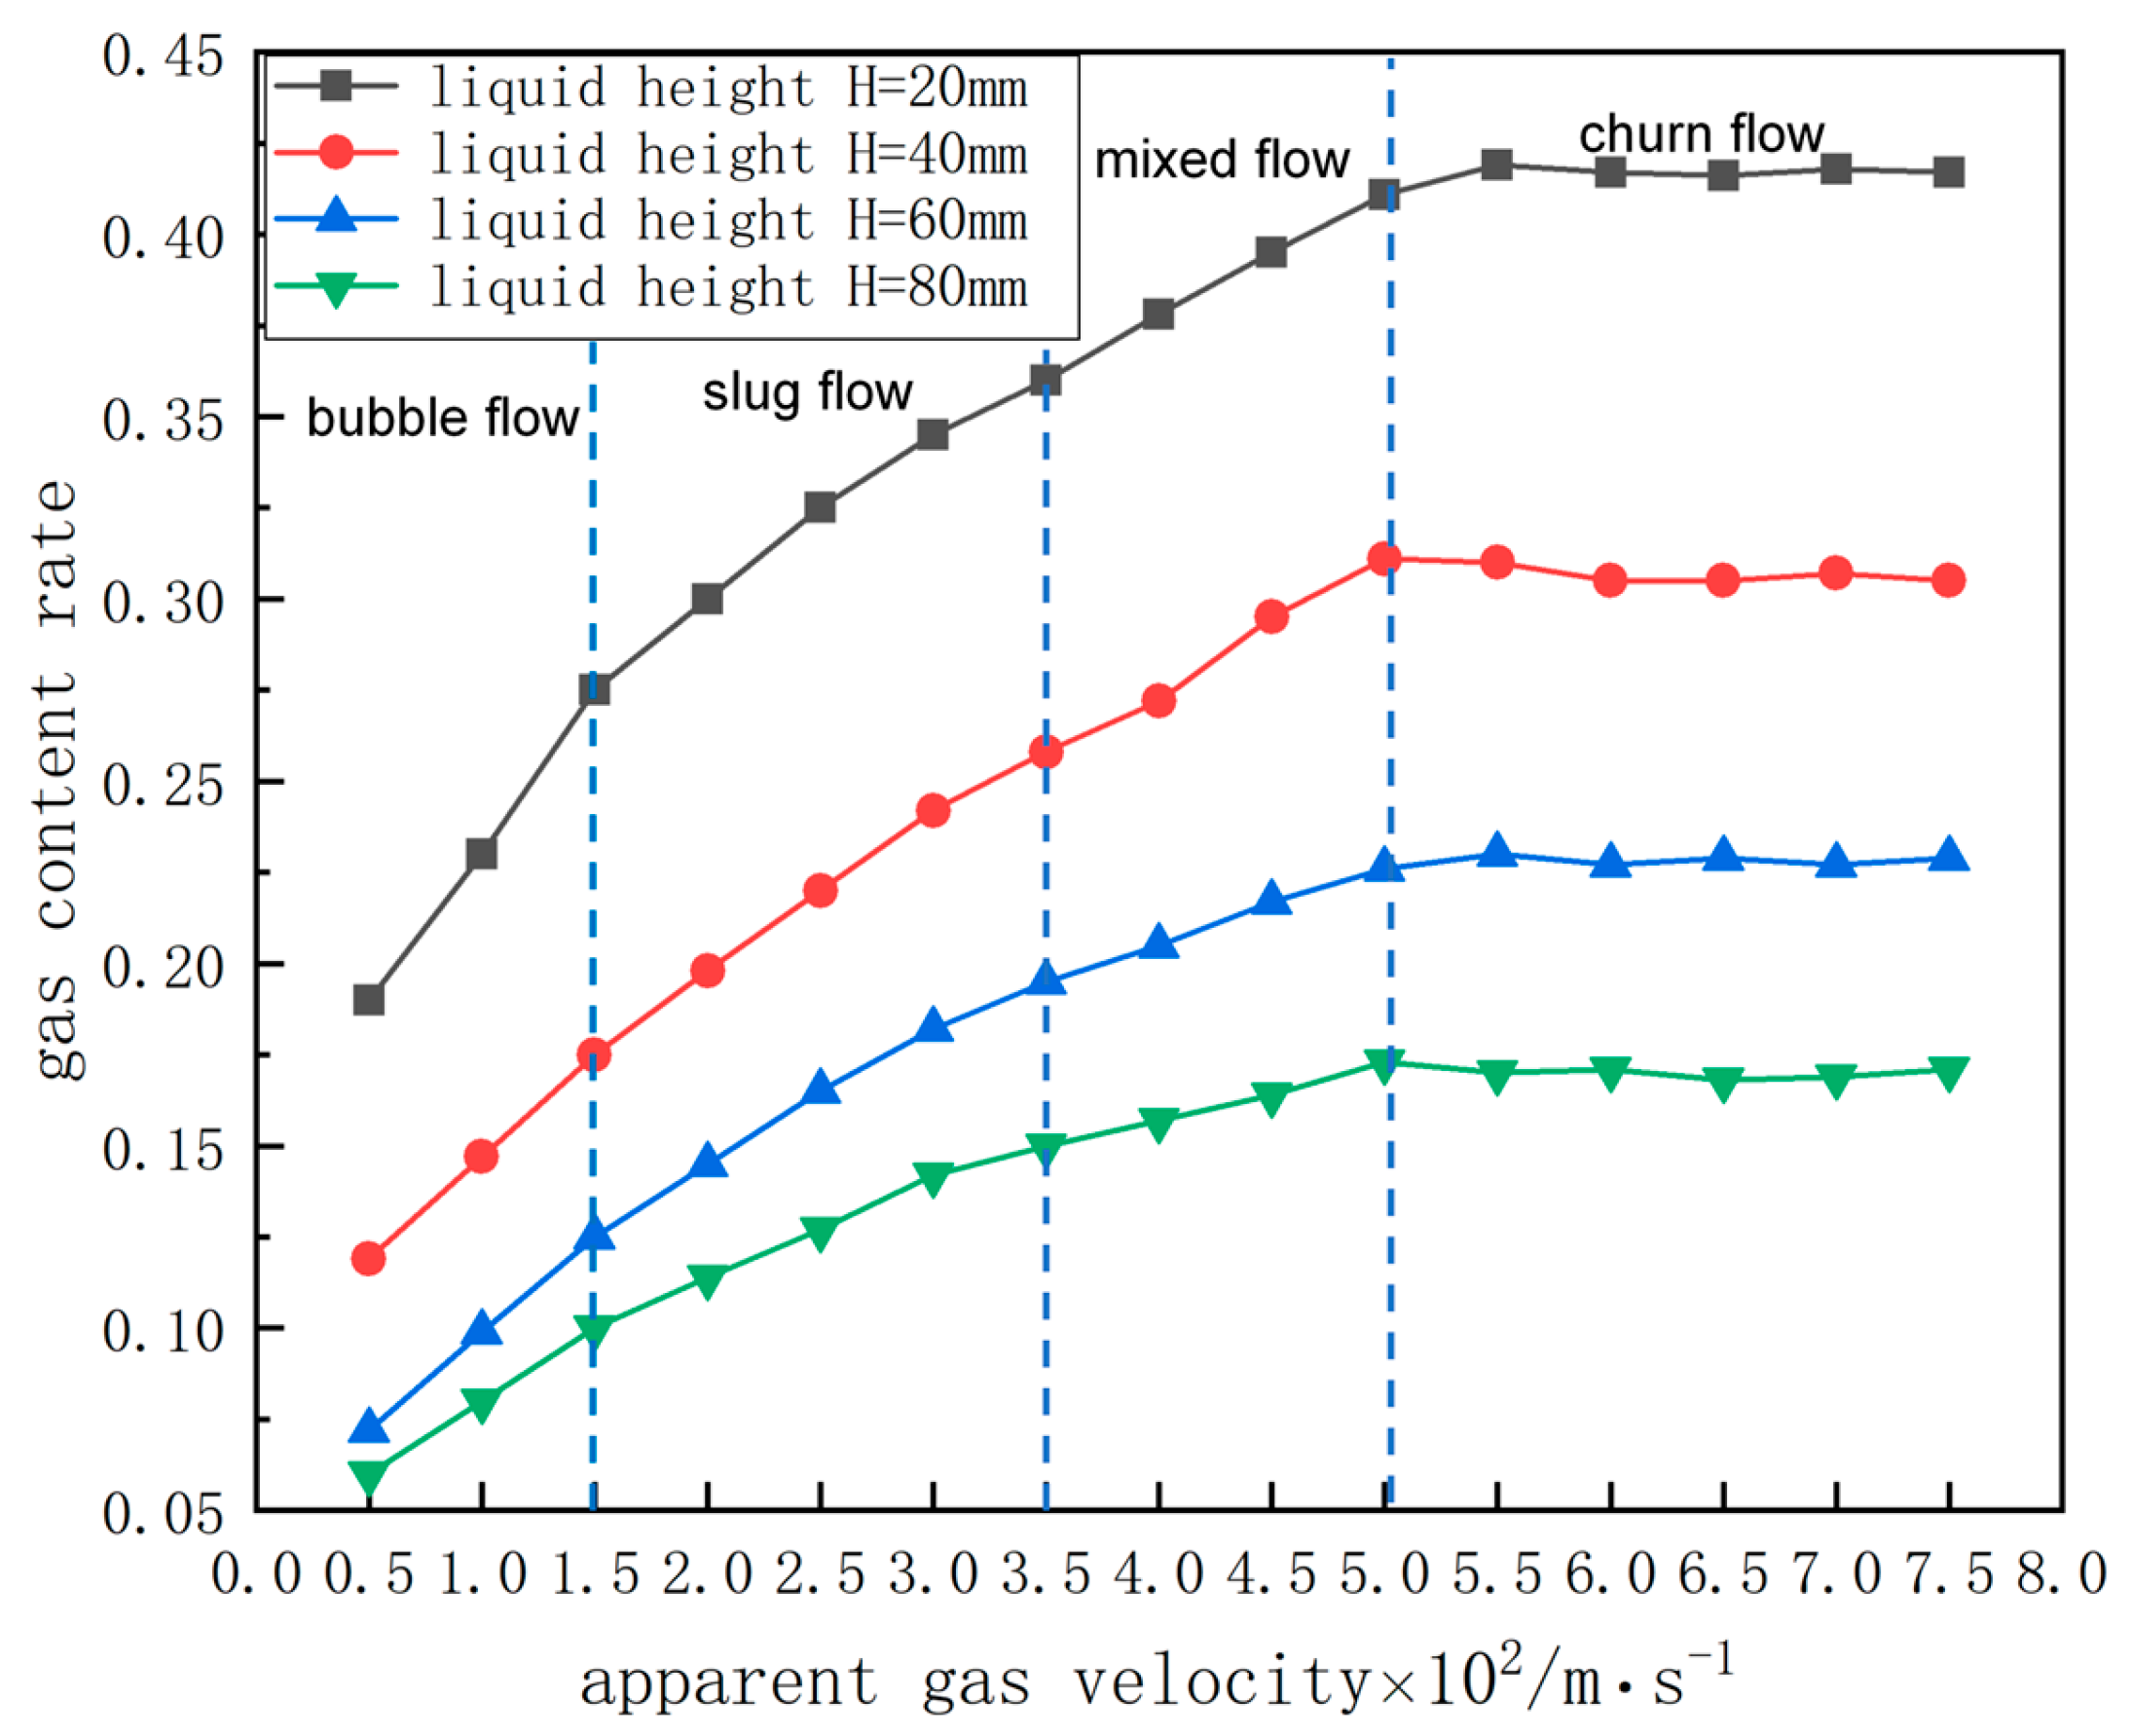
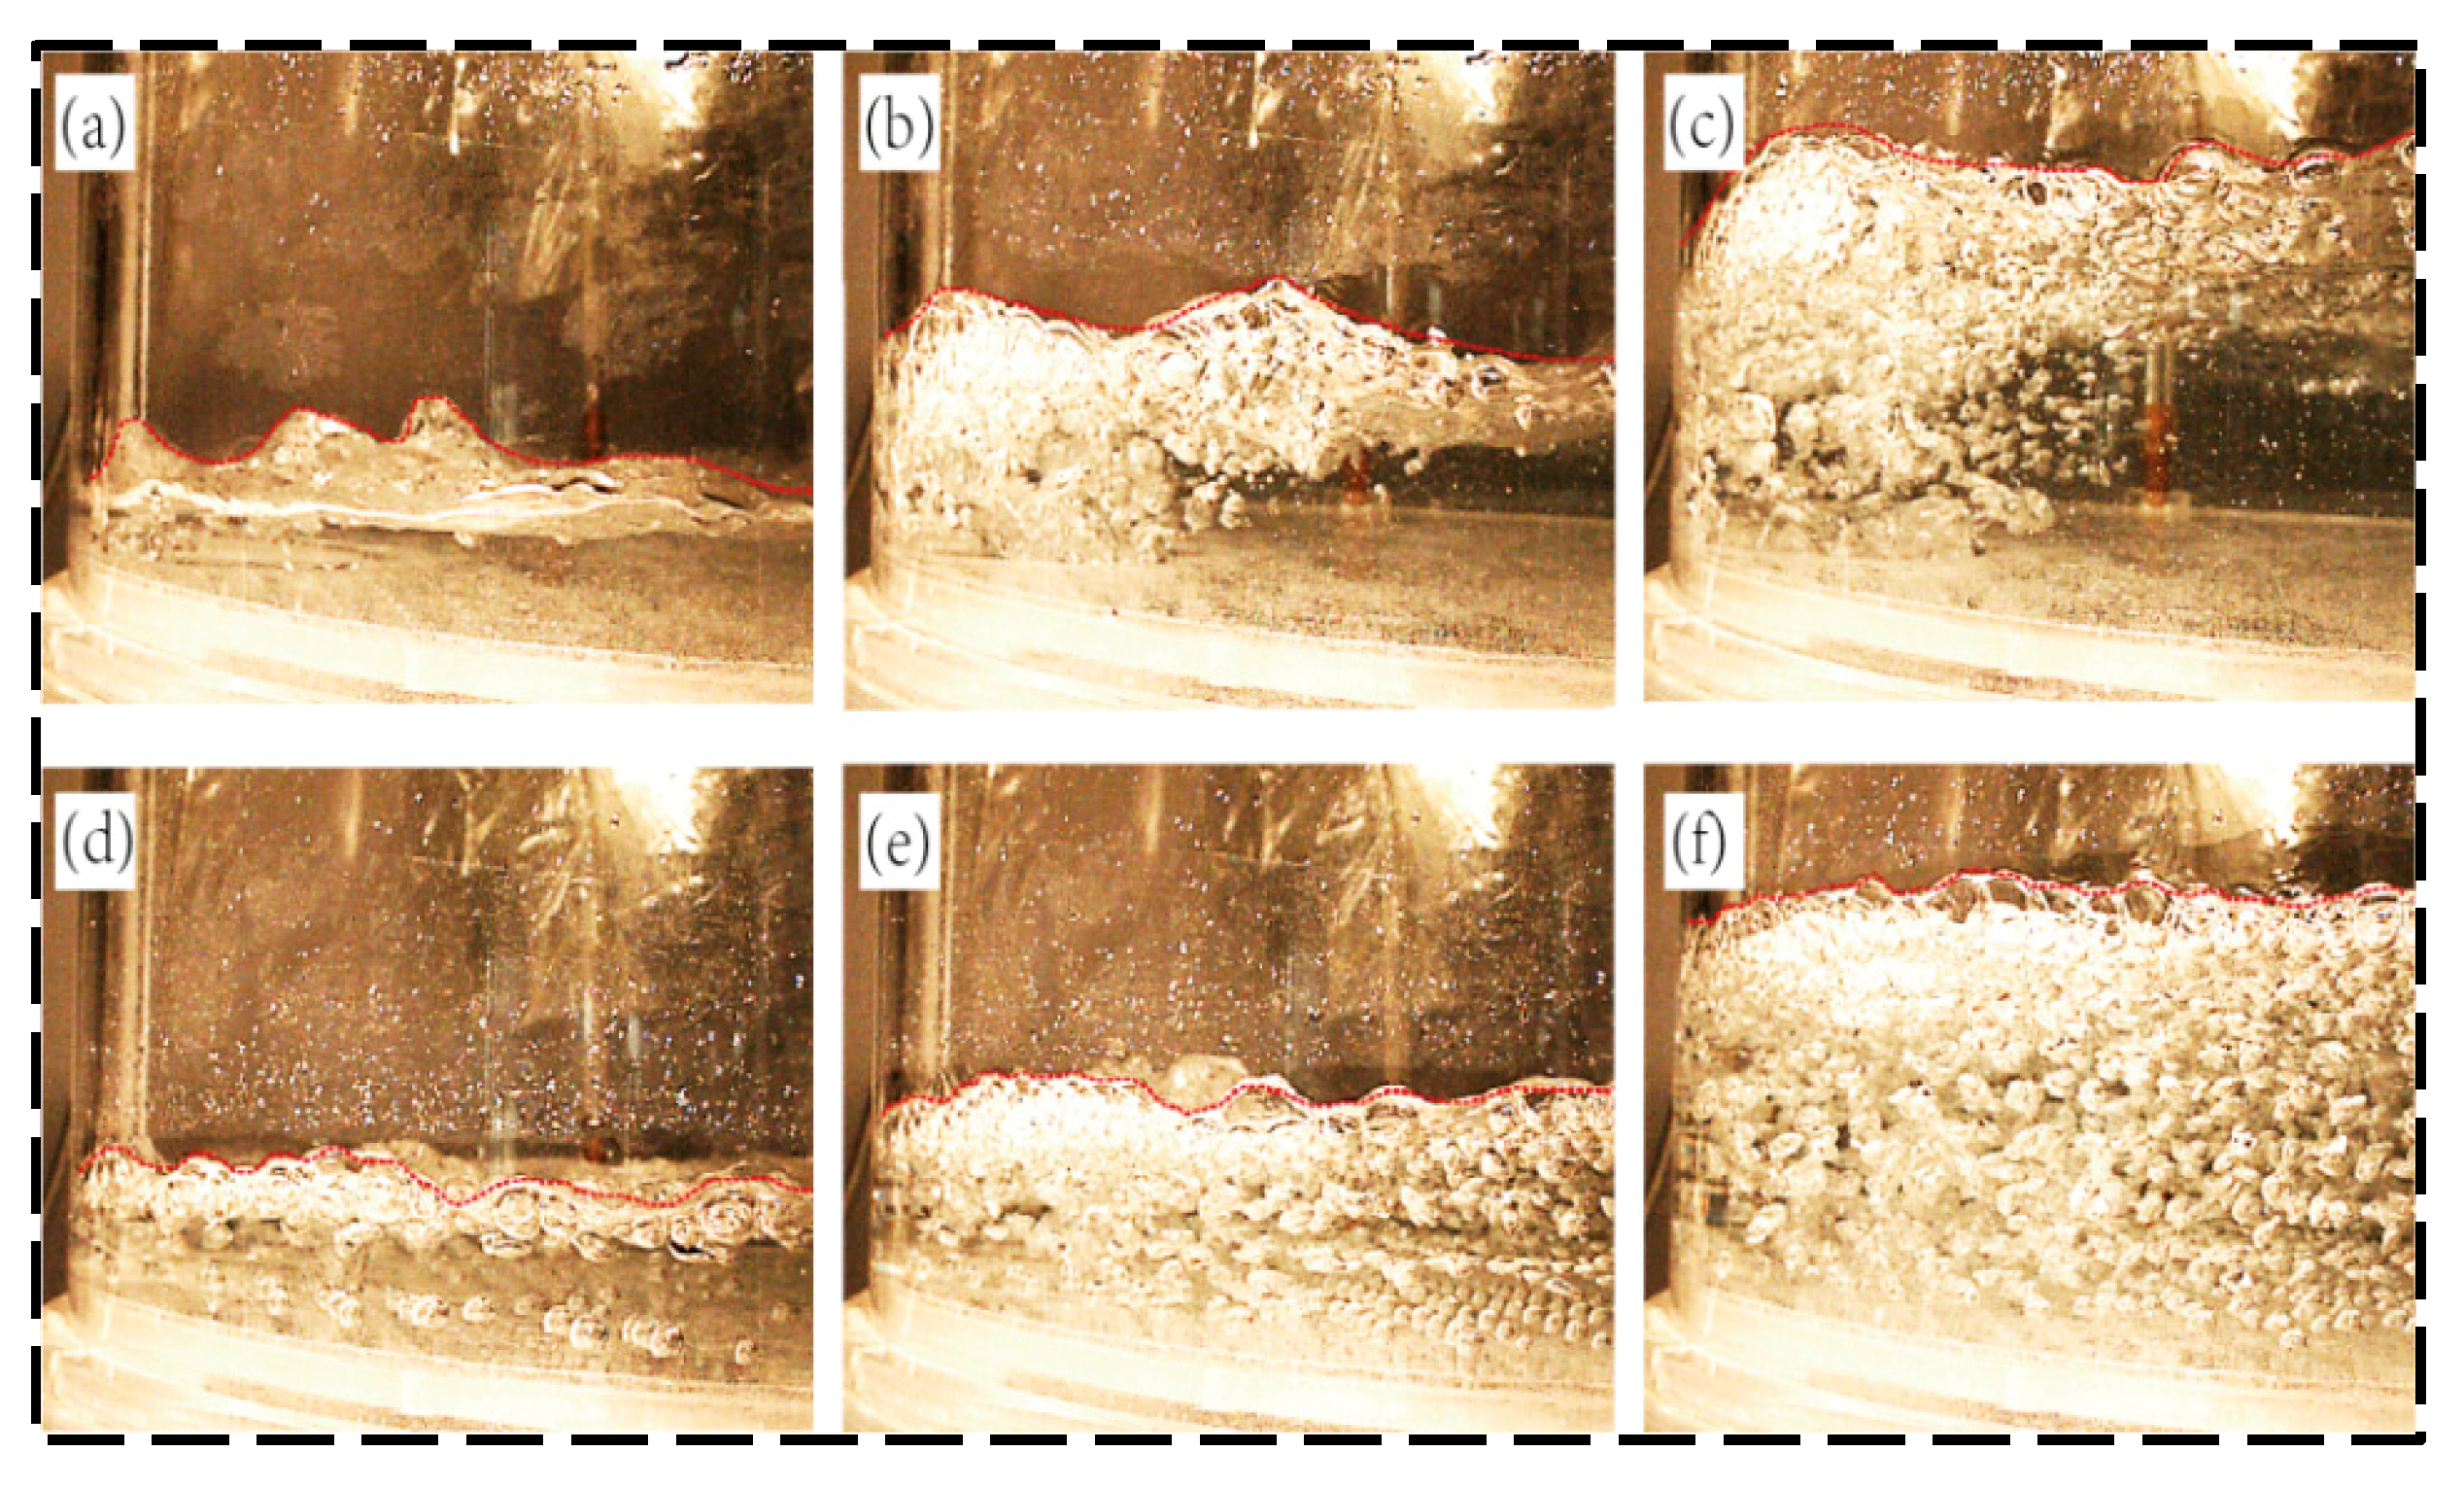
In the first 2 min of decarburization, the liquid steel only exists in the rising tube, and the bubbles mainly exhibit a small ellipsoidal adhesion rise, representing a bubble flow. At a decarburization time of 2 min, the liquid steel experiences the lowering of the vacuum, the lifting volume of gas increases, and the bubbles elongate into a bullet-shaped or plug-shaped morphology, representing a slug flow. After a decarburization time of 3–4 min, the small bubbles grow quickly and become large bubbles, and the big bubbles rise. In this process, the liquid pressure is reduced, the large bubbles appear broken, and the bubble flow is difficult to stabilize, representing a mixed flow. After a decarbonization time of 5 min, the bubble collision and bursting in the vacuum chamber is more intense, with a large number of bubbles in the liquid in a torn net-like structure, representing a churn flow. Future research should combine numerical simulations of bubble dynamics with experimental results from water models to validate these findings.
(3)
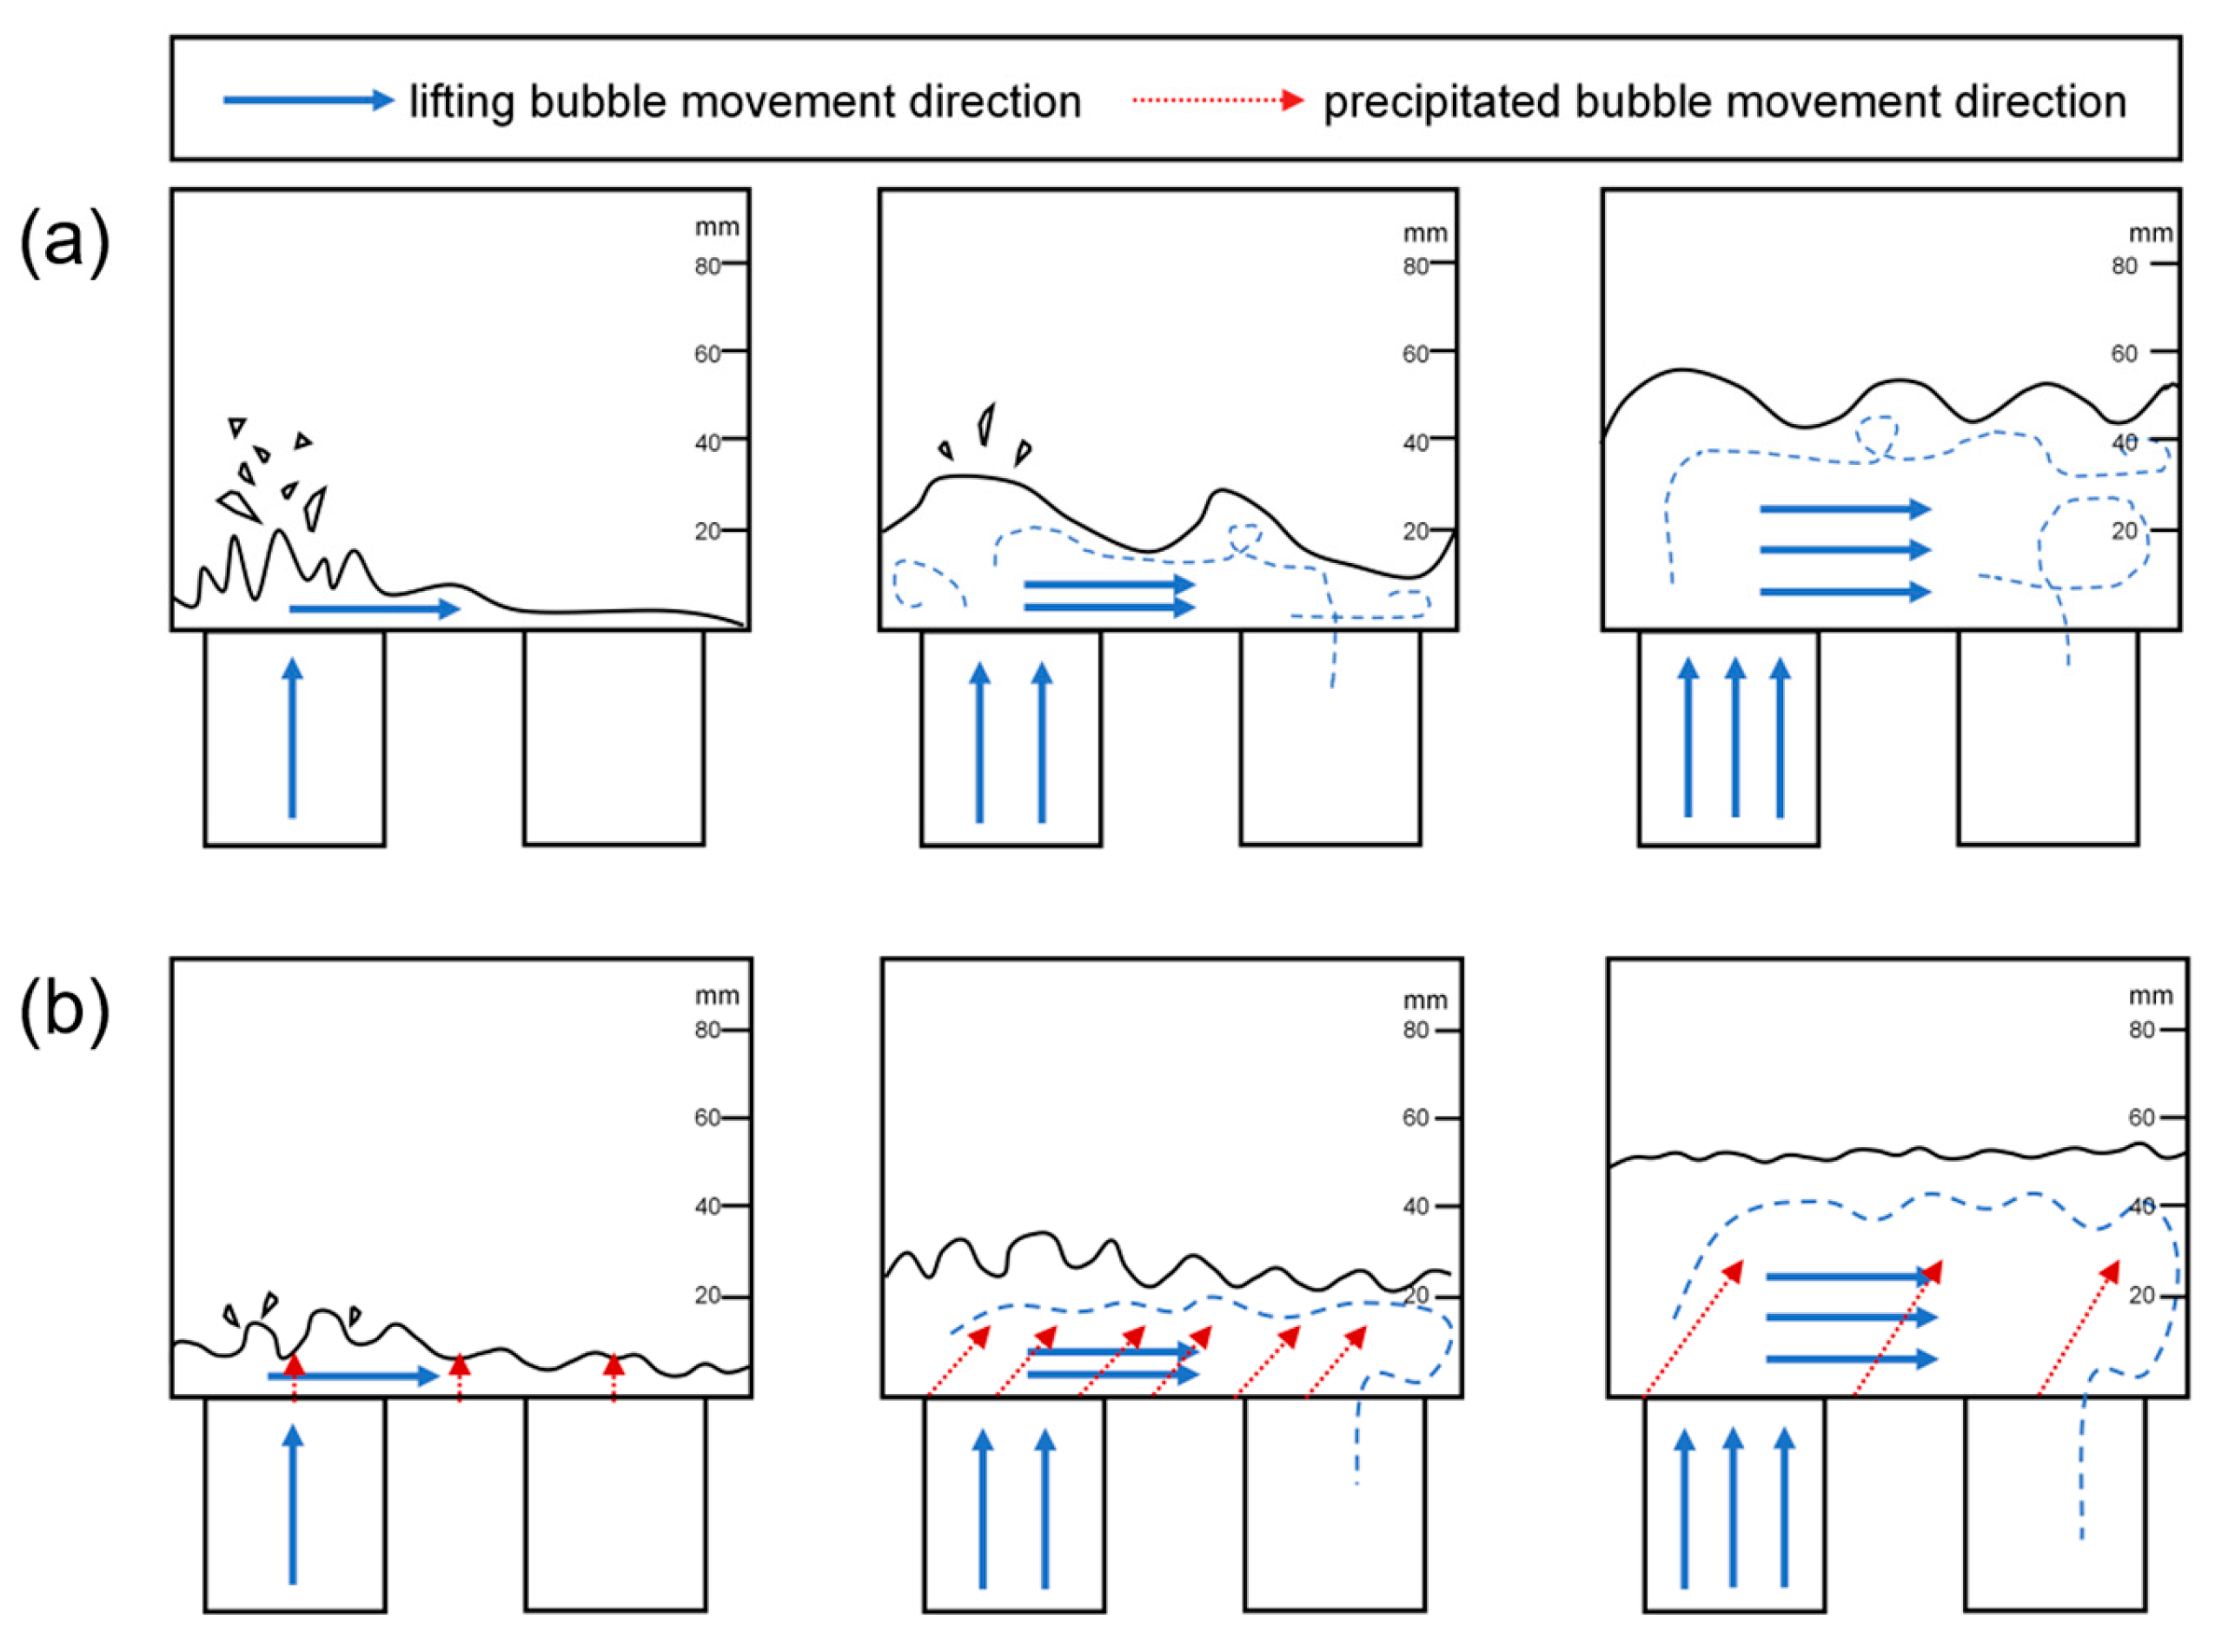
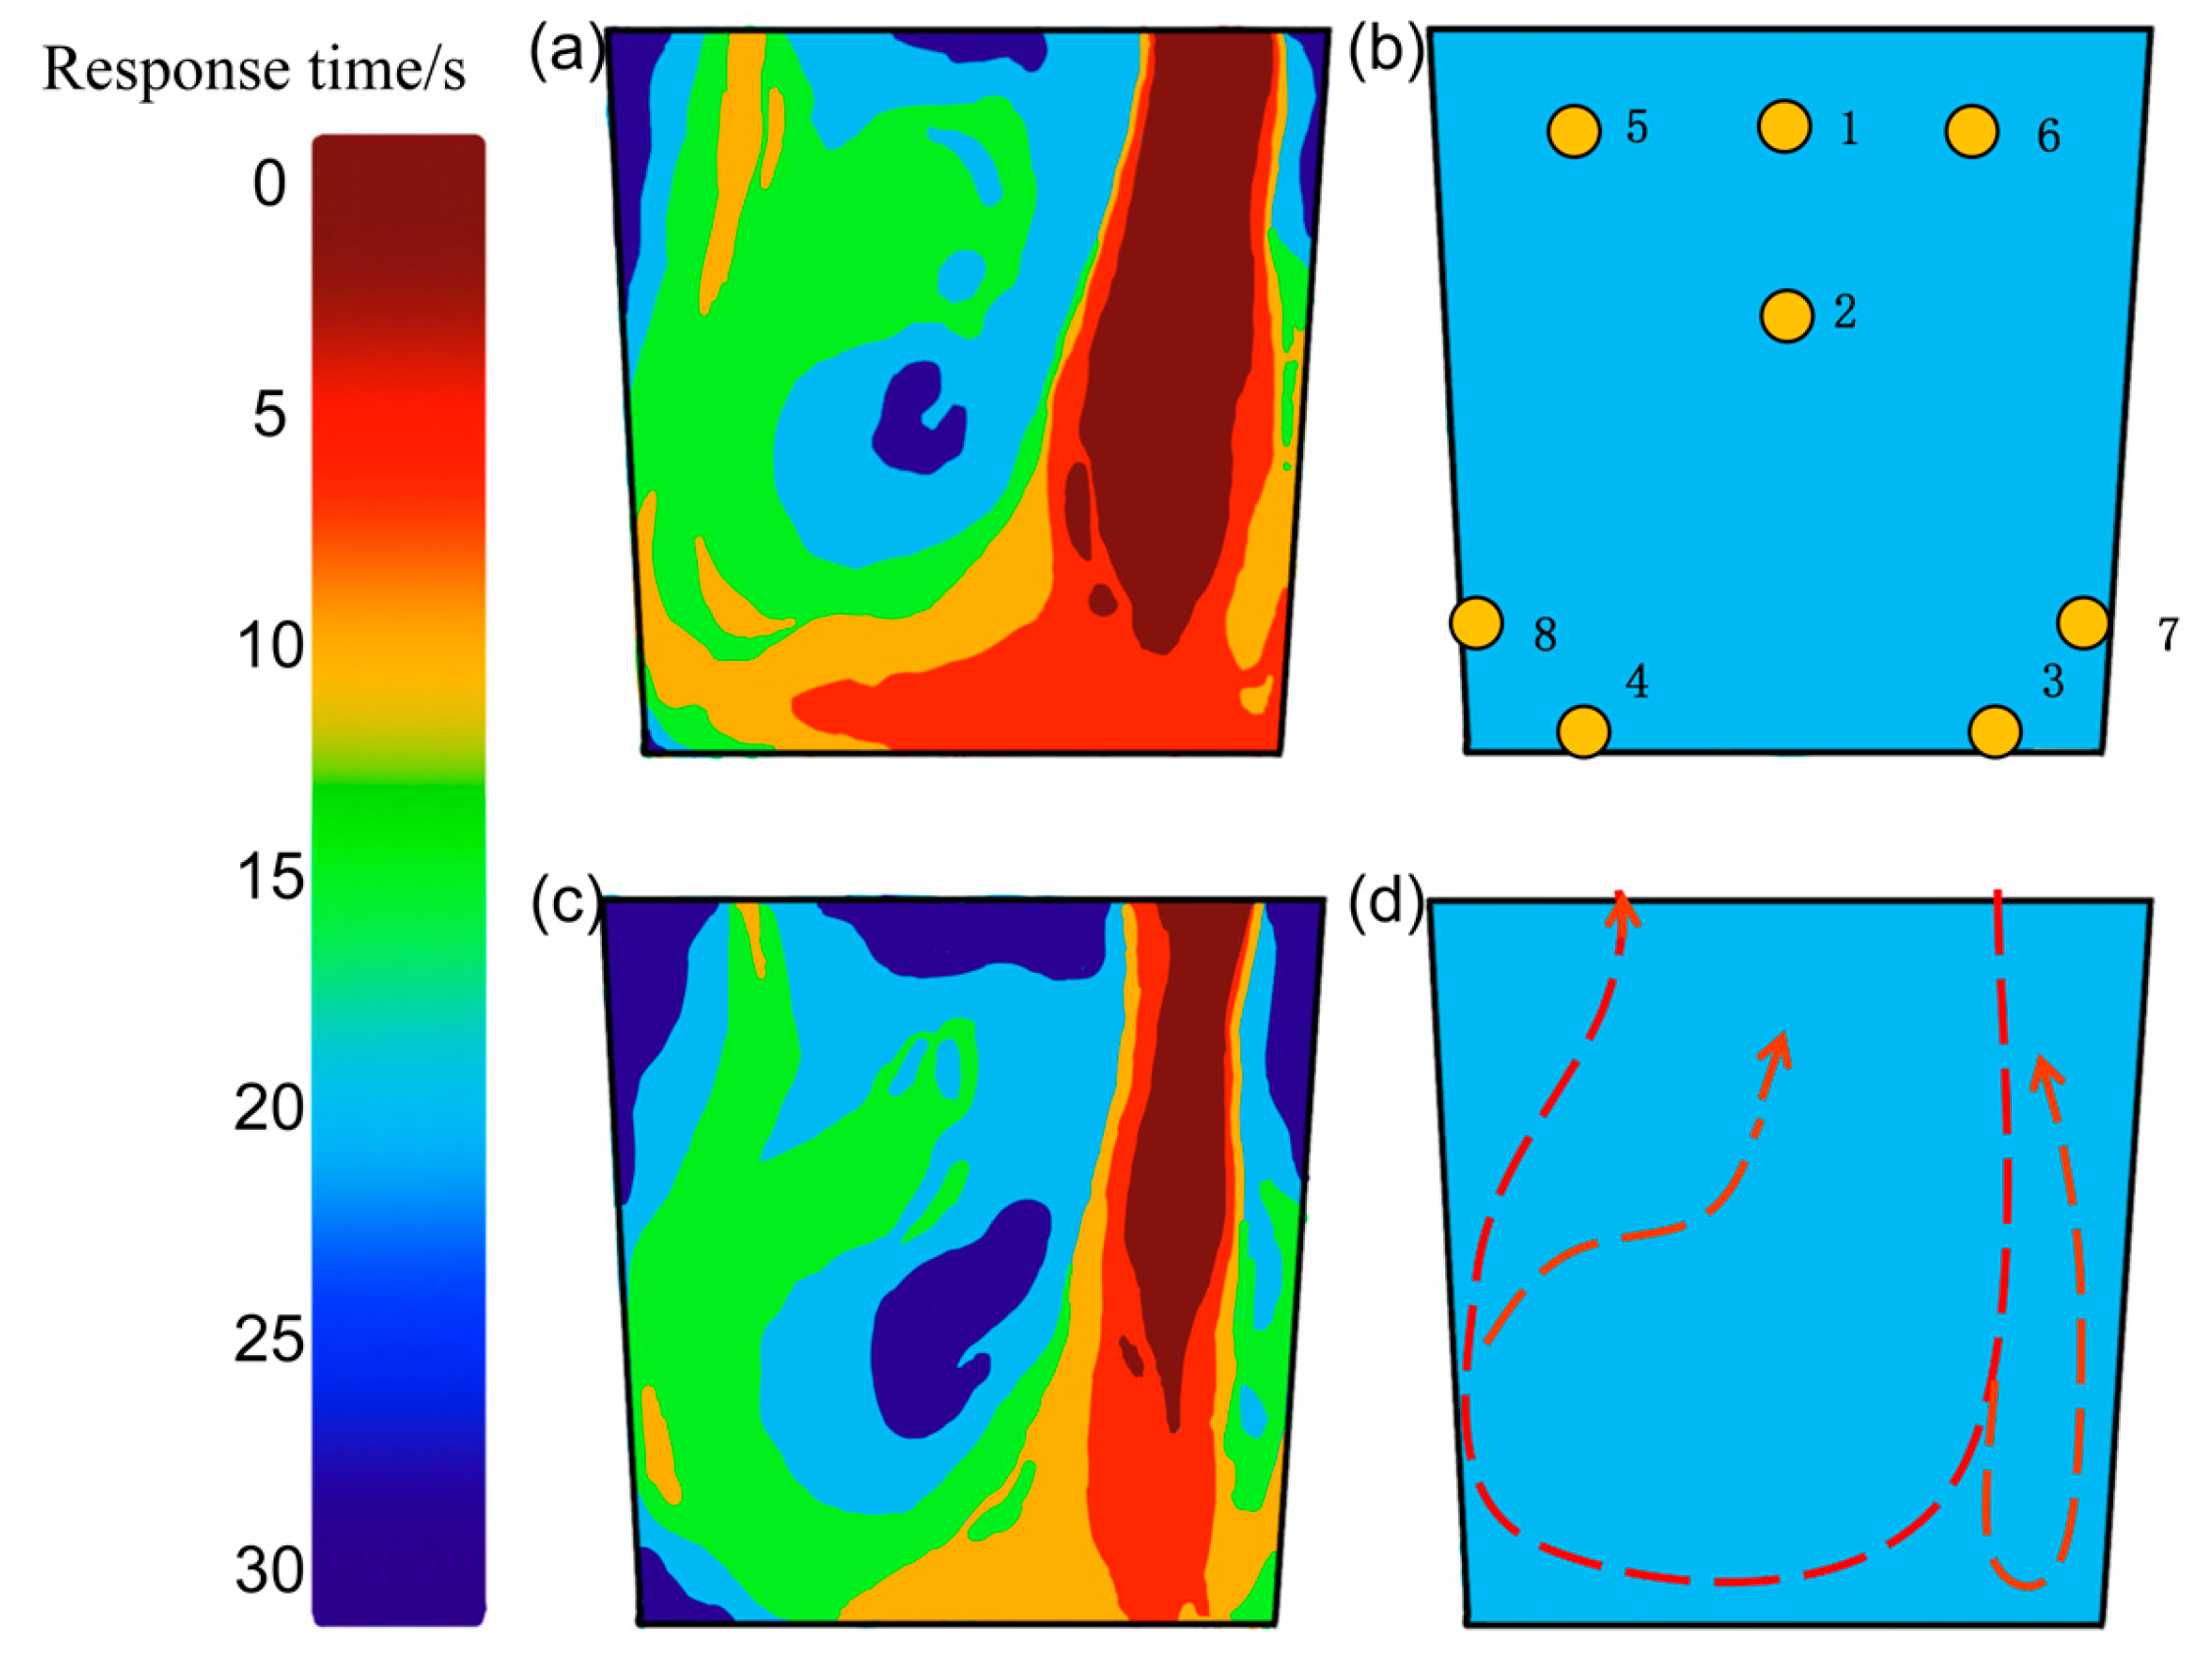
Without precipitated bubbles an under the maximum spatter height of 40 mm, the average fluctuation amplitude of the whole decarburization process is 25 mm; under the influence of precipitated bubbles, the liquid surface spattering inside the vacuum chamber decreases, the fluctuation frequency increases, the fluctuation amplitude decreases, the maximum spatter height decreases to 18 mm, the average fluctuation amplitude of the whole decarburization process decreases to 10 mm, and the fluctuation frequency increases. When the spattering is serious, the same amount of liquid steel need to be processed several times, easily leading to cold steel. Precipitated bubbles move in the liquid steel flow direction, accelerate the liquid steel flow rate, and reduce the eddy current in the vacuum chamber, and because the liquid steel in the vacuum chamber remains too long, the liquid steel content of carbon and oxygen elements that reduce the difficulty of decarburization will increase. The residence time in the vacuum chamber should not be too long. And this increases the concentration gradient between the ladle and the vacuum chamber, accelerates the mixing of the liquid steel in the ladle, improves the mixing, and reduces the volume of the dead zone by 50%.
(4)
Throughout the decarburization process, the precipitated bubbles were positively correlated with the increase in circulation flow rate and the decrease in mixing time, with a maximum increase of 42% and 28%, respectively, and the difference first showed the trend of increasing and then decreasing with the change in decarburization time, reaching the maximum circulation flow rate and the shortest of mixing time when decarburization was performed for 6 min. The vacuum chamber residence time increased with the rise of the liquid surface height to reach a stable trend, and the increase in precipitated bubbles in the liquid steel and the vacuum chamber residence time were negatively correlated. As decarburization proceeded, the gas content decreased overall, and the gas content was relatively higher at each decarburization time influenced by the precipitated bubbles, especially between 3 and 5 min, when decarburization mainly occurs. The impact of precipitated bubbles on the gas–liquid two-phase flow in RH reactors cannot be overlooked. In the actual production process of industrial RH refining units, operators can slightly reduce the flow rate of the lift gas during periods of intense decarburization reactions to ensure the efficient operation of the refining system. Future industrial experiments should continue to optimize gas injection practices for further improvement.

Author Contributions

Methodology, Y.L. and Z.C.; Validation, Y.T.; Investigation, D.W.; Resources, Y.H. and C.H.; Data curation, Z.R. and P.Z. All authors have read and agreed to the published version of the manuscript.

Funding

This research was funded by the Central Guided Local Science and Technology Development Funds Project (YDZJSX2022C028); Shanxi Basic Research Programme Project (202303021222169, 202203021211187, 202303021222167); and Shanxi People’s Government’s Talent Project in Jin (20242073).

Data Availability Statement

The original contributions presented in this study are included in the article. Further inquiries can be directed to the corresponding author.

Conflicts of Interest

Authors Yan Tian, Dong Wang were employed by the company Shanxi Jianbang Group Co., Ltd. The remaining authors declare that the research was conducted in the absence of any commercial or financial relationships that could be construed as a potential conflict of interest. The company had no role in the design of the study; in the collection, analyses, or interpretation of data; in the writing of the manuscript, or in the decision to publish the results.

References

  1. She, C.; Peng, K.; Sun, Y.; Ren, Y.; Zhang, L. Kinetic Model of Desulfurization During RH Refining Process. Metall. Mater. Trans. B 2024, 55, 92–104. [Google Scholar] [CrossRef]
  2. Xu, Z.; Ouyang, X.; Chen, C.; Li, Y.; Wang, T.; Ren, R.; Yang, M.; Zhao, Y.; Xue, L.; Wang, J. Numerical Simulation of the Density Effect on the Macroscopic Transport Process of Tracer in the Ruhrstahl–Heraeus (RH) Vacuum Degasser. Sustainability 2024, 16, 3923. [Google Scholar] [CrossRef]
  3. Liu, Z.; Lou, W.; Zhu, M. Numerical Analysis of Fluid Flow and Powder Transport Characteristics of RH-Degasser Ladle Bottom Powder Injection (RH-PBI) Process. Metall. Mater. Trans. B 2024, 55, 418–430. [Google Scholar] [CrossRef]
  4. Mukherjee, D.; Shukla, A.K.; Senk, D.G. Cold Model-Based Investigations to Study the Effects of Operational and Nonoperational Parameters on the Ruhrstahl–Heraeus Degassing Process. Metall. Mater. Trans. B 2017, 48, 763–771. [Google Scholar] [CrossRef]
  5. Dong, J.; Feng, C.; Zhu, R.; Wei, G.; Jiang, J.; Chen, S. Simulation and Application of Ruhrstahl–Heraeus (RH) Reactor with Bottom-Blowing. Metall. Mater. Trans. B 2021, 52, 2127–2138. [Google Scholar] [CrossRef]
  6. Heijnen, J.; Hols, J.; van der Lans, R.; van Leeuwen, H.; Mulder, A.; Weltevrede, R. A simple hydrodynamic model for the liquid circulation velocity in a full-scale two- and three-phase internal airlift reactor operating in the gas recirculation regime. Chem. Eng. Sci. 1997, 52, 2527–2540. [Google Scholar] [CrossRef]
  7. Huang, Y.; Cheng, G.; Wang, Q.; Li, S.; Dai, W. Mathematical model for decarburization of ultra-low carbon steel during RH treatment. Ironmak. Steelmak. 2020, 47, 655–664. [Google Scholar] [CrossRef]
  8. Iguchi, M.; Kawabata, H.; Nakajima, K.; Morita, Z.-I. Measurement of bubble characteristics in a molten iron bath at 1600 °C using an electroresistivity probe. Metall. Mater. Trans. B 1995, 26, 67–74. [Google Scholar] [CrossRef]
  9. Park, Y.-G.; Doo, W.-C.; Yi, K.-W.; An, S.-B. Numerical Calculation of Circulation Flow Rate in the Degassing Rheinstahl-Heraeus Process. ISIJ Int. 2000, 40, 749–755. [Google Scholar] [CrossRef]
  10. Takahashi, M.; Matsumoto, H.; Saito, T. Mechanism of Decarburization in RH Degasser. ISIJ Int. 1995, 35, 1452–1458. [Google Scholar] [CrossRef]
  11. Kuwabara, T.; Umezawa, K.; Mori, K.; Watanabe, H. Investigation of Decarburization Behavior in RH-reactor and Its Operation Improvement. Trans. Iron Steel Inst. Jpn. 1998, 28, 305–314. [Google Scholar] [CrossRef]
  12. Yamaguchi, K.; Kishimoto, Y.; Sakuraya, T.; Fujii, T.; Aratani, M.; Nishikawa, H. Effect of Refining Conditions for Ultra Low Carbon Steel on Decarburization Reaction in RH Degasser. ISIJ Int. 1992, 32, 126–135. [Google Scholar] [CrossRef]
  13. He, Q.; Yao, T.-L.; Liu, L.; Li, X.-C.; Ni, B.; Li, L.-F. An experimental study on RH vacuum chamber with a weir. J. Iron Steel Res. Int. 2023, 30, 1929–1938. [Google Scholar] [CrossRef]
  14. Wang, J.; Ni, P.; Chen, C.; Ersson, M.; Li, Y. Effect of gas blowing nozzle angle on multiphase flow and mass transfer during RH refining process. Int. J. Miner. Metall. Mater. 2023, 30, 844–856. [Google Scholar] [CrossRef]
  15. Jiang, L.; Wang, M.; Zhao, J.; Yao, C.; Xing, L.; Ai, X. Coordinated control of decarbonization efficiency and oxygen absorption rate in Ruhrstahl–Heraeus degasser based on mechanism model and BP neural network. J. Iron Steel Res. Int. 2025, 32, 606–618. [Google Scholar] [CrossRef]
  16. Chen, G.; He, S. Prediction of liquid circulation flow rate in RH degasser: Improvement of decarburization at low atmospheric pressure. J. Iron Steel Res. Int. 2024, 31, 1661–1667. [Google Scholar] [CrossRef]
  17. Zhang, S.; Liu, J.; He, Y.; Zhou, C.; Yuan, B.; Zhang, M.; Barati, M. Study of Dispersed Micro-bubbles and Improved Inclusion Removal in Ruhrstahl–Heraeus (RH) Refining with Argon Injection Through Down Leg. Metall. Mater. Trans. B 2023, 54, 2347–2359. [Google Scholar] [CrossRef]
  18. Al-Masry, W. Influence of Gas Separator and Scale-up on the Hydrodynamics of External Loop Circulating Bubble Columns. Chem. Eng. Res. Des. 2004, 82, 381–389. [Google Scholar] [CrossRef]
  19. Castillejos, A.H.; Brimacombe, J.K. Measurement of physical characteristics of bubbles in gas-liquid plumes: Part I. An improved electroresistivity probe technique. Metall. Trans. B 1987, 18, 649–658. [Google Scholar] [CrossRef]
  20. Coulaloglou, C.; Tavlarides, L. Description of interaction processes in agitated liquid-liquid dispersions. Chem. Eng. Sci. 1977, 32, 1289–1297. [Google Scholar] [CrossRef]
  21. Friedlander, S.K.; Marlow, W.H. Smoke, Dust and Haze: Fundamentals of Aerosol Behavior; Oxford University Press: New York, NY, USA, 1977; Volume 30, p. 58. [Google Scholar]
  22. Ramírez-López, A. Analysis of Mixing Efficiency in a Stirred Reactor Using Computational Fluid Dynamics. Symmetry 2024, 16, 237. [Google Scholar] [CrossRef]
  23. Kim, T.S.; Yang, J.; Park, J.H. Effect of Physicochemical Properties of Slag on the Removal Rate of Alumina Inclusions in the Ruhrstahl–Heraeus (RH) Refining Conditions. Metall. Mater. Trans. B 2022, 53, 2523–2533. [Google Scholar] [CrossRef]
  24. Zhang, L.; Jing, X.; Xu, Z.; Cai, K. Mathematical Model of Decarburization of Ultra-LowCarbon Steel during RH Treatment. Int. J. Miner. Metall. Mater. 1997, 5, 19–23. [Google Scholar]
  25. Zhu, B.; Liu, Q.; Kong, M.; Yang, J.; Li, D.; Chattopadhyay, K. Effect of Interphase Forces on Gas–Liquid Multiphase Flow in RH Degasser. Metall. Mater. Trans. B 2017, 48, 2620–2630. [Google Scholar] [CrossRef]
  26. Li, Y.H. Study on Fast Decarburization of Ruhrstahl-Hereaeusand Hydrodynamics in an External Loop Airlift Reactor. Ph.D. Thesis, University of Science and Technology Beijing, Beijing, China, 2015. [Google Scholar]
  27. Chen, G.; He, S. Circulation flow rate and decarburization in the RH degasser under low atmospheric pressure. Vacuum 2018, 153, 132–138. [Google Scholar] [CrossRef]
  28. Liu, C. Investigation on Multiphase Fluid Flow, Mixing and Decarburization During RH Vacuum Refining Process. Ph.D. Thesis, University of Science and Technology Beijing, Beijing, China, 2021. [Google Scholar]
  29. Yuan, J.D. Numerical Simulation Study on Gas-liquid Circulating Flow at Different Side-injecting Conditions in RH Refining System. Spec. Steel 2023, 44, 1–7. [Google Scholar]
  30. Peng, K.; Liu, C.; Zhang, L.; Sun, Y. Numerical Simulation of Decarburization Reaction with Oxygen Blowing During RH Refining Process. Metall. Mater. Trans. B 2022, 53, 2004–2017. [Google Scholar] [CrossRef]
  31. Zhu, H.W. Study on Bubble Evolution and Turbulent Behavior of Liquid Level in RH Vacuum Chamber. Master’s Thesis, Taiyuan University of Science and Technology, Taiyuan, China, 2022. [Google Scholar]
  32. Dong, C. Research on Gas-Liquid Two Phase Flow Behavior in RH Reactor. Master’s Thesis, Taiyuan University of Science and Technology, Taiyuan, China, 2021. [Google Scholar]
  33. Liu, W.P. Physical modeling of the influence of RH process parameters on the mixingeffect of molten steel. Steelmaking 2025, 41, 45–52. [Google Scholar]
  34. Jin, Y. Physical simulation of RH refining bottomblowing process optimization. China Metall. 2019, 29, 17–21. [Google Scholar]
  35. Ai, X.G. A Study on Water Model for Circulation Flow Rate Optimizationin RH Degassing Refining. Spec. Steel 2009, 30, 1–3. [Google Scholar]
Figure 1. Schematic diagram of the RH water model device. (a) Physical drawing of the RH water modeling unit; (b) schematic diagram of the vacuum chamber blowing plate.
Processes 13 01484 g001
Figure 2. Schematic diagram of the gas–liquid two-phase flow in a riser. (The characteristic bubbles of the four flow regimes are indicated by the red lines). (a) Decarburization time of 2 min; (b) decarburization time of 4 min; (c) decarburization time of 6 min; (d) decarburization time of 8 min; (a’) bubble flow; (b’) slug flow; (c’) mixing flow; (d’) churn flow.
Processes 13 01484 g002
Figure 3. Variation in gas content with superficial gas velocity.(The blue dotted line is the flow transition indicator).
Processes 13 01484 g003
Figure 4. Schematic diagram of gas–liquid two-phase flow in the vacuum chamber. (The red dotted line is the liquid level fluctuation indicator line). (a) Decarburization without precipitated bubbles for 2 min; (b) decarburization without precipitated bubbles for 4 min; (c) decarburization without precipitated bubbles for 6 min; (d) decarburization with precipitated bubbles for 2 min; (e) decarburization with precipitated bubbles for 4 min; (f) decarburization with precipitated bubbles for 6 min.
Processes 13 01484 g004
Figure 5. Variation in average gas content with the height of liquid in the vacuum chamber (The blue dotted line is the flow transition indicator).
Processes 13 01484 g005
Figure 6. Schematic diagram of the gas–liquid two-phase flow pattern in a vacuum chamber (The blue dotted line indicates the flow of steel in the vacuum chamber). (a) Flow pattern diagram of the vacuum chamber without precipitated bubbles; (b) flow pattern in the vacuum chamber with precipitated bubbles.
Processes 13 01484 g006
Figure 7. Comparison of RH steel liquid flow lines under the influence of precipitated bubbles. (The red dashed line is an indicator of tracer flow). (ad) Without precipitated bubbles; (eh) with precipitated bubbles.
Processes 13 01484 g007
Figure 8. Schematic diagram of flow behavior in the ladle (The yellow ball and numbers show the conductivity probe mounting position; The red dashed line is the flow field trajectory line). (a) Response time cloud with precipitated bubbles; (b) conductivity probe installation position diagram; (c) response time cloud without precipitated bubbles; (d) steel flow diagram.
Processes 13 01484 g008
Figure 9. RTD curve of flow characteristics of molten steel in the ladle.
Processes 13 01484 g009
Figure 10. Comparison of RH evaluation indexes with or without precipitated bubbles. (a) Recirculation flow; (b) mixing time; (c) vacuum chamber residence time; (d) gas content β.
Processes 13 01484 g010
Figure 11. Error bar chart. (a) recirculation flow; (b) mixing time; (c) vacuum chamber residence time; (d) gas content β.
Processes 13 01484 g011
Table 1. Current status of RH physical model similarity ratio studies.
RH Prototype Steel Handling Capacity (t)Geometric Similarity Ratio of Physical Models λReferences
3001/6Yihong Li [26]
3001/6Hongwei Zhu [31]
3001/6Chao Dong [32]
2101/5Wenping Liu [33]
1501/4Yu Jin [34]
701/3.27Xingang Ai [35]
Table 2. Physical properties of molten steel and water.
MaterialisticDensity (Kg/m3)Dynamic Viscosity (Kg/m·s)Kinematic Viscosity (m2/s)Surface Tension (N/m)
Liquid steel (1600 °C)70000.00640.913 × 10−41.6
Water (20 °C)10000.0011 × 10−60.073
Table 3. RH and ladle prototype and model dimensions.
Parameter NamePrototype Size (mm)Model Size (mm)
Ladle depth42001050
Diameter of the top of the ladle3920980
Diameter of the bottom of the ladle3638909.5
Steel liquid filling depth3915978.75
Vacuum chamber diameter2524631
Immersion tube inner diameter750187.5
Immersion tube outer diameter1500375
Immersion tube length1650412.5
Table 4. Similarity criteria pertinent to this study.
Similarity CriteriaExpressionDefinition
Modified Froude number F r = 16 Q 2 ρ g π 2 g l 5 ρ l Ratio of inertial force to gravitational force
Weber number W e = σ Δ ρ g l 2 Ratio of gas–liquid interfacial tension to gravitational force
Galileo number G a = g l 3 ρ 2 μ 2 Ratio of gravitational force to viscous force
Grashof number G r = ρ ρ 0 ρ g l 3 ρ 2 μ 2 Ratio of buoyancy force to viscous force
Table 5. Model precipitation gas flow calculation process table.
Carbon Reduction Time (min)Prototypical Reaction Carbon Content/%Prototype Volume of Precipitated CO/m3Prototype Flow Rate of Precipitated CO (L/min)Model Flow Rate of Precipitated CO (L/min)
20.0006413.5893589.2653.949
30.00735841.20741,207.39345.342
40.00664137.19237,192.60640.924
50.00412623.10823,108.55925.427
60.00187310.49110,491.44011.544
70.00315117.64817,648.08419.419
80.0003481.9511951.9152.147
Table 6. RH refining process parameters of a certain steel plant.
Decarbonization Time (min)Lift Gas Flow Rate (m3/h)Degree of Vacuum (kPa)Vacuum Chamber Liquid Level Height (mm)
0–2160>200
2–418020~5.50–170
4–182205.5~0.02170–250
18–vacuum breaking150<0.02250
Table 7. Experimental protocol.
Scheme NumberModel Rise Tube Bubble Precipitation Amount (L/min)Model Vacuum Chamber Bubble Precipitation Amount (L/min)Lift Gas Volume (L/min)Vacuum Chamber Liquid Level Height (mm)
11.11.973313
213.622.673748
312.220.463760
47.612.714566
53.45.774572
64.29.74573
70.61.074574
Table 8. Common gas–liquid two-phase flow patterns and their features.
Gas–Liquid Two-Phase Flow PatternFeature
Bubble flowThe gas phase is dispersed as discrete small bubbles in the continuous liquid phase, with nearly spherical shapes.
Slug flowThe gas phase forms elongated gas bullets (analogous to pistons) enshrouded in a liquid film, with liquid slugs separating the gas bullets.
Mixed flowThe mixture state is complex, potentially containing multiple flow patterns, and represents a transitional flow regime.
Churn flowFollowing the rupture of gas bullets, a highly disturbed mixed flow pattern emerges, characterized by an unstable gas–liquid interface and the fragmentation of the liquid phase into chunks or droplets.
Table 9. Bubble shapes under different decarbonization times.
Decarbonization Time (min)Bubble Size (mm)EoReBubble Shape
26–83.5–6.63.5–5.3Near-spherical/ellipsoidal
48–2310.3–92.16.9–23.1Cap
617–3939.9–125.212.7–37.3Cap/irregular morphology
820–4344.1–156.216.2–40.1Irregular morphology
Table 10. Molten steel flow patterns in the vacuum chamber.
Molten Steel Flow Pattern in the Vacuum ChamberFeature
Boiling flow patternAt the outlet of the rising pipe, there is intense turbulence of bubbles, accompanied by a large number of droplet splashes.
Transitional flow patternAt the riser outlet, the turbulence of the molten steel diminishes, internal fluctuations intensify, and droplet splashing decreases.
Fluctuating flow patternDroplet splashing disappears, accompanied by severe fluctuations of molten steel in the vacuum chamber.
Disclaimer/Publisher’s Note: The statements, opinions and data contained in all publications are solely those of the individual author(s) and contributor(s) and not of MDPI and/or the editor(s). MDPI and/or the editor(s) disclaim responsibility for any injury to people or property resulting from any ideas, methods, instructions or products referred to in the content.

