Abstract
This study reports the synthesis of activated carbon from dwarf elder, a lignocellulosic precursor, yielding a material with a high specific surface area (500.43 m2/g) and mesoporous structure (median pore radius: 3.88 nm). The physicochemical properties of the obtained carbon were characterized using field-emission scanning electron microscopy (FE-SEM), Brunauer–Emmett–Teller (BET) analysis, and Fourier-transform infrared spectroscopy (FTIR), confirming its suitability for aqueous-phase sorption applications. Batch experiments demonstrated carbon’s efficacy in adsorbing amlodipine besylate (AMB), a model pharmaceutical pollutant, with a maximum capacity of 325.9 mg/g under optimized conditions (pH 10.0, room temperature). Systematic evaluation of key parameters, such as initial AMB concentration, sorbent dosage, pH, and agitation speed revealed that sorption kinetics adhered to pseudo-second-order and Elovich model. The high efficiency of the synthesized carbon material, coupled with its low-cost and eco-friendly synthesis, positions it as a promising candidate for the scalable remediation of AMB and structurally related pharmaceuticals from contaminated water sources.
1. Introduction
Over the years, environmental prevalence, distribution, and transport patterns of various pharmaceuticals in aquatic environments have raised public concern. Despite their low concentrations in wastewater and receiving waters, these compounds exert significant biological impacts. Notably, a wide range of high-production-volume beta-blockers have been detected in groundwater, surface water, and wastewater, highlighting their widespread use and environmental presence.
Amlodipine (AML) is a calcium channel-blocking drug which inhibits calcium ion influx into vascular smooth muscle cells and myocardial cells, decreasing peripheral vascular resistance. This effect is used in the treatment of high blood pressure and angina pectoris [1]. Amlodipine besylate (AMB) is an amlodipine salt available as a white crystalline powder slightly soluble in water and sparingly soluble in ethanol, commercialized by the name Norvasc. Given that AMB is one of the most widely prescribed pharmaceuticals globally, it has been frequently detected in hospital effluents, wastewater, and sludge with a mean concentration of 93.9 ng/L, 41.1 ng/L, and 153–372 μg/kg, respectively [2,3]. Since adverse effects of AMB on organisms have been reported [4], it is essential to know its fate in aqueous environments and to implement efficient techniques for its removal from water.
AMB can be degraded through various methods, including alkaline degradation, acid hydrolysis, oxidative degradation, and thermal decomposition [5]. Recent studies have reported the photodegradation of AMB using doped TiO2 [6] and ZnO [5] nanoparticles, montmorillonite [4], and activated peroxymonosulfate-based catalysts [7,8]. However, to the best of our knowledge, the removal of AMB by using activated carbons as commercially popular sorbents is not presented in the scientific literature so far.
The conversion of abundant plant precursors into carbon-based materials is gaining attention in recent years as an alternative for the production of novel, low-cost, equally efficient sorbents which would take the place of the commercial, expensive ones. With this idea, many industrial, agricultural, and city brown waste products rich in carbon have been tested during the production of desired substitutions of sorbents. Natural lignocellulose sources recently employed as precursors for the production of these sorbents include Carica papaya wood [9], Moringa oleifera pods [10], Terminalia catappa fruit shells [11], Agave americana fibers and mimosa tannin [12], pineapple leaf fibers [13], guava seeds [14], tomato plants [15], Salvinia auriculata biomass [16], etc.
Sambucus ebulus L. is a perennial herbaceous plant with a wide distribution throughout Europe, North Africa, and Western Asia [17]. It belongs to the Adoxaceae plant family and is commonly referred to as dwarf elder or danewort. The roots, leaves, and fruits of this plant are highly valued in folk medicine within Western Europe, the Balkans, and the Middle East regions [18]. They can contain phytochemicals among which flavonoids, steroids, tannins, glycosides, cardiac glycosides, caffeic acid derivatives, ebulitins, and volatile substances are responsible for most of their therapeutic effects [19]. The leaves of dwarf elder have five to nine leaflets 15 to 30 cm long, with an unpleasant smell, pinnate, and opposite to each other [20].
In the present work, dwarf elder plant was exploited for the first time to prepare a beneficial sorbent, which was easily achieved by its carbonization after impregnation with a phosphoric acid. After this, the performance of the dwarf elder-activated carbon (DEAC) in the removal of AMB from aqueous solutions was thoroughly examined and, in addition to the optimization of physicochemical parameters, the equilibrium and kinetic aspects of sorption were discussed. Considering the very good efficiency of the process, its environmental-friendliness, and the availability of the starting materials, this paper describes an efficient and sustainable solution for tackling the critical issues of pollution from the pharmaceutical industry.
2. Materials and Methods
2.1. Reagents/Chemicals
Amlodipine besylate (Figure 1) of technical grade (98%) was obtained from Zdravlje a.d., Leskovac, Serbia. Nitrogen gas (99.9995%) used for protective atmosphere during carbonization was supplied by Messer Technogas, Serbia. All solutions were made by using deionized water (resistivity of 18 MΩ/cm) and all chemicals were of analytical grade (used without purification).
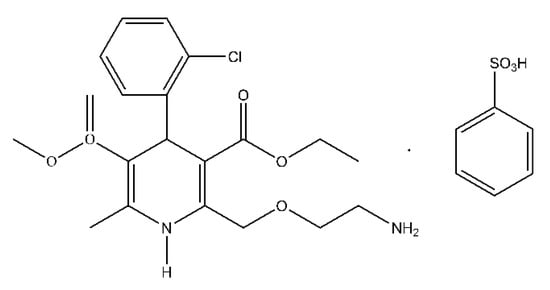
Figure 1.
Chemical structure of amlodipine besylate (3-Ethyl 5-methyl 2-[(2-aminoethoxy)methyl]-4-(2-chlorophenyl)-6-methyl-1,4-dihydro-3,5-pyridinedicarboxylate benzenesulfonate (1:1)).
2.2. Synthesis of Activated Carbon
The whole plants of dwarf elder were collected in one of the city parks in Niš, Serbia at the beginning of August. Plants were washed with tap water and dried in open space and in the shade for three weeks. Then, dried stems and leaves were milled and impregnated with 1.5 mass of concentrated H3PO4 for the next 24 h. The impregnated mixture was subjected to carbonization under a protective nitrogen atmosphere using a heating rate of 6 °C/min, up to a temperature of 170 °C, where it was held for 60 min. The temperature was then increased by 8 °C/min until reaching 700 °C, where it was held for another 60 min. The resultant carbonized material was then cooled down to room temperature in a protected atmosphere, crushed, and suspended in deionized water with vigorous stirring. The suspension was decanted after settling, and the process was repeated thrice in order to eliminate acid residue. The carbon sediment was rinsed onto a Buchner funnel using approximately 1 L of hot deionized water until the pH value of the filtrate exceeded 5. The obtained DEAC was dried at 110 °C for 6 h, homogenized, and finally stored in a sealed PVC container.
2.3. Analytical Methods
The Fourier-transform infrared (FTIR) spectrum of the DEAC was acquired using a PerkinElmer Spectrum Two FTIR spectrometer (Waltham, MA, USA) operated in transmission mode. The sample was prepared as a KBr pellet with a sample-to-KBr ratio of 1:1000. The spectral data were collected over a wavenumber range of 4000 to 400 cm−1, employing 64 scans and a spectral resolution of 4 cm−1.
The specific surface area and pore size distribution of the synthesized sample were analyzed using the Brunauer–Emmett–Teller (BET) method with a surfer gas adsorption porosimeter from Thermo Fisher Scientific, USA. Low-temperature nitrogen adsorption was conducted to measure the adsorption/desorption isotherms. From the full isotherm, the specific surface area (SBET) and pore size distribution (dV(r)), including mesopore external surface area (Smeso) and specific micropore volume (Vmic), were calculated. The Barrett–Joyner–Halenda (BJH) method [21] was employed to determine the pore size distribution using the desorption isotherm branch, while the t-plot method [22] was utilized to estimate the mesopore surface and micropore volume.
The surface morphology of the obtained DEAC was investigated by using FE-SEM instrument TESCAN MIRA3 FEG-SEM (Brno, Czech Republic). This microscope offers multiple imaging modes for high-resolution imaging. A secondary electron detector of the Everhart–Thornley type was utilized to capture images at an accelerating voltage of 20 kV. Various magnifications, including 200×, 1000×, 2000×, and 5000×, were employed to obtain FE-SEM images that enabled the morphological examination of the sample.
For determination of DEAC’s pHPZC, 50 mg of the carbon samples were immersed in 0.1 mol/L KNO3 solutions at various initial pH levels (pHi) overnight, then filtered, and the final pH (pHf) values were determined. Contrasting pHi and pHf on the same graph was used to reveal at which pH value the surface of the sorbent is electroneutral.
2.4. Batch Sorption Experiments
Using a set of probes, sorption kinetics was investigated by contacting 10 mg of activated carbon with 40 mL of AMB solutions ranging from 50 to 150 mg/L for 0, 5, 10, 20, 40, 60, 90, and 120 min at 25 °C. The same set of experiments was employed for isotherm modeling. A magnetic stirrer set to 200 rpm was used to agitate the suspensions. In every experiment, the drug-containing solutions were kept at their native (unadjusted) pH of 10.0. The 0.45 µm membrane filters (Agilent Technologies, Waldbronn, Germany) were used to filter the suspensions after contacting.
By contacting 10 mg of DEAC with 40 mL of 100 mg/L AMB solution for 120 min at various beginning pH values, the impact of pH on sorption was examined. The sorbent dosage was tested under the same circumstances.
To determine the possibility of further use of the already-used DEAC sorbent, a reusability test was carried out. After AMB removal treatment, the sorbent was stirred for 60 min with a 100 mL mixture of 96% ethanol and 0.1 M acetic acid (volume ratio 1:1) to regenerate DEAC. Before being dried and used again, the spent sorbent was separated by the filter paper and further cleaned with 100 milliliters of deionized water. This was undertaken to make sure that AMB molecules that had been sorbed were totally desorbed from the material. Every sorption experiment was conducted by contacting 30 mg of reused DEAC at native pH with 100 mg/L AMB solutions in a 40 mL container for 120 min. Six successive cycles of sorption/desorption experiments were performed on the identical DEAC sample.
The spectrophotometer Shimadzu UV–Vis 1650 PC (Shimadzu Corporation, Kyoto, Japan), operated at an absorbance of 224 nm, was used to estimate the residual AMB concentrations. It was found that the technique’s limit of quantification (LOQ) for AMB in deionized water solutions was 1.9 mg/L.
The methylene blue (MB) number, which indicates the most dye that can be absorbed by 1 g of the sorbent, was calculated to assess the general sorption capability of the DEAC. Samples of 50 mg of DEAC were added to 50 mL of MB solutions at different concentrations (100–350 mg/L) and the mixture was left at 25 °C for 24 h. A photometer (MultiDirect, Lovibond®, Tintometer GmbH, Dortmund, Germany) driven by a microprocessor was used to measure the remaining MB concentrations at 660 nm.
To ensure that standard deviation was less than 1.5%, each experiment was run in triplicate. The average values were then used as the final results.
2.5. Data Analysis and Theoretical Background
The sorption capacity, q (mg/g), was computed in each instance using Equation (1):
Meanwhile, removal efficiency (RE) is defined by Equation (2), which is given as follows:
In these equations, c0 and ct stand for the initial and final AMB concentrations (mg/L), respectively, V is the solution volume (L), and m is the mass of DEAC (g). All sorption experiments were performed in triplicate at ambient temperature (25 °C) and the average value was used.
Kinetic models, such as, pseudo-first-order, and pseudo-second-order, Elovich and the intra-particle diffusion model were used to theoretically analyze the kinetics of AMB sorption onto DEAC. In addition, three isotherm models were applied to analyze the equilibrium case, including the Langmuir, Freundlich, and Temkin models. These models are explained in Supplementary Materials. OriginPro 8 SR4 (Northampton, MA, USA) was used for fitting and data processing after all of these models were examined in nonlinearized form.
For the sake of calculating the relative deviation in sorption capacity (RD, %) and the mean relative deviation (MRD, %), respectively, Equations (3) and (4) were employed as given below.
In Equations (3) and (4), i represents experimental points, n is the number of experimental points, while indexes exp and cal are used to denote experimental and theoretically calculated values, respectively.
3. Results and Discussion
3.1. Material Characterization
3.1.1. FTIR Analysis
The FTIR spectrum of DEAC, covering the range of 400 to 4000 cm−1, is presented in Figure 2. As reported in previous studies [23,24,25], the broad absorption band observed at 3370 cm−1 can be assigned to the stretching vibrations of hydroxyl (-OH) groups and adsorbed water molecules. A peak at 2961 cm−1 is associated with the stretching vibrations of C-H bonds within the CH2 groups of aliphatic chains. Additionally, the spectrum reveals out-of-plane bending vibrations of C-H bonds in aromatic structures at 834 cm−1, alongside a weak signal at 1843 cm−1, which is attributed to C-H bending in aromatic systems. Notably, a strong peak at 1661 cm−1 is characteristic of benzenoid rings, while the peak at 1567 cm−1 corresponds to the stretching vibrations of aromatic C=C bonds. Within the spectral region of 1550–1800 cm−1, prominent peaks typically indicate the presence of carbonyl (C=O) functional groups, which are commonly found in ketones, aldehydes, esters, and carboxylic acids. However, in this case, the overlapping signals from aromatic functionalities make it challenging to distinctly identify the C=O bonds. A peak at 1419 cm−1 is indicative of phenolic groups in the sample. Furthermore, the band observed at 1006 cm−1 may arise from C–O stretching vibrations, although this region can also include contributions from P=O and P=O-OH groups. These phosphorus-containing groups are likely retained in the sample structure due to the use of phosphoric acid during the activation process. In conclusion, the FTIR spectrum demonstrates a remarkable diversity of functional groups within the DEAC sample. This outcome is likely influenced by a combination of factors, including the unique chemical structure of the starting bio precursor, the chemical activation method employed, and the specific carbonization strategy applied during synthesis.
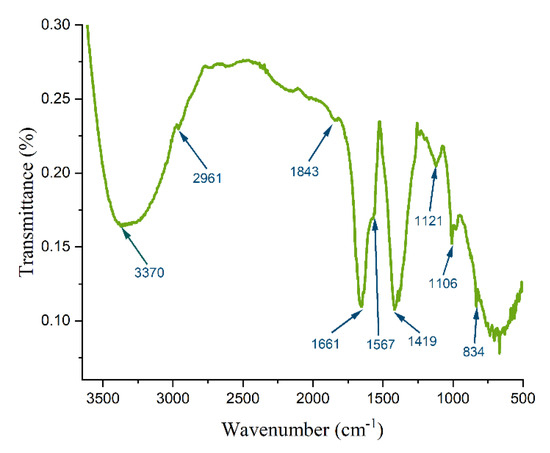
Figure 2.
FTIR spectrum of DEAC.
3.1.2. BET Analysis
A basic and popular method for describing the specific surface area, pore size distribution, and general porosity of porous materials is the BET study, which is based on nitrogen adsorption/desorption isotherms at cryogenic temperatures (77 K). The BET method offers important information about the material’s textural characteristics, such as surface accessibility, mesoporosity, and microporosity, by simulating the multilayer adsorption of nitrogen molecules on the material’s surface.
Herein, the BET technique was used for the determination of BET surface area of DEAC and the obtained result was SBET = 500.43 m2/g. By applying the BJH method (Figure S1), textural parameters were quantified including median pore radius (3.88 nm), maximum pore radius (1.89 nm), cumulative pore volume (0.38 cm3/g), and cumulative pore area (222.5 m2/g). As calculated by the method of t-plot (Lippens and de Boer) [26], specific micropore volume and mesopore surface area were determined to be Vmic = 0.11 cm3/g and Smeso = 279.09 m2/g, respectively.
Strong evidence for the predominant presence of microporosity in the examined sample is provided by the significant congruence between the desorption and adsorption curves in the pressure range below 0.4. On the other hand, a divergence between the adsorption and desorption curves is visible when the pressure range increases (p/po > 0.4), which affects the isotherm’s final shape.
According to IUPAC isotherm classification (2015), the nitrogen adsorption/desorption isotherm of DEAC (Figure 3) revealed a Type II isotherm. This type is indicative of unrestricted monolayer–multilayer adsorption on a non-porous or macroporous material, followed by capillary condensation at higher relative pressures. The presence of an H3-type hysteresis loop suggests the existence of slit-shaped mesopores, typically associated with aggregates of plate-like particles or layered structures, where delayed condensation and evaporation occur due to pore network effects. The lack of a plateau at high p/po further implies the presence of large mesopores or macropores, contributing to a broad pore size distribution. These results are consistent with highly heterogeneous pore structures often observed in activated carbons, where the combination of micro-, meso-, and macropores enhances sorption capacity and accessibility for various sorbates. The BET surface area, derived from the initial linear region of the isotherm, provides insight into the material’s monolayer sorption capacity, while the hysteresis behavior offers critical information on mesopore connectivity and geometry [23]. At relative pressure above 0.8, a sharp increase in nitrogen adsorption is evident due to capillary condensation in the mesopores, followed by a plateau as the pores become filled. This is consistent with the values determined for mesopore surface area and cumulative pore volume.
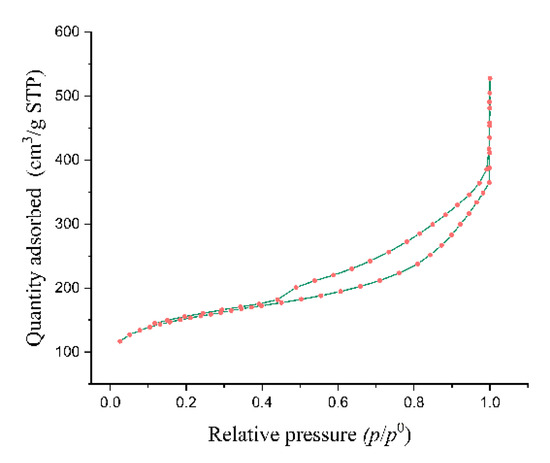
Figure 3.
Nitrogen adsorption/desorption isotherm of DEAC.
3.1.3. FE-SEM and EDX Analysis
Scanning electron microscopy is a powerful tool for characterizing porous materials, as it provides high-resolution images of surface morphology, pore structure, and texture. This can provide an insight into materials’ porosity, surface area, and heterogeneity, which are critical for understanding sorbent features and performance in their wide range of applications. The FE-SEM images of the analyzed sample at three magnifications are shown in Figure 4. At lower magnifications, the overall surface morphology of the sample is observed. Typically, activated carbon from plant sources exhibits a rough and porous surface due to the carbonization and activation processes. Macropores usually visible at this magnification originate from the starting fibrous structure of the raw plant. In the present case, honeycomb-like formations clearly reflect the present macropores as designated in Figure 4a. Largest particles seen at this magnification can range up to 100 µm. At higher magnification (Figure 4b), the focus is on the structures formed by the collapse of macropores. Remains of the arranged fibrous bits of the plant, at this magnification is noticed as particles irregular in size, shape and distribution. In this formation particles in the range from 10 to 20 µm can be noticed. Figure 4c presents a typical particle formed after the disintegration of lignocellulosic precursor. Its surface is covered with tiny powder-like debris involving particles smaller than 50 nm (Figure 4d). It is believed that these microscopic fragments come from the gas evaporating from the precursor during thermal treatment. Specifically, the carbonized grains may disintegrate and shrink in size because the plant’s fibers gradually lose water, as reported by Momčilović et al. [24]. As a result, the carbon-based particles depicted in the micrographs exhibit a broad range of diameters. In summary, as is common for activated carbon made from plant materials, the FE-SEM images most likely display a hierarchical pore structure comprising macropores, mesopores, and micropores. The morphology suggests that the carbonization and activation processes have effectively created a high-surface-area material with potential for various adsorption applications.
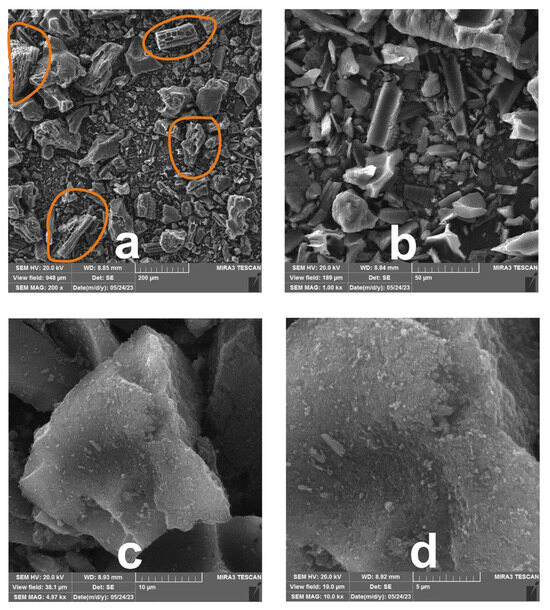
Figure 4.
FE-SEM micrographs of DEAC at nominal magnifications of (a) ×200, (b) ×1000, (c) ×5000, and (d) ×10,000.
3.2. Uptake Efficiency
3.2.1. Effect of pH
Sorption of organic compounds onto sorbent surfaces is a complex process that is impacted by numerous chemical variables. Among these, pH is crucial because it controls the speciation of the sorbent and the sorbate, which in turn influences the processes of their interaction. The sorbent’s surface charge and the sorbate’s ionization state can both be changed by pH variations, which can then affect the sorption process’s affinity and capacity. Optimizing sorption efficiency in commercial and environmental applications requires an understanding of these pH-dependent interactions. The effects of pH on AMB sorption onto DEAC are presented in Figure 5a.
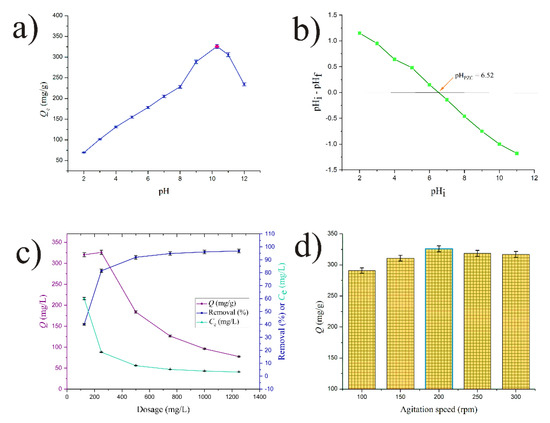
Figure 5.
(a) Effects of pH, (b) pHPZC of DEAC, (c) effect of dosage, (d) effect of stirring speed.
Amlodipine besylate has a pKa of around 8.7 [25]. This means that it is a predominantly basic compound prone to accepting the proton. At pH below 8.7, it is present in a solution in an ionized form and protonated. From this reason, there some repulsion may occur between its positive charge and the positively charged carbon surface. Above this value, AMB becomes deprotonated and it is present in its neutral form which is more likely to be bonded to the surface of the carbon sorbent by hydrophobic interactions and/or possibly π–π stacking.
These observations are in agreement with the estimations of the carbon surface charges determined by pHPZC (Figure 5b). It is evidenct that under pH 6.52, carbon’s surface is positively charged, while above this value it is negatively charged. The most acidic circumstances at pH 2.0 resulted in the lowest removal degree, which equated to 69.2 mg/g. While in acidic conditions positive charges both on sorbate and sorbent lead to repulsions and hinder sorption process, in basic conditions, these interactions diminish and the neutral AMB molecule is retained within the porous structure of the negatively charged DEAC, probably due to the possible hydrogen bonding, π–π stacking, and van der Waals interactions. Both the AMB molecule and the surface of DEAC are suspended in the electrostatically optimal configuration at pH around 10.0. In order to investigate the effects of initial sorbate concentrations, contacting times, and sorbent dosage, this pH value was chosen for all subsequent tests. Optimum charges decrease and sorption capacities decrease at pH 11.0 and 12.0.
3.2.2. Effect of Sorbent Dosage
Examining the sorbent dosage is critical for sorption process optimization since it directly affects the system’s capacity, efficiency, and equilibrium dynamics, which in turn determines how well the sorbent material captures the target analyte or pollutant overall. The effect of DEAC dosage on the sorption capacity and removal efficiency of AMB molecules is shown in Figure 5c. The findings show that as sorbent doses increase, removal efficiency gradually rises. Higher sorbent doses result in more active sites, some of which are left vacant throughout the sorption process, which explains this phenomenon. The highest removal efficiency of 96.8% was achieved at a dosage of 1.25 g/L. As the same figure illustrates, the sorption capacity decreases as the sorbent dosage increases, with a small exception at the dose of 0.25 g/L. This decline results from an imbalance between the concentration of AMB molecules available to bind to the activated carbon’s active sites and the greater sorbent dosage, as previously reported [25].
Additionally, Figure 5c shows that the amount of sorbent and the degree of removal are inversely related to the sorption capacity. The sorption capacity dropped from 320.4 mg/g to 77.4 mg/g when the sorbent dosage was raised from 0.125 g/L to 1.25 g/L, while the removal degree rose from 40.1% to 96.8%. The optimal sorbent dosage was determined to be 0.25 g/L, which balanced the opposing aspects of sorption capacity and removal degree. As a result, this dosage was used for all investigations, including kinetics, stirring speed, and pH impact.
3.2.3. Effect of Stirring Speed
As it directly affects the mass transfer kinetics, contact efficiency between the sorbent and the target analyte, and overall system homogeneity, the stirring speed is essential to the sorption process and has a major impact on the sorption performance. The results of the effect of stirring speed on the removal of AMB by DEAC are presented in Figure 5d, where it can be seen that the stirring speed has a modest influence on the removal efficiency. Increasing the stirring speed from 100 to 200 rpm led to gradual removal efficiency from 72.7 to 81.5%. Again, the removal efficiency slightly decreased to 79.2% when the stirring speed was increased to 300 rpm. The increase in sorption efficiency by the increase in the stirring speed was a result of the higher likelihood of contact between the drug molecules and DEAC particles. Speeds higher than 200 rpm lead to impaired sorption, probably due to favoring the desorption of previously retained sorbate. The main reason for the decrease in the extent of sorption of a sorbate when the stirring speed is increased beyond a certain value is the disruption of the boundary layer surrounding the sorbent particles. Additionally, at high stirring speeds, hydrodynamic forces can lead to the desorption of adsorbed molecules, especially if the sorption is not purely physical but involves weaker interactions (e.g., van der Waals forces or electrostatic interactions) [27]. Based on these results, the optimal stirring speed of 200 rpm was kept for all experiments.
3.2.4. Kinetic and Equilibrium Studies
Kinetic studies in sorption processes are crucial as they reveal the rate and mechanism of sorption, enabling the optimization of reaction conditions and sorbent efficiency. Designing efficient wastewater remediation technologies, estimating solute removal rates, and evaluating process scalability are all made easier with an understanding of kinetics.
AMB sorption kinetics onto DEAC is presented in Figure 6a. In the initial few minutes of contact, the sorption capacity increased significantly, rising steadily for an hour and a half before reaching final equilibrium after 120 min. During the course of sorption, gradual binding of the sorbate to the unoccupied sites on the sorbent surface prevails. The sorption process reached steady phase when there was a slight change in sorption capacity as the system came closer to equilibrium. It is noticeable from Figure 6a that during contacting, sorption capacity in the case of Ci = 50 mg/L increased from 28.8 mg/g after a couple of minutes to a final value of 133.8 mg/g, corresponding to equilibrium. In the case of Ci = 150 mg/L, a similar rise was noticed from 225.2 up to 420.2 mg/g as the maximum equilibrium value.
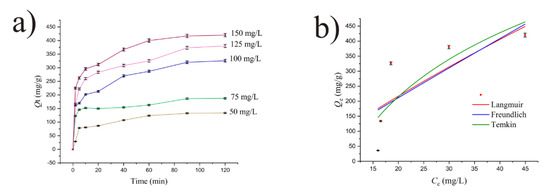
Figure 6.
(a) Kinetic and (b) isotherm modeling for AMB sorption onto DEAC.
Four kinetic models (defined in the Supplementary Materials) were investigated in order to determine the rate-controlling step and investigate the underlying mechanism in the context of comprehending the AMB removal process. Nonlinear plots of qt against time (t) were used to evaluate how well these models explained the sorption of AMB onto the synthesized DEAC. The results are given in Table 1. Coefficients of determination (r2), error functions, and theoretical sorption capacities obtained from these plots were used to evaluate these models. According to the findings, the pseudo-second-order kinetic model suited the experimental data well, producing high coefficients of determination and comparatively low RD and MRD values.

Table 1.
Kinetic parameters for the sorption of AMB onto DEAC.
Generally, the pseudo-second-order kinetic model assumes that the rate-limiting step involves chemisorption, where the adsorption rate is proportional to the square of the available sorption sites. It is widely applied to systems with strong adsorbate–adsorbent interactions and assumes valency forces or electron sharing govern the mechanism [28]. Another model which is worth considering is the Elovich model, which also resulted in high coefficients of determination. This model describes adsorption kinetics on highly heterogeneous surfaces, where the adsorption rate decreases exponentially with increasing surface coverage. It assumes a logarithmic relationship between adsorption rate and time, reflecting energetically non-uniform active sites, such as those in chemisorption processes. This model is also particularly useful for systems with strong adsorbent–adsorbate interactions. Unlike simpler models, it accounts for variations in activation energy due to surface heterogeneity or repulsive interactions between adsorbed species [29].
Nevertheless, the present findings allow for alternative interpretations of these two leading models. Although both models gave significant values of coefficients of determination (r2 above 0.9) and good fit between theoretical and experimental values for maximum sorption capacities, as confirmed by low RD and MRD values, it is highly unlikely to conclusively confirm the formation of chemical bonding between the functional groups in DEAC and AMB based solely on theoretical assumptions. On the other hand, it is rather expected that the main types of interaction involve van der Waals forces, hydrogen bonding, and interactions between the benzene rings. Related to the latter, this so called π–π stacking refers to non-covalent interactions between aromatic rings due to overlapping π-electron clouds. Since activated carbon contains graphitic (aromatic) domains, π–π stacking is critical for sorbing aromatic pollutants (e.g., dyes, benzene derivatives). The presence of aromatic rings in AMB aligns with the observed effect.
Regarding the pseudo-second-order kinetic model, there is confirmation that this model is empirical and widely applicable, not limited solely to chemisorption. As reported by Ho and McKay, this model fits data well for systems where adsorption depends on site availability (e.g., dye adsorption on activated carbon, which involves van der Waals forces). A similar rule is applicable to the Elovich kinetic model. While originally derived for chemisorption, the Elovich equation is empirically valid for heterogeneous surfaces, even with physisorption-dominated processes. Actually, both models are often misassigned to chemisorption since they fit many non-chemical mechanisms, such as those involving electrostatic adsorption, pore filling, etc. [30]. This is the reason why a mechanistic approach should be extended to instrumental techniques which may be employed to detect functional groups figuring in sorption along with theoretical knowledge in interpretation of possible interactions among them. The most probable scenario in AMB retaining in the porous structure of the tested carbon sorbent involves interactions between hydroxy, carbonyl, anhydride, carboxyl, pyrone, phenol, phenyl, lactone, ketone, and other functional groups, as depicted in Figure S2.
The results of the equilibrium studies and subsequent nonlinear fittings to the Langmuir, Freundlich, and Temkin isotherm models, which are represented in Figure 6b (r2 = 0.48, 0.48, and 0.58, respectively), suggest that the sorption of AMB onto the examined activated carbon does not follow the idealized sorption behaviors described by these models. The relatively low coefficients of determination indicate that the sorption process may involve complex mechanisms beyond simple physical sorption, such as multilayer sorption, surface heterogeneity, or molecular interactions between AMB and the DEAC’s surface. The poor fit across all models points to the need for further exploration of alternative techniques, which could help clarify the nature of the sorption process and the role of surface characteristics in the overall sorption behavior.
The methylene blue number of the DEAC sample was determined to be 175 mg/g, reflecting its general sorption capacity. This value is relatively high compared to other commercially available activated carbons, indicating a significant potential for its applications in water purification and environmental remediation. The results suggest that the DEAC possesses favorable surface characteristics for effective dye removal. The graph depicting the MB sorption principle at different initial concentrations is given in the Supplementary Materials (Figure S3).
3.2.5. Reusability Study
AMB sorption/desorption tests onto DEAC were run through six cycles in a row and the outcome is shown in Figure 7. The AMB removal efficiency, which was 81.47% at the conclusion of the first cycle, dropped to 75.89% by the end of the sixth cycle. The irreversible saturation of active sorption sites or even slight structural changes influenced by sorbent washing are likely the motive of this slow progression. Even after six cycles, this carbon-based sorbent was still very effective and quite stable, as seen by the decrease of less than 1.2% in the removal extent between the fifth and sixth cycle.
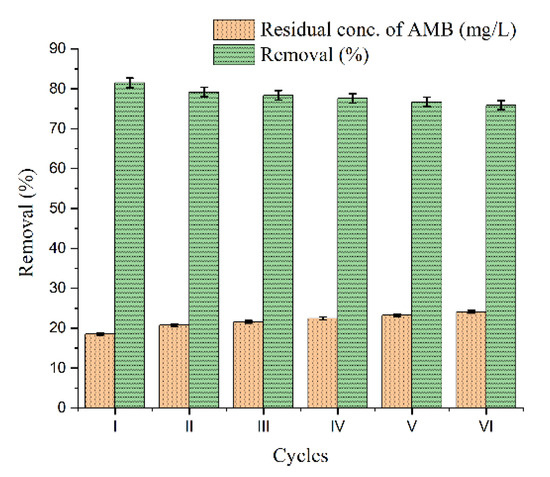
Figure 7.
Reusability study of DEAC for removal of AMB after six consecutive cycles.
3.2.6. Comparison of DEAC with the Literature
There are scarce scientific data on the sorptive removal of AMB. In a rare case dedicated to this matter, seed pods of Delonix regia were reported as a practicable precursor for the production of activated carbon with a dominant acidic group on the surface. The material demonstrated great effectiveness in removing amlodipine from aqueous solution following the pseudo-second-order kinetics with a sorption capacity of 56.5 mg/g at 30 °C. In addition, the sorption of AMB onto this cost-effective activated carbon was shown to be spontaneous and exothermic [31].
4. Conclusions
This study demonstrates that the sorption of AMB onto DEAC is highly dependent on pH, with optimal removal at pH 10.0 due to minimized electrostatic repulsions, while acidic conditions reduce efficiency. Stirring speed also plays a key role, with 200 rpm providing the best balance between mass transfer and sorption efficiency. Kinetic studies reveal that sorption occurs rapidly in the first 90 min before reaching equilibrium at 120 min, with capacity increasing proportionally to the initial AMB concentration. The pseudo-second-order model best fits the experimental data. Additionally, the Elovich model’s high accuracy further confirms surface heterogeneity. Sorbent dosage optimization (0.25 g/L) balances removal efficiency (96.8%) and sorption capacity, avoiding excess active site saturation. These findings highlight the importance of optimizing operational parameters (pH, stirring speed, and dosage) for maximizing AMB removal. The kinetic insights aid in designing efficient wastewater treatment systems by predicting solute removal rates and scalability. Overall, this research provides a comprehensive understanding of AMB sorption dynamics, offering practical guidelines for environmental and industrial applications of activated carbon derived from dwarf elder.
Supplementary Materials
The following supporting information can be downloaded at: https://www.mdpi.com/article/10.3390/pr13051483/s1, Figure S1: Pore size distribution estimated by the Barrett-Joyner-Halenda model. Figure S2. Types of possible interactions between DEAC and AMB crucial for mechanistic theory of sorption. Figure S3. Isotherm for methylene blue sorption onto DEAC (50 mg of activated carbon, 50 mL solution of MB ranging from 100 to 350 mg/L, 24 h at 25 °C). References [28,29,32,33,34,35,36,37] are cited in the Supplementary Materials.
Author Contributions
Conceptualization, M.Z.M. and A.N.; Methodology, M.Z.M. and L.S.; Formal analysis, M.Z.M., V.D. and S.K.; Investigation, M.Z.M. and S.K.; Data curation, V.D.; Writing—original draft, M.Z.M.; Writing—review & editing, M.P., L.S. and A.N.; Visualization, M.Z.M.; Supervision, A.L.B. All authors have read and agreed to the published version of the manuscript.
Funding
This research work was supported by the Serbian Ministry of Science, Technological Development and Innovations under the projects numbered 451-03-136/2025-03/200124, 451-03-137/2025-03/200124, and 451-03-136/2025-03/200017.
Data Availability Statement
The raw data supporting the conclusions of this article will be made available by the authors on request.
Conflicts of Interest
The authors declare no conflict of interest.
References
- Fares, H.; DiNicolantonio, J.J.; O’Keefe, J.H.; Lavie, C.J. Amlodipine in hypertension: A first-line agent with efficacy for improving blood pressure and patient outcomes. Open Heart 2016, 3, e000473. [Google Scholar] [CrossRef] [PubMed]
- Huber, S.; Remberger, M.; Kaj, L.; Schlabach, M.; Jorundsdottir, H.O.; Vester, J.; Arnorsson, M.; Mortensen, I.; Schwartson, R.; Dam, M. A first screening and risk assessment of pharmaceuticals and additives in personal care products in waste water, sludge, recipient water and sediment from Faroe Islands, Iceland and Greenland. Sci. Total Environ. 2016, 562, 13–25. [Google Scholar] [CrossRef] [PubMed]
- Meador, J.P.; Yeh, A.; Young, G.; Gallagher, E.P. Contaminants of emerging concern in a large temperate estuary. Environ. Pollut. 2016, 213, 254–267. [Google Scholar] [CrossRef] [PubMed]
- Wang, M.; Shi, H.; Shao, S.; Lu, K.; Wang, H.; Yang, Y.; Gong, Z.; Zuo, Y.; Gao, S. Montmorillonite promoted photodegradation of amlodipine in natural water via formation of surface complexes. Chemosphere 2022, 286, 131641. [Google Scholar] [CrossRef] [PubMed]
- Alizadeh, E.; Baseri, H. Catalytic degradation of Amlodipine Besylate using ZnO, Cu doped ZnO, and Fe doped ZnO nanoparticles from an aqueous solution: Investigating the effect of different parameters on degradation efficiency. Solid State Sci. 2018, 78, 86–94. [Google Scholar] [CrossRef]
- Rabhi, S.; Belkacemi, H.; Bououdina, M.; Kerrami, A.; Ait Brahem, L.; Sakher, E. Effect of Ag doping of TiO2 nanoparticles on anatase-rutile phase transformation and excellent photodegradation of amlodipine besylate. Mater. Lett. 2019, 236, 640–643. [Google Scholar] [CrossRef]
- Peng, J.; Chang, Y.; Wang, Z.; Liu, J.; Wang, S.; Zhang, Y.; Shao, S.; Liu, D.; Zhang, Y.; Shi, J.; et al. Amlodipine removal via peroxymonosulfate activated by carbon nanotubes/cobalt oxide (CNTs/Co3O4) in water. Environ. Sci. Pollut. Res. 2022, 29, 11091–11100. [Google Scholar] [CrossRef]
- Shao, S.; Qian, L.; Zhan, X.; Wang, M.; Lu, K.; Peng, J.; Miao, D.; Gao, S. Transformation and toxicity evolution of amlodipine mediated by cobalt ferrite activated peroxymonosulfate: Effect of oxidant concentration. Chem. Eng. J. 2020, 382, 123005. [Google Scholar] [CrossRef]
- Rangabhashiyam, S.; Lata, S.; Balasubramanian, P. Biosorption characteristics of methylene blue and malachite green from simulated wastewater onto Carica papaya wood biosorbent. Surf. Interfaces 2018, 10, 197–215. [Google Scholar] [CrossRef]
- Viotti, P.V.; Moreira, W.M.; dos Santos, O.A.A.; Bergamasco, R.; Vieira, A.M.S.; Vieira, M.F. Diclofenac removal from water by adsorption on Moringa oleifera pods and activated carbon: Mechanism, kinetic and equilibrium study. J. Clean. Prod. 2019, 219, 809–817. [Google Scholar] [CrossRef]
- Sathishkumar, P.; Arulkumar, M.; Ashokkumar, V.; Mohd Yusoff, A.R.; Murugesan, K.; Palvannan, T.; Salam, Z.; Ani, F.N.; Hadibarata, T. Modified phyto-waste Terminalia catappa fruit shells: A reusable adsorbent for the removal of micropollutant diclofenac. RSC Adv. 2015, 5, 30950–30962. [Google Scholar] [CrossRef]
- Selmi, T.; Sanchez-Sanchez, A.; Gadonneix, P.; Jagiello, J.; Seffen, M.; Sammouda, H.; Celzard, A.; Fierro, V. Tetracycline removal with activated carbons produced by hydrothermal carbonisation of Agave americana fibres and mimosa tannin. Ind. Crops Prod. 2018, 115, 146–157. [Google Scholar] [CrossRef]
- Beltrame, K.K.; Cazetta, A.L.; de Souza, P.S.C.; Spessato, L.; Silva, T.L.; Almeida, V.C. Adsorption of caffeine on mesoporous activated carbon fibers prepared from pineapple plant leaves. Ecotoxicol. Environ. Saf. 2018, 147, 64–71. [Google Scholar] [CrossRef]
- Pezoti, O.; Cazetta, A.L.; Bedin, K.C.; Souza, L.S.; Martins, A.C.; Silva, T.L.; Santos Júnior, O.O.; Visentainer, J.V.; Almeida, V.C. NaOH-activated carbon of high surface area produced from guava seeds as a high-efficiency adsorbent for amoxicillin removal: Kinetic, isotherm and thermodynamic studies. Chem. Eng. J. 2016, 288, 778–788. [Google Scholar] [CrossRef]
- Beesley, L.; Marmiroli, M.; Pagano, L.; Pigoni, V.; Fellet, G.; Fresno, T.; Vamerali, T.; Bandiera, M.; Marmiroli, N. Biochar addition to an arsenic contaminated soil increases arsenic concentrations in the pore water but reduces uptake to tomato plants (Solanum lycopersicum L.). Sci. Total Environ. 2013, 454–455, 598–603. [Google Scholar] [CrossRef]
- Modenes, A.N.; de Oliveira, A.P.; Espinoza-Quiñones, F.R.; Trigueros, D.E.G.; Kroumov, A.D.; Borba, C.E.; Hinterholz, C.L.; Bergamasco, R. Potential of Salvinia auriculata biomass as biosorbent of the Cr(III): Directed chemical treatment, modeling and sorption mechanism study. Environ. Technol. 2017, 38, 1474–1488. [Google Scholar] [CrossRef]
- Pieri, V.; Schwaiger, S.; Ellmerer, E.P.; Stuppner, H. Iridoid glycosides from the leaves of Sambucus ebulus. J. Nat. Prod. 2009, 72, 1798–1803. [Google Scholar] [CrossRef]
- Zahmanov, G.; Alipieva, K.; Denev, P.; Todorov, D.; Hinkov, A.; Shishkov, S.; Simova, S.; Georgiev, M.I. Flavonoid glycosides profiling in dwarf elder fruits (Sambucus ebulus L.) and evaluation of their antioxidant and anti-herpes simplex activities. Ind. Crops Prod. 2015, 63, 58–64. [Google Scholar] [CrossRef]
- Jabbari, M.; Hashempur, M.H.; Emami Razavi, S.Z.; Raeisi Shahraki, H.; Kamalinejad, M.; Emtiazy, M. Efficacy and short-term safety of topical Dwarf Elder (Sambucus ebulus L.) versus diclofenac for knee osteoarthritis: A randomized, double-blind, active-controlled trial. J. Ethnopharmacol. 2016, 188, 80–86. [Google Scholar] [CrossRef]
- Jabbari, M.; Daneshfard, B.; Emtiazy, M.; Khiveh, A.; Hashempur, M.H. Biological Effects and Clinical Applications of Dwarf Elder (Sambucus ebulus L.): A Review. J. Evid. -Based Complement. Altern. Med. 2017, 22, 996–1001. [Google Scholar] [CrossRef]
- Barrett, E.P.; Joyner, L.G.; Halenda, P.P. The determination of pore volume and area distributions in porous substances. I. Computations from nitrogen isotherms. J. Am. Chem. Soc. 1951, 73, 373–380. [Google Scholar] [CrossRef]
- Lippens, B.C.; Linsen, B.G.; de Boer, J.H. Studies on pore systems in catalysts I. The adsorption of nitrogen; apparatus and calculation. J. Catal. 1964, 3, 32–37. [Google Scholar] [CrossRef]
- Thommes, M.; Kaneko, K.; Neimark, A.V.; Olivier, J.P.; Rodriguez-Reinoso, F.; Rouquerol, J.; Sing, K.S.W. Physisorption of gases, with special reference to the evaluation of surface area and pore size distribution (IUPAC Technical Report). Pure Appl. Chem. 2015, 87, 1051–1069. [Google Scholar] [CrossRef]
- Momčilović, M.Z.; Vučić, M.R.; Meseldžija, S.; Velinov, N.; Suručić, L.; Bojić, A.L. Batch sorption dynamics and equilibrium for the capture of Ni(II) onto activated carbon developed from yellow dock (Rumex crispus). In Biomass Conversion and Biorefinery Online First; Springer Nature: Berlin, Germany, 2024. [Google Scholar] [CrossRef]
- van Zwieten, P.A. Amlodipine: An overview of its pharmacodynamic and pharmacokinetic properties. Clin. Cardiol. 1994, 17, III3–III6. [Google Scholar] [PubMed]
- Aboli, L.E.; Jafari, D.; Esmaeili, H. Heavy metal ions (lead, cobalt, and nickel) biosorption from aqueous solution onto activated carbon prepared from Citrus limetta leaves. Carbon Lett. 2020, 30, 683–698. [Google Scholar] [CrossRef]
- Sarici-Ozdemir, C. Adsorption and desorption kinetics behaviour of methylene blue onto activated carbon, Physicochem. Probl. Miner. Process. 2012, 48, 441–454. [Google Scholar] [CrossRef]
- Ho, Y.S.; McKay, G. Kinetic models for the sorption of dye from aqueous solution by wood. Process Saf. Environ. Prot. 1998, 76, 183–191. [Google Scholar] [CrossRef]
- Huiyuan, T.; Yang, L.; Mengyan, X.; Baoyu, C.; Chang, L.; Xiuhong, D.; Zehu, W.; Xianying, D.; Jiehu, C. The enhanced adsorption of layered double hydroxides modification from single to ternary metal for fluoride by tea-assisted hydrothermal method. Arab. J. Chem. 2024, 17, 105645. [Google Scholar] [CrossRef]
- Tan, K.L.; Hameed, B.H. Insight into the adsorption kinetics models for the removal of contaminants from aqueous solutions. J. Taiwan Inst. Chem. Eng. 2017, 74, 25–48. [Google Scholar] [CrossRef]
- Ibrahim, A.O.; Olagunju, A.O.; Agboola, S.O.; Bello, O.S. Adsorption of amlodipine on surface-modified activated carbon derived from Delonix regia seed pod. J. Dispers. Sci. Technol. 2024, 1–13. [Google Scholar] [CrossRef]
- Lagergren, S. Zur Theorie der sogenannten Adsorption gelöster Stoffe (About the theory of so-called adsorption of soluble substances). Kungliga Svenska Vetenskapsakademiens Handl 1898, 24, 1–39. [Google Scholar] [CrossRef]
- Gupta, S.S.; Bhattacharyya, K.G. Kinetics of adsorption of metal ions on inorganic materials: A review. Adv. Colloid Interface Sci. 2011, 162, 39–58. [Google Scholar] [CrossRef] [PubMed]
- Weber, W.J.; Morris, J.C. Kinetics of adsorption on carbon from solution. J. Sanit. Eng. Div. 1964, 89, 31–60. [Google Scholar] [CrossRef]
- Langmuir, I. The adsorption of gases on plane surfaces of glass, mica and platinum. J. Am. Chem. Soc. 1918, 40, 1361–1403. [Google Scholar] [CrossRef]
- Freundlich, H. Über die adsorption in Lösungen. Z. Phys. Chem. 1906, 57, 385–470. [Google Scholar] [CrossRef]
- Ho, Y.S.; Porter, J.F.; McKay, G. Equilibrium isotherm studies for the sorption of divalent metal ions onto peat: Copper, nickel and lead single component systems. Water Air Soil Pollut. 2002, 141, 1–33. [Google Scholar] [CrossRef]
Disclaimer/Publisher’s Note: The statements, opinions and data contained in all publications are solely those of the individual author(s) and contributor(s) and not of MDPI and/or the editor(s). MDPI and/or the editor(s) disclaim responsibility for any injury to people or property resulting from any ideas, methods, instructions or products referred to in the content. |
© 2025 by the authors. Licensee MDPI, Basel, Switzerland. This article is an open access article distributed under the terms and conditions of the Creative Commons Attribution (CC BY) license (https://creativecommons.org/licenses/by/4.0/).