Article

Optimization Design of Drip Irrigation System Pipe Network Based on PSO-GA: A Case Study of Northwest China

1
State Key Laboratory of Eco-Hydraulics in Northwest Arid Region of China, Xi’an University of Technology, Xi’an 710048, China
2
School of Civil Engineering, Xijing University, Xi’an 710123, China
*
Author to whom correspondence should be addressed.
Processes 2025, 13(5), 1485; https://doi.org/10.3390/pr13051485
Submission received: 9 April 2025 / Revised: 3 May 2025 / Accepted: 6 May 2025 / Published: 12 May 2025
(This article belongs to the Section Process Control and Monitoring)

Abstract

:
Implementing drip irrigation technology in water-scarce regions is a key development direction for modern agriculture. This paper proposes a multi-constraint optimization model based on a particle swarm optimization-genetic algorithm (PSO-GA) to minimize the annual cost of construction, energy consumption, and maintenance of a drip irrigation pipe network. This case study shows that the PSO-GA is significantly better than the traditional empirical method, particle swarm optimization (PSO), the genetic algorithm (GA), and an Atom Search Optimization (ASO) algorithm in the optimization of the pipeline’s network parameters, and the total annual cost is reduced by 21.2%, 15.9%, 7.5%, and 6.3%, respectively. The average total cost of the PSO-GA is 166,200 yuan/year, and the constraint satisfaction rate for the node pressure and flow rate is better than that with a single algorithm. After optimization, the diameter of the main pipe in the pipe network is gradually reduced from 200 mm to 160 mm, the number of branch pipes is reduced from five to four, the pump head is reduced by 25.7%, and the cost of energy consumption is reduced by 26.7%. This study provides a powerful optimization tool for drip irrigation system designers to achieve efficient optimization of the parameters and costs of drip irrigation systems.

1. Introduction

In areas with water shortages, the traditional extensive irrigation mode makes it difficult to coordinate the contradiction between water use and the sustainable development of agriculture [1,2,3,4]. Drip irrigation technology directly transports water and nutrients to the roots of crops through the pipe network system to achieve precise water control and on-demand supply. It has many advantages, such as reducing soil evaporation, improving irrigation efficiency, increasing crop yield, and providing strong adaptability to topography and soil. It is the key technology for realizing agricultural modernization and refinement. At present, the large-scale application of drip irrigation technology still faces cost barriers. The construction investment for a pipe network accounts for more than half of the cost of a drip irrigation system [5]. The optimal design for a drip irrigation system pipe network is an important aspect of efficient water distribution in the agricultural environment. The scientific selection of economical and effective pipe network parameters remains a hot research topic. Many scholars have proposed various schemes for optimizing drip irrigation pipe network systems to achieve a cost-effective, stable, and reliable drip irrigation pipe network system designs.
Drip irrigation network optimization is a typical complex nonlinear problem. Reasonable pipe network planning and parameter selection can effectively reduce the construction and operation costs of drip irrigation systems. Compared with designs using traditional empirical methods, intelligent algorithms can quickly and reliably obtain better solutions to achieve pipe network optimization. Dandy et al. [6] proposed a nonlinear model considering the shift mode, pipe size, and pump performance which divided the field into sub-units to determine the lowest cost solution. Yoo et al. [7] used the harmony search algorithm to estimate the optimal diameter for an irrigation water supply system in circular agriculture and verified the practical application of this optimization technology in the design of irrigation systems in their actual research area. Masoumi et al. [8] considered both the investment and annual energy costs and designed an on-demand pressurized irrigation network using multi-objective optimization. In their study, the network layout and the pipeline size were optimized at the same time, and an economical, efficient, and energy-saving irrigation system was designed.
Klyushin et al. [9] proposed an AI system based on modern mathematical methods for the optimal control and design of drip irrigation systems. This method optimizes the design and control of drip irrigation systems to achieve sustainable agriculture and effectiveness in environmental protection. Zhao et al. [10] simultaneously optimized pipe network layout and pipe diameter based on a genetic algorithm. Their case shows that the optimized pipe network layout and pipe diameter effectively reduced the investment costs by 21.3% and solved the problem of low design efficiency and high costs in self-pressure drip irrigation systems. Duan et al. [11] proposed an optimization method for a large-scale, multi-stage gravity drip irrigation pipe network system based on an atomic search algorithm and simultaneously optimized the pipe network layout and the selection of the pipe diameter in a two-stage gravity drip irrigation system in Xinjiang, China. Zhang et al. [12] proposed a chaotic beetle swarm optimization (CBSO) method and applied it to the optimization of an intelligent drip irrigation control system. The response time of PID control in a drip irrigation control system optimized using this algorithm was short, and the performance of the system improved. Bakhtiar Karimi et al. [13] proposed an adaptive neuro-fuzzy inference system based on fuzzy c-means clustering combined with an ANFIS-FCM-PSOGSA algorithm to accurately select the distance between the lateral pipe and the nozzle and effectively optimize the nozzle depth. In recent years, Fan et al. [14] used the Jaya algorithm to optimize the pipe layout and the pipe diameter selection in a drip irrigation network system, thereby optimizing the pipe network parameters of a drip irrigation area in Xinjiang, China. Wang et al. [15] established a prediction model for the critical non-depositional velocity of sediments in a drip irrigation branch pipe based on the PSO-SVM method. Chili Lima et al. [16] used an AquaCrop Plug-in-PSO method to optimize irrigation scheduling for maize. Batmaz et al. [17] optimized the design of a large-scale water distribution network using CSBO. Córdoba et al. [18] used a GA to reduce the heterogeneity of the flow in drip irrigation networks. Good optimization results were achieved. Considering various factors such as cost, energy efficiency, and system reliability, the above scholars have optimized the pipe network design for various drip irrigation systems using innovative methods and optimization techniques and improved the performance and sustainable development of agricultural irrigation systems.
Particle swarm optimization (PSO) is a commonly used optimization algorithm for pipeline network planning and parameter selection [19,20,21], but it is prone to falling into local optima problems when dealing with parameter optimization problems in complex scenarios. In response to this defect, many scholars have effectively improved the PSO algorithm and applied it to urban water supply [22,23], submarine oil [24], natural gas [25], and even nuclear power [26].
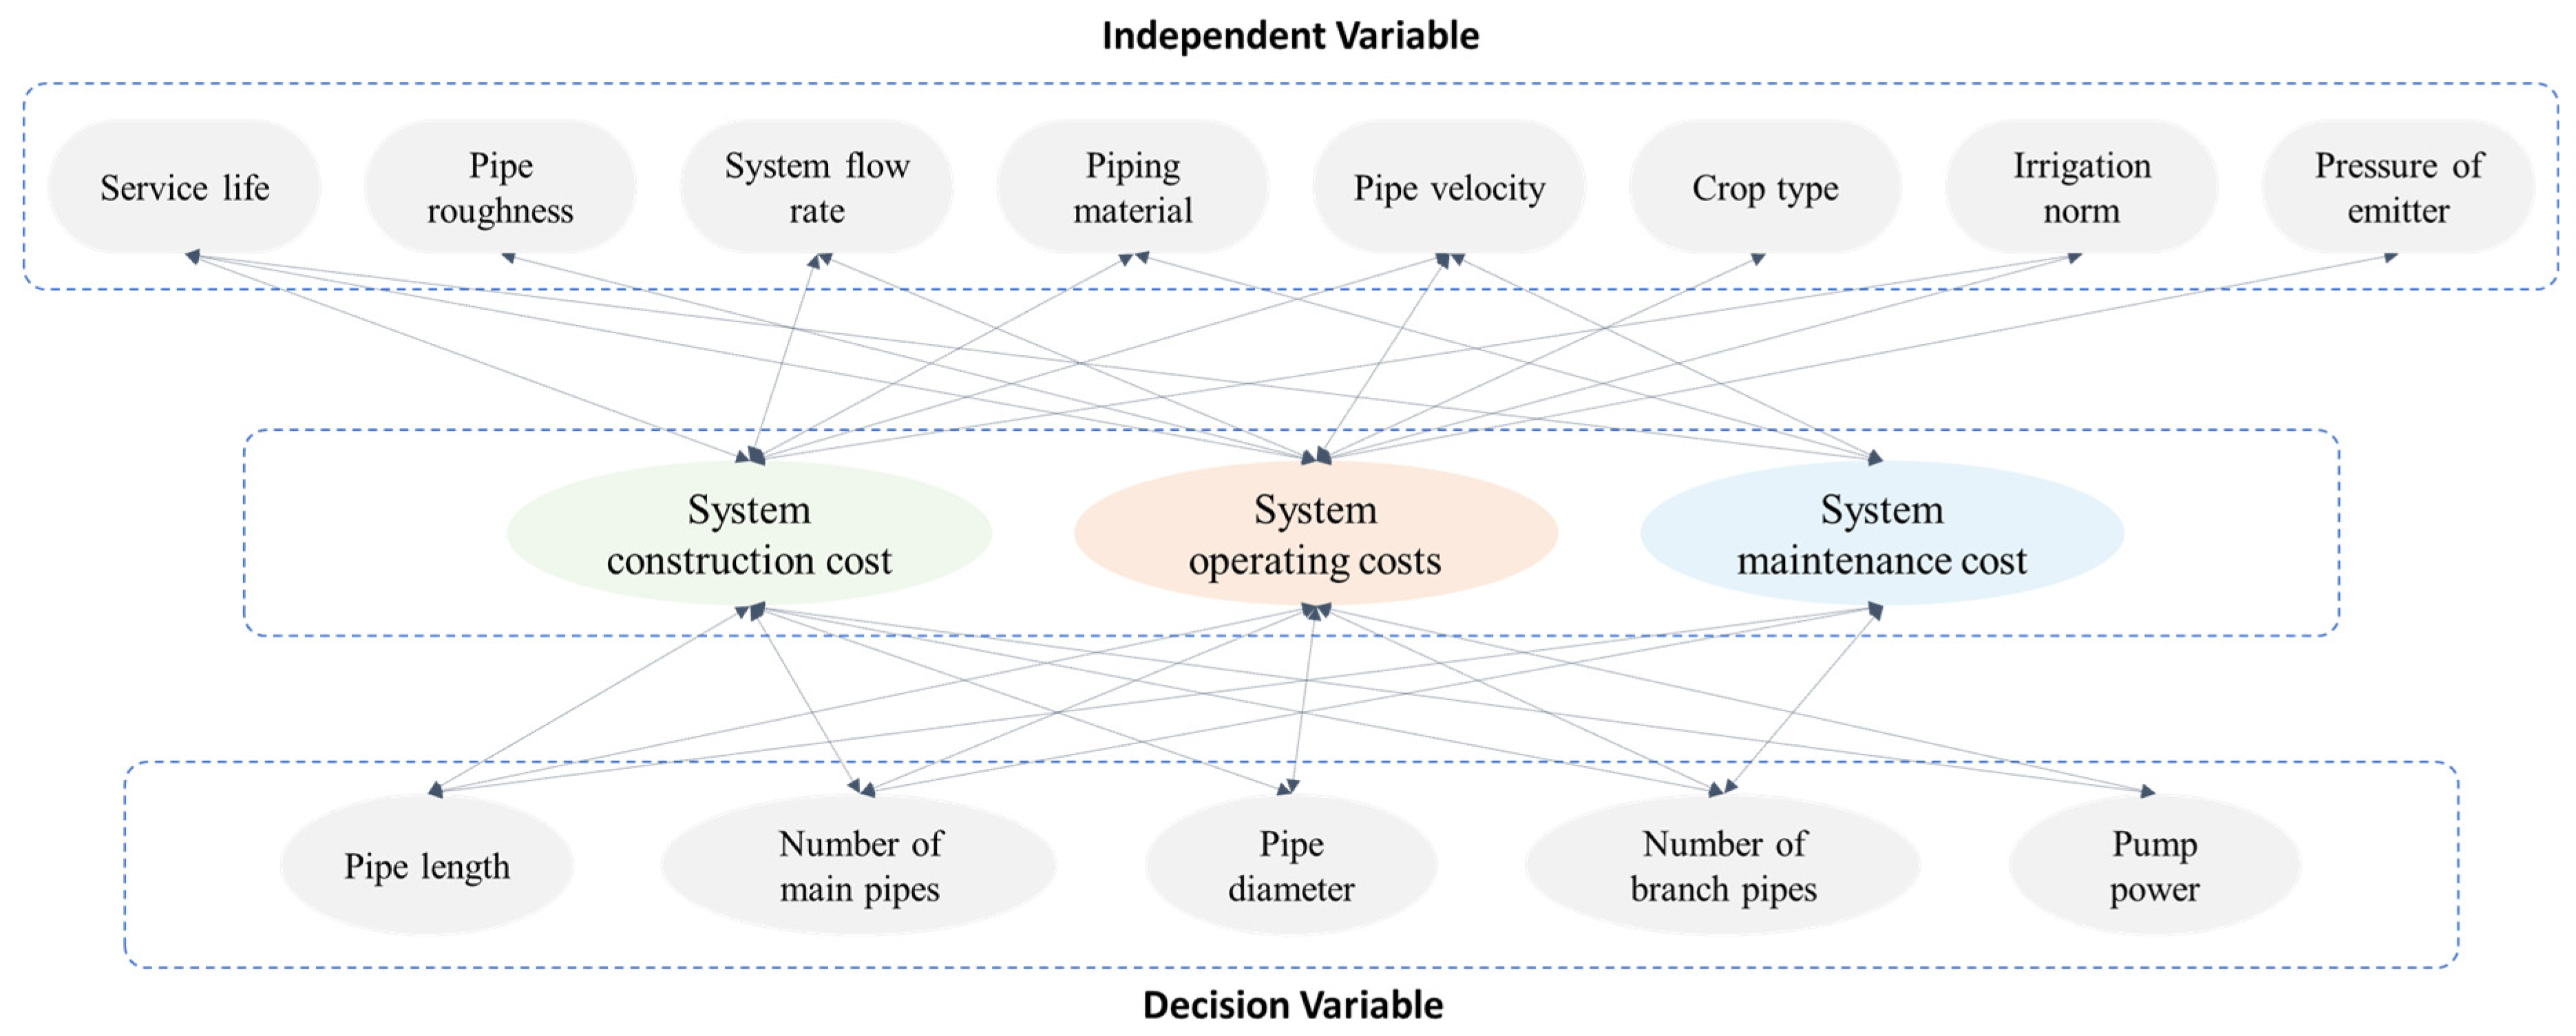
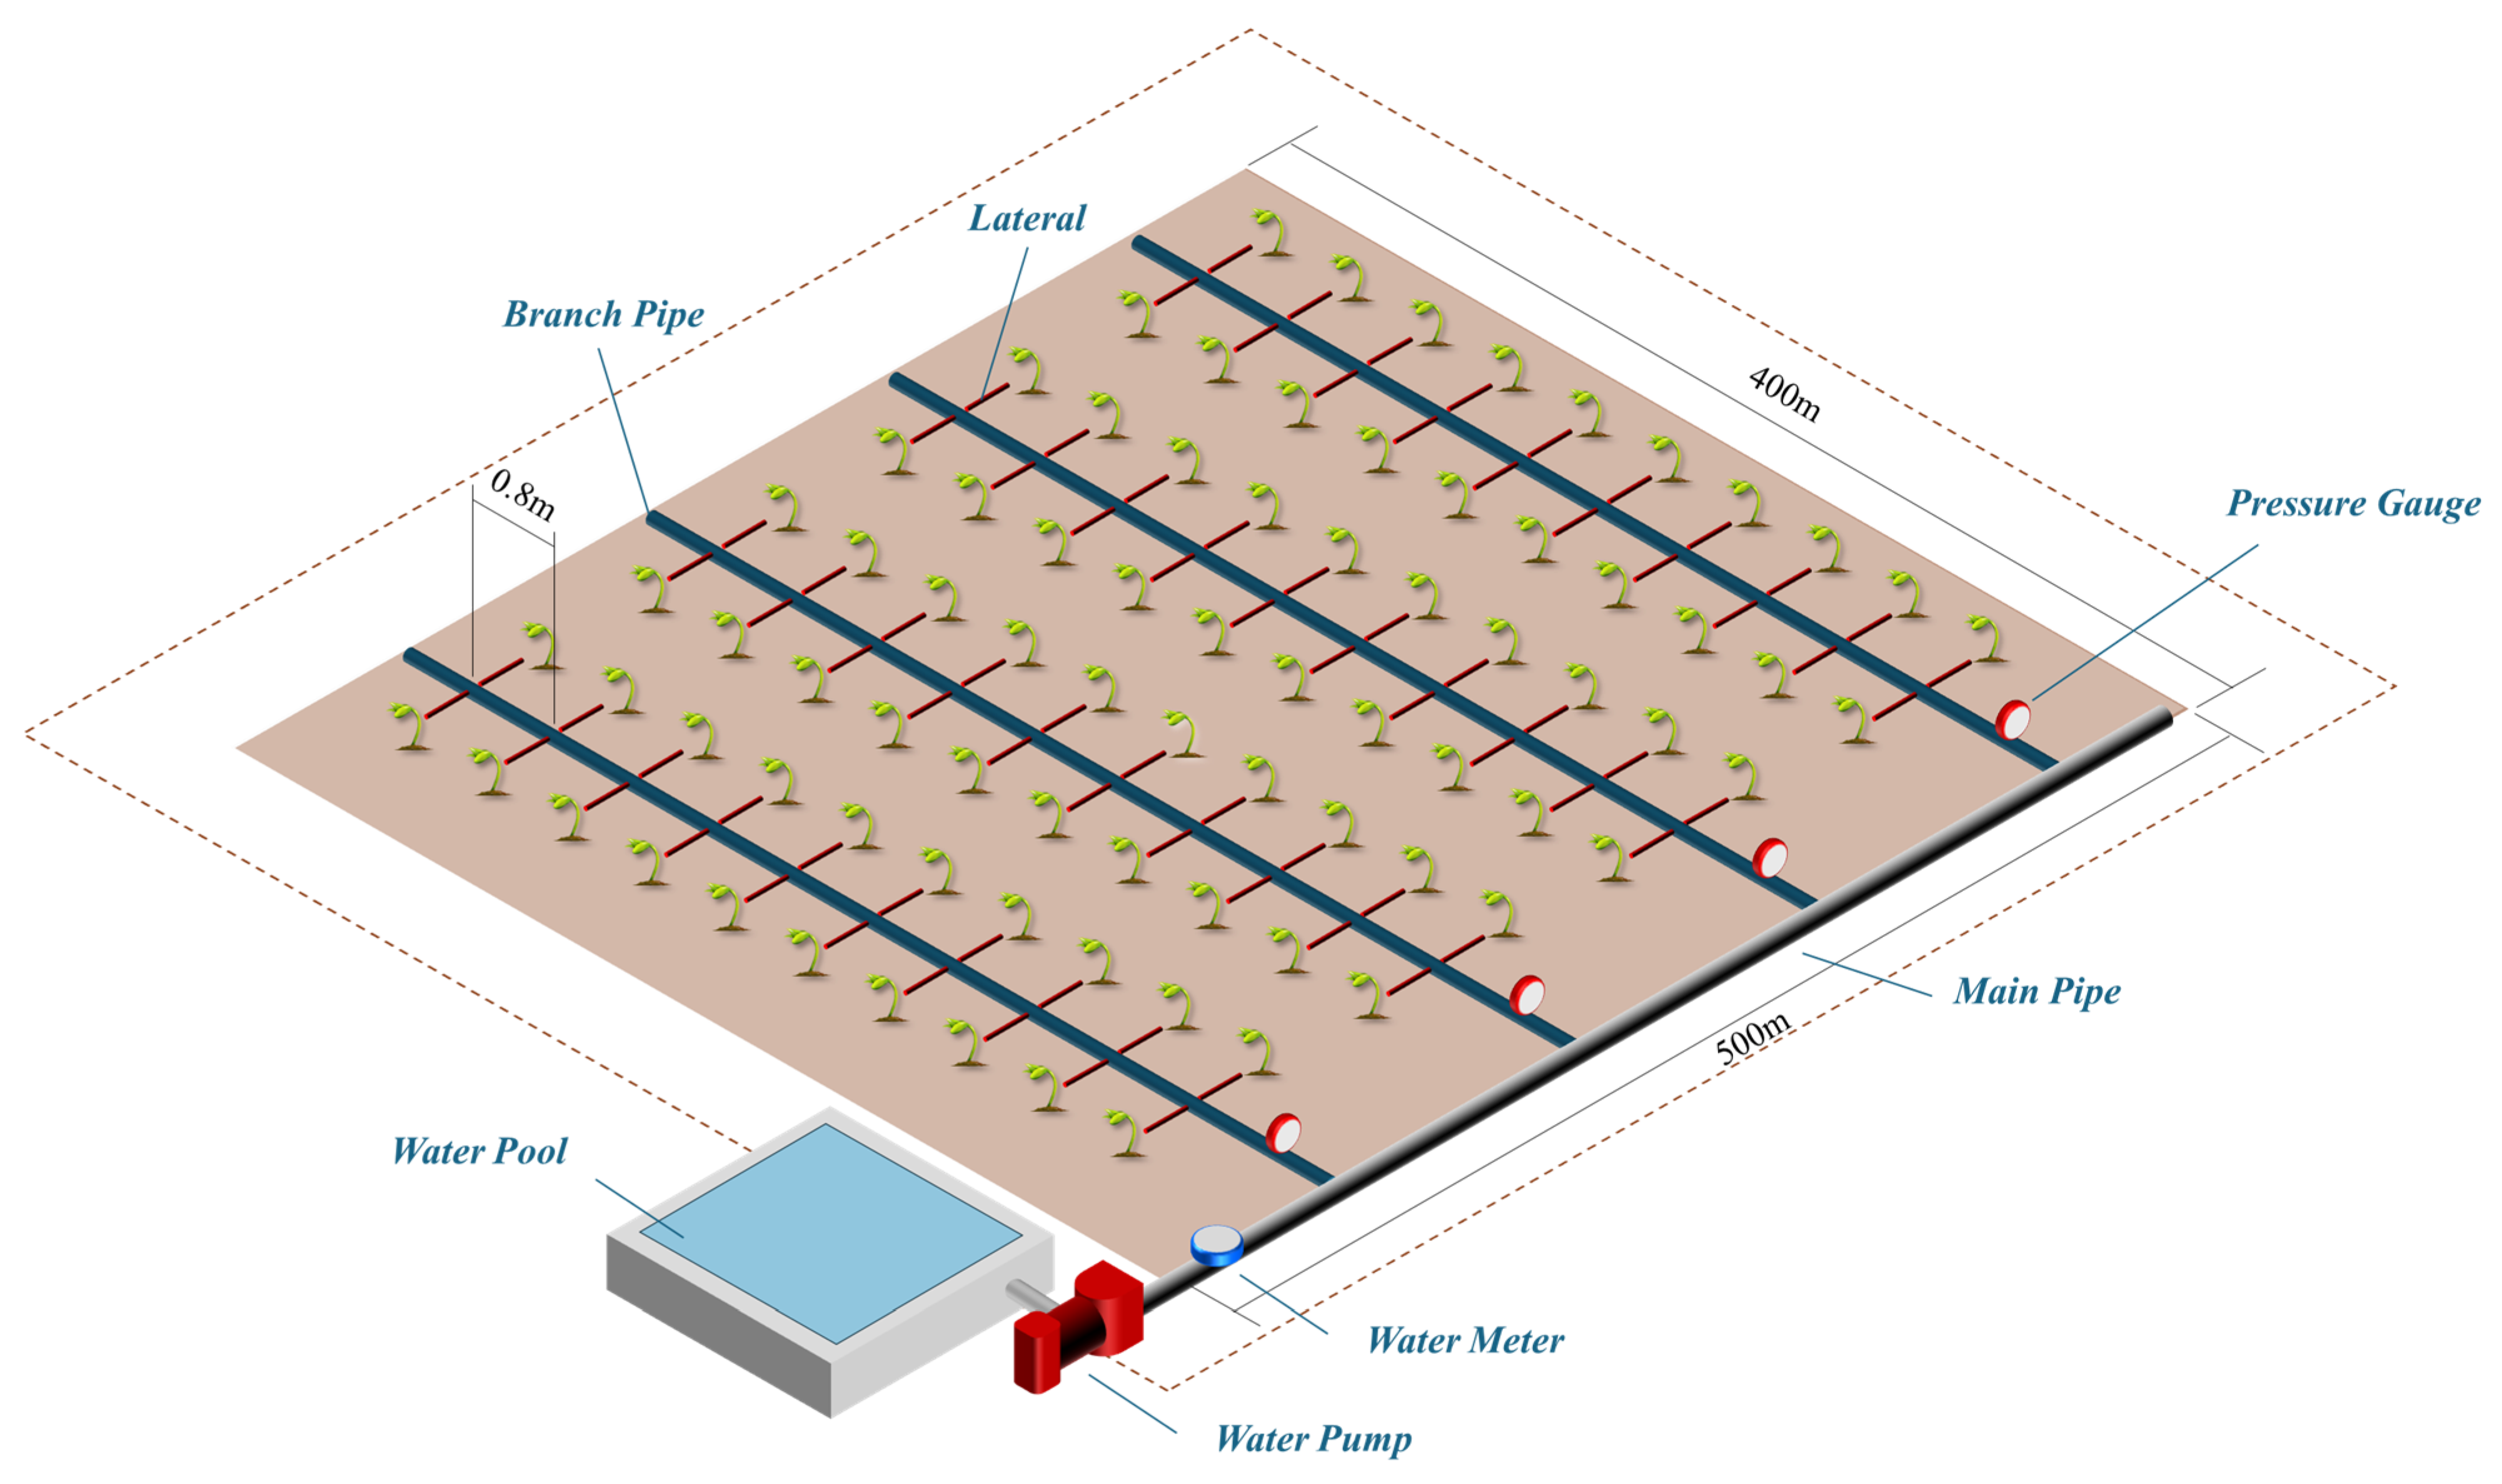
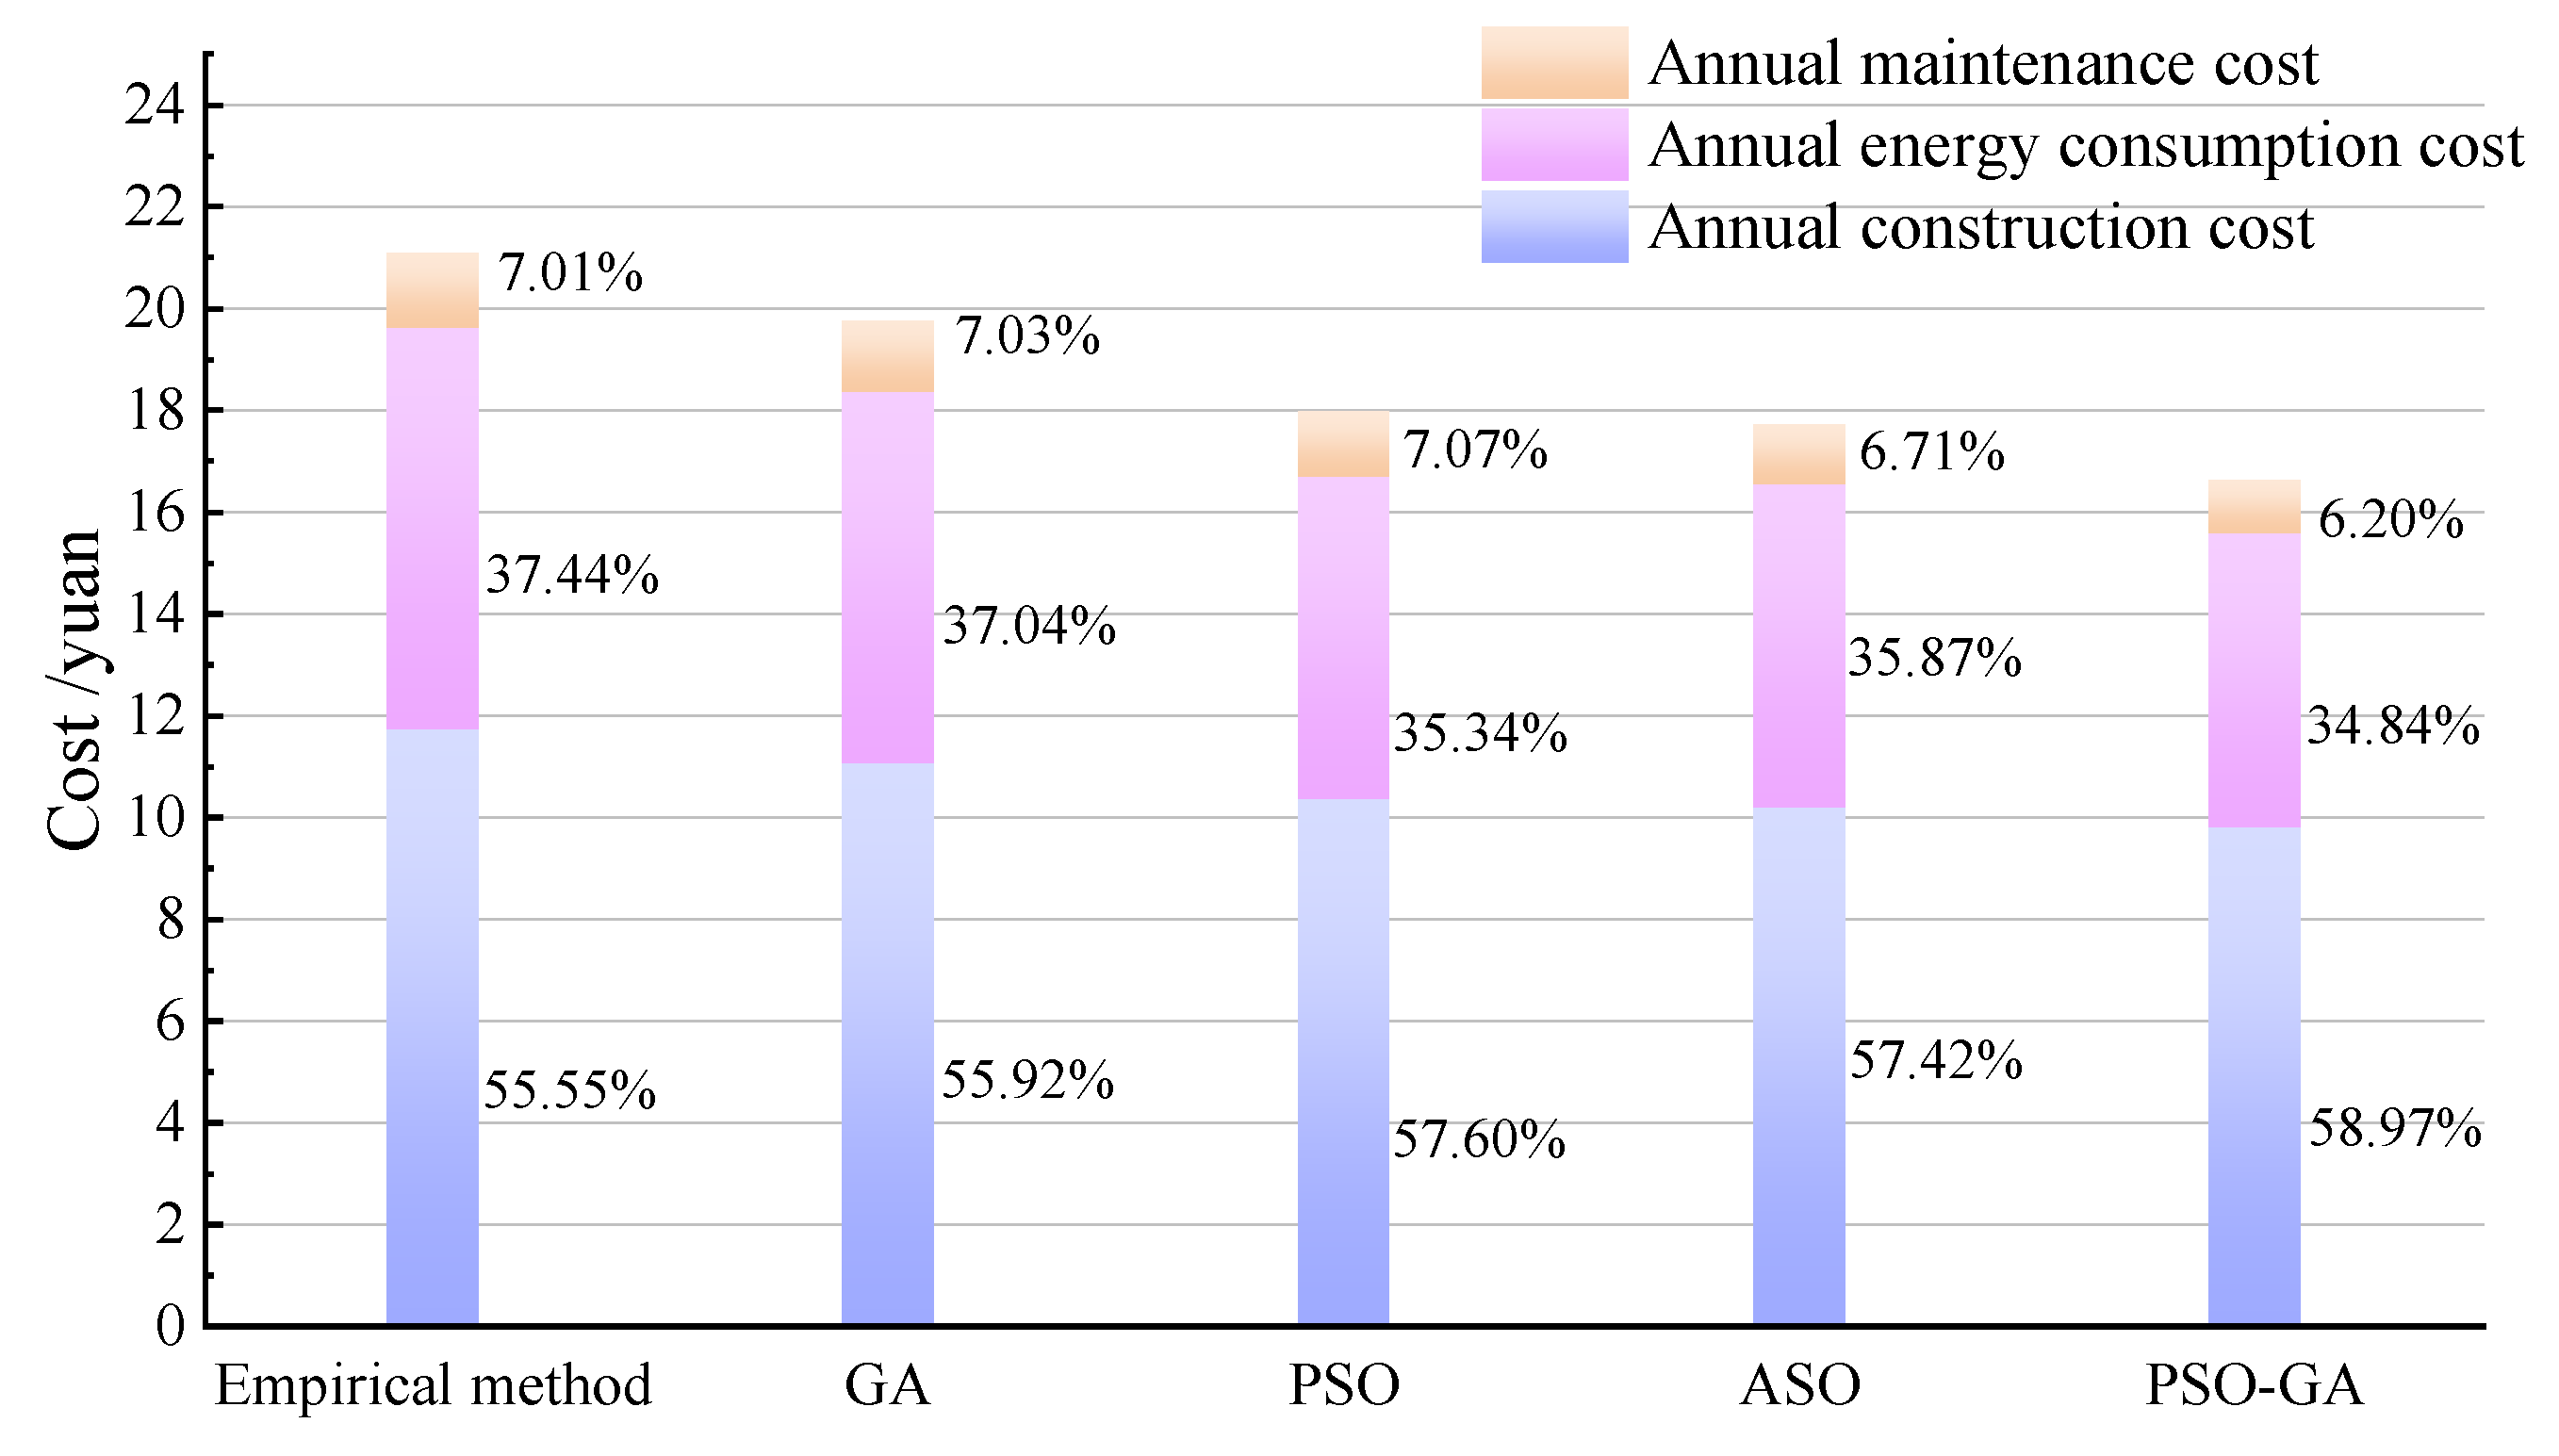
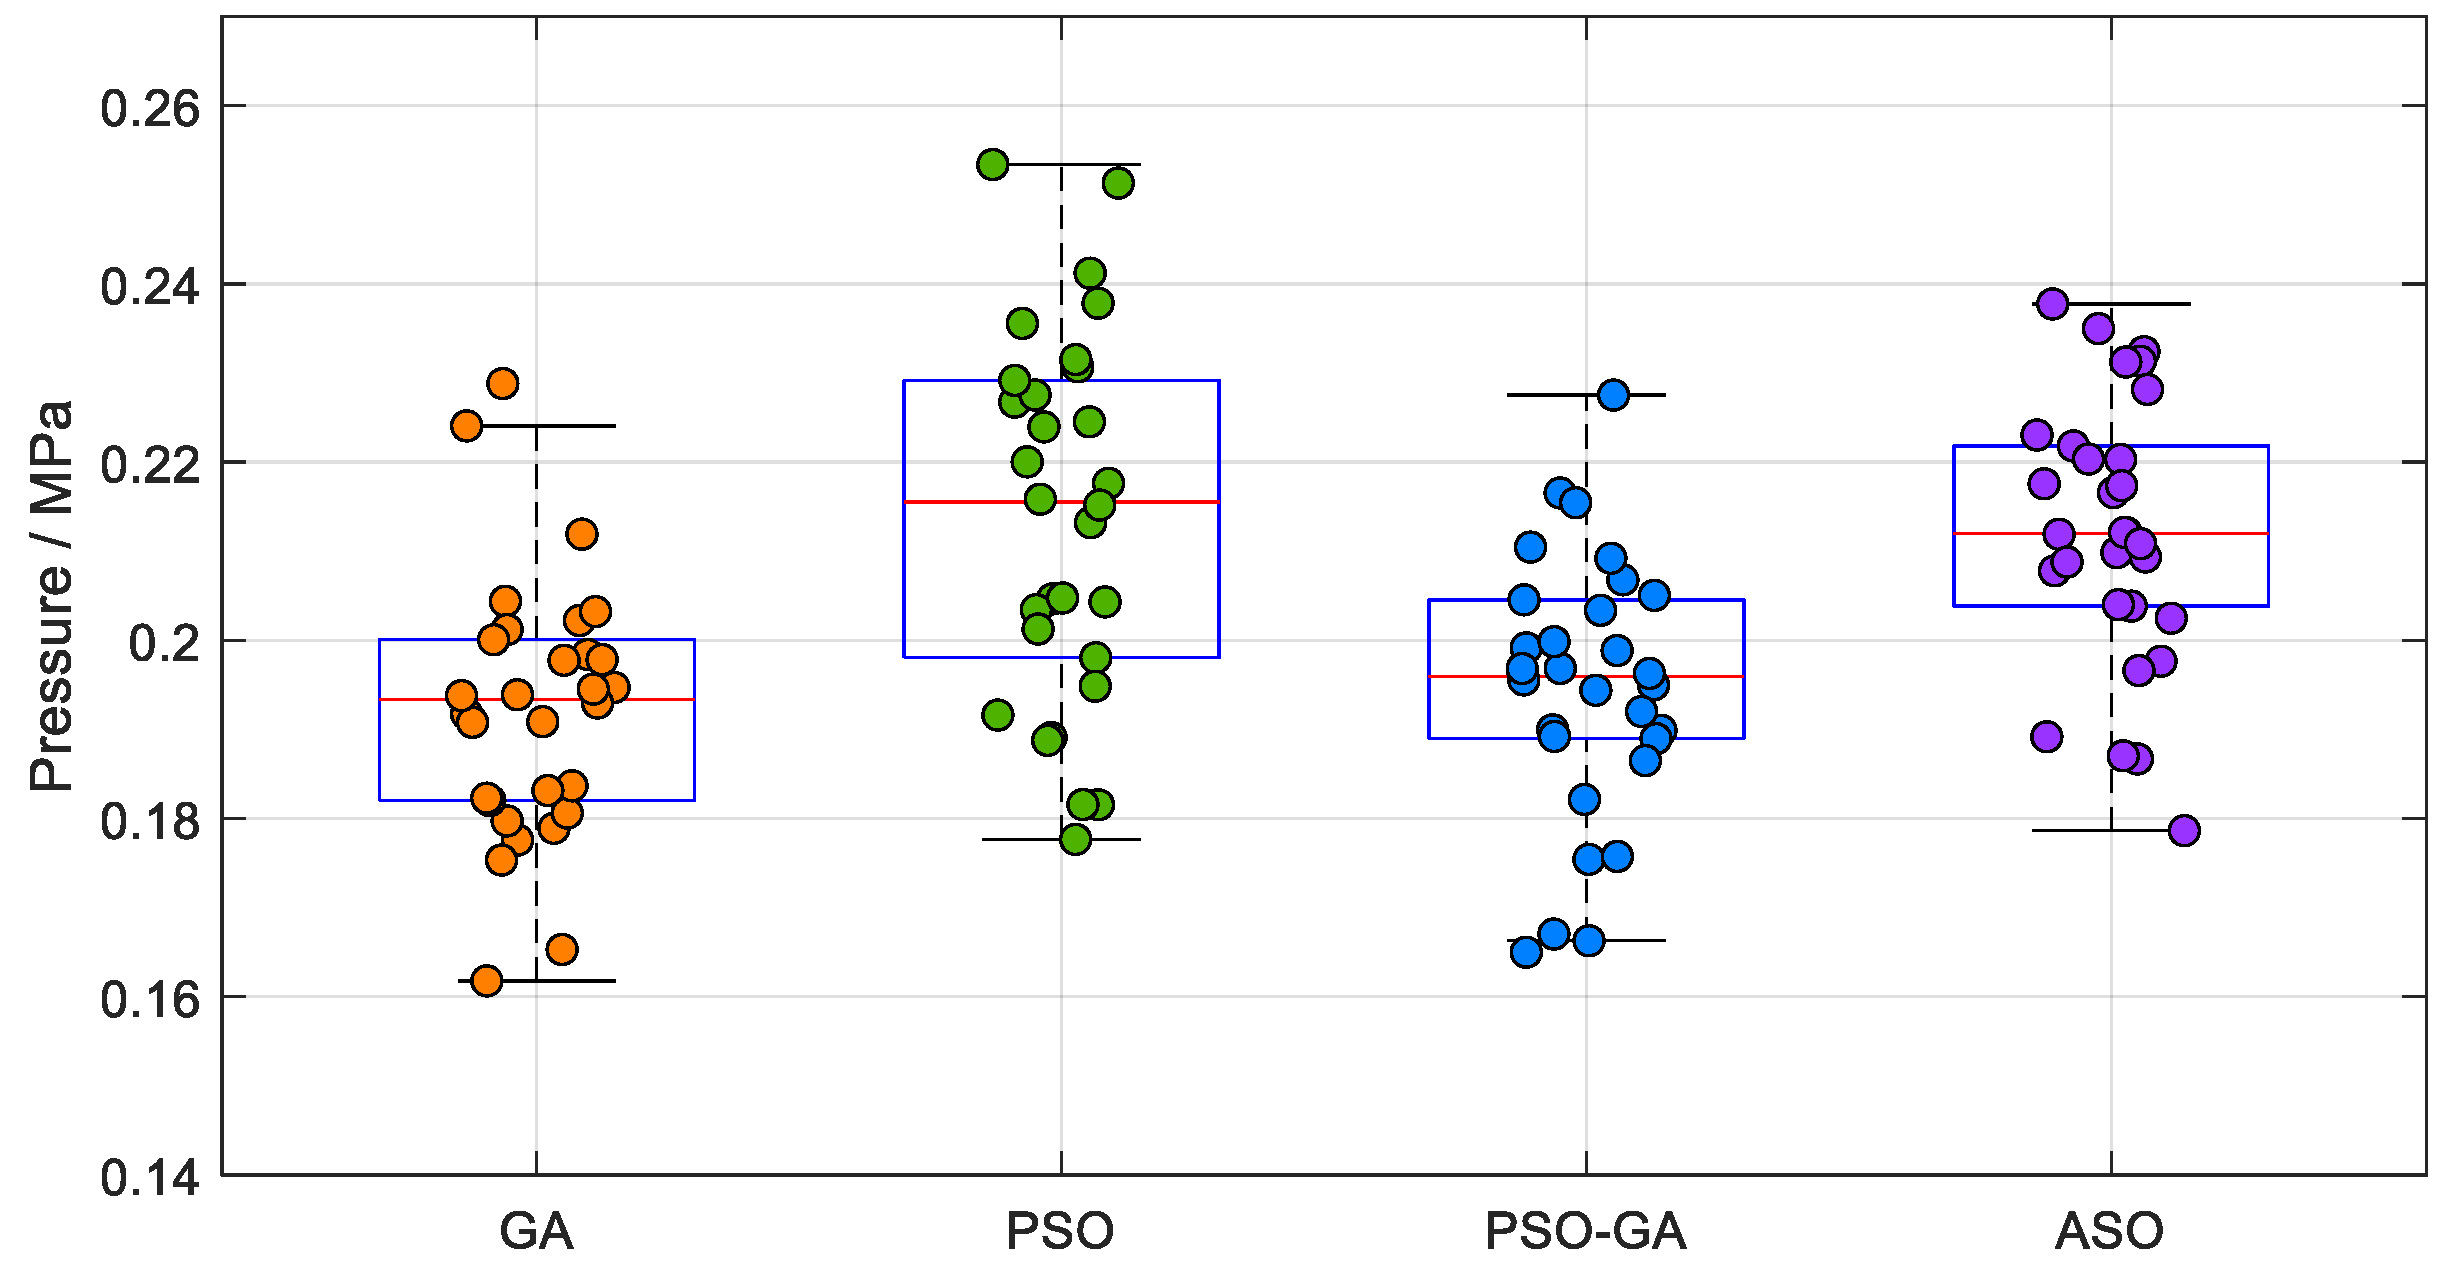
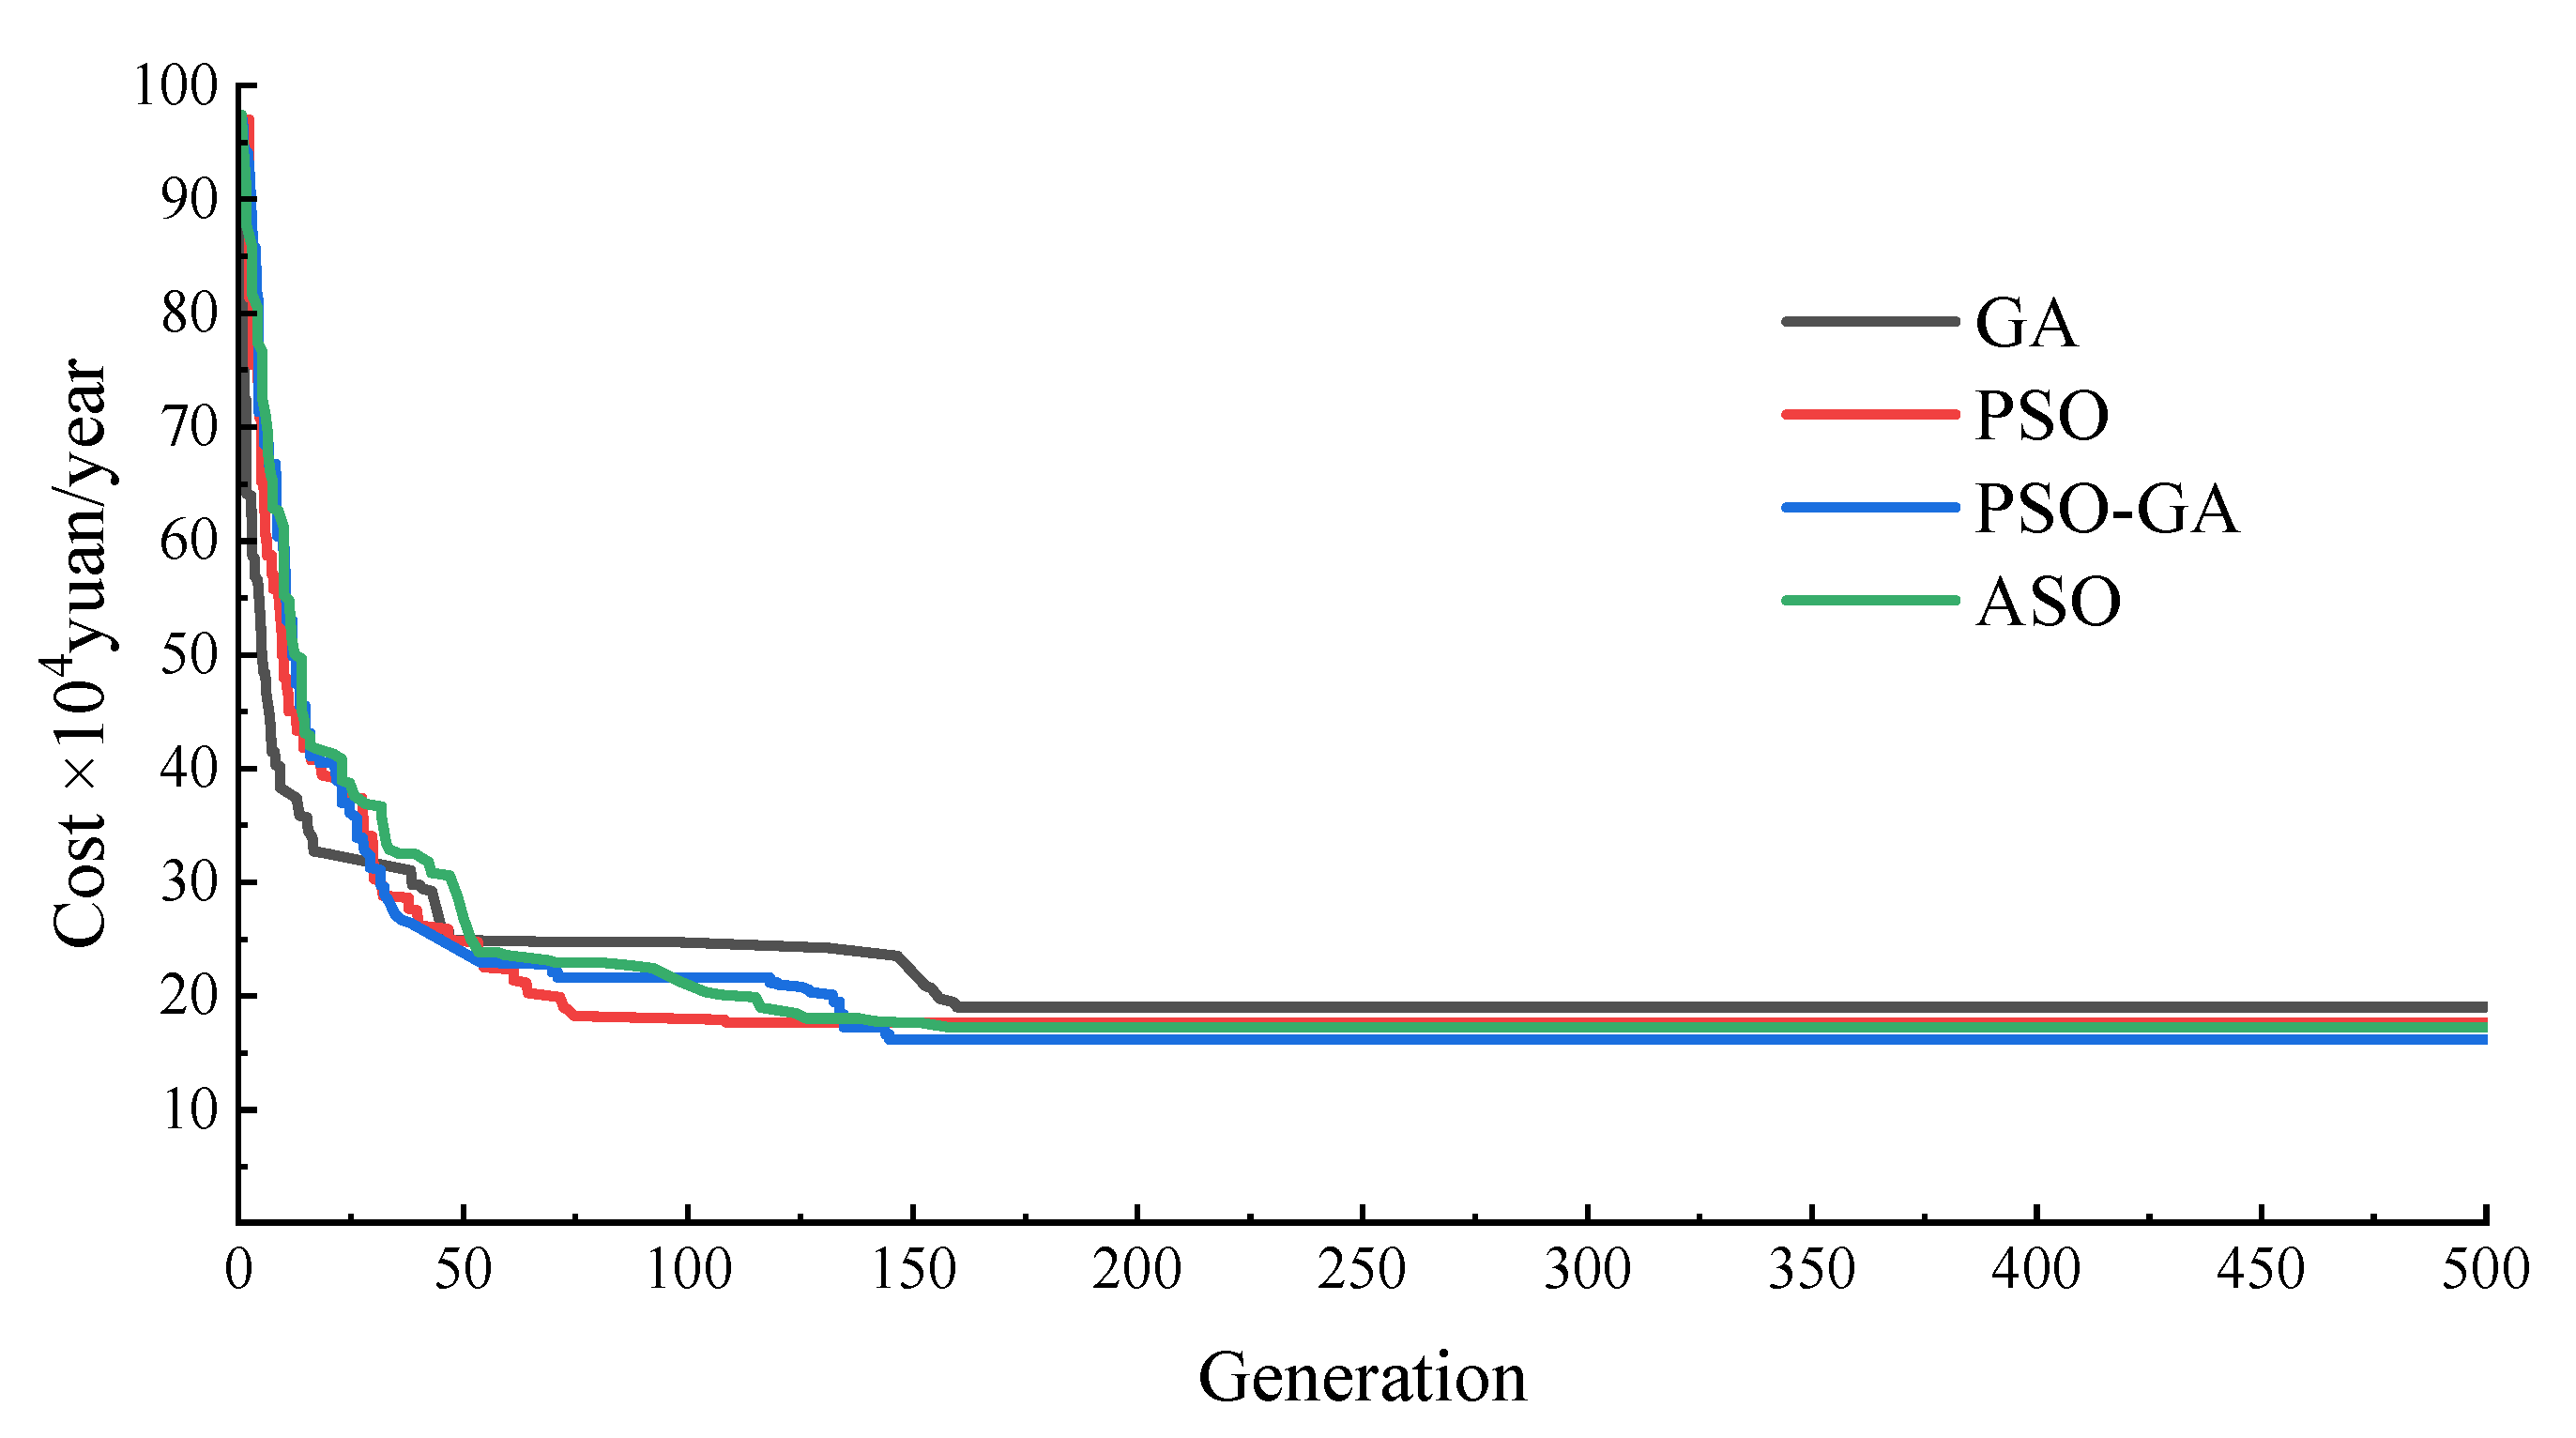
This study proposes a multi-constraint optimization model that simultaneously considers the annual construction, energy consumption, and maintenance costs of a drip irrigation network. To address the local optimum issue associated with the PSO algorithm, the GA algorithm is introduced to enhance the optimization efficiency and outcomes. The hybrid PSO-GA algorithm effectively optimizes both the network topology and parameter selection. The reliability of the proposed model and optimization approach is verified using a vegetable planting test field as a case study. The results demonstrate that the total annual cost of the drip irrigation network design obtained using the PSO-GA algorithm is reduced by up to 21.2% compared with the traditional empirical method, the PSO algorithm, the GA algorithm, or the atom search optimization (ASO) algorithm. The PSO-GA algorithm successfully address the PSO algorithm’s tendency to converge to local optima and overcomes the premature convergence issues commonly observed in the GA algorithm. Through multi-stage variable diameter optimization of the pipe size and flow rates, pump power and head loss are significantly reduced, leading to substantial savings in operating costs. The proposed method effectively balances multi-objective conflicts under complex constraints, providing a robust and efficient optimization paradigm for drip irrigation network design.

2. Numerical Model

2.1. Objective Function

When constructing the pipe network of a drip irrigation system, it is essential to minimize both construction and operation costs while ensuring the reliable performance of the system. In this study, cost calculation primarily considers the system pipeline construction cost, pump construction cost, annual pump operation cost, and annual maintenance cost of pipeline system. Since the procurement costs associated with the initial construction of the pipe network and pump are one-time investments, and the energy consumption and maintenance cost are recurring annual expenditures, the two cannot be directly summed due to differences in their times of occurrence. Therefore, the objective is to minimize the total annual cost by converting the initial construction costs into annual costs over the service life of the system. To ensure that all costs are evaluated on a consistent temporal basis, an objective function that accounts for both construction costs and operation and maintenance costs is established:
min C t o t a l = C c o n s t r u c t i o n + C energy + C m a i n t e n a n c e ,
where C c o n s t r u c t i o n is the annual construction cost in yuan/year, C energy is the annual energy consumption cost in yuan/year, and C m a i n t e n a n c e is the annual pipe network maintenance cost in yuan/year.
Among them, C c o n s t r u c t i o n is mainly the annual construction cost of the water pump and drip irrigation pipe network:
C c o n s t r u c t i o n = C p i p e + C p u m p ,
where C p i p e is the annual construction cost of the water pipe in yuan/year and C p u m p is the annual construction cost of the pump in yuan/year.
Given the high investment and long capital recovery associated with pipeline network construction, the equivalent annuity method is introduced. By incorporating service life n and discount rate r, total investment cost P is calculated as equivalent annuity A to calculate the annual cost to be paid to consider the impact of time on cost.
A = P × r ( 1 + r ) n ( 1 + r ) n 1
where P is the total investment cost in yuan, A is the equivalent annuity in yuan/year, r is the discount rate in %, and n is the system lifetime in years.
The C p i p e and C p u m p can be calculated according to Equation (4):
C p i p e = i = 1 a L m C m + j = 1 b L s C s + k = 1 c L l C l r ( 1 + r ) n ( 1 + r ) n 1 C p u m p = P p u m p r ( 1 + r ) n ( 1 + r ) n 1 ,
where a, b, and c are the total number of the main pipe, branch pipe, and lateral, respectively; L m , L s and L l are the length of the main pipe, branch pipe, and lateral respectively, m; C m , C s and C l are the unit prices of the main pipe, branch pipe, and lateral respectively, in yuan/m; C p u m p is the prices of the pump in yuan, and P p u m p is the pump price in yuan.
C energy is mainly the working electricity cost of the water pump, which can be calculated according to Equation (5):
C e n e r g y = ρ g Q H m 3.6 × 10 6 η t d a i l y C e l e c T ,
where T is the number of running days per year (day/year), ρ is the density of water (kg/m3), g is the acceleration of gravity (m/s2), Q is the maximum flow rate of the system (m3/h), H m is the total head of the pump (m), η is the efficiency of the pump, t d a i l y is the daily running time (h/d), P p u m p is the pump power consumption per unit time in kW, and C e l e c is unit price in yuan/kWh.
C m a i n t e n a n c e , which can be calculated using Equation (6), can reflect the actual expenditure, such as pipeline damage and emitter blockage replacement:
C m a i n t e n a n c e = i = 1 a L m α m + j = 1 b L s α s + k = 1 c L l α l ,
where α m , α s and α l are the annual maintenance rates of supervisor, branch, and lateral respectively, in yuan/m.
The final objective function can be written as Equation (7):
min C t o t a l = i = 1 a L m C m + j = 1 b L s C s + k = 1 c L l C l + P p u m p r ( 1 + r ) n ( 1 + r ) n 1 + ρ g Q H m 3.6 × 10 6 η t d a i l y C e l e c T + i = 1 a L m α m + j = 1 b L s α s + k = 1 c L l α l

2.2. Constraint Condition

The optimization of drip irrigation network design involves comprehensive consideration of multiple decision variables. By reasonably constraining these variables, the objective function can be effectively optimized. At the same time, each constraint condition also determines the real performance of the drip irrigation system. During the construction of a drip irrigation network, critical decision variables include pipe diameter [27], pipe length [28], pipe roughness [29], and node pressure [30]. Additionally, parameters such as pump power, service life, and system flow rate must be considered during the calculation of the objective function. Factors such as crop type, pipe material, and other factors further increase the number of input parameters. The relationship between the major variables considered in this model and overall system cost is shown in Figure 1.
  • Node pressure constraint: To ensure the economical and reliable operation of the pipe network system, the primary objective is to maintain the actual pressure head at the inlet of each lateral within a safe and acceptable range. Simultaneously, the maximum pressure in each pipe section must not exceed the maximum pressure-bearing capacity of the pipeline material, thereby ensuring the operating pressure range of the emitters and preventing pipe bursts or uneven irrigation. The node pressure constraint can be expressed as Equation (8):
    P i < P i , max , ( i = 1 , 2 , , N ) ,
    where P i is the pressure in the pipe of the first section of the pipe in MPa, and P i , max is the maximum pressure that the ith pipeline can withstand in MPa.
  • Flow velocity constraint: Given that drip irrigation water may contain impurities or insoluble substances, it is essential to control the water flow velocity within the pipeline. This prevents the deposition of impurities caused by excessively slow flow and mitigates the risk of erosion to the inner pipe wall due to excessively fast flow. The flow velocity constraint condition can be expressed as Equation (9):
    V min V i V max , ( i = 1 , 2 , , N ) V i = 4 Q i π ( D i / 1000 ) 2 ,
    where V i is the actual flow velocity of the pipe section I in m/s, and V min and V max are the minimum required flow rate and the maximum allowable flow rate in the pipeline, respectively, in m/s.
  • Pipe diameter constraint: To guarantee the effectiveness of drip irrigation, the diameter of the current section of each pipeline section must not be smaller than the subsequent downstream section. With a given water flow direction, the pipe diameter should be gradually reduced [31], and the pipe diameter should meet the available specifications. The pipe diameter constraint can be expressed as Equation (10):
    D i D i + 1 , ( i = 1 , 2 , , N ) D i   { 20 , 25 , 32 , 40 , 50 , 63 , 75 , 90 , 110 , 125 , 140 , 160 , 180 , 200 } ,
    where D i is the inner diameter of the first section of the pipe in mm, D i + 1 is the inner diameter of the i + 1 segment in mm, and N is the number of pipe sections.
  • Head loss constraint: Head loss refers to the mechanical energy dissipated during water movement in the drip irrigation system, including the head losses caused by pipe friction and overcoming gravity. Based on the Hazen-Williams Equation, the head loss constraint can be expressed as Equation (11):
    Δ H i = 10.67 Q i 1.852 C i 1.852 · ( D i / 1000 ) 4.871 L i Δ H = i = 1 n Δ H i Δ H
    where Δ H i is the head loss along the pipeline in m, Q i is the design flow rate in a pipe in m3/s, C i is the Hazen-Williams roughness coefficient in a pipe, PVC and PE pipe are 150, D i is the inner diameter of a pipe in mm, L i is the length of the pipe section in a pipeline in m, Δ H is the total head loss along the system in m, and Δ H is the maximum total head loss allowed by the system in m.

3. Construction of the PSO-GA Algorithm

3.1. PSO

Particle Swarm Optimization (PSO) is a swarm intelligence bionic optimization algorithm inspired by the foraging behavior of birds. It was first proposed by Kennedy and Eberhart in 1995 and has been widely applied to various engineering optimization problems [32,33]. In PSO, the cooperative foraging behavior of a bird swarm is abstracted into a mathematical model: in the solution space, each particle represents a candidate solution, and its trajectory is driven by both its own historical optimal solution and the global optimal solution found through social collaboration within the particle swarm [34,35].
Taking the optimization of a drip irrigation system pipe network as an example, each particle represents a combination of pipe network parameters, and an initial population of particles is generated simultaneously. The fitness of each particle is evaluated using the objective function, and particles moves toward the best-performing particle, adjusting their parameters accordingly. The core idea of PSO is to allow a group of “particles” carrying candidate parameters sets to collaboratively search for the optimal solution within the solution space. The implementation process of the PSO algorithm is shown in Table 1.

3.2. Genetic Algorithm

The Genetic Algorithm (GA) is a heuristic optimization method first proposed by John Holland in the 1960s [36]. Similar to PSO, GA has proven effective in solving various engineering optimization problems. The algorithm simulates biological evolution based on the principles of “natural selection” and “genetic variation” from Darwin’s evolution theory, constructing a dynamic iterative optimization framework. GA translates biological concepts into mathematical operations: the DNA double helix corresponds to binary or real number coding; reproduction behavior corresponds to the crossover operator; gene mutation corresponds to random disturbance mechanism; and species adaptability is quantitatively evaluated through the objective function. In the optimization of a drip irrigation system pipe network, a combination of multiple parameters such as pipe diameter, pipe length, and pump power is considered as an individual within the population. After generating an initial population, the environmental adaptability of each individual is assessed using the objective function, i.e., by calculating the system cost under the corresponding parameter combination. Superior individuals are selected for reproduction, and through genetic operations including selection, crossover, and mutation, new individuals representing new parameter combinations are produced. Ultimately, the optimal solution is identified through generational evolution. The implementation process of the GA algorithm is shown in Table 2.

3.3. Hybrid PSO-GA Algorithm

The traditional PSO algorithm exhibits certain limitations when handling complex parameter optimization problems. The particle swarm relies on both individual and global historical best solutions. If the initial population distribution is poor or the inertia weight design is inappropriate, the algorithm may suffer from premature convergence and fall into a local optimum [37]. Meanwhile, the GA algorithm is relatively slower in convergence and has a weak local search capability, making it prone to premature convergence or stagnation when approaching the optimal solution. To overcome these limitations, this study introduces GA concepts into PSO for the design optimization of a drip irrigation system. By combining the local search ability of PSO with the global exploration characteristics of GA, convergence is accelerated through particle iterative updates, while crossover and mutation operations enhance population diversity and help avoid premature convergence [38,39,40]. The basic flow of the PSO-GA algorithm used in this study is shown in Figure 2. The optimization process was implemented by Python 3.10, including the following steps:
  • Initialization stage: Set the PSO parameters, such as particle number (N), inertia weight ( w ), and learning factor (c1, c2), along with the GA parameters, such as crossover rate (pc), mutation rate (pm), and maximum number of iterations. An initial set of particles is generated, and the positions and velocities are randomly initialized.
  • PSO operation: Calculate the fitness, velocity, and position of each particle. Velocity is updated according to Equation (12), and position is updated according to Equation (13).
    v i t + 1 = w · v i t + c 1 · r 1 ·   ( p b e s t t x i t ) + c 2 · r 2 ·   ( g b e s t t x i t ) ,
    x i t + 1 = x i t + v i t + 1 ,
    where v i t is the velocity vector of particle i at time t, w is inertia weight, c1 and c2 are the individual cognitive coefficient and social cognitive coefficient of the particles, respectively, r1 and r2 are random numbers between 0 and 1 which are used to maintain the search diversity, x i t is the position of particle i at time t, v i t + 1 is the updated velocity of particle I, p b e s t t is the historical optimal position of particle i at time t, and g b e s t t is the optimal position of the group history at time t.
    The inertia weight ( w ) is a critical parameter of the PSO algorithm, balancing global exploration and local exploitation. During the iteration process, the inertia weight is dynamically adjusted in a linear manner with the number of iterations, as shown in Equation (14).
    w ( t ) = w max ( w max w min ) t T max ,
    where t is the current number of iterations, T max is the maximum number of iterations, w max is the initial value of w , and w min is the final value of w .
  • GA operation: Select the top 20% of the best-performing particles into a mating pool. Offspring particles are generated through genetic operation and evaluated for fitness. The offspring particles are incorporated into the population, while particles with lower fitness are eliminated, and elite particles are preserved to maintain a constant population size.
  • Iterative update: The PSO operation and GA operation are alternated to continuously update the fitness of each particle based on the objective function value and constraint violation degree until the termination condition is reached, that is, the maximum number of iterations, or the quality of the solution. When there is no significant improvement in several consecutive generations, the iteration of the algorithm is ended and the final result is output. It should be noted that the convergence condition is influenced by factors such as initial search range and design scheme.

4. Case Study

4.1. Basic Information

In this study, the performance of the PSO-GA algorithm was evaluated based on a real vegetable planting experimental field located in a province of Northwest China. The terrain of the experimental field was relatively flat, with a north-south slope of less than 1%. The soil was sandy, with a density of approximately 1480 kg/m3, a field capacity of 15%, and an irrigation area of about 20 hectares. The climate in the region is arid, and the average annual precipitation is significantly lower than the evaporation rate. If flood irrigation method had been adopted, the water utilization coefficient would have been only 0.39. Therefore, a drip irrigation pipe network system was constructed in the experimental field to irrigate crops. The drip irrigation system adopted a commonly used comb-shaped pipe network layout with a three-level structure is constructed [10,11]: branch pipes were arranged on one side of the main pipe, and multiple laterals were distributed along each branch pipe with a lateral spacing of 0.8 m. The service life of the system was designed to be 15 years. To simplify the study, the site was considered as a rectangular block with 500 m in length and 400 m in width. The layout of the experimental field is shown in Figure 3.

4.2. Parameter Settings

The system mainly adopted a three-level structure. The branch pipes were installed on one side of the main pipe, and laterals were arranged bilaterally along the crop row on both sides of each branch pipe. The main pipe and branch pipes at the experimental site were made of PVC, while the laterals were made of PE. Based on the climate, crop type, and soil conditions of the experimental field, the main parameters of the drip irrigation system are shown in Table 3.
According to the market situation of the experimental field, the main parameters and price information of the pipe network of the drip irrigation system were obtained, as shown in Table 4.
In this study, the drip irrigation pipe network system was designed using the empirical method, PSO, GA, ASO, and PSO-GA, respectively. After several program debugging sessions, the number of PSO, ASO, and PSO-GA particles was set to 50, while for GA, it was set to 200. The maximum number of iterations of all algorithms was set to 500. The specific algorithm parameter setting is shown in Table 5. In the ASO algorithm, the mass attenuation coefficient (β) serves a similar role to the inertia weight ( w ), and the attraction/repulsion parameter (α) corresponds to the Learning factor (c1, c2), thus the values were aligned with the PSO-GA algorithm. For the PSO-GA algorithm, parameters such as the crossover rate and mutation rate were appropriately reduced to prevent premature destruction of high-quality particle structures. The inertia weight was linearly decreased from 0.8 to 0.4 to balance the global and local search capabilities. To eliminate the influence of algorithmic randomness on the final output and performance evaluation, each algorithm was executed 30 times. For statistical analysis, the mean and standard deviation of the 30 results of each optimization algorithm were calculated and reported.

4.3. Optimization Results and Analysis

4.3.1. Pipe Network Optimization Comparison

The drip irrigation pipe network system designed using the empirical method and the GA algorithm mainly comprised 1 main pipe, 5 branch pipes, and 5000 laterals. In contrast, the system optimized by the PSO, ASO, and PSO-GA algorithms consisted of 1 main pipe, 4 branch pipes, and 4000 laterals. In the empirical method, the diameter of the main pipe and branch pipe remained constant, whereas the pipe network design optimized by GA, PSO, and PSO-GA methods adopted a variable diameter design, further reducing the pipe material cost while maintaining effect irrigation. The specific pipe network parameter design optimization results are shown in Table 6.
All four design schemes all adopted the three-level comb pipe network layout, consisting of the main pipe, branch pipes, and laterals. The differences in construction cost among the schemes were primarily reflected in the length of the main pipe, the diameter of the main pipe, the number of branch pipes, the diameter of the branch pipe, the diameter of the lateral, and the selection of the pump. The layouts of the drip irrigation network systems designed by the four methods are shown in Figure 4.
The cost distribution across 30 simulation runs is shown in the Figure 5. ANOVA was conducted to analyze the results from the GA, PSO, ASO, and PSO-GA, with hypothesis H0 assuming no difference among the groups. The results indicated that the p value was much less than 0.05, confirming that the cost difference between the methods were statistically significant. The data obtained from the four algorithms were subjected to LSD post hoc test, and the results shown in Table 7 further verified the significant differences between among algorithms.
The mean ± standard deviation of the 30 optimization results of each algorithm were calculated, and a cost comparison among the four methods is shown in Table 8. A statistical analysis indicated that the annual costs of the drip irrigation pipe network optimized by GA, PSO, ASO, and PSO-GA were all lower than those obtained using the empirical method. Taking the empirical method’s cost as the baseline, the optimization rates for the GA, PSO, ASO, and PSO-GA algorithms were 6.3%, 14.8%,15.9%, and 21.2%, respectively. The system designed using the PSO-GA algorithm achieved the lowest annual cost, at only 166,200 yuan. Compared with the traditional empirical method, the PSO, GA, and ASO, the PSO-GA algorithms reduced the annual total cost by 21.2%, 15.9%, 7.5%, and 6.3%, respectively. The optimized main pipe adopted a stepped-diameter design, reducing material costs by 14.3%. Additionally, the number of branches was reduced from 5 to 4, resulting in a 37.6% reduction in branch pipe investment costs. Further analysis showed that the proportion of maintenance costs and operation costs in the PSO-GA method was further reduced. By optimizing the pipe diameters and flow rates, the PSO-GA algorithm reduced the required pump head by 25.7%, thereby decreasing energy consumption costs by 26.70%, 20.90%, 8.81%, and 6.31% compared with the empirical method, GA, PSO, and ASO algorithms, respectively. The final design reduced the average flow rate while meeting irrigation demands, further reducing energy consumption. The construction cost and operation cost for each method are shown in Figure 6.
A pressure distribution box diagram of the branch inlet node farthest from the pump across 30 simulations is shown in Figure 7. The results demonstrate that the node pressure range of the GA algorithm was 0.161 MPa to 0.223 MPa, for PSO algorithm was 0.179 MPa to 0.256 MPa, for ASO algorithm was 0.178 MPa to 0.237 MPa, and for PSO-GA algorithm was 0.163 MPa to 0.228 MPa. The inlet pressure distribution for the GA and PSO-GA optimized systems were more concentrated, whereas the inlet pressure distribution of the branch pipe optimized by PSO algorithm was larger and the distribution was more discrete. This indicates that although the PSO algorithm had higher computational efficiency, it was prone to larger randomness in repeated calculations, potentially missing the optimal solution and falling into local optimal solutions.

4.3.2. Algorithm Performance Comparison

The performance of the PSO-GA algorithm was evaluated by analyzing the convergence behavior of the objective function and the constraint satisfaction rate. The convergence curves of the objective function for different algorithms is shown in Figure 8. The results shows that the GA algorithm converged rapidly within the first 10 iterations, then converged more slowly in the 10th to 50th iterations, reaching final convergence around the 165th iteration and gradually converging to the final cost of about 197,700 yuan. The PSO algorithm converged faster, completing convergence within 75 iterations and reaching the final cost of 180,100 yuan, showing excellent convergence. The ASO algorithm exhibited a convergence rate similar to PSO within 25 iterations and achieved final convergence by the 156th iteration. The convergence speed of the PSO-GA algorithm was between the two algorithms. Before 20 iterations, the convergence speed of the PSO-GA algorithm was slower than that of the other two algorithms. After that, it was faster than the GA algorithm and slightly slower than the PSO algorithm. Through mutation and crossover operations, the PSO-GA algorithm escaped local optima successfully, ultimately converging after 148 iterations at 166,200 yuan. The average computation time for the GA, PSO, ASO, and PSO-GA algorithms for 30 runs also showed changes in algorithm performance by introducing GA to improve the PSO algorithm. The average times of the four algorithms were about 25.2 min, 18.6 min, 20.3 min, and 21.5 min, respectively. The single iteration time of PSO-GA was significantly longer than that of PSO, due to the algorithm performing additional operations like mutation and exchange in the calculation process to help the particles jump out of the local optimal solution. The single iteration time of PSO-GA was significantly shorter than that of the GA algorithm, due to the algorithm mainly based on the PSO framework, which enables the rapid identification of relatively optimal solutions and facilitates a progressive convergence toward the global optimum.
The statistical results of the constraint satisfaction rate for the final outcomes obtained from 30 runs of each algorithm are shown in Figure 9. The results indicate that the PSO-GA algorithm was better than other algorithms in terms of satisfying the three constraints of node pressure, flow velocity range, and pipe diameter, while the constraint satisfaction of head loss was worse than that of the PSO algorithm and stronger than that of the GA algorithm. This may be attributed to the head loss that was determined by multiple factors, such as pipe diameter and flow velocity, making it more sensitive to variations caused by mutations and other operations. Consequently, the GA and ASO exhibited the poorest performance under this constraint condition. Overall, the constraint satisfaction rate of the PSO-GA algorithm increased by 6.66 to13.33%, demonstrating excellent effectiveness in terms of satisfying the constraints.

4.3.3. On-Site Pressure Verification

To further verify the reliability of the PSO-GA method, the pressure distribution at the intersection of the main pipe and the branch pipes farthest from the pump was statistically analyzed over 30 calculations under a system flow rate of 85 m3 and compared with the measured pressure value from the on-site drip irrigation system. A boxplot of pressure differences is shown in Figure 10a. Additionally, a field test was conducted where the system flow rate was gradually increased from 45 m3/h to 85 m3/h. After each flow rate had run steadily for half an hour, pressure data of the intersection of the main pipe and the branch pipe farthest from the pump were collected. The calculation results under different system flow rates for the optimal pipe network layout scheme designed by the PSO-GA method are compared in Figure 10b.
The results in Figure 9 show that the drip irrigation network generated by the PSO-GA method better conformed to the node pressure characteristics in the actual drip irrigation system. At the same time, the gap between the measured pipeline pressure value and the calculated value under different flow conditions was small.

5. Discussion

5.1. Sensitivity of Input Parameter

To further determine the impact of input parameters on the final results, the single parameter perturbation method was used to conduct a sensitivity analysis on the input parameters of the drip irrigation network system optimized by the PSO-GA algorithm. By keeping other parameters constant and adjusting the value of the target parameter by ±10%, we observed the sensitivity of the objective function to the change in a single parameter and quantified it using the sensitivity coefficient, with the sensitivity coefficient being calculated according to Equation (15). The sensitivity coefficients are shown in Table 9.
S = Δ P / P Δ C total / C total ,
where S is the sensitivity coefficient, Δ P is the variation of parameter, P is the parameter value, Δ C total is the variation of total cost, and C total is the value of total cost.
The results indicated that pump efficiency, flow rate, and total pump head had a greater impact on the annual total cost, with relative change rates all exceeding 5%. This was because these factors directly determined the system’s annual energy consumption. Notably, the sensitivity coefficient of pump efficiency to cost was negative, as higher pump efficiency reduced energy losses and thus lowered costs. In contrast, the impact of electricity prices on the annual total cost was moderate, with a sensitivity coefficient of only 0.218, since the proportion of electricity charges in the overall cost was relatively small. Similarly, the pipeline length had little effect on the annual total cost, as the change in pipeline construction costs was amortized over the service life of the system, resulting in a limited impact.

5.2. Sensitivity of Algorithm Parameter

Although this study proposes an effective method for optimizing drip irrigation pipe network systems, there were certain limitations. First, the study focused mainly on comb pipe network layouts; other layout patterns warrant further exploration. Second, the research was constrained by the field situation of the case study site, where the pump position was fixed, thereby limiting the extent of optimization. If the position of the pump could have been freely selected, the system layout may have been further optimized. Additionally, due to the computational cost limitations, each algorithm was run only 30 times, which may have introduced statistical variability and led to fluctuations in satisfaction rates, making it difficult to accurately reflect the true distribution characteristics with such a small samples size.
Furthermore, the performance of the PSO-GA method was highly sensitive to parameter setting. Key factors such as the number of particles and the algebraic interval of the GA operations directly affected the algorithm’s convergence speed, global search ability, and computational efficiency. The influence of the particle number on algorithm convergence is shown in Figure 9. The influence of the GA operation interval is shown in Figure 10. Moreover, the fixed position of the pump in this study imposed certain limitations on the optimization outcome. If the pump position could have been freely adjusted, further improvements to the final layout would have been possible. Additionally, due to constraints on computational resources, each algorithm was only run 30 times. This limited number of runs introduced potential statistical variability results, which may have resulted in the constraint satisfaction rate being abnormally high or low, making it difficult to reflect the true distribution based on small sample statistics.
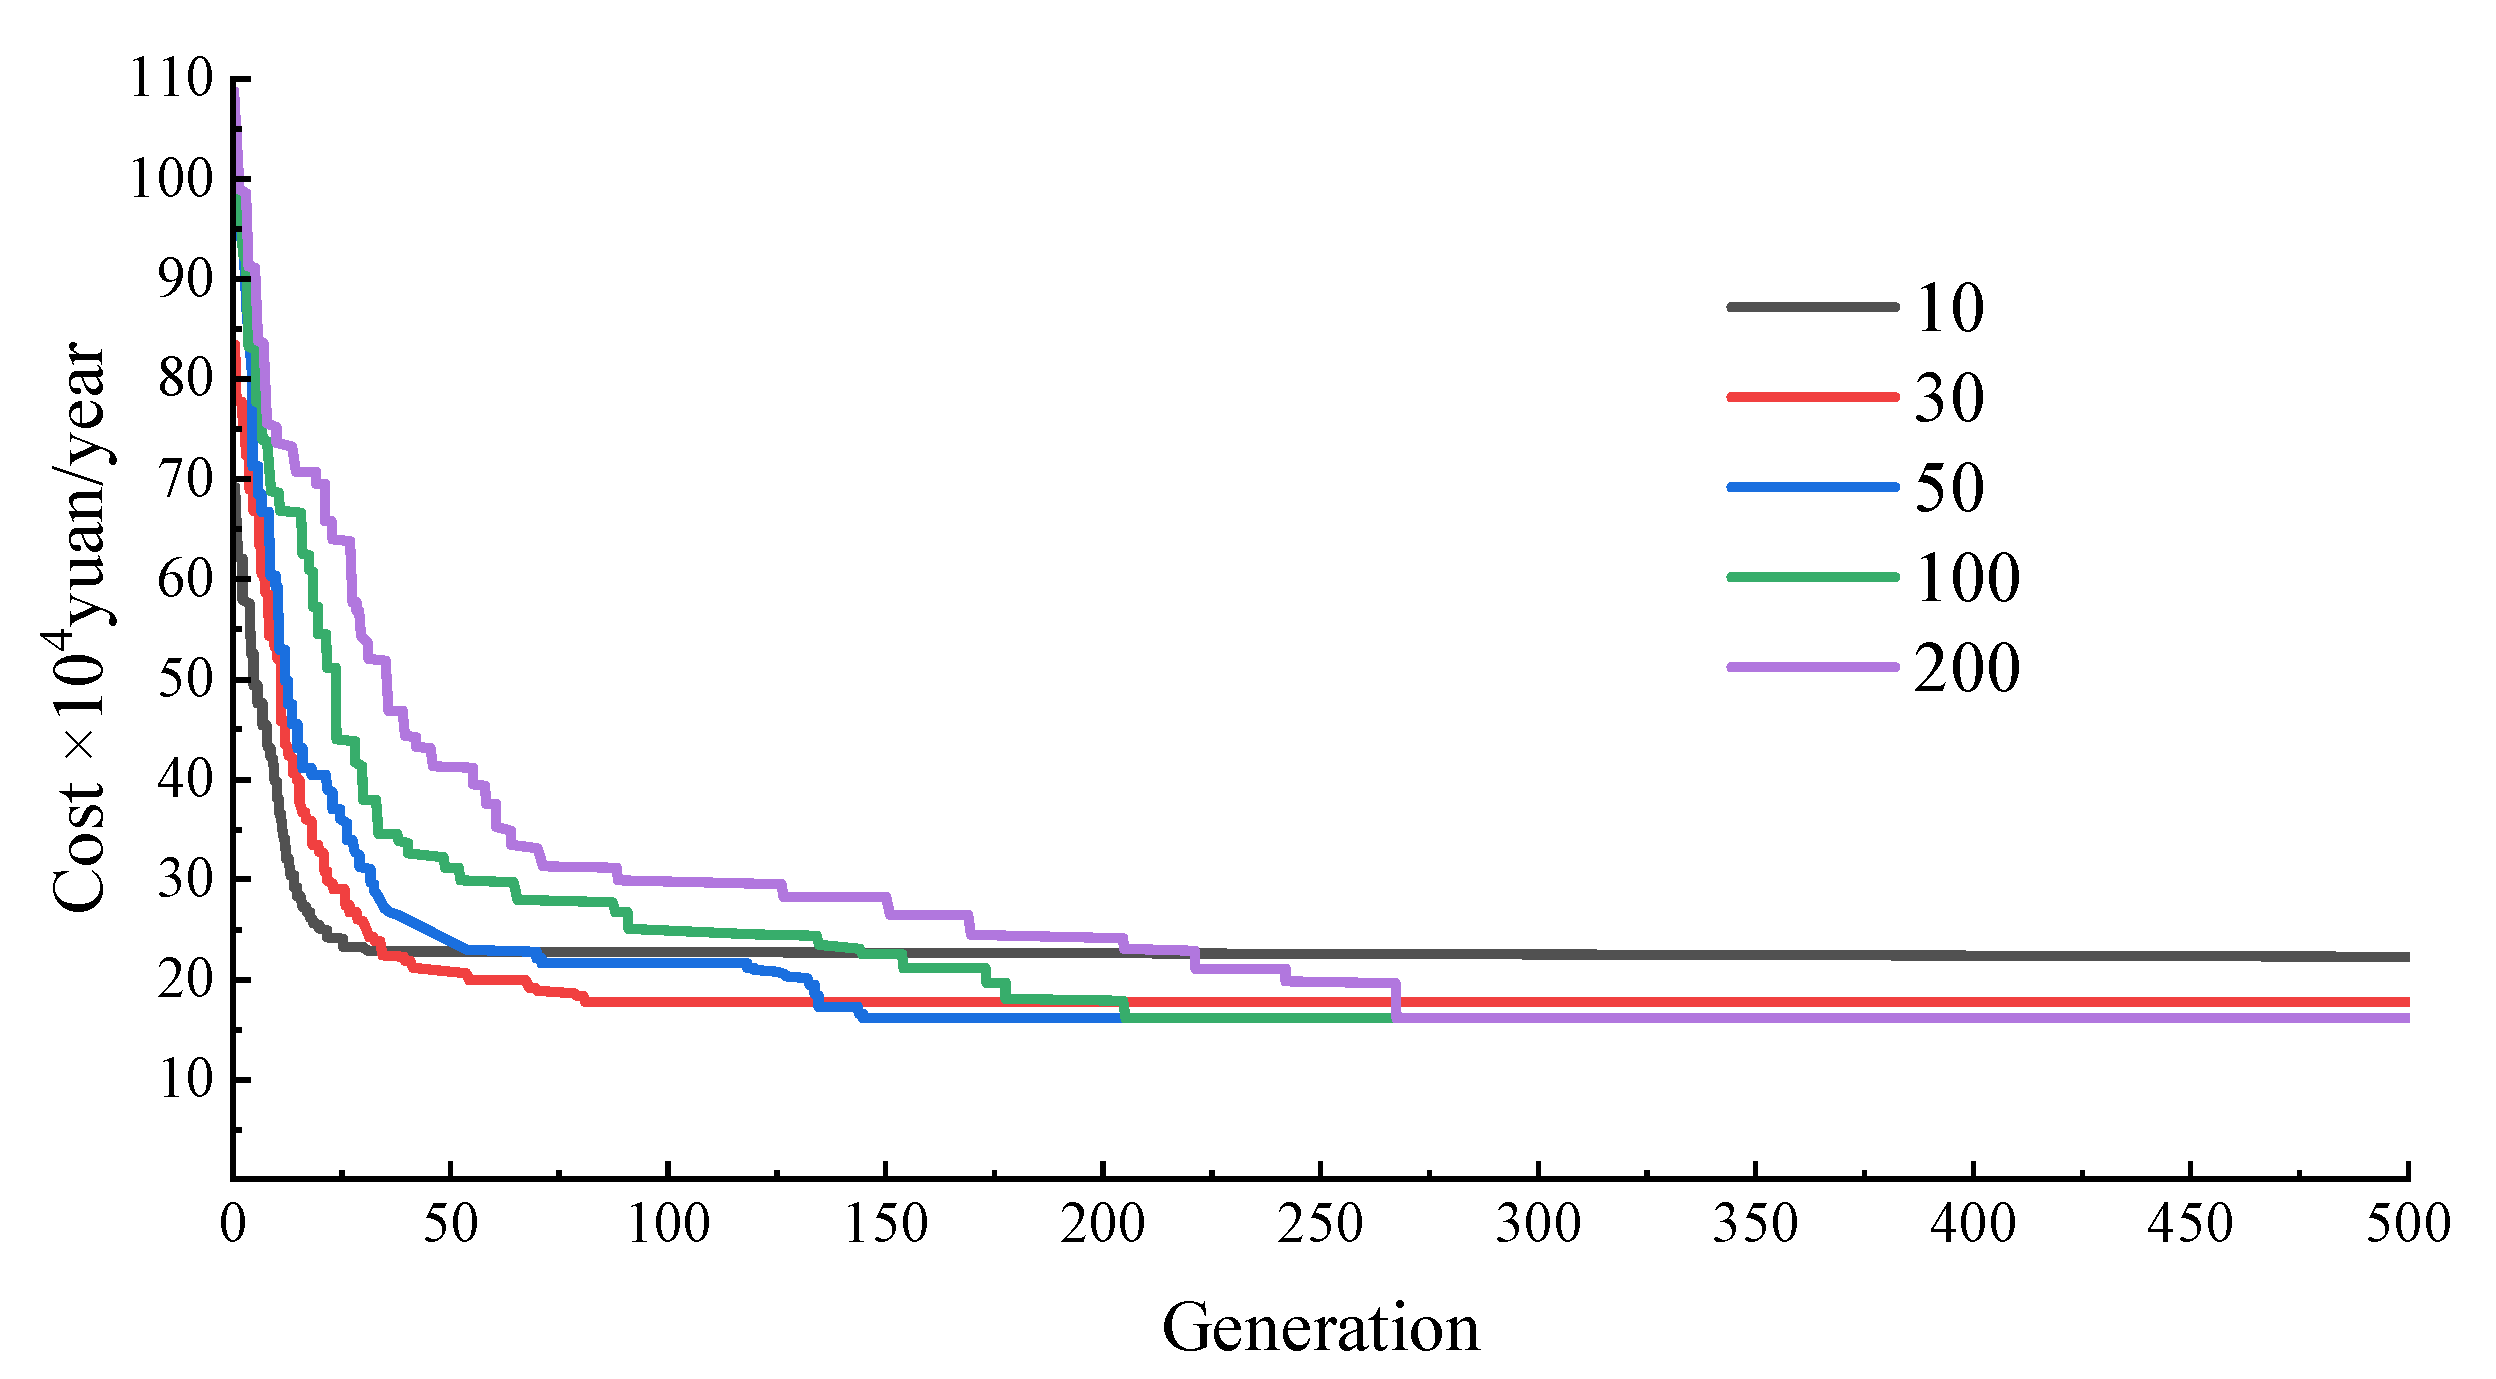
As shown in Figure 11, when the particles number was small, the algorithm converged much faster than when the particle number was larger. For instance, with 10 and 30 particles, convergence was achieved at 24 and 78 iterations, respectively. However, the resulting solutions were not global optima. As the number of particles increased, the convergence speed slowed down. For example, for 50 to 200 particles, the number of convergence iterations increased from about 148 to 215 but the final results consistently reached the global optimum. This demonstrates that a larger swarm size enhanced the spatial coverage ability of the algorithm, effectively reducing the risk of falling into the local optima. However, for complex objective functions such as drip irrigation pipe network design, a larger particle number significantly increases computational cost. A small particle number may lead to premature convergence, missing the global optimum. In PSO-GA, the PSO algorithm was used as the initial population source of GA, and a reasonable number of groups could provide more high-quality candidate solutions for GA while saving computing costs.
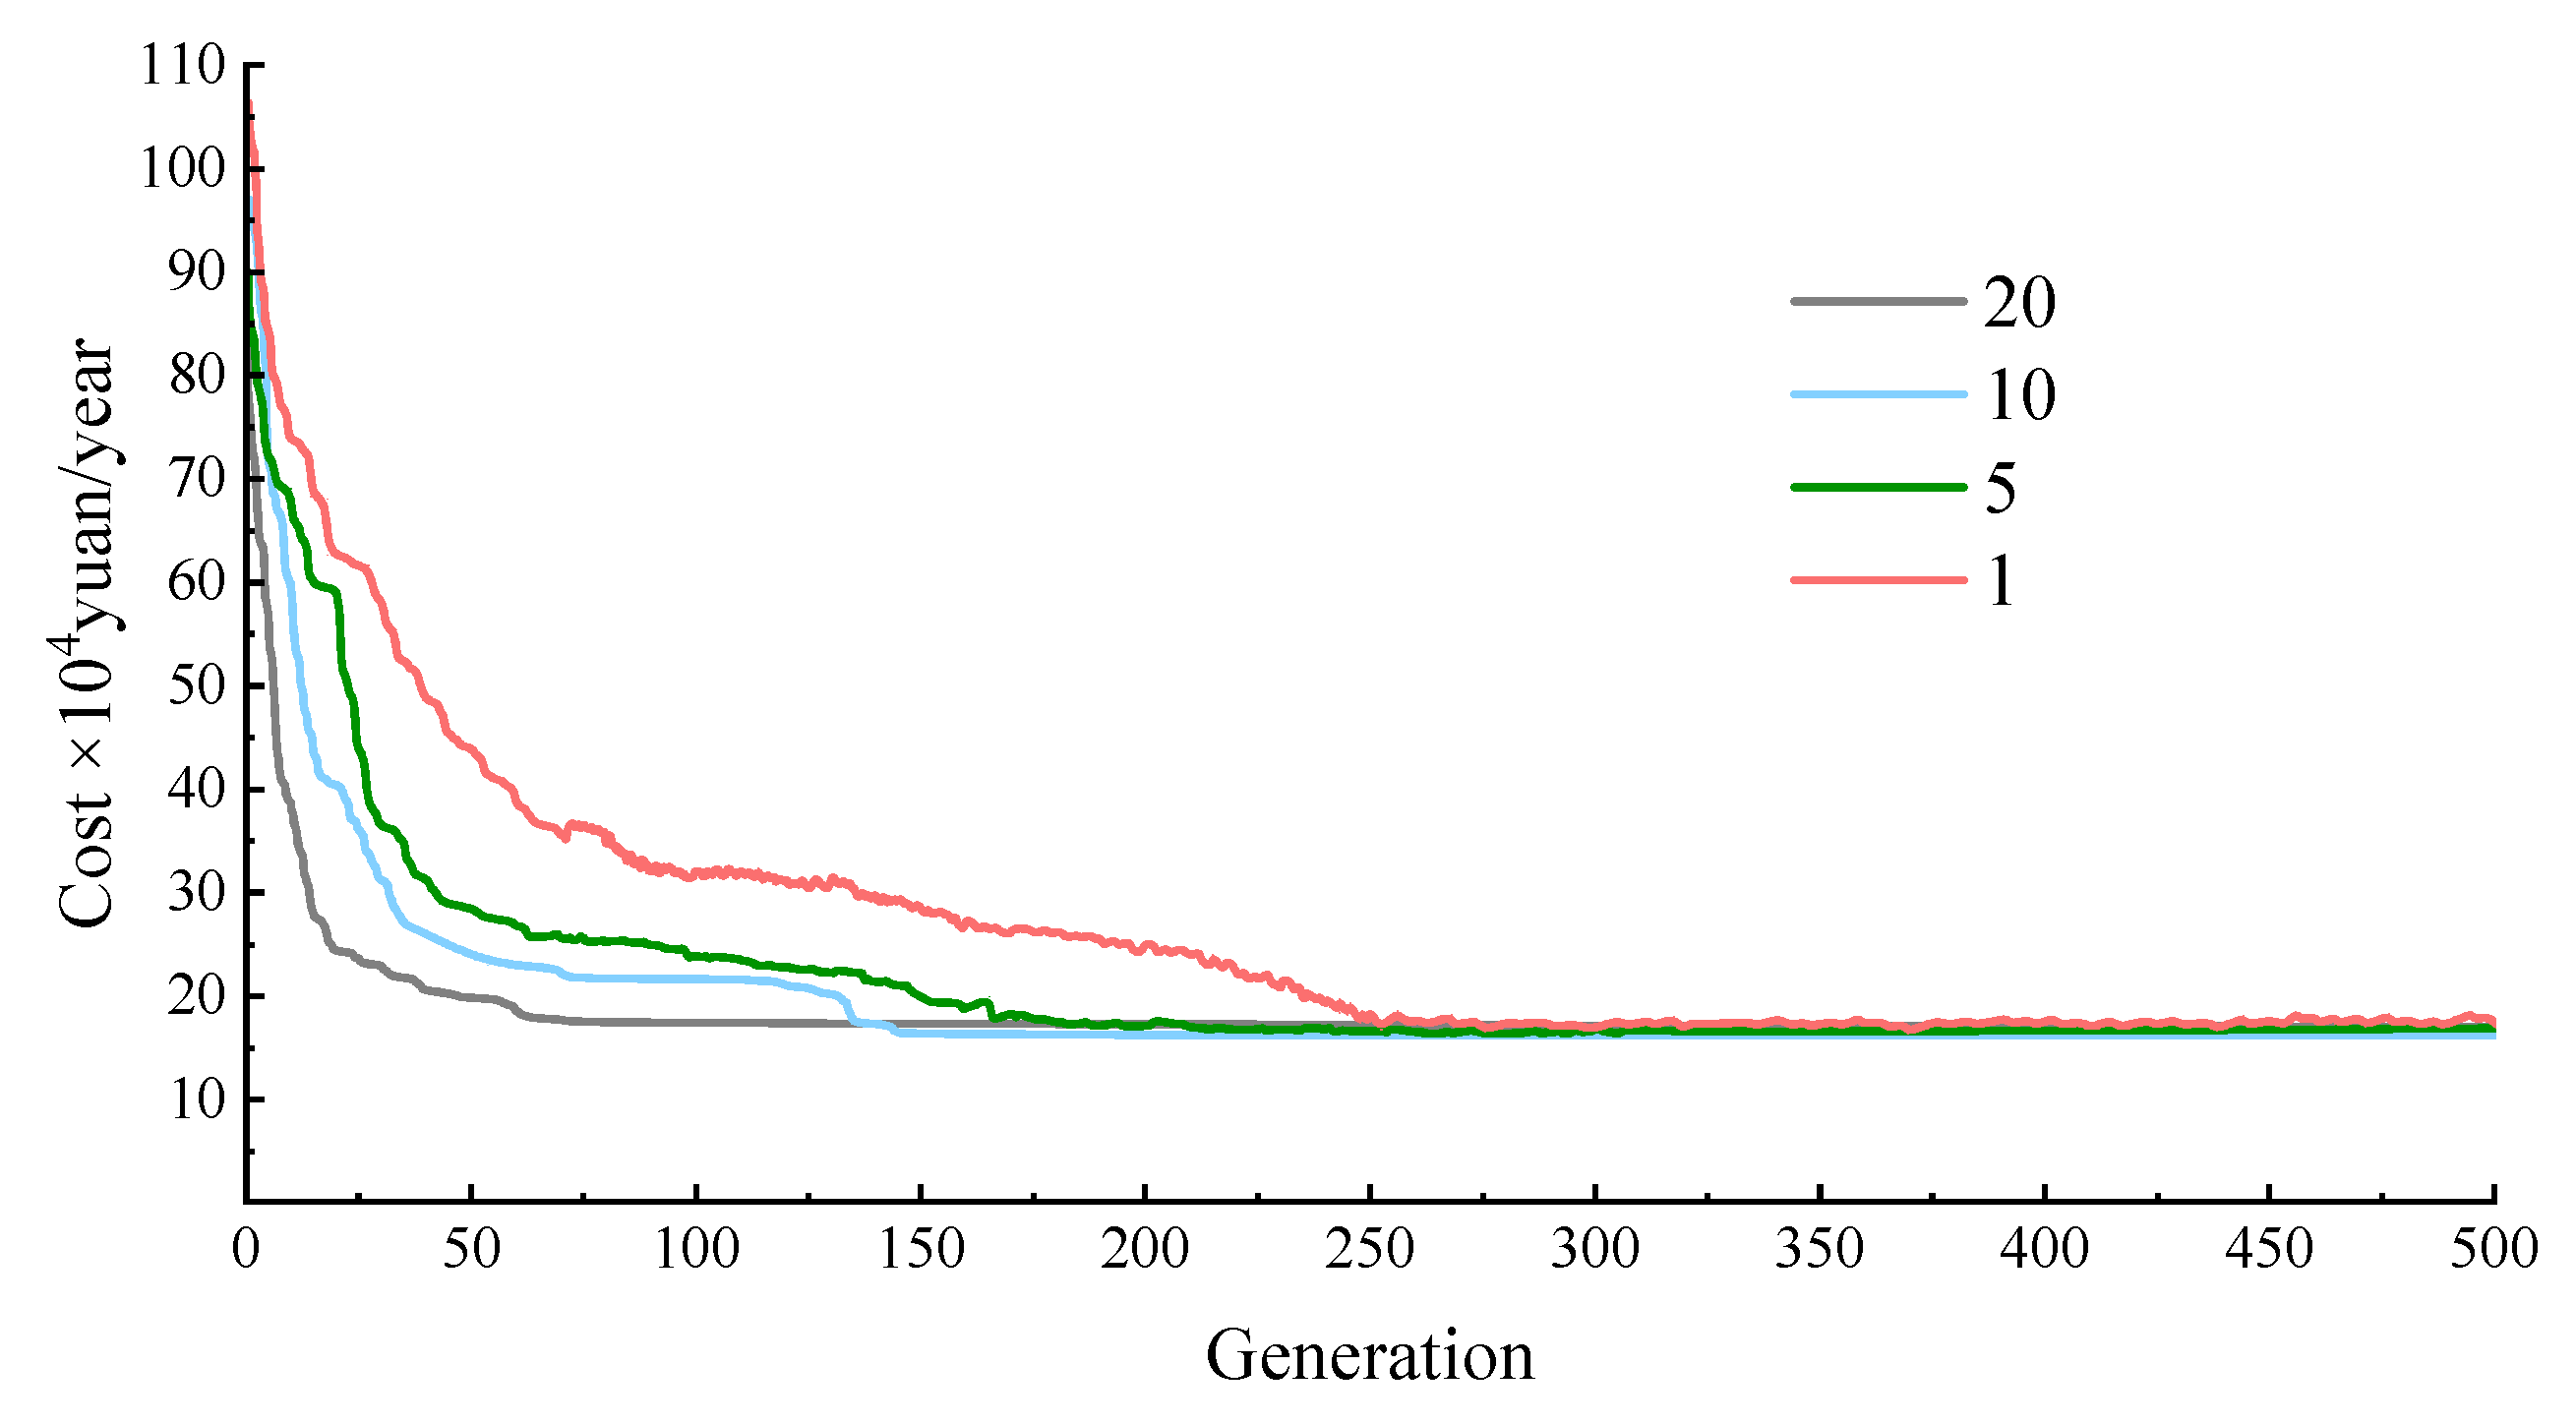
It can be seen from Figure 12 that when the GA operation interval was short, the number of iterations for the algorithm to achieve convergence increased. For example, when the algebraic intervals were 1 and 5, the algorithm approached convergence at approximately 250 iterations and 180 iterations, respectively; however significant oscillation occurred, and true convergence was not achieved by the end of the computation When the algebraic interval was set to 10 and 20, oscillations were reduced, and convergence was reached at 148 and 67 iterations, respectively. Nevertheless, the results indicate that when the algebraic interval was 20, the final cost was slightly higher than the optimal solution. These results demonstrate that a short algebraic interval can effectively prevent population homogenization through perturbations, but it may also disrupt high-quality solutions, leading to oscillations and prolonged convergence times. When the interval is long, dominant solutions are retained and convergence toward the current optimal region is accelerated, although this reduces population diversity and increases the risk of fall into a pseudo-global optimum.
The performance of the PSO-GA algorithm strongly depends on the design of the hybrid strategy and parameter tuning. In this study, a particle swarm size of 50 and a GA operation interval of 10 generations were selected, which proved to be reasonable and effective. In practical applications, appropriate parameters should be determined through small-scale experiments and further adjusted based on the specific characteristics of the problem to achieve an effective balance between computational accuracy and efficiency.
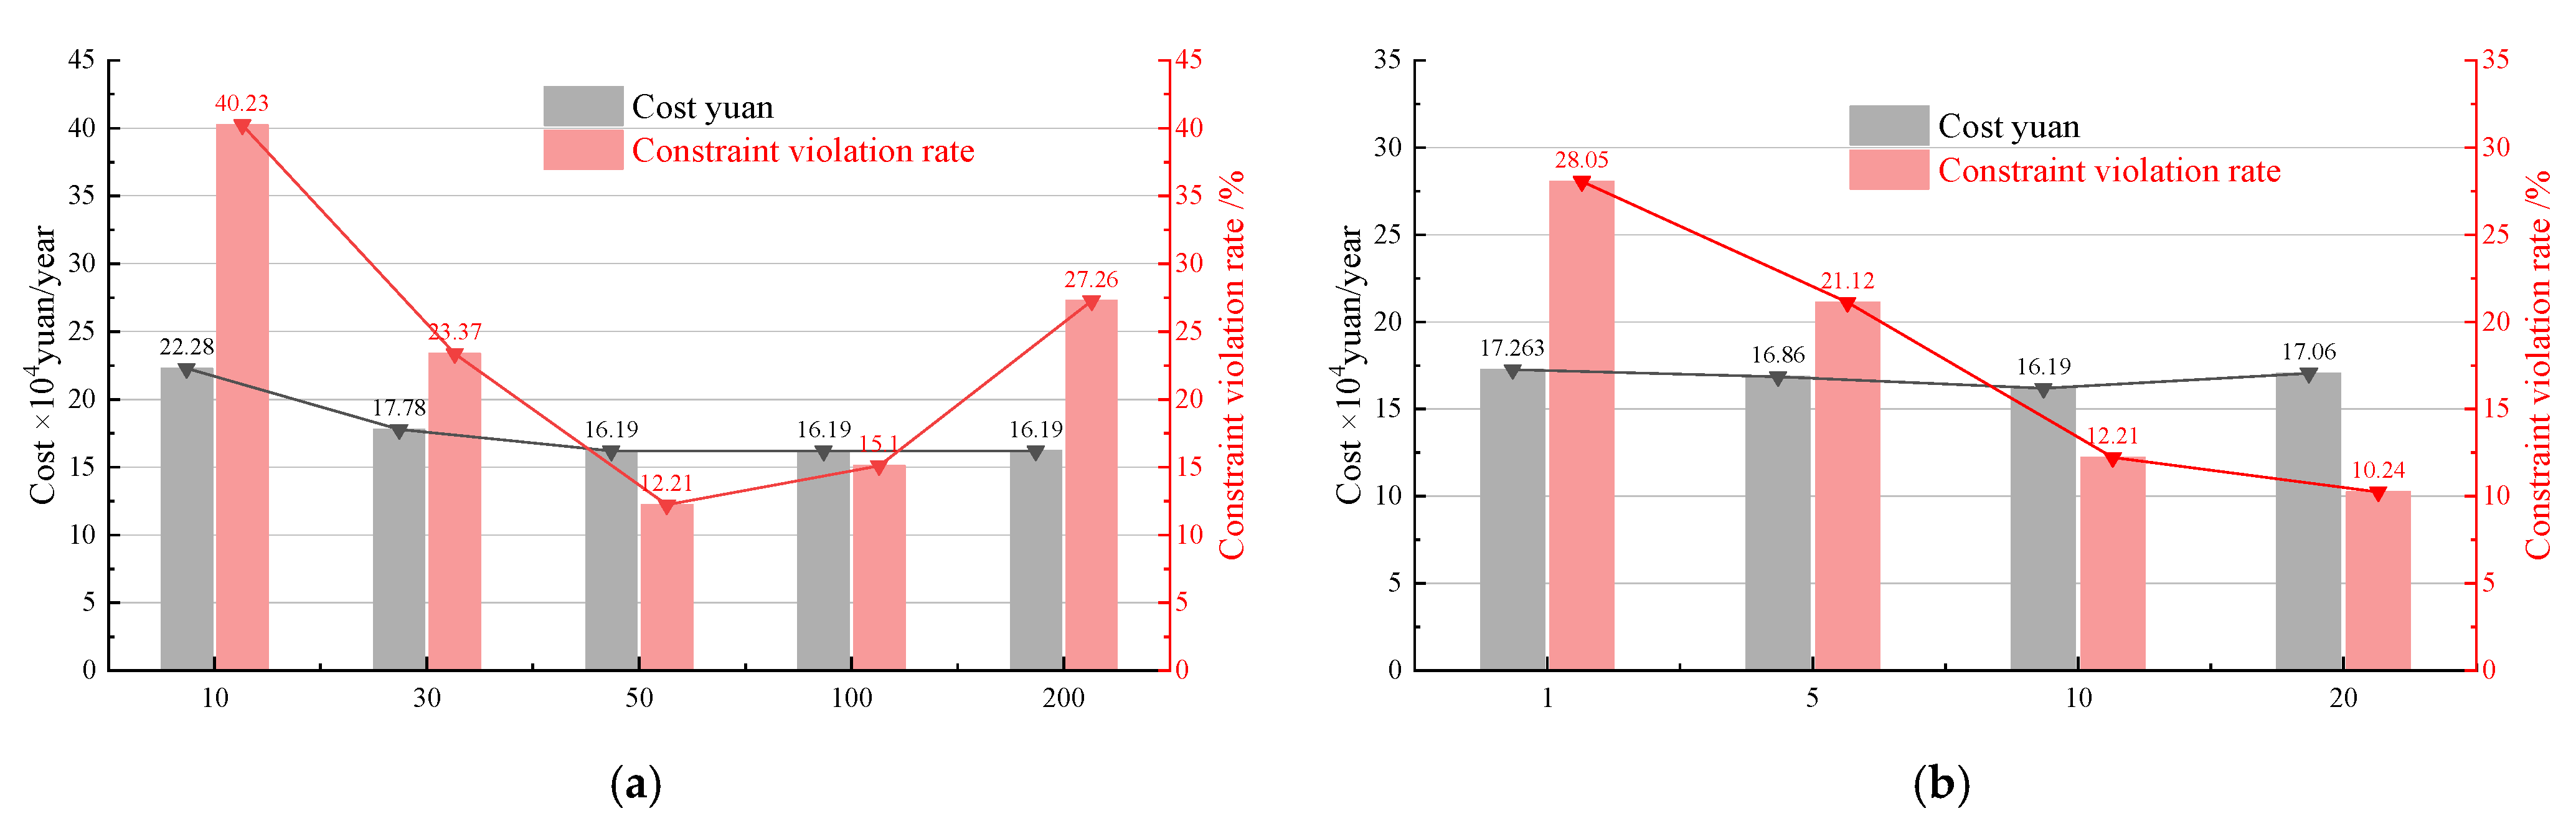
The cost and constraint violation rate were very sensitive to the number of particles, as shown in Figure 13. When the number of particles was small, the system cost was relatively high. Once the number of particles exceeded 50, the cost stabilized, indicating that the global optimal solution could be obtained with 50 particles, achieving a final cost reduction of 60,900 yuan. When the particle swarm size was small, particles were sparsely distributed, making it difficult to cover areas with complex constraints and leading to a constraint violation rate of 40.23%. When the particle number exceeded 50, the violation rate decreased to 27.26%. However, too many particles caused repeated exploration of invalid regions, resulting in increased constraint violations. The mutation interval had little effect on the cost, but frequent mutations caused fluctuations in the final result, making it difficult to approach the global optimum. In addition, frequent mutations increased the constraint violation rate when approaching convergence. Therefore, when the mutation interval was small, the constraint violation rate was 17.81% higher compared to a larger mutation interval.

6. Conclusions

In this study, the effectiveness and superiority of the PSO-GA algorithm in the optimization design of a drip irrigation network system for a test field in Northwest China were verified by establishing a mathematical model for the annual cost of the system, considering both pipeline construction costs and pump operation costs. The results demonstrate the following.
  • The PSO-GA algorithm significantly improved the process of drip irrigation pipe network optimization by integrating the fast convergence characteristics of particle swarm optimization with the global search capability of a genetic algorithm. The optimized system reduced the average annual cost by 21.2% compared with the empirical method, mainly by reducing diameter design and optimizing the number of branch pipes. The constraint satisfaction rate of the algorithm was 6.66–13.33% higher than those of other algorithms. The optimized main pipe adopted a stepped pipe diameter, reducing material cost by 14.3%. Additionally, the number of branch pipes decreased from 5 to 4, resulting in a 37.6% reduction in the total investment for lower branches.
  • Sensitivity analysis of algorithm parameters showed that a large particle swarm size significantly increased computational cost, while a small swarm size risked missing the global optimal solution. A short algebraic interval in the GA operation may lead to oscillations, and a long interval may lead to convergence to a local optimum. In this study, a particle swarm size of 50 effectively prevented premature convergence, and a GA operation interval of 10 generations balanced computational efficiency with population diversity.
  • Due to the constraints related to pump location and pipeline structure, the optimization scheme still has certain limitations, and more complex pipeline network layouts should be considered in further studies. In practical applications in the arid region of Northwest China, it is recommended to allow 3~5% redundancy in pipe diameter to account for the reduction in flow capacity caused by sediment deposition. Meanwhile, it is necessary to periodically review the pipe network parameters, update the optimization model dynamically, and adjust the drip irrigation strategy in a timely manner.

7. Limitations and Future Work

This study focused solely on the economic benefits of a pipeline network system by minimizing the total annual cost as a single objective, without considering ecological effects such as water resource utilization or carbon emissions. Moreover, the study was limited to comparisons with meta-heuristic algorithms and did not incorporate deterministic mixed integer nonlinear programming (MINLP) solvers to prove its superiority over the classical baseline model.
Future research should integrate multi-objective optimization algorithms to balance economy, environmental, and system reliability objectives, thereby improving system sustainability. Furthermore, the current model is based on static parameters, such as fixed running days and electricity price, and its universality relative to larger scale farmland and multi-level terrain needs to be further verified. Future studies could optimize the model by incorporating dynamic variables and adapting it to different environmental terrain to enhance its robustness.

Author Contributions

Funding acquisition, D.B.; writing—review and editing, M.L.; investigation, M.L., D.B. and L.L. All authors have read and agreed to the published version of the manuscript.

Funding

This research did not receive any specific grant from funding agencies in the public, commercial, or not-for-profit sectors. This research self-funded by author Dan Bai.

Data Availability Statement

The original contributions presented in this study are included in the article. Further inquiries can be directed to the corresponding authors.

Conflicts of Interest

The authors declare no conflict of interest.

References

  1. Bansal, G.; Mahajan, A.; Verma, A.; Singh, D.B. A Review on Materialistic Approach to Drip Irrigation System. Mater. Today Proc. 2021, 46, 10712–10717. [Google Scholar] [CrossRef]
  2. Camp, C.R. Subsurface Drip Irrigation: A Review. Trans. ASAE 1998, 41, 1353–1367. [Google Scholar] [CrossRef]
  3. Van der Kooij, S.; Zwarteveen, M.; Boesveld, H.; Kuper, M. The Efficiency of Drip Irrigation Unpacked. Agric. Water Manag. 2013, 123, 103–110. [Google Scholar] [CrossRef]
  4. Venot, J.-P.; Zwarteveen, M.; Kuper, M.; Boesveld, H.; Bossenbroek, L.; Kooij, S.V.D.; Wanvoeke, J.; Benouniche, M.; Errahj, M.; Fraiture, C.D. Beyond the Promises of Technology: A Review of the Discourses and Actors Who Make Drip Irrigation. Irrig. Drain. 2014, 63, 186–194. [Google Scholar] [CrossRef]
  5. Wang, Y.; Zhang, Y.; Wang, W.; Liu, Z.; Yu, X.; Li, H.; Wang, W.; Hu, X. A Review of Optimal Design for Large-Scale Micro-Irrigation Pipe Network Systems. Agronomy 2023, 13, 2966. [Google Scholar] [CrossRef]
  6. Dandy, G.C.; Hassanli, A.M. Optimum Design and Operation of Multiple Subunit Drip Irrigation Systems. J. Irrig. Drain. Eng. 1996, 122, 265–275. [Google Scholar] [CrossRef]
  7. Yoo, D.G.; Lee, H.M.; Sadollah, A.; Kim, J.H. Optimal Pipe Size Design for Looped Irrigation Water Supply System Using Harmony Search: Saemangeum Project Area. Sci. World J. 2015, 2015, 651763. [Google Scholar] [CrossRef]
  8. Masoumi, M.; Kashkooli, B.S.; Monem, M.J.; Montaseri, H. Multi-Objective Optimal Design of on-Demand Pressurized Irrigation Networks. Water Resour. Manag. 2016, 30, 5051–5063. [Google Scholar] [CrossRef]
  9. Klyushin, D.; Tymoshenko, A. Optimization of Drip Irrigation Systems Using Artificial Intelligence Methods for Sustainable Agriculture and Environment. In Artificial Intelligence for Sustainable Development: Theory, Practice and Future Applications; Springer International Publishing: Cham, Switzerland, 2021; pp. 3–17. [Google Scholar] [CrossRef]
  10. Zhao, R.-H.; He, W.-Q.; Lou, Z.-K.; Nie, W.-B.; Ma, X.-Y. Synchronization Optimization of Pipeline Layout and Pipe Diameter Selection in a Self-Pressurized Drip Irrigation Network System Based on the Genetic Algorithm. Water 2019, 11, 489. [Google Scholar] [CrossRef]
  11. Duan, X.; He, W.; Wang, Y.; Liu, Q.; Tian, Y.; Shi, X. Optimization Design Method of a Large-Scale Multilevel Gravity Drip Irrigation Pipe Network System Based on Atom Search Optimization. J. Irrig. Drain. Eng. 2022, 148, 04022023. [Google Scholar] [CrossRef]
  12. Zhang, Y.; Song, C. Economical Design of Drip Irrigation Control System Management Based on the Chaos Beetle Search Algorithm. Processes 2023, 11, 3417. [Google Scholar] [CrossRef]
  13. Karimi, B.; Mohammadi, P.; Sanikhani, H.; Salih, S.Q.; Yaseen, Z.M. Modeling Wetted Areas of Moisture Bulb for Drip Irrigation Systems: An Enhanced Empirical Model and Artificial Neural Network. Comput. Electron. Agric. 2020, 178, 105767. [Google Scholar] [CrossRef]
  14. Fan, K.; Zhao, T.; Yu, X.; Wang, W.; Hu, X.; Ran, D.; Huo, X.; Wang, Y.; Pi, Y. Synchronization Optimization of Pipeline Layout and Pipe Diameter Selection in a Drip Irrigation Network System Based on the Jaya Algorithm. Water 2024, 16, 2913. [Google Scholar] [CrossRef]
  15. Wang, C.; Bai, D.; Li, Y.; Zhang, Q.; Ma, X.; Tian, D.; Shan, M. Establishment of Critical Non-Depositing Velocity Prediction Model for Sediment in Drip Irrigation Laterals Based on PSO-SVM. J. Clean. Prod. 2024, 457, 142488. [Google Scholar] [CrossRef]
  16. Chili Lima, A.A.; Apaza Cuentas, L.S. Optimization of Traditional Crop Yields Through Experimental Design. 13 December 2024. Available online: https://papers.ssrn.com/sol3/papers.cfm?abstract_id=5056267 (accessed on 1 April 2025).
  17. Batmaz, V.; Ugur, I.B. Circulatory System-Based Optimization Algorithm with Dynamic Penalty Function for Optimum Design of Large-Scale Water Distribution Networks. Eng. Optim. 2025, 57, 427–458. [Google Scholar] [CrossRef]
  18. Córdoba, A.T.; Manzano, J.M. Reducing Flow Heterogeneity in Drip Irrigation Networks Using Genetic Algorithms. Irrig. Drain. 2024. [Google Scholar] [CrossRef]
  19. Jahandideh-Tehrani, M.; Bozorg-Haddad, O.; Loáiciga, H.A. Application of Particle Swarm Optimization to Water Management: An Introduction and Overview. Environ. Monit. Assess. 2020, 192, 281. [Google Scholar] [CrossRef]
  20. Zhang, H.; Liang, Y.; Zhang, W.; Xu, N.; Guo, Z.; Wu, G. Improved PSO-Based Method for Leak Detection and Localization in Liquid Pipelines. IEEE Trans. Ind. Inform. 2018, 14, 3143–3154. [Google Scholar] [CrossRef]
  21. Pourgholam-Amiji, M.; Ahmadaali, K.; Liaghat, A. A Novel Early Stage Drip Irrigation System Cost Estimation Model Based on Management and Environmental Variables. Sci. Rep. 2025, 15, 4089. [Google Scholar] [CrossRef]
  22. Babu, K.S.J.; Vijayalakshmi, D.P. Self-Adaptive PSO-GA Hybrid Model for CombinatorialWater Distribution Network Design. J. Pipeline Syst. Eng. Pract. 2013, 4, 57–67. [Google Scholar] [CrossRef]
  23. Wu, J.; Liu, H.; Ruan, Y.; Wang, S.; Yuan, J.; Lu, H. A Novel Method for Network Design and Optimization of District Energy Systems: Considering Network Topology Planning and Pipe Diameter. Appl. Sci. 2021, 11, 1795. [Google Scholar] [CrossRef]
  24. Zhang, H.; Liang, Y.; Ma, J.; Shen, Y.; Yan, X.; Yuan, M. An Improved PSO Method for Optimal Design of Subsea Oil Pipelines. Ocean Eng. 2017, 141, 154–163. [Google Scholar] [CrossRef]
  25. Zheng, Z.; Wu, C. Power Optimization of Gas Pipelines via an Improved Particle Swarm Optimization Algorithm. Pet. Sci. 2012, 9, 89–92. [Google Scholar] [CrossRef]
  26. Yan, L.I.N.; Dengyue, X.I.N.; Xuanyi, B.; Qiaoyu, Z.; Tieli, L.I. Improved Adaptive Inertia Weight PSO Algorithm and Its Application in Nuclear Power Pipeline Layout Optimization. Chin. J. Ship Res. 2023, 18, 1–12. [Google Scholar]
  27. Lansey, K.E.; Mays, L.W. Optimization Model for Water Distribution System Design. J. Hydraul. Eng. 1989, 115, 1401–1418. [Google Scholar] [CrossRef]
  28. Wang, W.; Xu, R.; Wei, R.; Wang, W.; Hu, X. Effects of Different Pressures and Laying Lengths of Micro-Sprinkling Hose Irrigation on Irrigation Uniformity and Yield of Spring Wheat. Agric. Water Manag. 2023, 288, 108495. [Google Scholar] [CrossRef]
  29. Samarinas, N.; Gravani, A.; Evangelides, C.; Loukas, A. A Smart Pipe Length Splitting Method for Cost Minimization of a Pressurized Irrigation Network. Water Resour Manag. 2024. [Google Scholar] [CrossRef]
  30. Bragalli, C.; D’Ambrosio, C.; Lee, J.; Lodi, A.; Toth, P. On the Optimal Design of Water Distribution Networks: A Practical MINLP Approach. Optim. Eng. 2012, 13, 219–246. [Google Scholar] [CrossRef]
  31. Lapo, C.M.; Pérez-García, R.; Izquierdo, J.; Ayala-Cabrera, D. Hybrid Optimization Proposal for the Design of Collective On-Rotation Operating Irrigation Networks. Procedia Eng. 2017, 186, 530–536. [Google Scholar] [CrossRef]
  32. Kennedy, J.; Eberhart, R. Particle Swarm Optimization. In Proceedings of the ICNN’95—International Conference on Neural Networks, Perth, WA, Australia, 27 November–1 December 1995; Volume 4, pp. 1942–1948. [Google Scholar]
  33. Eberhart, R.; Kennedy, J. A New Optimizer Using Particle Swarm Theory. In Proceedings of the MHS’95—The Sixth International Symposium on Micro Machine and Human Science, Nagoya, Japan, 4–6 October 1995; pp. 39–43. [Google Scholar]
  34. Garcia-Gonzalo, E.; Fernandez-Martinez, J.L. A Brief Historical Review of Particle Swarm Optimization (PSO). J. Bioinform. Intell. Control 2012, 1, 3–16. [Google Scholar] [CrossRef]
  35. Zhang, W.; Gu, X.; Han, L.; Wu, J.; Xiao, Z.; Liu, M.; Wang, L. A Short Review of Probabilistic Slope Stability Analysis Considering Spatial Variability of Geomaterial Parameters. Innov. Infrastruct. Solut. 2022, 7, 249. [Google Scholar] [CrossRef]
  36. Sampson, J.R. Adaptation in Natural and Artificial Systems (John H. Holland); Society for Industrial and Applied Mathematics: Philadelphia, PA, USA, 1976; ISBN 0036-1445. [Google Scholar]
  37. Tian, D.; Shi, Z. MPSO: Modified Particle Swarm Optimization and Its Applications. Swarm Evol. Comput. 2018, 41, 49–68. [Google Scholar] [CrossRef]
  38. Jung, B.S.; Karney, B. Fluid Transients and Pipeline Optimization Using GA and PSO: The Diameter Connection. Urban Water J. 2004, 1, 167–176. [Google Scholar] [CrossRef]
  39. Garg, H. A Hybrid PSO-GA Algorithm for Constrained Optimization Problems. Appl. Math. Comput. 2016, 274, 292–305. [Google Scholar] [CrossRef]
  40. Hu, G.; Mao, Z.; He, D. A New Cultural Algorithm Based on Hybrid of GA and PSO Algorithm. J. Northeast. Univ. (Nat. Sci.) 2009, 30, 1542. [Google Scholar]
Figure 1. The relationship between the main variables and the cost.
Processes 13 01485 g001
Figure 2. The basic process of the PSO-GA algorithm.
Processes 13 01485 g002
Figure 3. Basic Overview of the Experimental Field.
Processes 13 01485 g003
Figure 4. Four methods of creating a drip irrigation network system layout: (a) Empirical method; (b) GA; (c) PSO; (d) ASO; (e) PSO-GA.
Processes 13 01485 g004
Figure 5. The cost distribution box diagram.
Processes 13 01485 g005
Figure 6. The cost proportion results of the four methods.
Processes 13 01485 g006
Figure 7. Node pressure distribution box diagram.
Processes 13 01485 g007
Figure 8. The objective function convergence curves of different algorithms.
Processes 13 01485 g008
Figure 9. Constraint satisfaction rate of different algorithms.
Processes 13 01485 g009
Figure 10. Pressure verification: (a) The boxplot of pressure differences; (b) Pressure comparation of PSO-GA method and measurement.
Processes 13 01485 g010
Figure 11. Effect of particle number on convergence.
Processes 13 01485 g011
Figure 12. Effect of mutation interval algebra on convergence.
Processes 13 01485 g012
Figure 13. Sensitivity quantification. (a) Number of particles; (b) algebraic interval of GA operation.
Processes 13 01485 g013
Table 1. PSO implementation process.
AlgorithmParticle Swarm Optimization (PSO)
1Define the objective function f(x).
2Define the fitness function.
3Generate initial particle swarm.
4Initialize the position and velocity of each particle.
5setting inertia weight w; learning factors c1, c2
6Evaluate fitness.
7Record the individual optimal fitness and group optimal fitness.
8Update the velocity and position of each particle.
9Cycle 6~8 until the maximum number of iterations or fitness is no longer significantly improved.
10Output results.
Table 2. GA implementation process.
AlgorithmGenetic Algorithm (GA)
1Define the objective function f(x).
2Define the fitness function.
3Generate initial population.
4Set the initial probabilities of crossover (pc) and mutation (pm).
5Reproduction.
6Generation of offspring by crossover and mutation.
7Evaluate the fitness and replace part of the parent generation with the offspring.
8Preserve elite particles.
9Cycle 5~8 until the maximum number of iterations or the fitness is no longer significantly improved.
10Output results.
Table 3. Main parameters of drip irrigation system.
Parameter TypeParameter NameValueUnit
Hydraulic conditionDesigned discharge85m3/h
Branch pipe inlet pressure0.15–0.3MPa
Dropper work0.05–0.13MPa
Tolerated losing rate≤18m
Economic parameterElectricity price0.65yuan/kWh
Discount rate8%
Pump unit-efficiency0.8-
Crop parametersCrop cycle200day
Table 4. Pipeline selection scheme.
Pipe GradeMaterialDiameter Range (mm)Pressure Grade (MPa)Unit Price (yuan/m)
main pipePVC-U110–2000.8–1.020–35
branch pipePVC-U50–1100.6–0.88–20
lateralPE20–500.40.75–3.75
Table 5. Optimization algorithm parameters after preliminary tuning.
Parameter TypeGAPSOASO [11]PSO-GA
Population size200505050
Maximum number of iterations500500500500
Crossover rate (pc)0.75--0.65
Mutation rate (pm)0.1--0.07
Inertia weight (w)-0.6–0.80.8–0.40.8–0.4
Learning factor (c1, c2)-2.0, 1.51.52.0, 1.5
Elite retention rate10%--10%
Substitution ratio of offspring70%--70%
Table 6. Optimization results of pipe network parameter design.
ParameterEmpirical MethodGAPSOASOPSO-GA
Diameter of the main pipe (millimeters, mm)200200/180200/180/160200/180/160200/180/160
Length of the main pipe (meter, m)450250/200188/125/125195/120/120185/130/120
Diameter of the branch pipe (mm)9090/7590/75/6390/75/6390/75/63
Length of a single branch pipe (m)400250/150150/200/50100/150/15050/200/150
Total number of branch pipes55444
Diameter of the lateral (mm)3232252525
Length of a single lateral (m)505062.560/6565/55
Total number of lateral50005000400040004000
Pump head (m)3532283026
Average flow rate (m/s)1.251.03 ± 0.321.15 ± 0.241.17 ± 0.130.97 ± 0.15
Branch pipe inlet pressure distribution (MPa)0.280.16–0.220.18–0.260.19–0.220.16–0.23
Table 7. LSD post hoc test.
Group1Group2Mean DifferenceCI_LowerCI_Upperp Value
GAPSO1.75441.6351.87394.1079 × 10−55
GAASO1.95181.83242.07136.7239 × 10−60
GAPSO-GA3.07823.19772.95872.5845 × 10−81
PSOASO0.197390.0779130.316870.0014059
PSOPSO-GA1.32381.20431.44324.1984 × 10−43
ASOPSO-GA1.12641.00691.24589.4385 × 10−37
Table 8. Cost comparison (104 yuan/year).
MethodConstruction CostEnergy CostMaintenance CostTotal Cost
Empirical method11.727.901.4821.10
GA11.05 ± 0.307.32 ± 0.121.39 ± 0.0919.76 ± 0.35
PSO10.35 ± 0.216.35 ± 0.101.27 ± 0.0517.97 ± 0.25
ASO10.18 ± 0.176.36 ± 0.131.19 ± 0.0817.74 ± 0.18
PSO-GA9.80 ± 0.155.79 ± 0.081.03 ± 0.0316.62 ± 0.20
Table 9. Sensitivity of input parameter analysis results.
ParameterDisturbanceTotal Cost After Disturbance
(104 Yuan/Year)
Relative Change Rate
(%)
Sensitivity Coefficient
Pump efficiency±10%15.69/17.545.57%−0.557
Designed discharge±10%17.53/15.705.51%0.551
Pump head±10%17.53/15.705.51%0.551
Electricity price±10%16.98/16.262.18%0.218
Length of branch pipe±10%16.75/16.480.79%0.079
Length of branch pipe±10%16.68/16.550.12%0.012
Length of lateral±10%16.62/16.610.02%0.002
Disclaimer/Publisher’s Note: The statements, opinions and data contained in all publications are solely those of the individual author(s) and contributor(s) and not of MDPI and/or the editor(s). MDPI and/or the editor(s) disclaim responsibility for any injury to people or property resulting from any ideas, methods, instructions or products referred to in the content.

