Abstract
Testing bicycle components is an essential procedure for guaranteeing quality and compliance with legal requirements. The tests are performed following normalized procedures, involving specialized equipment operated by qualified technicians. This study analyses the processes carried out in a Mobility Laboratory, with the emphasis on optimizing the assembly process for fatigue tests on bicycle frames, simulating the cyclist’s pedal stroke. Data were collected and analysed. The diagnostic approach adopted took into account the application of Pareto’s Law, thus enabling a structured and detailed assessment of the organization’s current situation. Data analysis and the adoption of lean tools revealed the process could be optimized and the costs brought down taking advantage of appropriate management methodologies and opportunities for improvement. A set of initiatives were proposed to increase operational efficiency and reduce the tests’ non-value-added activities by 31%.
1. Introduction
The global bicycle industry has undergone a significant transformation in recent years, driven by a number of factors, including changes in consumer preferences, technological advances and a growing concern for environmental sustainability [1]. This evolution has been particularly striking in the European market, where the bicycle is not only seen as a means of transportation, but also as an integral part of culture and lifestyle [2].
In Portugal, bicycle production has increased considerably, making the country one of the main players of this sector in Europe. Since 2019, Portugal has occupied the first place in the European industry, thus reflecting the growing commitment to sustainable mobility, following global trends towards more environmentally friendly vehicles. A remarkable indication of this success is the fact that, in 2022, the two-wheel sector in Portugal produced more than two million units [3].
With this in mind and knowing the growing importance of this market, few studies have been carried out specifically in the Portuguese context, particularly regarding the optimization of operational processes in the field of bicycle testing; this work seeks to fill this gap by focusing on the improving processes of a laboratory where fatigue tests simulating cyclist pedalling are carried out.
In fact, a laboratory department implies costs, which are often seen as a burden due to the regulatory framework. Nonetheless, those costs most of the time can not only be optimized but can also be seen as an important investment in quality and a way to lower other expenses, such as reparations during the warranty period. Taking this into account, this paper analyses the quality control of the bicycle components, aiming for its optimization with the final objective of maximizing the company profits and guaranteeing competitiveness in this important market sector.
Through a detailed analysis of the processes, including the use of the Pareto tool and bibliographical research, it was possible to identify the main inefficiencies and propose practical solutions for reducing costs and increasing productivity. The impact of this work goes beyond the operational improvement of the company in question, since the results obtained could be applied to other organizations in the sector, with the aim of increasing efficiency, reducing waste and promoting innovation.
The study began with a detailed analysis of the data on the services provided over the last four years, with the aim of identifying the most frequent tests and those that contribute most to turnover. A thorough assessment of the processes was carried out, which initially included mapping process flows and studying methods and times. Based on the information obtained, solutions were proposed with the aim of improving operational efficiency and rationalizing the budget. It is expected that the results will make a significant contribution to efficiency, productivity and job satisfaction, as well as promoting the organization’s involvement in an increasingly more digital world.
2. Literature Review
2.1. Lean
Lean is a philosophy that aims to help organizations systematically recognize and eradicate the tasks and procedures that impact their performance [4]. This concept originated in Japan with the Toyota Production System (TPS) developed by Taiichi Ohno. There are three common designations: Lean Manufacturing, Lean Production and Lean Management. Through the different techniques, tools and methodologies, this philosophy is understood as a behavioural posture, i.e., a way in which the employees of an entity reason and proceed in the face of what is desired [5]. M. Custódio [6] states that Lean management essentially focuses on reducing and eliminating the eight sources of waste (discussed later). This action not only boosts the quality of the products/services produced but also improves lead times and associated costs. At the same time, it is important to mention that the Lean production model is characterized by improving the following aspects: reliability, flexibility, and speed. To this end, certain strategies are adopted with a view to specializing people in the respective tasks.
2.2. Lean Tools
Lean tools are the result of numerous investigations over the years, and they are partially interdependent on each other. According to [6,7,8], they can be characterized by:
- 5S: corresponds to a methodology established in Japan which, when implemented, reduces the waste of resources and increases levels of production, proficiency, and organization. The word “5S” reflects five ways of acting: classify, organize, clean, standardize, sustain;
- Bottleneck analysis: consists of analysing the cycle times associated with each machine or task. Its main purpose is to identify the “least positive” point(s) or target(s) for improvement, analyse them meticulously and define actions in order to improve their performance (Figure 1);
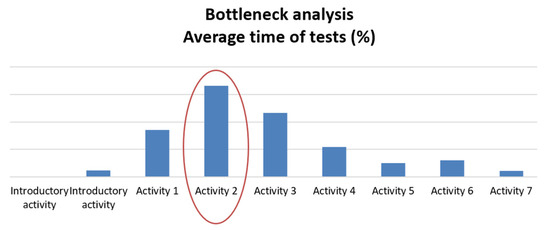 Figure 1. Bottleneck analysis. Activity 2 is the most time consuming of the process.
 - Waste (MUDA): as mentioned above, it essentially focuses on reducing and eliminating everything in the manufacturing process that does not add value to the product from the customer’s point of view (and which is considered waste);
- Standard Work: corresponds to the study and implementation of the best practices known at the time of analysis. Standardized work includes a set of mandatory activities and their sequence, thus ensuring that, regardless of the operator, the task is carried out in the same way. It is also important to note that this type of tool consists of four elements:
- -
- Takt time: referring to the rate at which products must be manufactured or services performed in order to satisfy customer demand on time;
- -
- Work sequence: which must correspond exactly to the tasks carried out by the operator, within the cycle time;
- -
- Inventory: referring to all the material needed to keep the process running smoothly (includes machine workstations);
- -
- Operator skill and the ability to manoeuvre the machine or system.
- Kaizen: means “continuous improvement”. This tool is very comprehensive and aims to implement continuous improvement tools to correct specific problems. Its focus is essentially on reducing costs, improving quality and delivering products efficiently;
- PDCA cycle: also known as the “Deming cycle”, is a tool that allows to define, follow up and monitor any action to take. It is made up of four words, which justify its nomenclature:
Plan: At this stage, the objectives must be set and the action plan drawn up so that they can be achieved;
Do: consists of executing the plan previously defined;
Check: this consists of collecting and analysing the results/data obtained during execution;
Act: in this phase, new improvement actions should be defined (if necessary), the results obtained should be recorded and the whole process should be consolidated.
- Pareto chart: helps to identify and analyse problems and determines the main root causes. The Pareto principle states that 80% of the consequences come from 20% of the causes. Pereira et al. [5] uses the A, B, C categorization:
- -
- Class A: around 20% of the items in an entity correspond to 80% of the defects found (Figure 2);
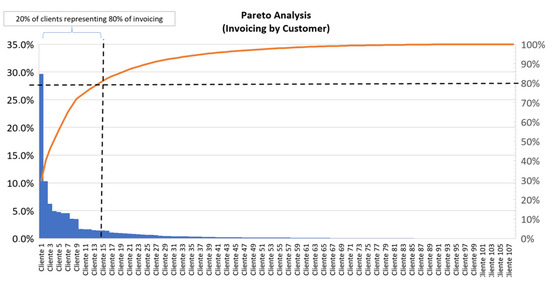 Figure 2. Pareto analysis—invoicing by costumer.
 - -
- Class B: around 15% of the defects found correspond to around 30% of the organization’s articles;
- -
- Class C: around 5% of the defects found in an organization correspond to 50% of the products.
Considering the reality in question, this principle served as the basis for the initial diagnostic approach.
2.3. Value Chain
Pereira et al. [5] points out that the study of methods and times is mainly used to improve the way in which a particular activity is carried out. Consequently, this process is important to ensure the standardization of working methods. To guarantee an accurate analysis, it is essential to follow a methodological process consisting of four crucial stages: observation, recording data and information, critical analysis and proposing new methods or opportunities for improvement. It is important to note that the operation must be timed between five and seven times to calculate the values for the mean and range. Subsequently, the desired probability and relative error values are set (it is common to use probabilities of 90% and 95% and a relative error varying between 5% and 10%). A value of between 10% and 20% is usual to calculate the Tolerance Factor (TF), according to [4].
M. Custódio [6] points out that the aim of value chain analysis is to identify all the activities associated with a process/product and then define actions to reduce the associated waste. In a value chain, there are value-added activities and other activities that are considered waste.
In this sense, three categories of activities are defined:
- Value-Added (VA): corresponds to all the activities that really add value;
- Type One Muda: Activities that do not add value, but are unavoidable given existing technologies and processes;
- Not Value-Added (NVA) or Type Two Muda: Activities that do not add value and are dispensable.
2.4. Related Work
Bicycle safety is an important issue, and it has therefore been subject to heavy research before. However, only a small number of studies related to the optimization of the operational processes in bicycle testing can be found. This emphasizes the importance of the present paper.
Usually, the focus is on the optimization of production, the quality laboratory being overlooked or seen as something secondary, whose quality control times do not matter for the total cost of the process. This paper focuses on this last subject, showing the importance of optimized quality tests to increase the quality, reliability and company sustainability.
Some of the previous studies found include [9], which discusses experimental results of evaluating fatigue behaviour of bicycle welded components. Several authors have calculated the fatigue life of a bicycle frame after fatigue failure due to operational loads. Cheng et al. [8] proposes improvement of a bicycle frame based on fatigue tests. On the other hand, others studied the stress on off-road bicycle handlebars and conducted fatigue analysis of a bicycle fork [10].
However, to the best of the authors’ knowledge there is no work on optimization of the testing process itself, even more so regarding the use of the Lean tools in order to reduce waste and guarantee the quality of the process.
Comprehensive research into the applicability of the various Lean tools was performed. This is fundamental not only for understanding the most effective and innovative practices but also for adapting solutions that fit the needs and challenges of each organizational reality, thus promoting sustainable improvements. In this regard, the following 117 examples are presented:
- Pereira et al. [5], through the study of continuous improvement in a mould manufacturing industry, found that the main contributors to downtime were essentially: operator unavailability (around 16.4%), machine programming (14.4%) and tool changes (12.4%). As for the machines, it was also possible to see that, on the one hand, a significant proportion of the machines that are in operation are operating below the ideal average state; on the other hand, a considerable number of machines exceed the expected setup time, showing an imbalance in production, caused by incorrect planning of tasks. As an improvement action, the authors implemented a set of Lean tools, such as the 5S methodology, SMED, Visual Management and Standard Work, resulting in a significant improvement of each machine by around 20%; in P. Costa [11], at an early stage of the improvement project, integrated into an assembly line used to produce car stereos, several problems related to a lack of organization, tidiness of workstations and a lack of systematic and standardized procedures were highlighted. Through the implementation of various Lean tools, such as 5S, SMED, Standard Work, among others, an improvement in execution times of approximately 60% was achieved;
- Nguyen et al. [7] applied the DMAIC (Define, Measure, Analyse, Improve, Control) approach to a few support tools at an entity specializing in the manufacture of all types of plastic products. Initially, by adopting the Pareto Law and then the Ishikawa Diagram, it was possible to identify the most frequently occurring problem, as well as the main associated root causes. Continuing with the DMAIC methodology and following the analysis and implementation of 5S and Visual Management practices, a substantial improvement was seen in the conditions of the work environment, effectively contributing to the prevention and reduction of defects in the operation of the process and the waste associated with them.
- Pereira et al. [5] proves the importance of applying Lean tools in a productive environment that is essentially dedicated to the change process in a bicycle assembly line. The application of the SMED methodology, the realization of 5S activities and the normalization of setup operations potentiated significant improvements in the process. By way of example, after the completion of 5S activities and the normalization of operations, there is a reduction in all execution times of change preparation operations by about 48%. At the same time, the average setup time also improved by 39%.
- Wong et al. [12] states that motivated and trained employees become crucial, since they represent the key element of Lean Manufacturing and it is important to ensure that they are aligned with the strategy. On the other hand, considering the problems existing in various realities, they also indicate that an unforeseen breakdown in equipment can cause an interruption in the production line and, consequently, a reduction in productivity (waste). Through the adoption of appropriate programming methods, such as the pull system and other Lean tools, it is possible to improve the entire organizational management and reduce waste associated with the production process. Kulkarni et al. [13] also propose a framework of lean tools and work study methods, while A. Fraga proposes the use of lean tools in maintenance management [14].
3. Methodology
As a first step, in order to characterize the current situation, data from the existing tests in the system were analysed, both in terms of billing and number of occurrences. In terms of invoicing, the data report the value of the invoices issued to the customer. As for the analysis of quantities, two forms of analysis can be adopted:
I. Units referring the total number of tests carried out (Pack: aggregates several tests in the case of bicycles, where there is more than one test per process or service);
II. Number of Requests for Technical Assistance (RTAs), taken from the different laboratories database—values only reflect the number of processes carried out and respond to just one report (as in the case of bicycles). This can include: Just one test; Pack and test; Pack and different tests. To standardize the analysis across all the company’s departments, the number of RTAs created was taken into account in this initial screening. To this end, the collection process involved an analysis of the data in the information system and in the several databases. The departments targeted for analysis were as follows:
- Mobility Laboratory (LM or LV): as mentioned above, it is dedicated to testing products in the two-wheeler and soft mobility sector.
- Metrology Laboratory (LD): provides calibration services and carries out dimensional tests.
- Surfaces or Coatings Laboratory (LS): carries out tests to characterize the surfaces and coatings of materials, particularly their surface finish.
- Materials Laboratory (LE): dedicated to carrying out tests to determine the mechanical characteristics of materials.
- Products Laboratory (LP): dedicated to testing a variety of products, such as measuring noise in motor vehicles, locks, handles and many others.
- Chemical Products Laboratory (LQ): dedicated to carrying out various tests in the areas of waste water, noise and acoustics, the environment and health and safety at work.
3.1. General Data Analysis
According to the information gathered, and after checking with the heads of the different departments, it was confirmed that over the last four years the laboratory with the greatest significant weight is Mobility. On the other hand, the Metrology laboratory is the most frequent in providing services (Figure 3—Analysis of frequency and invoicing values).
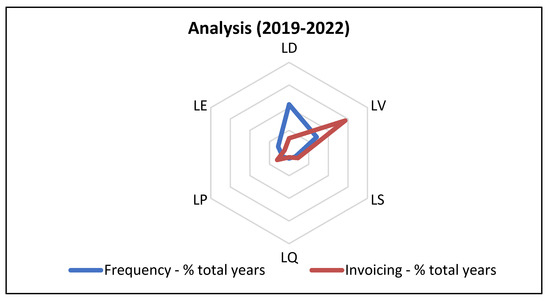
Figure 3.
Analysis of average values (period 2019–2022).
3.2. Correlation Analysis
Directing the analysis towards the Mobility Laboratory, it was considered a valid approach to analyse the correlation between two variables (invoicing and absolute frequency). For these, we considered a total of 32,525 tests (relative to the total number of tests carried out—packs) and EUR 1,778,804.70 invoiced, corresponding to data from the last four years reported by the computer system.
The graph in Figure 4 shows the linear regression Equation (1).
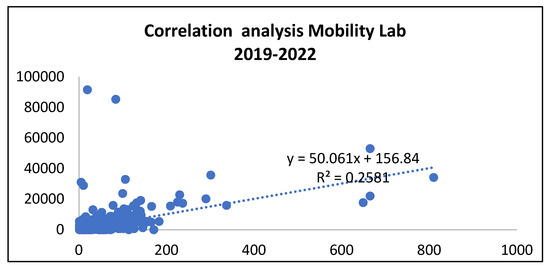
Figure 4.
Correlation analysis between absolute frequency and amount invoiced.
The linear coefficient (b) is 156.84—this means that when there are no quantities ordered (x = zero), the expected invoiced quantity (y) will be EUR 156.84. However, for this specific context, the expression does not have that practical meaning, because, if no units are ordered, no revenue is generated either.
The angular coefficient (a) is 50.061. It indicates that for each additional unit in the quantity ordered (x), the quantity invoiced (y) increases by an average of 50.061 units. Therefore, this coefficient represents the rate of change in the quantity invoiced whenever a unit is added to the quantity tested. The correlation coefficient (r) is 0.5080. This value is between −1 and 1:
- A value of 1 indicates a perfect positive correlation;
- Value 0 indicates no linear correlation;
- Value −1 indicates a perfect negative correlation.
In this case, the value of 0.5080 indicates a slightly positive and moderate correlation between the two variables. In general, this means that:
- As the quantity increases, the quantity invoiced also tends to increase;
- The relationship between the two variables is not strong, but it is still significant.
There is a moderate and positive relationship between the quantities tested and invoiced associated with the Mobility Laboratory data. So, the correlation is modest, although it is clear that there are many small orders that contribute to most of the invoicing but also some orders which are very important due to the large amounts involved. A more detailed analysis of the issue is out of the scope of the present analysis, but still this aspect is important for the laboratory, the types of tests involved and processes followed to fulfil small and large orders.
3.3. Analysis of Different Laboratories
The Mobility laboratory’s sub-families were analysed, both in terms of invoicing and frequency. It can be concluded that the tests carried out in this laboratory with the highest request and billing rates are those associated with bicycles and their components (LV.001) (Figure 5 and Figure 6).
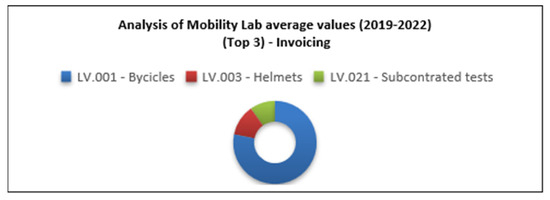
Figure 5.
Analysis of the average figures for the last three years associated with test invoicing.
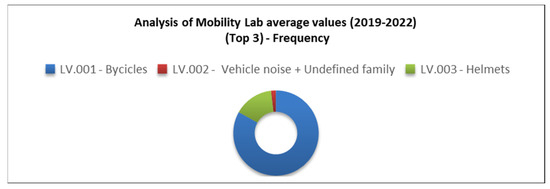
Figure 6.
Analysis of the average values of recent years associated with the frequency of tests.
It was therefore decided to focus the project on the bicycle testing department (LV.001).
3.4. Pareto’s Rule
The total number of trials recorded was 26,215, corresponding to EUR 1,272,181.03. In order to concentrate efforts on the tests that are the most relevant to the company, it we attempted to apply the 80/20 Pareto rule. Considering this practical case, the principle presented indicates that around 80% of the turnover or frequency could come from 20% of the types of tests. Accordingly, for each percentage calculated, an ABC classification was then assigned:
- Classification A: cumulative values up to 80%;
- Classification B: cumulative values between 80% and 95%;
- Classification C: cumulative values greater than 95%.
Analysis of the data (Figure 7) reveals some distinct patterns. Two main categories stand out: mountain bikes and city or touring bikes, accounting for more than 50% of the turnover. However, considering the types of bike—mountain, city or touring, EPAC and children’s—it can be seen that together they can account for more than 80% of the turnover and frequency recorded. These bicycle models stand out as being the main contributors to overall performance, in line with the Pareto principle.
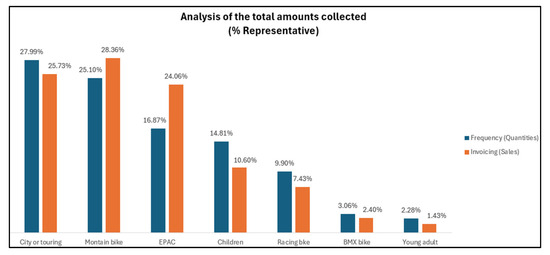
Figure 7.
Percentage analysis of the data collected by type of bicycle.
As for the type of component tested, there have been a total of 17 types of components tested over the last four years. The tests carried out on the bicycle, frame, fork, handlebars, braking system, and crank (or crenque) represent the most significant weight (around 80%), in terms of invoicing. On the other hand, regarding the “Frequency” variable, the components representing 80% of the total quantities tested are: bicycle, frame, fork, braking system, handlebars, wheels, saddle and seat post (Figure 8).
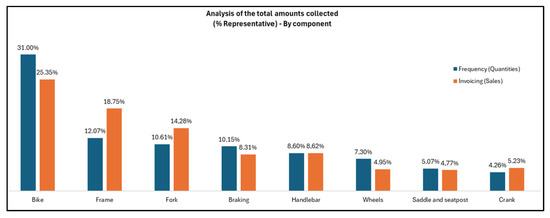
Figure 8.
Percentage analysis of the data collected by type of component (80%).
Considering the “Invoicing” variable as the decisive one, we tried to analyse tests representing 80% of the invoicing. To do this, the representative components were filtered out, resulting in the information of the tests on the complete model (EPAC bicycle), the fatigue with horizontal forces and the fatigue on the frame with pedalling forces being the “three” most representative. As this is a relatively large sample, another parallel analysis was carried out to see if the previously selected tests correspond to the most relevant ones. In this sense, the selection process went as shown in Figure 9.
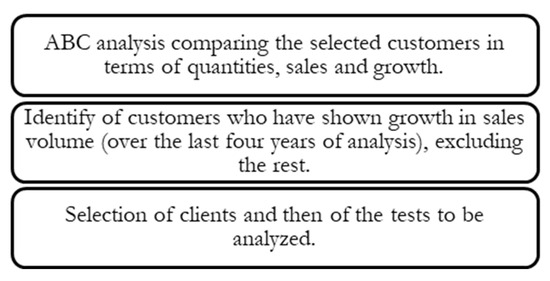
Figure 9.
Steps in customer analysis.
It was possible to see that only 44% of the customers showed an increase in sales volume over the period in question (Figure 10).
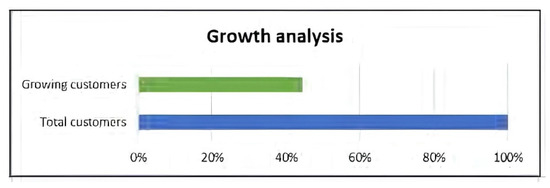
Figure 10.
Customer growth analysis (2019–2022).
In order to select the customers with satisfactory performance over the period of analysis, the Pareto theory was applied once again. Based on the variables analysed so far, it can be concluded that 13 customers will be considered in this phase. (The table is not shared, to ensure the data confidentiality.)
By focusing the analysis on these customers and carrying out a further comparative analysis between the two approaches, it is possible to conclude that:
- The figures relating to frequencies and turnover differ, in most cases, in terms of their significant importance;
- Initially, there were 32 tests representing 80% of the sales and, in a second phase, analysing by customer, there were 33 tests.
Tests on the complete model (EPAC bicycle), fatigue tests with horizontal forces and fatigue tests on the frame with pedalling forces are also among the most representative. In a meeting with the laboratory team, it was decided to focus the project on the following test: Frame: Fatigue test with Pedalling Forces. It is important to note that in the billing approach, the fatigue tests on the frame with pedalling forces represent a greater weight compared to the analysis by customers.
3.5. Study of Methods and Times
In order to get a “macro view”, it was decided to map the process associated with assembling the test bench. The related activities were monitored and then filmed, namely the assembly of the fatigue test with Pedalling Forces (on the LV93-00 bench). Below is a diagram showing, in general terms, the flow from receipt to return or disposal of the tested material (Figure 11).

Figure 11.
Overview diagram (from reception to return/disposal of tested material).
Methods and times were then studied using a video camera. This equipment made it possible to record the entire test set-up, making it easier to analyse all the operations. Another advantage is that the recorded actions can be reviewed. Five measurements were taken for the analysis.
4. Analysis and Discussion of Results
After analysing the footage, it was found that it depended from the technician who was carrying out the test, influencing the flow and identification of the activities in question. Since this is the first improvement study and it is in the company’s interest to continue with it soon, Value-Added activities (VA) are those related to testing. At the same time, Non-Value-Added activities (NVA) correspond to travel, searching for material and certain preparations considered unnecessary. It is recognized that there may be times when certain activities are an integral part of others; however, since technicians do not follow a standard flow, it is not always easy to identify the key activity in question. However, since the main objective at this point is to obtain a comprehensive overview of the current situation, it is important to document the tasks carried out. After filming and analysing the tests, it was found that around 31% of the activities carried out corresponded to Non-Value-Added (NVA) activities (Figure 12).
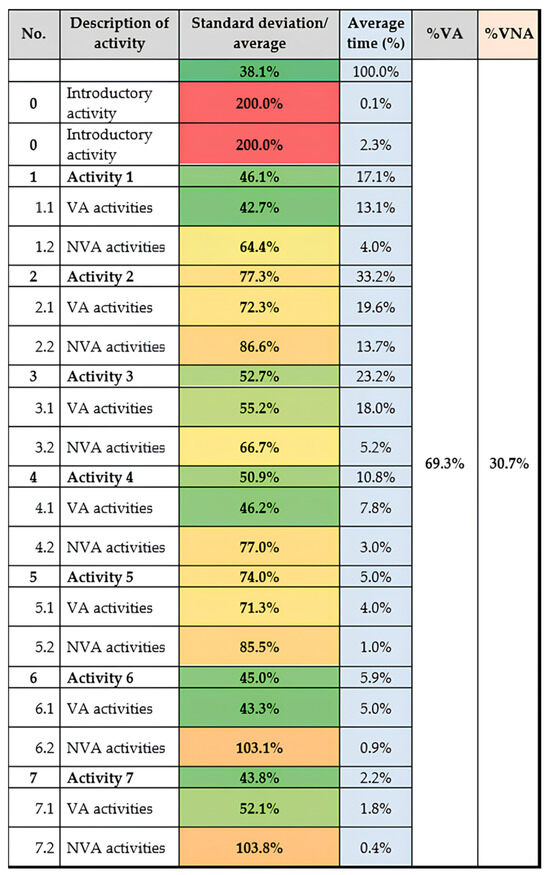
Figure 12.
Time analysis.
About the standard deviation, it is possible to identify activities with high variability. In this sense, it would be important to analyse the activities in detail and define a standard for them.
It should be noted that, to protect and preserve the confidentiality of the company’s test data, the times are broken down into percentages. Around 70% of the time is accounted for by Value-Added activities. It can also be validated that “Activity 2” corresponds to a “bottleneck”, being the most time-consuming of the whole process (Figure 12).
Figure 13 shows that the “average” time pre-defined internally (i.e., the defined Standard Time) for carrying out the operation under study is 4% of the total time process. It is important to analyse and try to evaluate how it can be balanced in relation to the others. These observations will be considered in the proposed improvement suggestions.
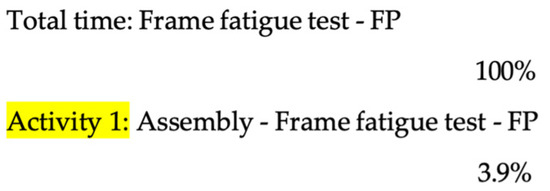
Figure 13.
“Average” time set for the test.
According to the analysis of the timed data and considering the Tolerance Factor of 20%, it can be seen that: As there is no method or approach available to analyse the average speed of the operator, in these cases, it is assumed that the cycle time is equivalent to the standard time [4].
The Standard Time for setting up the test bench should be representative of 120% of the recorded cycle time (Figure 14).

Figure 14.
Standard time calculation (%).
On average, technicians only use around 70% of the time allocated for the rehearsal. It is recognized that rehearsals do not always run smoothly; however, there is room to carry out other activities associated with the process (Figure 14).
5. Discussion
5.1. Discussion of the Methods and Results
By applying Pareto’s law, it was possible, at an early stage, to identify and prioritize the most impactful tests, directing efforts towards those with a marked effect on organizational efficiency. We decided to start with Pareto because it is a simple tool and provides important insights into the process. However, to ensure the robustness of the results, we complemented the analysis with more advanced statistical methods, such as correlation analysis to validate or clarify some of the conclusions drawn throughout the study.
Subsequently, the analysis of methods and times made it possible to identify the various activities that do not add value from the customer’s point of view, such as traveling and searching for material. Observing the footage proved to be beneficial in that it allowed for a clearer, more succinct analysis and made it possible to verify the need to establish standard works to ensure that activities are always carried out in the same sequence, regardless of the technician.
Through the research associated with the case studies, it was possible to validate that the 5S tool is undoubtedly the basis for the institutional organization. In this sense, it is recommended for the next phase that the organization defines an action plan (using one of the Lean tools, called the PDCA cycle), with the aim of promoting continuous improvement and increasing efficiency in the execution of activities. The results of this study are in line with those of previous studies, such as [5,12], which highlight the importance of this context. The suggestions proposed in this article follow the same line of thought, focusing on continuous improvement through the elimination of redundant activities and the application of Lean tools. Thus, the results obtained corroborate the idea that implementing these methodologies can lead to significant gains in operational efficiency, as evidenced in other areas of industry.
In addition, studies by authors indicate that the application of diagnostic tools, such as Pareto analysis, can be an effective strategy for identifying the main sources of inefficiency and optimizing processes [5].
One of the virtues of this diagnostic approach is that it is simple, and it was evident that the tools used provided great objectivity in the study and the results. The conclusions of this article are therefore in line with state-of-the-art best practices, contributing new proposals for the bicycle industry, specifically regarding component testing and improving operational flows.
These initiatives prepare the company for more detailed and rigorous future studies. For example, the suggestion to implement the 5S methodology comes as a response to the current investment that is needed in guaranteeing an organized, clean and safe working environment. On the other hand, the creation of a standard work for the test in question is considered crucial, as it promotes consistency in the execution of the assembly, facilitating reproducibility analyses and other improvement studies in the future. It is suggested to check the applicability of electric/pneumatic screwdrivers instead of some of the ones used, thus improving the assembly cycle time.
5.2. Importance of the Study
At this stage, it is important to establish a solid foundation that facilitates the sustainable growth of the organization and enhances its strategic and competitive position in the bicycle industry in Portugal and abroad. Until now, to the best of the author’s knowledge, there have been no published studies directly related to the optimization of bicycle frame fatigue testing processes in Portugal, which makes this study a pioneer work in the field, important to pave the way for future research in optimization of the process.
Various techniques and concepts developed by other authors in related areas have been adapted and applied in this study, establishing the theoretical basis for the application of methods to reduce waste and increase efficiency in different sectors such as this one. In addition, the application of the Pareto tool has been used successfully in various continuous improvement studies and, although this work is not based on previous (direct) research in the bicycle testing sector, it borrows effective methodologies from other industries, adapting them to the specific needs of the company in question. This is a relevant aspect, as it demonstrates the universal applicability of these techniques, regardless of the sector, and contributes to innovation in the context of the bicycle industry in Portugal and abroad. It is recommended that other organizations in the bicycle industry consider adopting similar approaches, as they have proven to be extremely effective in achieving more efficient results.
However, adopting these improvements is not without challenges. In this study, organizational obstacles were identified, such as resistance to change on the part of employees and a lack of familiarity with Lean methodologies, which can hinder progress. To overcome these challenges, strong leadership that promotes a culture of continuous improvement and innovation is essential. In addition, investment in ongoing training and the inclusion of employees in the change process are crucial to facilitate the transition to new working practices.
6. Conclusions
The current project involved a detailed analysis of the assembly process for the fatigue testing of frames with pedalling forces. The results indicate that there are significant opportunities to improve process efficiency, which could result in increased productivity and reduced operating costs. In specific terms, the suggested improvements include:
- Reducing the 31% of activities with no added value;
- Standardization of processes, ensuring consistency and efficiency;
- Improving operator satisfaction when carrying out tasks, promoting a more motivating and productive working environment.
Reflecting on the results, this study not only contributes to the improvement of processes in the specific laboratory where data were collected, but also provides valuable insights for other companies in the bicycle industry, especially in markets like Portugal, which have been experiencing significant growth in bicycle production and exports. The research demonstrates how continuous improvement tools can be applied to address industry challenges and enhance operational efficiency. Future work includes continuous monitoring of the results of applying some or all of the changes proposed. Another relevant aspect is the economic and environmental impact of the suggested improvements. Minimizing waste and optimizing processes not only increase production efficiency but also promote sustainability, thus reducing resource consumption.
Author Contributions
Conceptualization, J.T.F., G.N. and J.M.; methodology, J.T.F., J.M. and M.M.; validation, G.N., J.T.F. and M.M.; investigation, J.M. and J.A.; data curation, J.M.; writing—original draft preparation, J.M.; writing—review and editing, J.A., J.T.F. and M.M.; visualization, J.M.; supervision, J.T.F. and M.M. All authors have read and agreed to the published version of the manuscript.
Funding
This work received financial support from the Polytechnic Institute of Coimbra within the scope of Regulamento de Apoio à Publicação Científica dos Professores e Investigadores do Instituto Politécnico de Coimbra (Despacho n.° 12598/2020).
Data Availability Statement
The original contributions presented in this study are included in the article. Further inquiries can be directed to the corresponding author.
Conflicts of Interest
The authors declare no conflict of interest.
References
- Jenkins, M.; Lustosa, L.; Chia, V.; Wildish, S.; Tan, M.; Hoornweg, D.; Lloyd, M.; Dogra, S. What do we know about pedal assist E-bikes? A scoping review to inform future directions. Transp. Policy 2022, 128, 25–37. [Google Scholar] [CrossRef]
- Mordor Intelligence. Europe E-Bike Market Size & Share Analysis—Growth Trends & Forecasts Up to 2029. Available online: https://www.mordorintelligence.com/industry-reports/europe-e-bike-market (accessed on 26 November 2024).
- Eurostat. Bicycles: Trade value surged in 2022. In Bike Europe; Eurostat: Luxembourg, 2023; pp. 32–58. [Google Scholar]
- Pereira, M. Melhoria de Desempenho de Processo de Tratamento de Reclamações e Gestão de Stocks de Produto Intermédio numa Empresa do Setor Automóvel. Master’s Thesis, Universidade do Minho, Braga, Portugal, 2017. [Google Scholar]
- Pereira, A.M.; Silva, M.R.; Domingues, M.A.; Sá, J.C. Lean Six Sigma Approach to Improve the Production Process in the Mould Industry: A Case Study. Qual. Innov. Prosper. 2019, 23, 103–121. [Google Scholar] [CrossRef]
- Custódio, M. Aplicação de Metodologias Lean Para a Melhoria Contínua das Operações e Movimentação de Materiais Numa empresa Transformadora. Master’s Thesis, Instituto Superior Técnico, Lisboa, Portugal, 2013. [Google Scholar]
- Nguyen, T.; Nguyen, P. Applying Tools of Lean—Six Sigma Method in the Plastic Products Industry: A Case Study. In Proceedings of the 8th International Scientific Conference on Applying New Technology in Green Buildings, Da Nang, Vietnam, 10–11 November 2023; Volume 6, pp. 163–168. [Google Scholar] [CrossRef]
- Cheng, Y.; Lee, C.; Pornteparak, P. An improved design of an on-road bicycle frame under fatigue testing simulations. J. Chin. Inst. Eng. 2020, 43, 319–327. [Google Scholar] [CrossRef]
- Petrone, N.; Susmel, L. Biaxial testing and analysis of bicycle-welded components for the definition of a safety standard. Fatigue Fract. Eng. Mater. Struct. 2003, 26, 491–505. [Google Scholar] [CrossRef]
- Jannetti, N.A.; Lynch, L.B. Fatigue Analysis of a Bicycle Fork. Bachelor’s Thesis, Worcester Polytechnic Institute, Worcester, MA, USA, 2010. Available online: https://digital.wpi.edu/downloads/kw52j977d (accessed on 27 November 2024).
- Sousa, M.; Martins, J.; Cunha, R. “Proceedings do CLME’2008/IICEM: 5° Congresso Luso-Moçambicano de Engenharia e 2° Congresso Moçambicano de Engenharia, Maputo, 2008” [CD-ROM]; Edições INEGI: Porto, Portugal, 2008; ISBN 978-972-8826-20-8. Available online: https://repositorium.sdum.uminho.pt/handle/1822/9908 (accessed on 26 November 2024).
- Wong, Y.C.; Wong, K.Y.; Ali, A. Key Practice Areas of Lean Manufacturing. In Proceedings of the 2009 International Association of Computer Science and Information Technology, Washington, DC, USA, 17–20 April 2009. [Google Scholar] [CrossRef]
- Kulkarni, P.P.; Kshire, S.S.; Chandratre, K.V. Productivity improvement through lean deployment & work study methods. Int. J. Res. Eng. Technol. 2014, 3, 429–434. [Google Scholar] [CrossRef]
- Fraga, A.I. Aplicação das Metodologias LEAN Numa MRO (Maintenance, Repair, and Overhaul). Master’s Thesis, Instituto Superior Técnico, Lisboa, Portugal, 2014. Available online: https://fenix.tecnico.ulisboa.pt/cursos/megi/dissertacao/2353642475441 (accessed on 26 November 2024).
Disclaimer/Publisher’s Note: The statements, opinions and data contained in all publications are solely those of the individual author(s) and contributor(s) and not of MDPI and/or the editor(s). MDPI and/or the editor(s) disclaim responsibility for any injury to people or property resulting from any ideas, methods, instructions or products referred to in the content. |
© 2025 by the authors. Licensee MDPI, Basel, Switzerland. This article is an open access article distributed under the terms and conditions of the Creative Commons Attribution (CC BY) license (https://creativecommons.org/licenses/by/4.0/).