Article

Abnormal Energy Consumption Diagnosis Method of Oilfields Based on Multi-Model Ensemble Learning

1
Technical Testing Center, China Petroleum & Chemical Corporation Shengli Oilfield Branch, Dongying 257000, China
2
College of Big Data and Basic Sciences, Shandong Institute of Petroleum and Chemical Technology, Dongying 257000, China
*
Author to whom correspondence should be addressed.
Processes 2025, 13(5), 1501; https://doi.org/10.3390/pr13051501
Submission received: 13 April 2025 / Revised: 3 May 2025 / Accepted: 12 May 2025 / Published: 14 May 2025

Abstract

:
Petroleum is a significant source of global energy supply, and accurate and efficient anomaly diagnosis of energy consumption in oilfields plays a crucial role in controlling operational costs and ensuring environmental sustainability. This study utilizes daily production data from the Shengli Oilfield and applies various encoding methods to construct a dataset for diagnosing anomalies in energy consumption. We propose a method for diagnosing energy consumption anomalies based on multi-model ensemble learning, aiming to effectively reduce energy consumption and optimize oilfield management. Based on the constructed dataset, we trained an efficient and reliable anomaly diagnosis model that blurs the boundaries between classification and regression problems. The model leverages the strengths of various machine learning algorithms, including Support Vector Machines, random forest, gradient boosting, and ridge regression, while considering the analysis requirements under different computational power and real-time scenarios. Experimental results demonstrate that the mean squared error of the proposed ensemble model is 0.04, with accuracy, precision, recall, and F1 score all reaching 96%, indicating excellent performance and significantly surpassing that of individual models and benchmark algorithms. Additionally, a new iterative data cleaning model based on the multi-task random forest framework is introduced, which effectively handles missing values and anomalies, demonstrating high processing accuracy for most features. This study provides a practical framework for optimizing energy consumption management in oilfields and offers insights into broader applications in energy-intensive industries.

1. Introduction

Petroleum has played a crucial role as a significant source of global energy supply, driving economic development and sustaining modern industrial operations for many years [1]. With the continuous increase in global energy demand, oil maintains an important position in the energy consumption structure, particularly in sectors such as transportation, manufacturing, and power generation, where the irreplaceability of oil resources is evident [2,3]. Despite the rapid growth of renewable energy in recent years, petroleum remains a vital energy resource for the functioning of the global economy and is expected to continue playing a key role in the energy market for the foreseeable future [4]. Therefore, enhancing the efficiency of oil production and management is critical for ensuring the stability of global energy supply [5].
In the process of oilfield exploration and extraction, energy consumption issues remain one of the key factors influencing operational costs and environmental sustainability [6]. The extensive equipment and technologies involved in oilfield production processes, including water injection, oil extraction, oil–gas separation, and downhole operations, consume significant amounts of electricity and other energy sources. Energy consumption not only directly determines the production costs of oilfields but also exacerbates carbon emissions and environmental pollution, posing challenges to environmental protection and sustainable development. As a result, effectively reducing energy consumption while maintaining stable oilfield output has become a pressing concern for major oil companies and governments alike [7].
Traditional methods for diagnosing energy consumption anomalies primarily rely on expert experience and analyses based on physical models [8]. However, as the complexity of oilfield operations increases, traditional models often show limitations when handling complex, multi-variable, and large-scale data, making it difficult to comprehensively and accurately identify anomalies in energy consumption. In recent years, with the rapid advancement of artificial intelligence and big data technologies, AI-based models for diagnosing energy consumption anomalies have begun to demonstrate significant application potential in industrial process monitoring and fault diagnosis [9,10]. Ni et al. [11], based on data mining theory, proposed an online monitoring method for the efficiency of oilfield water injection systems and gathering and transportation systems using big data correlation and gray correlation algorithms. Zhao [12] developed an energy balance model for gathering and transmission links and major energy-consuming equipment, and based on this, created the Energy Consumption Evaluation System for a Certain Oilfield Gathering and Transportation System. Zhang et al. [13] proposed an optimized BP neural network with an adaptive differential evolution algorithm, providing decision support for fault diagnosis and energy consumption balancing in oilfield water injection systems. Bai et al. [14] optimized the production scheme to reduce energy consumption in the oilfield by combining the Particle Swarm Optimization algorithm, the injection–reservoir–production integration system, and reservoir numerical simulation. Li et al. [15] analyzed time-series data from oilfield production processes using recurrent neural networks to predict the long-term performance of oil wells. Luan et al. [16] established an energy consumption evaluation index system for oilfield water injection systems and developed an evaluation model for energy consumption influencing factors using the entropy weight–gray correlation method.
This study presents a method for diagnosing energy consumption anomalies in oilfields based on multi-model ensemble learning. By combining the strengths of various artificial intelligence models with the unique characteristics of oilfield energy consumption data, an efficient and reliable anomaly diagnosis model is developed. A new iterative data cleaning model is introduced, effectively handling missing values and anomalies, further enhancing the model’s performance. The integrated diagnostic model aggregates predictions from multiple diverse models to improve the accuracy and robustness of anomaly detection, thus facilitating more scientific and precise energy consumption management in oilfields, and reducing energy waste and operational costs. Additionally, this study employs data preprocessing techniques to handle data sources with varying dimensional scales, enabling computational analysis under different computational resource constraints and real-time requirements. The findings of this research contribute to enriching the theoretical framework of energy consumption anomaly diagnosis in oilfields and offer valuable insights for energy management in other energy-intensive industries, making it both theoretically significant and practically valuable.
The structure of the paper is as follows: Section 2 outlines the dataset preparation process and introduces the dataset designed for energy consumption anomaly diagnosis in oilfields. Section 3 provides a detailed explanation of the integrated model for anomaly diagnosis, including the parameters of the base models and the integration methods, with a focus on the newly introduced iterative data cleaning model. Section 4 presents the experiments, compares the experimental results, and evaluates the performance of the integrated model and the iterative data cleaning model. Finally, Section 5 summarizes the research findings and discusses directions for future work.

2. Dataset Preparation

2.1. Raw Data

This study collected a total of 23,860 daily production data points from oil wells across all oilfields managed by Shengli Oilfield [17], encompassing 40 features with complex types, including 11 categorical features and 29 numerical features. The raw data characteristics and the corresponding encoding processing details, which serve as the input for the subsequent model, are presented in Table 1.

2.2. Correlation Analysis

This study employs the uncertainty coefficient [18], correlation ratio [19], and Pearson correlation coefficient [20] to analyze the potential relationships among energy consumption features, aimed at gaining deeper insights into the mutual impacts of different energy consumption characteristics and their contributions to overall energy consumption. This analysis provides a scientific basis for optimizing energy management strategies.
The uncertainty coefficient is an indicator derived from information theory, used to measure the amount of information that a categorical variable provides about another categorical variable. Its calculation involves the concept of information entropy, represented by the formula U X | Y = H ( X ) H ( X | Y ) , where H X is the entropy of variable X and H X | Y is the conditional entropy given Y . The coefficient values range from 0 to 1, with larger values indicating that variable X significantly contributes information about variable Y .
The correlation ratio is an indicator based on the chi-square test, which reflects the interpretative power of a specific value of a categorical variable over the values of other categorical variables. Its calculation is performed using the chi-square statistic, represented by the formula η 2 = x 2 N , where x 2 is the chi-square value and N is the total sample size. This ratio indicates the degree of association between variables, with larger values suggesting stronger interpretative capability.
The Pearson correlation coefficient measures the linear relationship between two variables, indicating how one variable changes as the other variable varies. Its calculation is given by the formula r = σ X σ Y cov ( X , Y ) N , where cov ( X , Y ) is the covariance of X and Y , and σ X and σ Y are the standard deviations of X and Y , respectively. The coefficient ranges from −1 to 1, where −1 indicates perfect negative correlation, 0 indicates no linear correlation, and 1 indicates perfect positive correlation. This coefficient is symmetric, meaning that the correlation between any two variables is the same: r A B = r B A .
The results of the correlation analysis, derived from the aforementioned methods, are presented in Figure 1. In this figure, the color scheme plays a crucial role in differentiating the types of relationships between variables: blue indicates a positive correlation, red represents a negative correlation, and white denotes weak or negligible correlations. The figure uses geometric shapes to further distinguish between different types of variable associations. Specifically, squares represent associations between categorical variables or between categorical and numerical variables, calculated using the uncertainty coefficient and correlation ratio, while circles are used to illustrate correlations between numerical variables, computed through the Pearson correlation coefficient. For instance, CYL12H1, CYL12P1, HDL12H, and HDL12P are numerical variables, represented as circles in the diagram, and exhibit a significant positive correlation with each other. GLQ and CJDW, both categorical variables, are represented as squares and show a notable positive correlation between them. Additionally, BS, a numerical variable, and STXG, a categorical variable, are also displayed as squares in the figure, indicating a relatively strong positive correlation between these two parameters. The text labels along the axes correspond to the abbreviations of the respective features.
This study uses “electricity consumption per 100 m of liquid” as the target variable, as analyzing this metric allows for an effective assessment of the energy consumption level of oil wells. As shown in Figure 1, we were unable to successfully identify features that exhibit a strong correlation with the target variable. However, we observed a significant correlation among the total production liquid volume (12-day sum), average production liquid volume (12-day average), total power consumption (12-day sum), and average power consumption (12-day average). Additionally, there exists a strong correlation between the total oil production (12-day sum) and the average oil production (12-day average). Furthermore, based on logical reasoning, it is inferred that electricity consumption per ton of liquid and electricity consumption per ton of oil may have potential relationships with the target variable.
Consequently, we performed feature reduction on the original data and removed five feature dimensions: total production liquid volume (12-day sum), total power consumption (12-day sum), total oil production (12-day sum), electricity consumption per ton of liquid, and electricity consumption per ton of oil. This not only ensures the objectivity of the research methodology but also reduces the complexity of the model and enhances its generalization capability.

2.3. Data Preprocessing

To ensure consistency and efficiency during the model training and analysis process, we conducted data preprocessing, primarily employing two methods: encoding and missing value imputation.
In terms of encoding, this study utilized both One-Hot Encoding [21] and Label Encoding [22] for categorical features. Specifically, for unordered categories (such as factory-level units and management areas), One-Hot Encoding was applied, converting each category into separate binary features to eliminate any ordinal relationships among the features. This approach helps prevent the model from forming misleading associations. Conversely, for features with ordinal relationships or hierarchical classifications (such as permeability and pump hanging depth), Label Encoding was used to convert categories into integers, preserving potential magnitude relationships between features. For numerical features, no discretization was performed, and their original continuous distributions were retained to maintain data precision. The encoding methods employed in this study, along with their corresponding features, are presented in Table 2.
One-Hot Encoding is an encoding method that transforms categorical features into binary vectors. Suppose there is a categorical feature C with a category set { c 1 , c 2 , , c k } . When C takes the value c j , the One-Hot Encoding O can be represented as follows:
O C = 1 if   C = c j 0 otherwise ,
Label Encoding is an encoding method that maps each category of a categorical feature to a unique integer. Suppose there is a categorical feature C with a category set { c 1 , c 2 , , c k } . Label Encoding can be represented as follows:
L C = k         where   k   is   a   unique   integer   assigned   to   category   c k ,
Regarding missing value imputation, mean imputation [23] was primarily employed, performed after the encoding process. For a feature X consisting of n observations, where m values are missing, the formula for mean imputation is defined as follows:
X ¯ = 1 n m i = 1 n X i , X i missing_value ,
where X ¯ is the computed mean, n is the total number of observations for feature X , and m is the number of missing values, with X i representing the i -th observation. In the imputation of missing values, for each missing value X j (where X j is missing), it is replaced with X ¯ , thereby maintaining the overall uniformity of the dataset.

2.4. Target Variable Processing

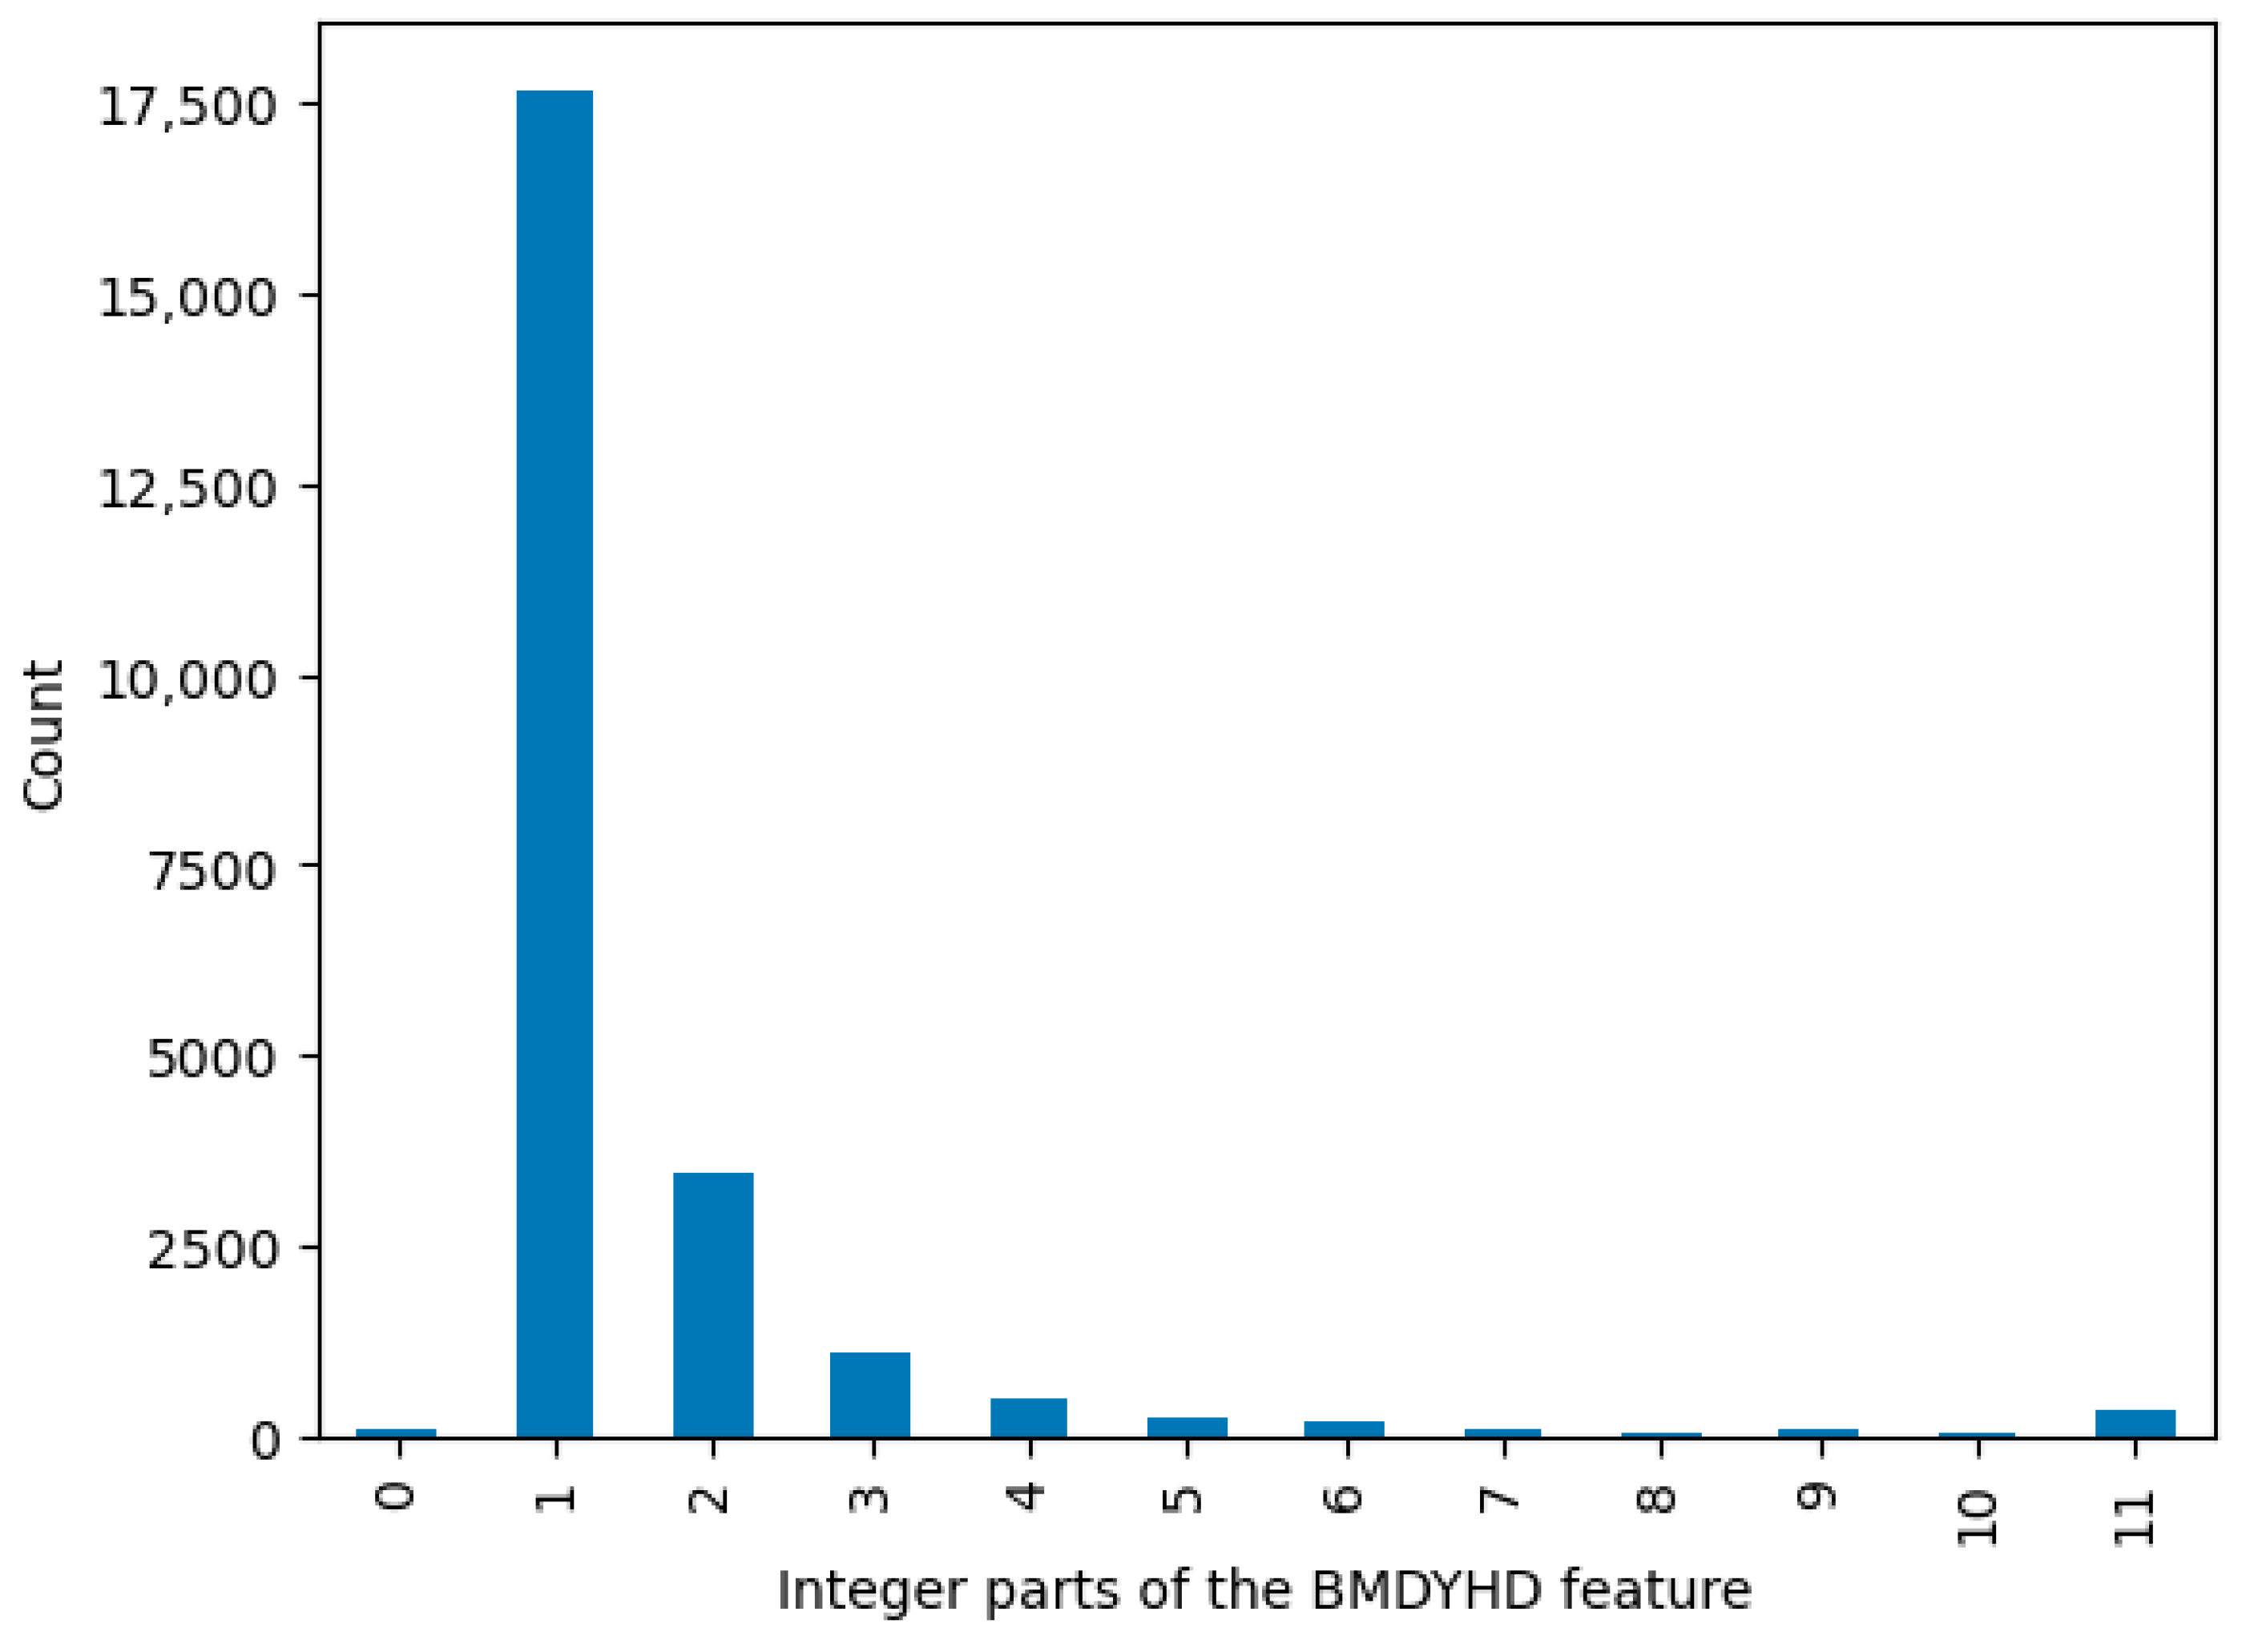
The target variable in this study, “electricity consumption per 100 m of liquid”, is a floating-point feature. The decimal values of this feature are not particularly significant for assessing energy consumption levels; therefore, we take the integer part of this value as the target variable. Based on management experience, oil wells with target variable values greater than 11 are often associated with energy consumption anomalies. Consequently, the target variable values consist of 12 categories, ranging from 0 to 11. A statistical analysis of the 23,860 data records in the original dataset was performed, and the histogram is shown in Figure 2. Given that the target variable values have an implicit order, it is not appropriate to treat them as a classification problem. Therefore, in the subsequent model design, we will still regard the problem as a regression task, with predicted regression values being calculated using rounding for matching.

2.5. Dataset

After preprocessing using the aforementioned methods, the dataset consists of a total of 168 feature columns (including the target feature column) and 23,860 records. The data are randomly split into a training set and a testing set in a 4:1 ratio, with the training set containing 19,088 records and the testing set containing 4772 records. The target variable is the integer part of “electricity consumption per 100 m of liquid”, which, after processing, includes 12 distinct values ranging from 0 to 11. The dataset can be studied from either a classification or regression perspective; however, this research focuses on the regression aspect.

3. Methods

3.1. Overall Logic

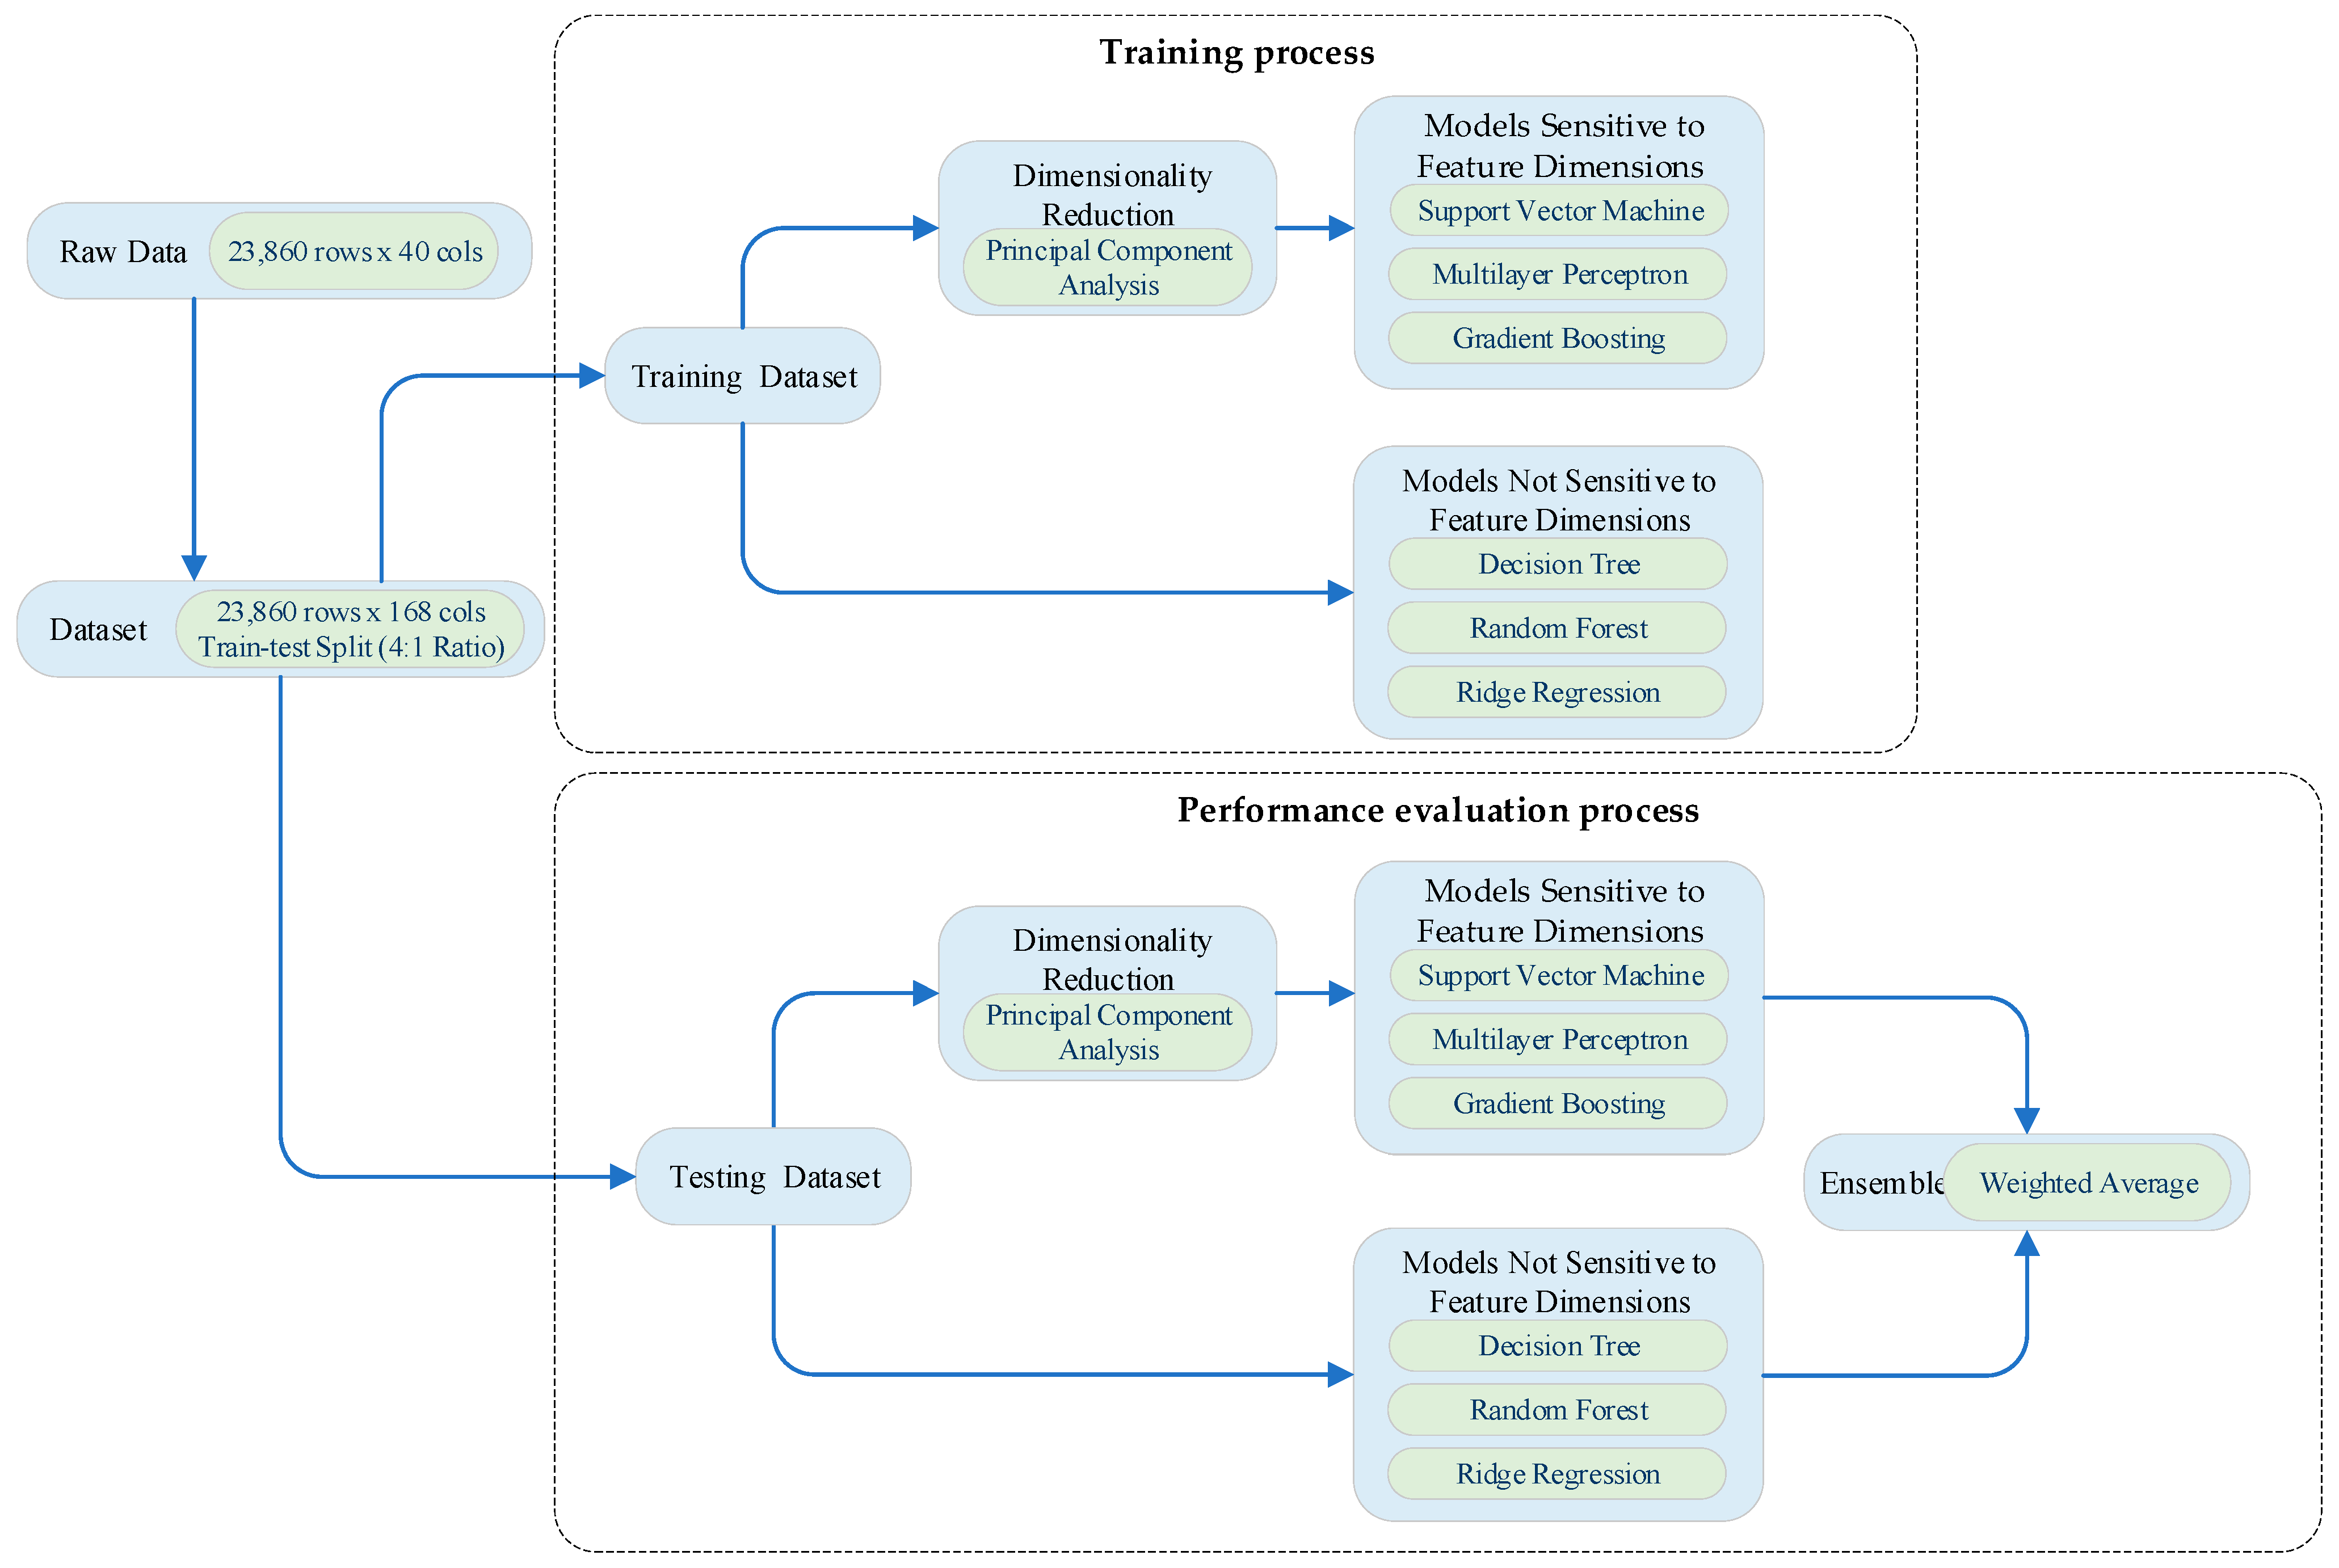
Based on comparative experiments, we selected six machine learning methods with superior performance as base regressors: Support Vector Machine (SVM) [24], Multilayer Perceptron (MLP) [25], gradient boosting [26], decision tree [27], random forest [28], and ridge regression [29]. By integrating the outputs of these models, we aim to effectively handle various features and leverage the diversity among models to enhance prediction reliability, ultimately generating a more stable and accurate prediction output. Given that different models exhibit varying sensitivities to feature dimensions, dimensionality reduction is applied to the inputs of models that are particularly sensitive to feature dimensions during the training or prediction stages to improve processing speed. As outliers and missing values may exist in the raw data, we also conducted research on a lightweight data iterative cleaning model, which is implemented based on the random forest algorithm that exhibits good performance as a single model. The overall processing flow of the proposed ensemble model is illustrated in Figure 3.

3.2. Models Sensitive to Feature Dimensions

The ensemble model includes Support Vector Machine (SVM), Multilayer Perceptron (MLP), and gradient boosting methods, all of which are sensitive to feature dimensions. The performance of these models can be significantly affected by the number and scale of the data features during training. We employed Principal Component Analysis (PCA) [30] to reduce the dimensionality of the features, thereby enhancing the training and prediction efficiency of the aforementioned models. PCA computes the principal components using the following formula:
Z = X W ,
where Z is the new feature matrix, X is the original feature matrix, and W is the loading matrix of the principal components. In this approach, we set the number of principal components n to achieve a cumulative variance retention of 95% to ensure that most of the variance information is explained.
In addition to PCA dimensionality reduction, we also utilized pipeline techniques for feature standardization (using StandardScaler) [31] during the model training process. The formula for standardization is
X = X μ σ ,
where μ and σ represent the mean and standard deviation of the feature, respectively, helping to scale the features to the same extent.
Support Vector Regression (SVR) is a regression method based on the principles of Support Vector Machine (SVM), aiming to find an optimal hyperplane such that the deviation between the predicted values and the true values is less than a given threshold ( ε ). This method is well-suited for both linear and nonlinear regression problems and can handle high-dimensional feature spaces by utilizing kernel functions. In this study, the SVR model employed a radial basis kernel as its kernel function, with the regularization parameter set to 1.0 and ε set to 1, applying a shrinkage heuristic to enhance training speed while not limiting the number of iterations.
Multilayer Perceptron Regression (MLP Regression) is a regression method based on artificial neural network principles, consisting of multiple layers of neurons, typically including an input layer, one or more hidden layers, and an output layer. MLP is trained through forward and backward propagation algorithms, aiming to minimize the error between predicted and true values. Due to its nonlinear activation functions, MLP is capable of effectively modeling complex feature relationships and excels in handling high-dimensional data. In this study, the input layer of the MLP regression model matched the number of features, with one hidden layer of 100 nodes, using the ReLU (Rectified Linear Unit) as the activation function, mean squared error as the loss function, Adam as the optimizer, a learning rate of 0.001, and a maximum iteration count set to 200.
Gradient Boosting Regression (GBR) is a regression method based on the principles of ensemble learning, which combines multiple weak regression models (typically decision trees) to progressively reduce prediction error. The core idea of gradient boosting is to update the model in each iteration based on the gradient of the prediction error, thereby improving the new model on the basis of the existing one. In this study, the gradient boosting regression model used decision trees as base learners, with the tree depth set to 3, learning rate set to 0.1, minimum sample split number and minimum leaf node number set to 2, employing mean squared error as the loss function and an iteration count set to 100.

3.3. Models Not Sensitive to Feature Dimensions

The ensemble model includes decision tree, random forest, and ridge regression methods, which are not sensitive to feature dimensions. Therefore, we directly used the standardized features of the original data for fitting, without performing dimensionality reduction as in Section 3.2; the other processing methods remained consistent and will not be reiterated here.
Decision tree regression (DTR) is a tree-structured regression method that predicts target variables by partitioning the feature space into multiple regions and constructing a tree structure. The decision tree selects the best features for node splitting based on a certain criterion (e.g., mean squared error) to minimize the prediction error at each node, ultimately forming an easily interpretable model. In this study, the depth of the decision tree regression model is limited to 3, the minimum sample split number is set to 2, and the minimum leaf node count is set to 1, utilizing mean squared error as the loss function.
Random forest regression (RFR) is an ensemble learning-based regression method that builds multiple decision trees and averages their predicted results to enhance the overall model’s accuracy and robustness. Random forest uses bootstrap sampling and random feature selection techniques to generate diverse decision trees, effectively reducing the risk of overfitting. In this study, the random forest regression model employed 100 decision trees as base regressors to ensure model generalization and stability, with no limit set on the maximum depth of each tree. The number of features randomly selected at each node (minimum feature selection number) is set to the square root of the total number of features, using mean squared error as the loss function.
Ridge regression is an improved linear regression method that adds an L2 regularization term to the ordinary least squares method, aiming to address multicollinearity issues and avoid overfitting. This method introduces a regularization parameter to balance model complexity and training error, thereby enhancing the model’s generalization performance on new data. In this study, the regularization parameter for the ridge regression model is set to 1.0, and mean squared error is utilized as the loss function.

3.4. Ensemble of Base Model Outputs

We employed a weighted averaging method for the ensemble of base model outputs [32]. The predicted values of each model are weighted according to their mean squared error performance on the testing set, with better-performing models assigned higher weights. This can be expressed by the formula:
y ^ e n s e m b l e = i = 1 n w i y ^ i i = 1 n w i ,
where y ^ e n s e m b l e represents the ensemble predicted result, w i is the weight of the i -th model, and y ^ i is the predicted value of the i -th model. Given that the target variable in the dataset is an integer while the ensemble output y ^ e n s e m b l e is a floating-point number, rounding is necessary. If the final output value exceeds 10 or differs from the observed value by 2 or more, it indicates a potential anomaly in energy consumption levels that requires manual review.

3.5. Lightweight Data Iterative Cleaning Model

To address data quality issues such as missing values and anomalies in heterogeneous datasets, this study proposes a lightweight data iterative cleaning model based on a multi-task random forest framework. The model integrates automated feature-target partitioning, dynamic model selection, and iterative error correction mechanisms, achieving efficient and intelligent data cleaning with minimal human intervention.
The iterative cleaning model adopts a multi-task learning (MTL) framework to automatically partition target and feature columns. During training, the model sequentially traverses each column in the dataset, treating the current column as the prediction target and the remaining columns as features. This process generates a series of independent prediction tasks, where the training parameters and learned patterns are shared across tasks to improve computational efficiency. For each task, the model dynamically selects the appropriate algorithm based on the data type of the target column: if the target column is of integer type (int64), a Random Forest Classifier is employed; if the target column is of floating-point type (float64), a Random Forest Regressor is utilized.
The model performs data cleaning through an iterative workflow consisting of two phases as follows.
1.
Missing Value Imputation
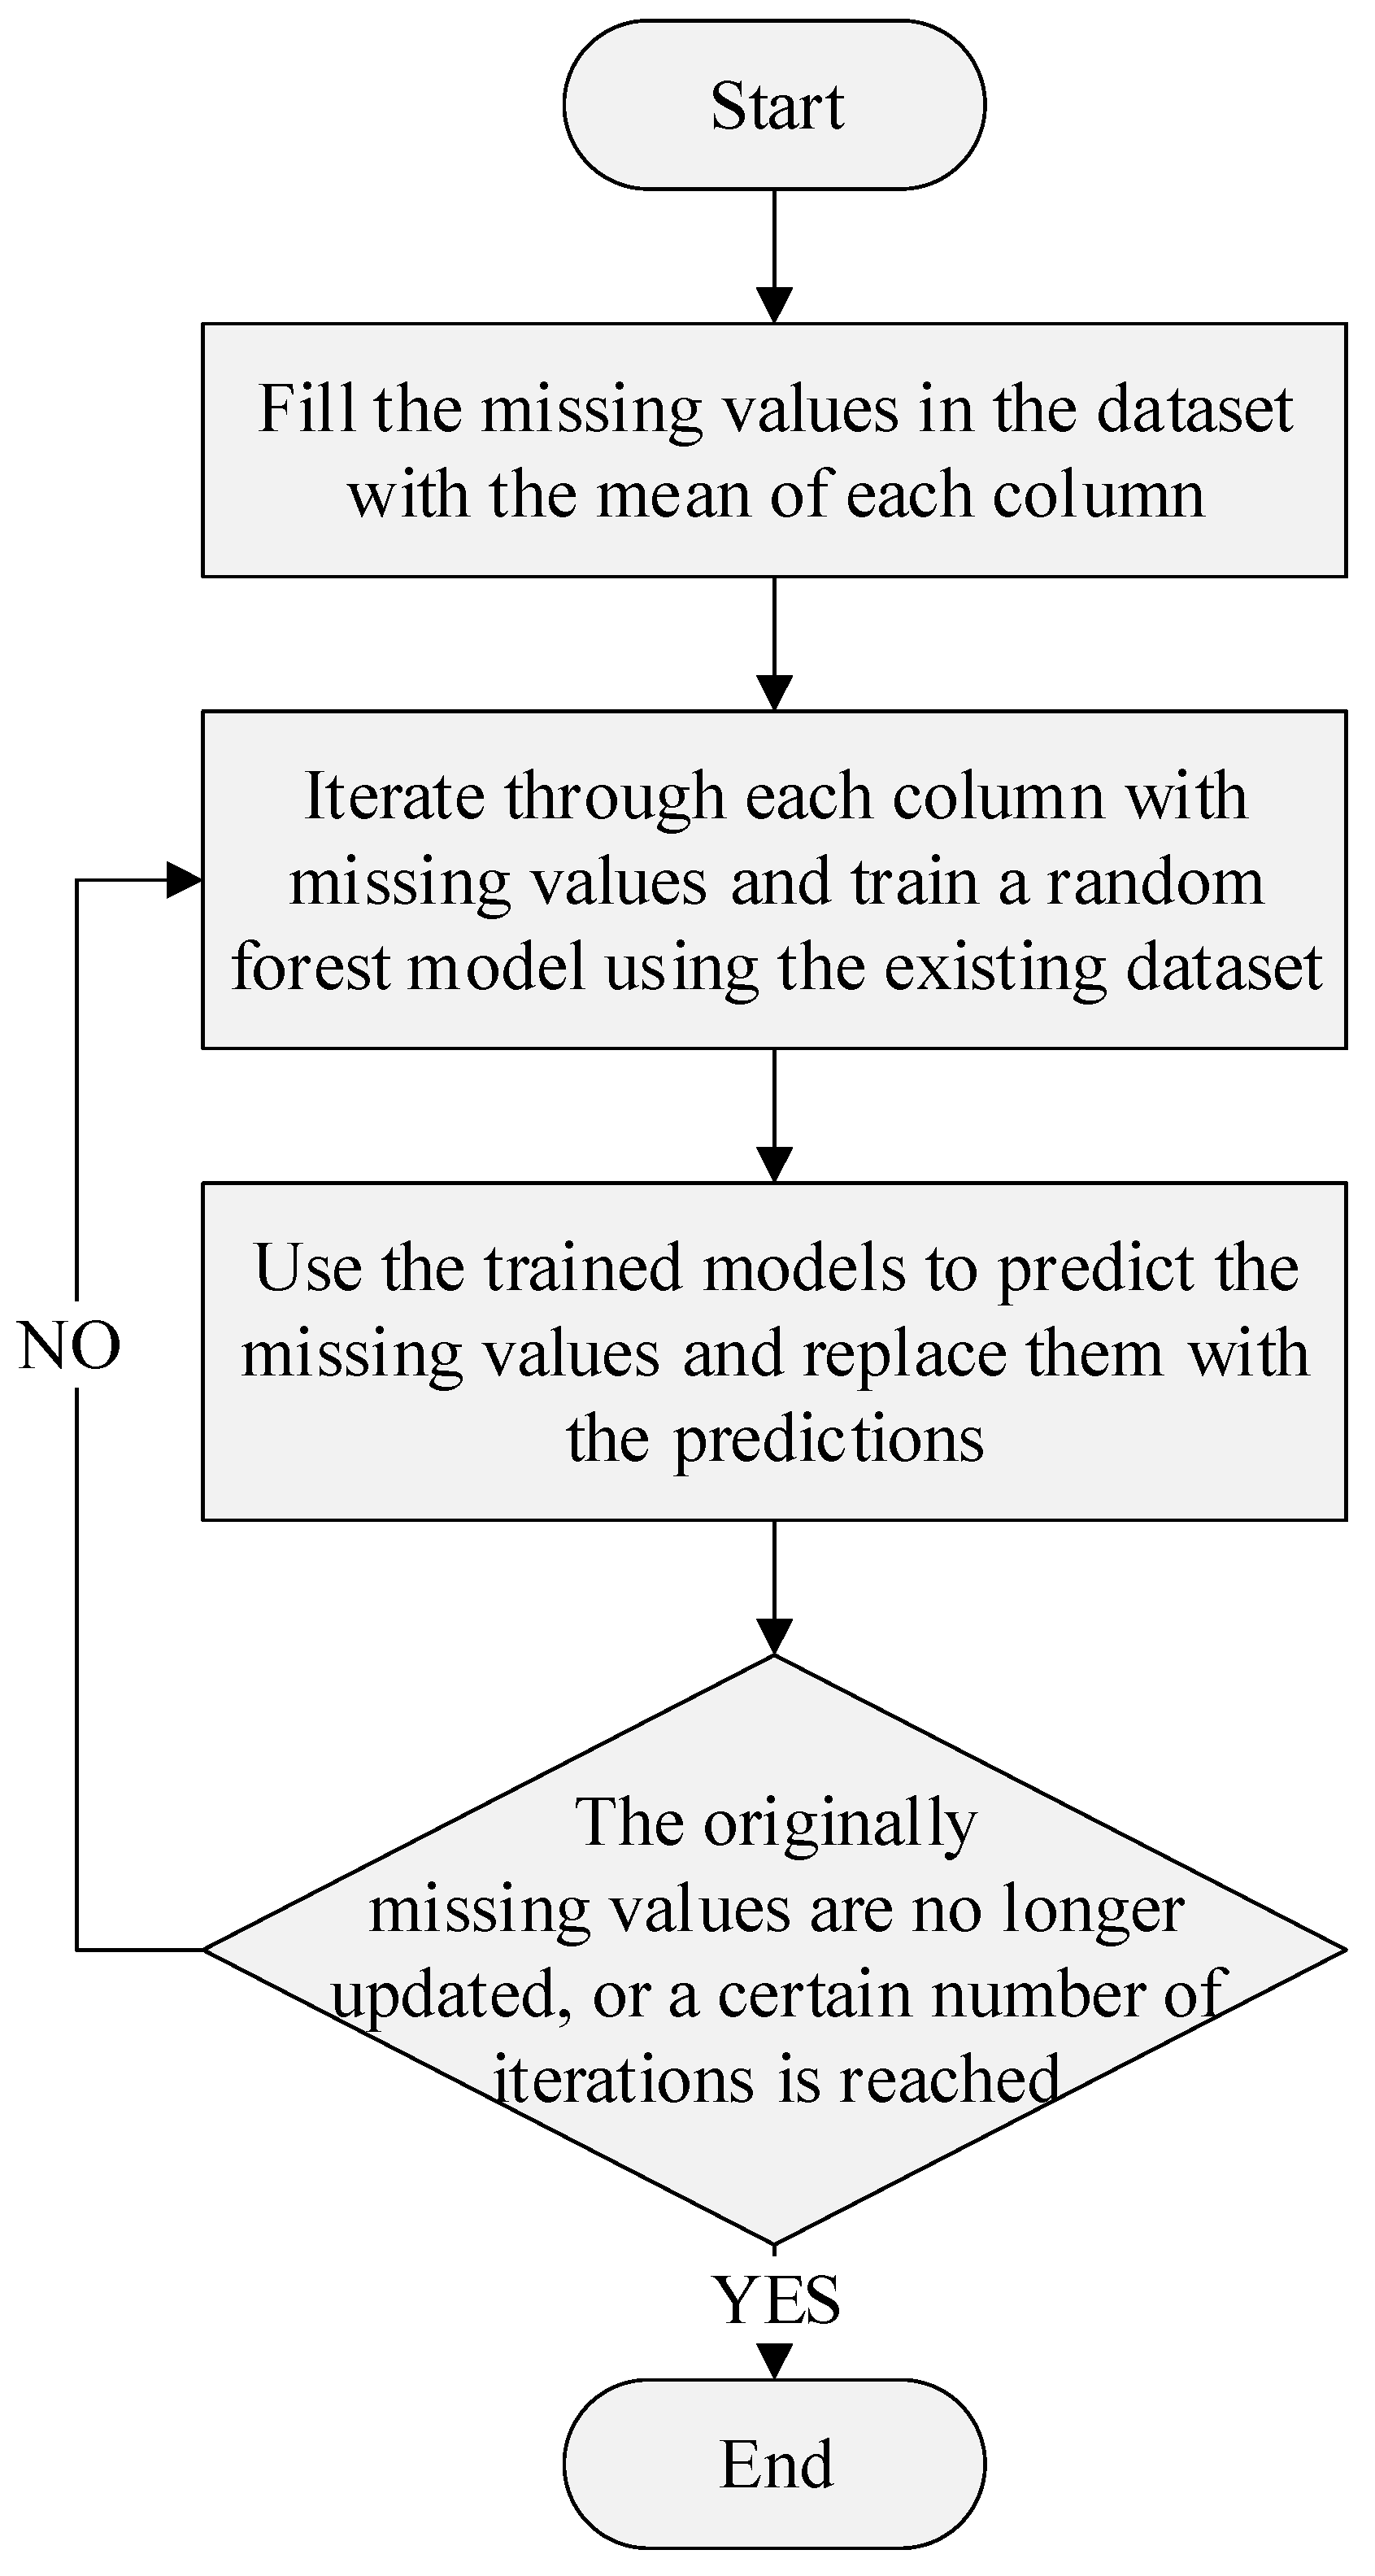
For columns with missing values, the model first initializes missing entries using mean imputation. Subsequently, it iteratively replaces these values with predictions generated by the trained random forest model. The algorithm for this process is shown as Algorithm 1, and its flowchart is illustrated in Figure 4.
Algorithm 1: Missing Value Imputation
Let D denote the original dataset, and M represent the set of columns with missing values.
Initialize D t e m p D with missing values filled by column-wise means.
For each column c M :
    Train a random forest model R F c using D t e m p (with c as the target).
    Update missing values in c using predictions from R F c .
Repeat until convergence or a predefined iteration limit is reached.
2.
Anomaly Detection and Correction
The model identifies anomalies by comparing observed values with model predictions. Let x i denote the observed value and x ^ i represent the predicted value for the i -th data point. An anomaly is flagged if
x i x ^ i > θ ,
where θ is predefined threshold. Anomalies are addressed through one of two approaches based on user-defined policies: either automatically corrected by replacing the observed value x i with the model-predicted value x ^ i , or flagged as potential outliers for subsequent manual verification. This dual mechanism ensures adaptability to diverse application scenarios, where critical data domains may prioritize human oversight, while high-throughput environments leverage automated corrections to maintain processing efficiency. The decision logic is explicitly governed by predefined thresholds θ and policy configurations, balancing reliability and operational flexibility in the cleaning workflow.

4. Experimental and Result Analysis

4.1. Experimental Environment

The experimental environment for this study consisted of the following hardware specifications: the CPU is an Intel Core i7-14700K processor with a base frequency of 3.40 GHz, 64 GB DDR4 memory, a 1 TB SSD, and an Nvidia RTX 3090 GPU. The software environment includes Python 3.11, with dependencies on scientific computing libraries such as NumPy 1.26 [33], Pandas 2.0 [34], Scikit-learn 1.2 [35], and Matplotlib 3.7 [34].

4.2. Anomaly Diagnosis Evaluation Metrics

Regression algorithms were employed for predictions, with initial values evaluated using Mean Square Error [36]. After processing the model’s predicted results as outlined in Section 3.4, both the target feature and predicted results are integers, allowing the problem to be treated as a 12-class classification issue. The evaluation metrics designed include accuracy, precision, recall, and F1 score for performance assessment [37].
Mean Square Error (MSE) is a widely used evaluation metric in regression analysis, measuring the difference between predicted values and true values. It is derived by calculating the average of the squared differences between the predicted values and the actual values, used to assess the accuracy and stability of the model. The formula for MSE is
M S E = 1 n i = 1 n y i y ^ i 2 ,
where n is the total number of samples, y i is the true value of the i -th sample, and y ^ i is the predicted value of the i -th sample.
Accuracy (A) is defined as the proportion of correctly predicted samples to the total number of samples. It serves as an intuitive metric; however, it may be affected in cases of class imbalance, particularly when the number of negative samples significantly exceeds that of positive samples. The formula for accuracy is
A = T P + T N T P + T N + F P + F N ,
where T P (True Positive) is the number of samples correctly predicted as positive, T N (True Negative) is the number of samples correctly predicted as negative, F P (False Positive) is the number of samples incorrectly predicted as positive, and F N (False Negative) is the number of samples incorrectly predicted as negative.
Precision (P) refers to the proportion of actual positive samples among all samples predicted as positive. It is particularly useful when minimizing false positive predictions is a concern. The formula for precision is
P = T P T P + F P ,
Recall (R), also known as True Positive Rate, refers to the proportion of correctly predicted positive samples among all actual positive samples. It is applicable in scenarios where minimizing false negative predictions is crucial. The formula for recall is
R = T P T P + F N ,
The F1 score is the harmonic mean of precision and recall, considering the balance between them. It serves as a comprehensive metric, especially suitable for imbalanced classes; a higher F1 score indicates better overall model performance. The formula for the F1 score is
F 1 = 2 P R P + R ,

4.3. Data Cleaning Evaluation Metrics

To comprehensively evaluate the performance of the lightweight iterative cleaning model, tailored metrics are employed based on the data type of each column. For integer-type features processed by the Random Forest Classifier, accuracy (as defined in (9)) is adopted to measure the proportion of correctly classified instances. For floating-point features handled by the Random Forest Regressor, the R2 Score (coefficient of determination) [38] quantifies the regression model’s goodness of fit. The R2 Score reflects the correlation between predicted values and ground truth observations, calculated as follows:
R 2 = 1 S S r e s S S t o t ,
where S S r e s = y i y ^ i 2 denotes the residual sum of squares (RSS), representing the squared differences between actual observations y i and model predictions y ^ i . S S r e s = y i y ^ i 2 is the total sum of squares (TSS), measuring the variance of the actual values relative to their mean y ¯ .
The R2 Score provides interpretable insights into model performance:
  • R2 = 1: Indicates a perfect fit, where predictions exactly match the observed values.
  • R2 = 0: Suggests the model performs no better than a naive baseline that always predicts the mean value.
  • R2 < 0: Implies severe model inadequacy, where predictions are worse than using the mean value, often signaling overfitting, underfitting, or data-process mismatches.

4.4. Anomaly Diagnosis Experimental Result Analysis

This study conducted performance experiments on the proposed base models and the ensemble model, while also including a reasonable number of comparison algorithms. In addition to the evaluation metrics listed in Section 4.2, training time (Training Time, TT) and prediction time (Prediction Time, PT) were also statistically compared (measured in seconds). The experimental results are shown in Table 3. It is important to note that the identical A and R values for each model in Table 3 are due to the significant data imbalance present in the dataset (as shown in Figure 2).
As shown in Table 3, the performance of the base models generally outperforms that of the comparison algorithms. Models that did not undergo PCA dimensionality reduction (i.e., those not sensitive to dimensions) slightly outperformed those that did. Among the base models, the random forest model exhibited exceptional performance in metrics such as MSE, A, P, R, and F1 score, particularly with an MSE value of only 0.11, demonstrating high accuracy in modeling this dataset. Although its training time is relatively long (28.14 s), its prediction time is considerably short (0.033 s); therefore, the random forest model can be chosen when there is a high demand for prediction speed without excessive pursuit of optimal performance.
Compared to individual models, the ensemble model shows better performance and generalization capability, indicating that combining multiple models for prediction can effectively reduce the bias and variance that may exist in a single model, resulting in more stable and accurate predictions.

4.5. Data Cleaning Experimental Result Analysis

The proposed lightweight data iterative cleaning model demonstrates robust performance, as evidenced by the experimental results in Table 4.
An analysis of the experimental results reveals that the proposed model demonstrates high accuracy across most categorical and numerical features, validating its ability to effectively detect and correct anomalies while imputing missing values. Despite its overall strong performance, the model exhibits limitations in certain scenarios. For instance, the columns YYMD and 50DLND yield exceptionally low R2 values (0.1 and 0.12, respectively), likely due to nonlinear relationships or insufficient feature correlation in the training data. To avoid introducing systematic errors, the model disables automatic anomaly correction for these columns and instead applies mean imputation or domain-specific manual intervention. To further assess the method’s effectiveness, a dataset of 1260 records was extracted from a real-world production environment, with 1208 entries randomly missing. The program was used to impute the missing data. For categorical data, 367 missing entries were identified, and 337 were successfully imputed, achieving an accuracy rate of 91.82%. For numerical data, 841 missing entries were addressed, with imputed values deemed correct if the absolute error was less than 2 or the relative error was below 10%, resulting in an imputation accuracy of 87.99%.

5. Conclusions

This study focuses on the method of energy consumption anomaly diagnosis in oilfields based on multi-model ensemble learning, with the aim of improving energy management efficiency in the oil extraction process. Petroleum plays a significant role in the global economy and energy structure, and energy consumption issues in oilfields have a major impact on production costs and environmental protection. During the research process, we compiled 23,860 daily production records from Shengli Oilfield and prepared a dataset through feature selection and correlation analysis, which meets various computational and real-time requirements. By applying different encoding methods and Principal Component Analysis for dimensionality reduction, we optimized the model’s input features, laying a solid foundation for model training. We compared the performance of various machine learning models, completed algorithm selection, and trained the models to ensure that the proposed ensemble model could fully leverage the advantages of different algorithms. The experimental results indicate that the ensemble model excels in accuracy, recall, and F1 score, validating the effectiveness of multi-model ensemble methods in handling complex problems and efficiently and accurately completing energy consumption anomaly diagnosis tasks in oilfields. Additionally, the newly introduced iterative data cleaning model demonstrates good performance in handling missing values and anomalies, with high processing accuracy for most features. Although there are limitations in certain features, reasonable strategies can effectively prevent the introduction of systematic errors.
In conclusion, this proposed method’s ability to provide reliable energy consumption diagnosis not only contributes to optimized oilfield management but also has broader implications for energy management in other industrial sectors. It also offers valuable insights for energy management in other industries. In the future, we plan to further apply this ensemble model to other energy-intensive industries, promoting widespread optimization in energy management and continuously exploring more efficient energy management strategies and technologies to support the sustainable development of global energy.

Author Contributions

Conceptualization, W.L. and X.W.; methodology, W.L., Q.S. and X.D.; software, X.W. and Q.S.; validation, W.L., S.L. and G.W.; formal analysis, X.W.; investigation, S.L.; resources, X.D.; data curation, Y.L.; writing—original draft preparation, W.L.; writing—review and editing, S.L.; visualization, G.W.; supervision, W.L.; project administration, W.L.; funding acquisition, X.W. All authors have read and agreed to the published version of the manuscript.

Funding

This research was funded by the Shengli Oilfield Branch, grant number YKJ2308, titled “Research on Energy Efficiency Analysis and Evaluation Technology Based on Energy Management Platform”, and its associated project “Research on Intelligent Diagnosis and Analysis Technology for Abnormal Energy Consumption in Oilfields, grant number 30200022-24-ZC0699-0025”, as well as a research project from Shandong Institute of Petroleum and Chemical Technology, project number 2025HKJ0006.

Data Availability Statement

The original contributions presented in this study are included in the article. Further inquiries can be directed to the corresponding author.

Conflicts of Interest

Authors Wei Li, Xinyan Wang, Qingbo Sheng, Shaopeng Liu, Guangyi Wan, Yunfei Li were employed by the company China Petroleum & Chemical Corporation Shengli Oilfield Branch. The remaining author declare that the research was conducted in the absence of any commercial or financial relationships that could be construed as a potential conflict of interest. The company had no role in the design of the study; in the collection, analyses, or interpretation of data; in the writing of the manuscript, or in the decision to publish the results.

References

  1. Elsayed, A.H.; Hammoudeh, S.; Sousa, R.M. Inflation Synchronization among the G7and China: The Important Role of Oil Inflation. Energy Econ. 2021, 100, 105332. [Google Scholar] [CrossRef]
  2. Chen, S.-Y.; Zhang, Q.; Mclellan, B.; Zhang, T.-T. Review on the Petroleum Market in China: History, Challenges and Prospects. Pet. Sci. 2020, 17, 1779–1794. [Google Scholar] [CrossRef]
  3. Hong, J.; Wang, Z.; Wang, C.; Zhang, J.; Liu, W.; Ling, K. Modeling of Multiphase Flow with the Wellbore in Gas-Condensate Reservoirs Under High Gas/Liquid Ratio Conditions and Field Application. SPE J. 2025, 30, 1301–1314. [Google Scholar] [CrossRef]
  4. Acevedo, R.A.; Lorca-Susino, M. The European Union Oil Dependency: A Threat to Economic Growth and Diplomatic Freedom. Int. J. Energy Sect. Manag. 2021, 15, 987–1006. [Google Scholar] [CrossRef]
  5. Brandt, A.R. Oil Depletion and the Energy Efficiency of Oil Production: The Case of California. Sustainability 2011, 3, 1833–1854. [Google Scholar] [CrossRef]
  6. Yessengaliyev, D.A.; Zhumagaliyev, Y.U.; Tazhibayev, A.A.; Bekbossynov, Z.A.; Sarkulova, Z.S.; Issengaliyeva, G.A.; Zhubandykova, Z.U.; Semenikhin, V.V.; Yeskalina, K.T.; Ansapov, A.E. Energy Efficiency Trends in Petroleum Extraction: A Bibliometric Study. Energies 2024, 17, 2869. [Google Scholar] [CrossRef]
  7. Chen, X.; Wang, M.; Wang, B.; Hao, H.; Shi, H.; Wu, Z.; Chen, J.; Gai, L.; Tao, H.; Zhu, B.; et al. Energy Consumption Reduction and Sustainable Development for Oil & Gas Transport and Storage Engineering. Energies 2023, 16, 1775. [Google Scholar] [CrossRef]
  8. Bing, S.; Zhao, W.; Li, Z.; Xiao, W.; Lv, Q.; Hou, C. Global Optimization Method of Energy Consumption in Oilfield Waterflooding System. Pet. Geol. Recovery Effic. 2019, 26, 102–106. [Google Scholar] [CrossRef]
  9. Solanki, P.; Baldaniya, D.; Jogani, D.; Chaudhary, B.; Shah, M.; Kshirsagar, A. Artificial Intelligence: New Age of Transformation in Petroleum Upstream. Pet. Res. 2022, 7, 106–114. [Google Scholar] [CrossRef]
  10. Dong, X.; Han, S.; Wang, A.; Shang, K. Online Inertial Machine Learning for Sensor Array Long-Term Drift Compensation. Chemosensors 2021, 9, 353. [Google Scholar] [CrossRef]
  11. Ni, P.; Lv, P.; Sun, W. Application of Energy Saving and Consumption Reduction Measures in Oil Field Based on Big Data Mining Theory. In Proceedings of the International Field Exploration and Development Conference 2022; Lin, J., Ed.; Springer Nature: Singapore, 2023; pp. 7147–7154. [Google Scholar]
  12. Zhao, J. Research and Application of Oil and Gas Gathering and Transportation Data Acquisition and Energy Consumption Monitoring System Based on Internet of Things. In Proceedings of the International Field Exploration and Development Conference 2022; Lin, J., Ed.; Springer Nature: Singapore, 2023; pp. 7016–7029. [Google Scholar]
  13. Research on Intelligent Diagnosis and Decision-Making Method for Oilfield Water Injection System Faults|IEEE Journals & Magazine|IEEE Xplore. Available online: https://ieeexplore.ieee.org/abstract/document/10637453 (accessed on 16 November 2024).
  14. Bai, Y.; Hou, J.; Liu, Y.; Zhao, D.; Bing, S.; Xiao, W.; Zhao, W. Energy-Consumption Calculation and Optimization Method of Integrated System of Injection-Reservoir-Production in High Water-Cut Reservoir. Energy 2022, 239, 121961. [Google Scholar] [CrossRef]
  15. Li, Y.; Sun, R.; Horne, R. Deep Learning for Well Data History Analysis. In Proceedings of the SPE Annual Technical Conference and Exhibition, Calgary, AB, Canada, 23 September 2019. [Google Scholar]
  16. Yan, R.; Tong, W.; Jiaona, C.; Alteraz, H.A.; Mohamed, H.M. Evaluation of Factors Influencing Energy Consumption in Water Injection System Based on Entropy Weight-Grey Correlation Method. Appl. Math. Nonlinear Sci. 2021, 6, 269–280. [Google Scholar] [CrossRef]
  17. Lv, G.; Li, Q.; Wang, S.; Li, X. Key Techniques of Reservoir Engineering and Injection–Production Process for CO2 Flooding in China’s SINOPEC Shengli Oilfield. J. CO2 Util. 2015, 11, 31–40. [Google Scholar] [CrossRef]
  18. Kessel, R.; Kacker, R.; Berglund, M. Coefficient of Contribution to the Combined Standard Uncertainty. Metrologia 2006, 43, S189. [Google Scholar] [CrossRef]
  19. Roche, A.; Malandain, G.; Pennec, X.; Ayache, N. The Correlation Ratio as a New Similarity Measure for Multimodal Image Registration. In Proceedings of the Medical Image Computing and Computer-Assisted Intervention—MICCAI’98, Cambridge, MA, USA, 11–13 October 1998; Wells, W.M., Colchester, A., Delp, S., Eds.; Springer: Berlin/Heidelberg, Germany, 1998; pp. 1115–1124. [Google Scholar]
  20. Sedgwick, P. Pearson’s Correlation Coefficient. BMJ 2012, 345, e4483. [Google Scholar] [CrossRef]
  21. Rodríguez, P.; Bautista, M.A.; Gonzàlez, J.; Escalera, S. Beyond One-Hot Encoding: Lower Dimensional Target Embedding. Image Vis. Comput. 2018, 75, 21–31. [Google Scholar] [CrossRef]
  22. Jia, B.-B.; Zhang, M.-L. Multi-Dimensional Classification via Sparse Label Encoding. In Proceedings of the 38th International Conference on Machine Learning, PMLR, Virtual, 18–24 July 2021; pp. 4917–4926. [Google Scholar]
  23. Donders, A.R.T.; van der Heijden, G.J.M.G.; Stijnen, T.; Moons, K.G.M. Review: A Gentle Introduction to Imputation of Missing Values. J. Clin. Epidemiol. 2006, 59, 1087–1091. [Google Scholar] [CrossRef]
  24. Suthaharan, S. Support Vector Machine. In Machine Learning Models and Algorithms for Big Data Classification: Thinking with Examples for Effective Learning; Suthaharan, S., Ed.; Springer: Boston, MA, USA, 2016; pp. 207–235. ISBN 978-1-4899-7641-3. [Google Scholar]
  25. Ramchoun, H.; Ghanou, Y.; Ettaouil, M.; Janati Idrissi, M.A. Multilayer Perceptron: Architecture Optimization and Training. Int. J. Interact. Multimed. Artif. Intell. 2016, 4, 26–30. [Google Scholar] [CrossRef]
  26. Bentéjac, C.; Csörgő, A.; Martínez-Muñoz, G. A Comparative Analysis of Gradient Boosting Algorithms. Artif. Intell. Rev. 2021, 54, 1937–1967. [Google Scholar] [CrossRef]
  27. Myles, A.J.; Feudale, R.N.; Liu, Y.; Woody, N.A.; Brown, S.D. An Introduction to Decision Tree Modeling. J. Chemom. 2004, 18, 275–285. [Google Scholar] [CrossRef]
  28. Belgiu, M.; Drăguţ, L. Random Forest in Remote Sensing: A Review of Applications and Future Directions. ISPRS J. Photogramm. Remote Sens. 2016, 114, 24–31. [Google Scholar] [CrossRef]
  29. Arashi, M.; Roozbeh, M.; Hamzah, N.A.; Gasparini, M. Ridge Regression and Its Applications in Genetic Studies. PLoS ONE 2021, 16, e0245376. [Google Scholar] [CrossRef]
  30. Beattie, J.R.; Esmonde-White, F.W.L. Exploration of Principal Component Analysis: Deriving Principal Component Analysis Visually Using Spectra. Appl. Spectrosc. 2021, 75, 361–375. [Google Scholar] [CrossRef]
  31. Aldi, F.; Hadi, F.; Rahmi, N.A.; Defit, S. Standardscaler’s Potential in Enhancing Breast Cancer Accuracy Using Machine Learning. J. Appl. Eng. Technol. Sci. (JAETS) 2023, 5, 401–413. [Google Scholar] [CrossRef]
  32. Dong, X.; Yu, Z.; Cao, W.; Shi, Y.; Ma, Q. A Survey on Ensemble Learning. Front. Comput. Sci. 2020, 14, 241–258. [Google Scholar] [CrossRef]
  33. Harris, C.R.; Millman, K.J.; van der Walt, S.J.; Gommers, R.; Virtanen, P.; Cournapeau, D.; Wieser, E.; Taylor, J.; Berg, S.; Smith, N.J.; et al. Array Programming with NumPy. Nature 2020, 585, 357–362. [Google Scholar] [CrossRef]
  34. Lemenkova, P. Python Libraries Matplotlib, Seaborn and Pandas for Visualization Geo-Spatial Datasets Generated by QGIS. Analele Stiintifice Ale Univ. “Alexandru Ioan Cuza" Din Iasi-Ser. Geogr. 2020, 1, 13–32. [Google Scholar]
  35. Tran, M.-K.; Panchal, S.; Chauhan, V.; Brahmbhatt, N.; Mevawalla, A.; Fraser, R.; Fowler, M. Python-Based Scikit-Learn Machine Learning Models for Thermal and Electrical Performance Prediction of High-Capacity Lithium-Ion Battery. Int. J. Energy Res. 2022, 46, 786–794. [Google Scholar] [CrossRef]
  36. Hodson, T.O. Root-Mean-Square Error (RMSE) or Mean Absolute Error (MAE): When to Use Them or Not. Geosci. Model Dev. 2022, 15, 5481–5487. [Google Scholar] [CrossRef]
  37. Dong, X.; Li, J.; Chang, Q.; Miao, S.; Wan, H. Data Fusion and Models Integration for Enhanced Semantic Segmentation in Remote Sensing. IEEE J. Sel. Top. Appl. Earth Obs. Remote Sens. 2025, 18, 7134–7151. [Google Scholar] [CrossRef]
  38. Nakagawa, S.; Johnson, P.C.D.; Schielzeth, H. The Coefficient of Determination R2 and Intra-Class Correlation Coefficient from Generalized Linear Mixed-Effects Models Revisited and Expanded. J. R. Soc. Interface 2017, 14, 20170213. [Google Scholar] [CrossRef]
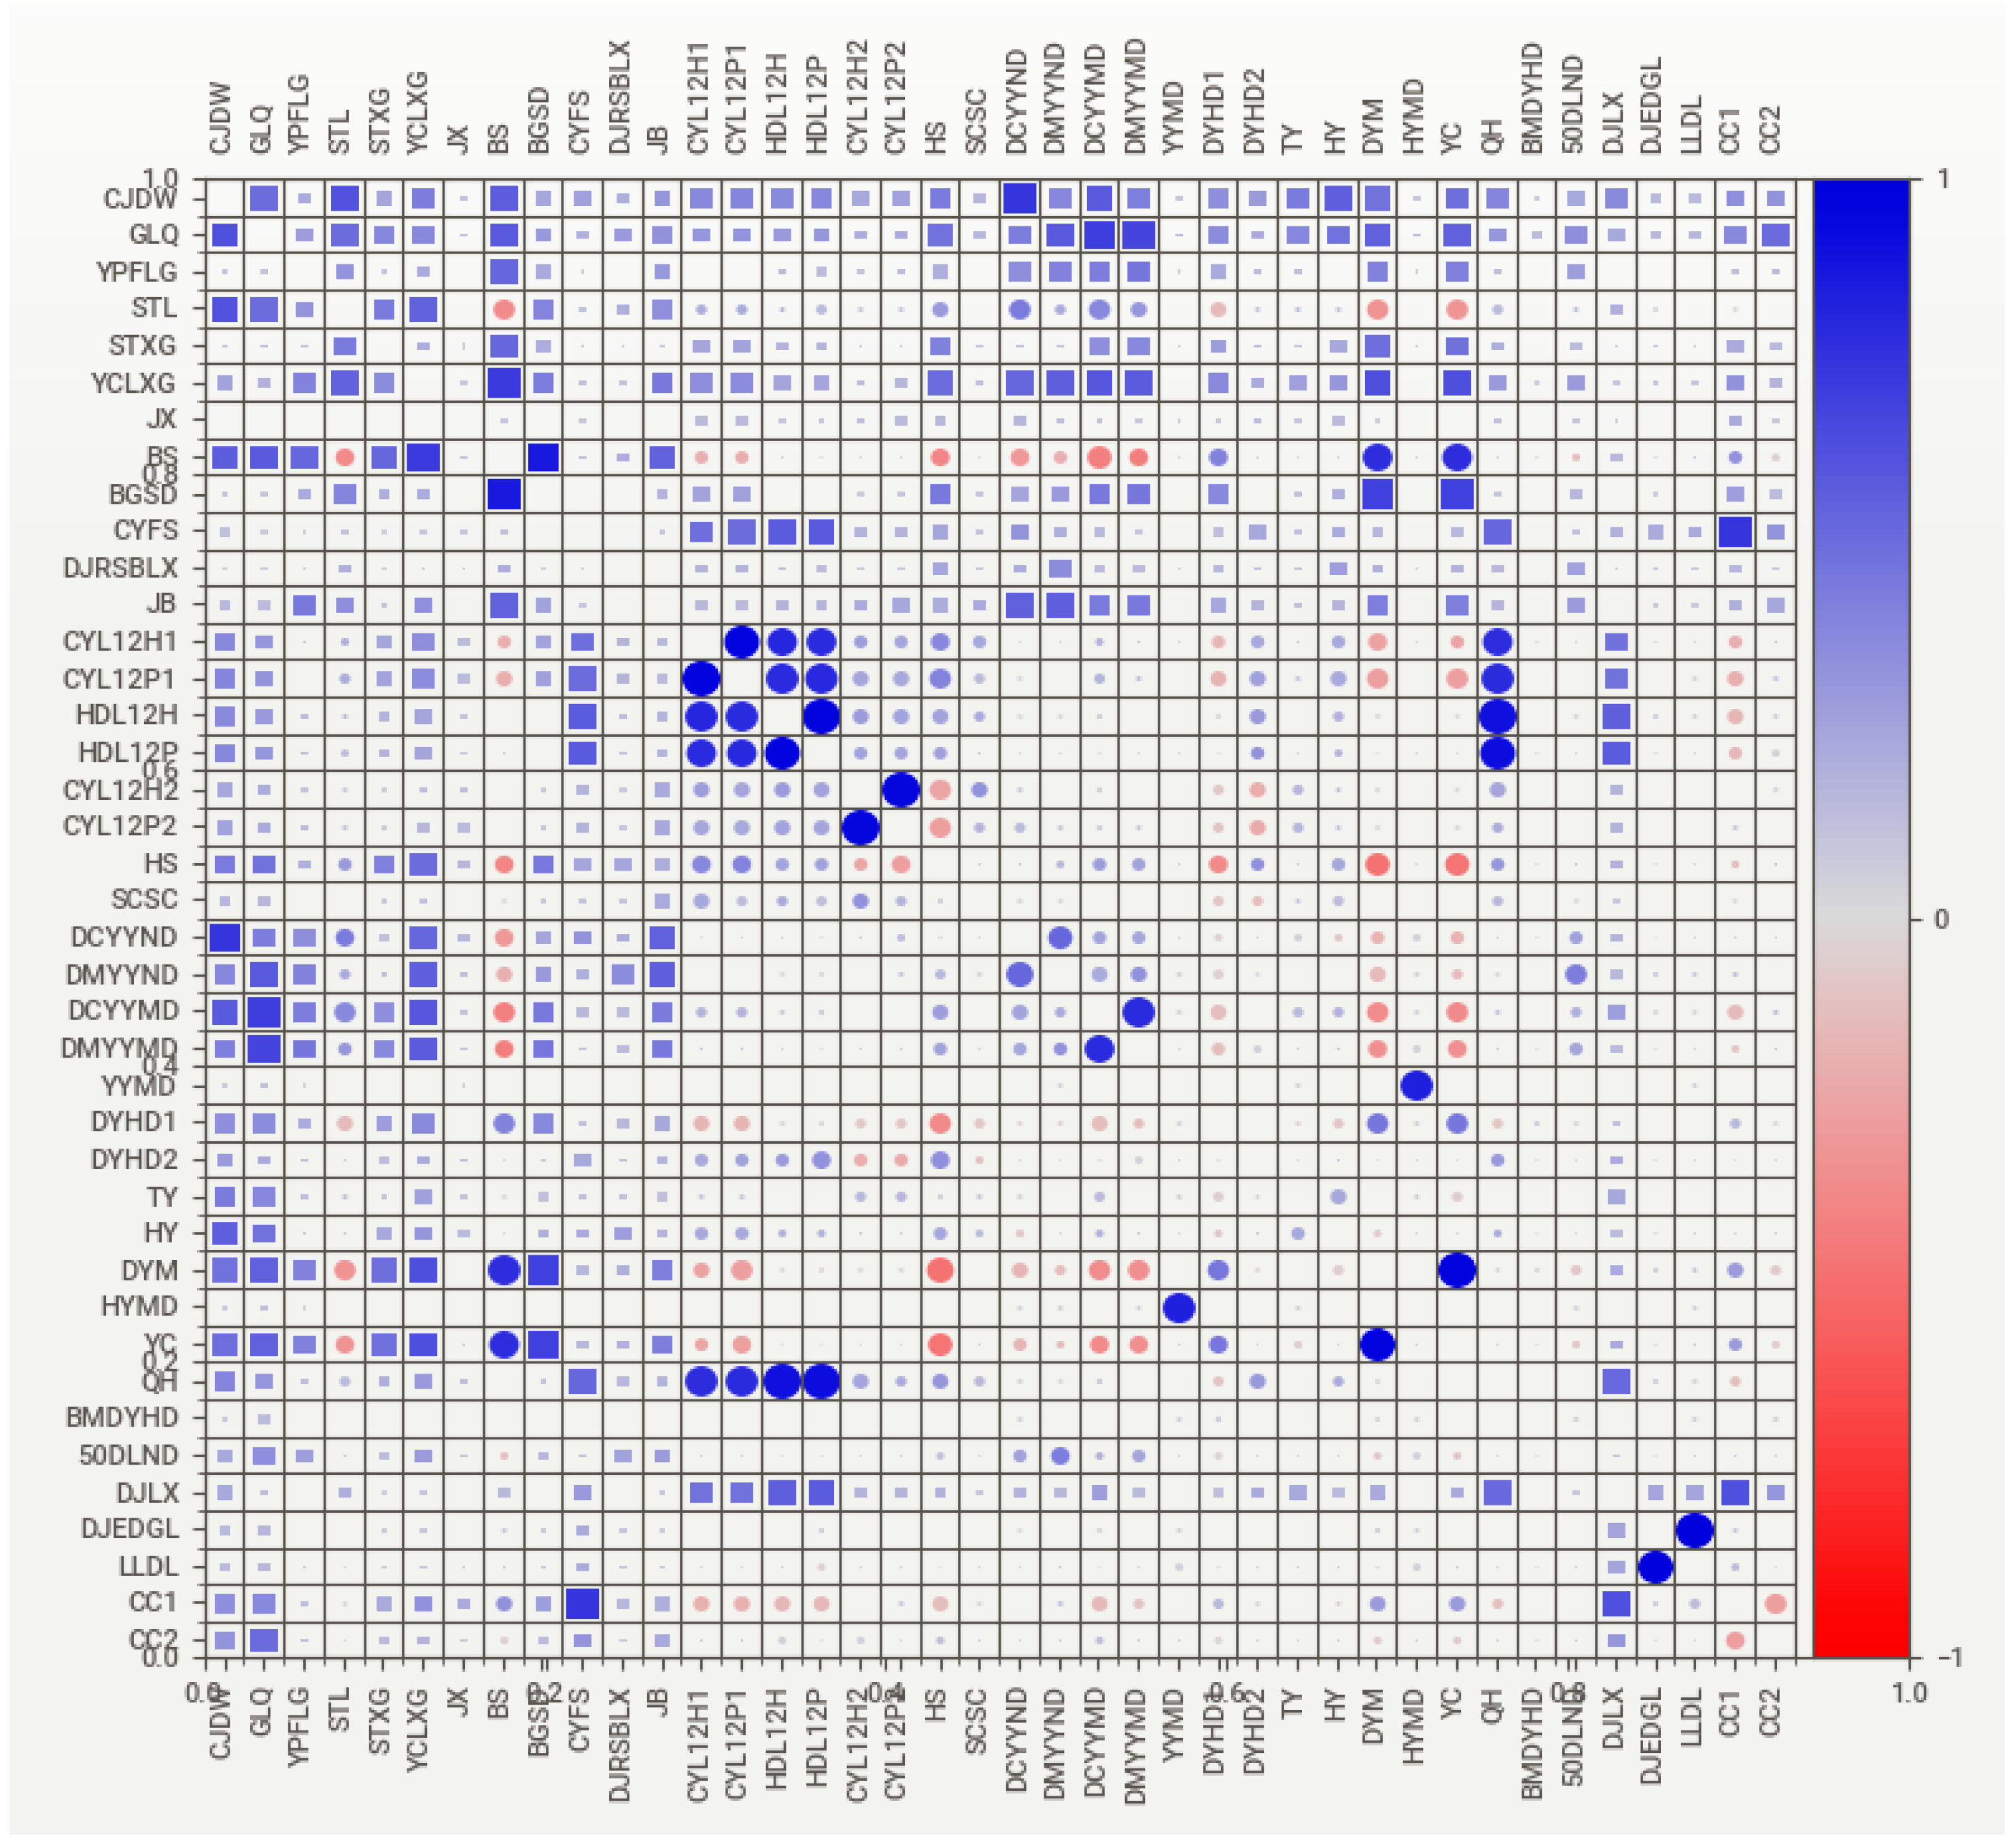
Figure 1. Features and distribution of the raw data.
Processes 13 01501 g001
Figure 2. Statistical histogram of integer parts of the “electricity consumption per 100 m of liquid” feature.
Processes 13 01501 g002
Figure 3. Overall processing flow of the ensemble model.
Processes 13 01501 g003
Figure 4. Flowchart of missing value imputation.
Processes 13 01501 g004
Table 1. Features of daily production data and corresponding encoding processing methods.
No.FeatureAbbr.Type
1Factory-level UnitCJDWCATEGORICAL
2Management AreaGLQCATEGORICAL
3Oil ClassificationYPFLGCATEGORICAL
4PermeabilitySTLNUMERICAL
5Permeability TypeSTXGCATEGORICAL
6Reservoir TypeYCLXGCATEGORICAL
7Well TypeJXCATEGORICAL
8Pump DepthBSNUMERICAL
9Pump Hanging DepthBGSDCATEGORICAL
10Oil Extraction MethodCYFSCATEGORICAL
11Electric Heating Equipment TypeDJRSBLXCATEGORICAL
12Well CategoryJBCATEGORICAL
13Production Liquid Volume (12-day Sum)CYL12H1NUMERICAL
14Production Liquid Volume (12-day Average)CYL12P1NUMERICAL
15Power Consumption (12-day Sum)HDL12HNUMERICAL
16Power Consumption (12-day Average)HDL12PNUMERICAL
17Oil Production Volume (12-day Sum)CYL12H2NUMERICAL
18Oil Production Volume (12-day Average)CYL12P2NUMERICAL
19Water CutHSNUMERICAL
20Production Duration (Days)SCSCNUMERICAL
21Formation Oil ViscosityDCYYNDNUMERICAL
22Surface Oil ViscosityDMYYNDNUMERICAL
23Formation Oil DensityDCYYMDNUMERICAL
24Surface Oil DensityDMYYMDNUMERICAL
25Crude Oil DensityYYMDNUMERICAL
26Electricity Consumption per Ton of LiquidDYHD1NUMERICAL
27Electricity Consumption per Ton of OilDYHD2NUMERICAL
28Tubing PressureTYNUMERICAL
29Back PressureHYNUMERICAL
30Dynamic Liquid LevelDYMNUMERICAL
31Mixture DensityHYMDNUMERICAL
32Lift HeightYCNUMERICAL
33QHQHNUMERICAL
34Electricity Consumption per 100 Meters of LiquidBMDYHDNUMERICAL
35Dynamic Viscosity at 50 °C50DLNDNUMERICAL
36Motor TypeDJLXCATEGORICAL
37Motor Rated PowerDJEDGLNUMERICAL
38Theoretical Electric QuantityLLDLNUMERICAL
39StrokeCC1NUMERICAL
40CycleCC2NUMERICAL
Table 2. Encoding methods for categorical features.
No.FeatureAbbr.Type
1Factory-level UnitCJDWCATEGORICALOne-Hot Encoding
2Management AreaGLQCATEGORICALOne-Hot Encoding
3Oil ClassificationYPFLGCATEGORICALOne-Hot Encoding
5PermeabilitySTXGCATEGORICALLabel Encoding
6Reservoir TypeYCLXGCATEGORICALOne-Hot Encoding
7Well TypeJXCATEGORICALOne-Hot Encoding
9Pump Hanging DepthBGSDCATEGORICALLabel Encoding
10Oil Extraction MethodCYFSCATEGORICALOne-Hot Encoding
11Electric Heating Equipment TypeDJRSBLXCATEGORICALOne-Hot Encoding
12Well CategoryJBCATEGORICALOne-Hot Encoding
36Motor TypeDJLXCATEGORICALOne-Hot Encoding
Table 3. Comparison of experimental results.
ModelPCAMSEAPRF1TTPT
SVMY1.930.650.670.650.668.582.860
Gradient BoostingY1.820.580.670.580.6169.310.015
MLPY1.380.570.730.570.637.960.011
KNeighborsY1.980.740.680.740.700.140.116
Gaussian ProcessY3.180.420.680.420.5275.8718.39
AdaBoostY3.640.060.020.060.037.970.026
Random ForestN0.110.930.930.930.9328.140.033
Decision TreeN0.370.860.860.860.860.340.005
RidgeN1.580.520.730.520.580.020.004
Linear RegressionN1.580.520.730.520.580.080.004
LassoN1.810.500.710.500.550.300.004
ElasticNetN1.760.500.720.500.560.340.004
Ensemble Model-0.040.960.960.960.96--
Table 4. Data cleaning experimental results.
No.Feature
Abbr.
AlgorithmPerformance
Metric
Evaluation
Value
1CJDWClassifierAccuracy0.99
2GLQClassifierAccuracy0.94
3YPFLGClassifierAccuracy0.98
4STXGClassifierAccuracy1
5YCLXGClassifierAccuracy0.97
6JXClassifierAccuracy0.74
7BGSDClassifierAccuracy1
8CYFSClassifierAccuracy0.95
9DJRSBLXClassifierAccuracy0.92
10JBClassifierAccuracy0.92
11DJLXClassifierAccuracy0.77
12STLRegressorR2 Score0.95
13BSRegressorR2 Score0.94
14CYL12H1RegressorR2 Score0.99
15CYL12P1RegressorR2 Score0.99
16HDL12HRegressorR2 Score1
17HDL12PRegressorR2 Score0.99
18CYL12H2RegressorR2 Score1
19CYL12P2RegressorR2 Score0.99
20HSRegressorR2 Score0.98
21SCSCRegressorR2 Score0.94
22DCYYNDRegressorR2 Score1
23DMYYNDRegressorR2 Score0.98
24DCYYMDRegressorR2 Score0.99
25DMYYMDRegressorR2 Score1
26YYMDRegressorR2 Score0.1
27DYHD1RegressorR2 Score0.99
28DYHD2RegressorR2 Score0.94
29TYRegressorR2 Score0.73
30HYRegressorR2 Score0.57
31DYMRegressorR2 Score1
32HYMDRegressorR2 Score0.9
33YCRegressorR2 Score1
34QHRegressorR2 Score0.98
3550DLNDRegressorR2 Score0.12
36DJEDGLRegressorR2 Score0.97
37LLDLRegressorR2 Score0.98
38CC1RegressorR2 Score0.81
39CC2RegressorR2 Score0.79
Disclaimer/Publisher’s Note: The statements, opinions and data contained in all publications are solely those of the individual author(s) and contributor(s) and not of MDPI and/or the editor(s). MDPI and/or the editor(s) disclaim responsibility for any injury to people or property resulting from any ideas, methods, instructions or products referred to in the content.