Article

Effect of Different Loading Sequences on Low Cycle Fatigue of Nickel-Based Superalloys

1
School of Aeronautics, Northwestern Polytechnical University, Xi’an 710072, China
2
Harbin Marine Boiler and Turbine Research Institute, Harbin 150078, China
3
National Key Laboratory of Aircraft Configuration Design, Xi’an 710072, China
*
Author to whom correspondence should be addressed.
Processes 2025, 13(5), 1477; https://doi.org/10.3390/pr13051477
Submission received: 9 April 2025 / Revised: 6 May 2025 / Accepted: 9 May 2025 / Published: 12 May 2025
(This article belongs to the Section Materials Processes)

Abstract

:
Low-cycle fatigue damage accumulation exhibits inherent nonlinear characteristics, particularly under variable-amplitude loading conditions, where loading sequence exerts significant influence on damage evolution. This investigation conducted strain-controlled variable loading fatigue tests on nickel-based superalloy specimens at 650 °C. Comparative microstructural analysis through scanning electron microscopy revealed distinct fracture features between variable-amplitude and constant-amplitude loaded specimens. A novel fatigue damage accumulation model was developed through three critical advancements: mathematical formulation of strain amplitude as an exponential function based on the damage equivalence principle, explicit integration of loading sequence effects, and systematic calibration using experimental data. Comparative analysis with existing fatigue damage models revealed that the proposed methodology demonstrates notable advantages in both prediction accuracy and implementation simplicity.

1. Introduction

Fatigue failure constitutes the primary mode of mechanical structure failure [1], frequently leading to substantial economic losses owing to the absence of detectable precursors prior to catastrophic fracture. Specifically, critical components such as turbine discs exhibit accelerated failure mechanisms under combined thermo-mechanical loading conditions, including harsh operational environments, multiaxial stress states, and repeated thermal transients during high-temperature start-stop cycles [2,3]. The progressive development of fatigue damage during service inductions microstructural evolution, thereby resulting in performance degradation throughout the component lifespan [4]. Consequently, integrating material property deterioration models becomes imperative during high-temperature low-cycle fatigue (LCF) assessments to mitigate premature failures in engineering components.
Modeling fatigue damage accumulation remains a fundamental challenge in fatigue life prediction [5], with numerous models developed over recent decades to characterize material degradation under cyclic loading. The widely adopted Palmgren-Miner linear damage rule (LDR) [6] prioritizes computational simplicity by considering only stress-dominated damage below the fatigue limit, yet its critical limitations arise from assuming damage independence of loading sequences, multiaxial interactions, and environmental conditions [7]. These shortcomings have motivated the emergence of nonlinear accumulation frameworks, broadly categorized as damage curve-based methods, continuum damage mechanics models, load-interaction-sensitive formulations, energy-based approaches, and physical property degradation frameworks [1,8,9,10,11,12,13,14,15]. Ye et al. [16] proposed a nonlinear damage accumulation model based on the evolution of material toughness during fatigue, which has gained widespread engineering application due to its simplicity, clear physical interpretability, and high prediction accuracy. Recent improvements to this model include the work by Lv et al. [17], who introduced a two-stage load ratio to account for interactions between different loading levels in traditional life prediction models, significantly enhancing prediction accuracy. Wang et al. [13] quantified load interaction effects in damage evolution using the square of load ratios between preceding and subsequent stages, while Zhou et al. [18] developed a fatigue damage model based on material memory characteristics to describe the degradation of mechanical properties under cyclic loading, achieving rational predictions under such conditions.
Predicting fatigue life under constant-amplitude loading presents significant challenges, with greater complexities arising under variable-amplitude conditions. Continuous Damage Mechanics (CDM) [19], established as a promising methodology, utilizes damage variables to quantify material state evolution preceding macroscopic crack initiation. A central challenge in CDM implementation involves defining damage variables that authentically capture cyclic fatigue characteristics. Current research predominantly employs three variable types: dynamic response parameters, mechanical property indicators, and physical property metrics [16,20,21,22]. However, most existing formulations, adapting creep and plastic damage theories, lack explicit physical foundations for fatigue damage accumulation, thus limiting direct applicability to fatigue problems [23,24]. This persisting issue underscores the need for fatigue-specific damage descriptors in CDM frameworks.
This study investigates a modified cumulative damage model for LCF through static mechanical property analysis and load interaction effect improvements. Controlled variable-amplitude LCF experiments were performed on GH4169 superalloy specimens to validate model enhancements. Post-fatigue fracture surfaces underwent scanning electron microscopy (SEM) characterization, enabling analysis of load variation effects on microstructural evolution. Comparative assessments between experimental results and model predictions demonstrate the modified formulation’s superior accuracy.

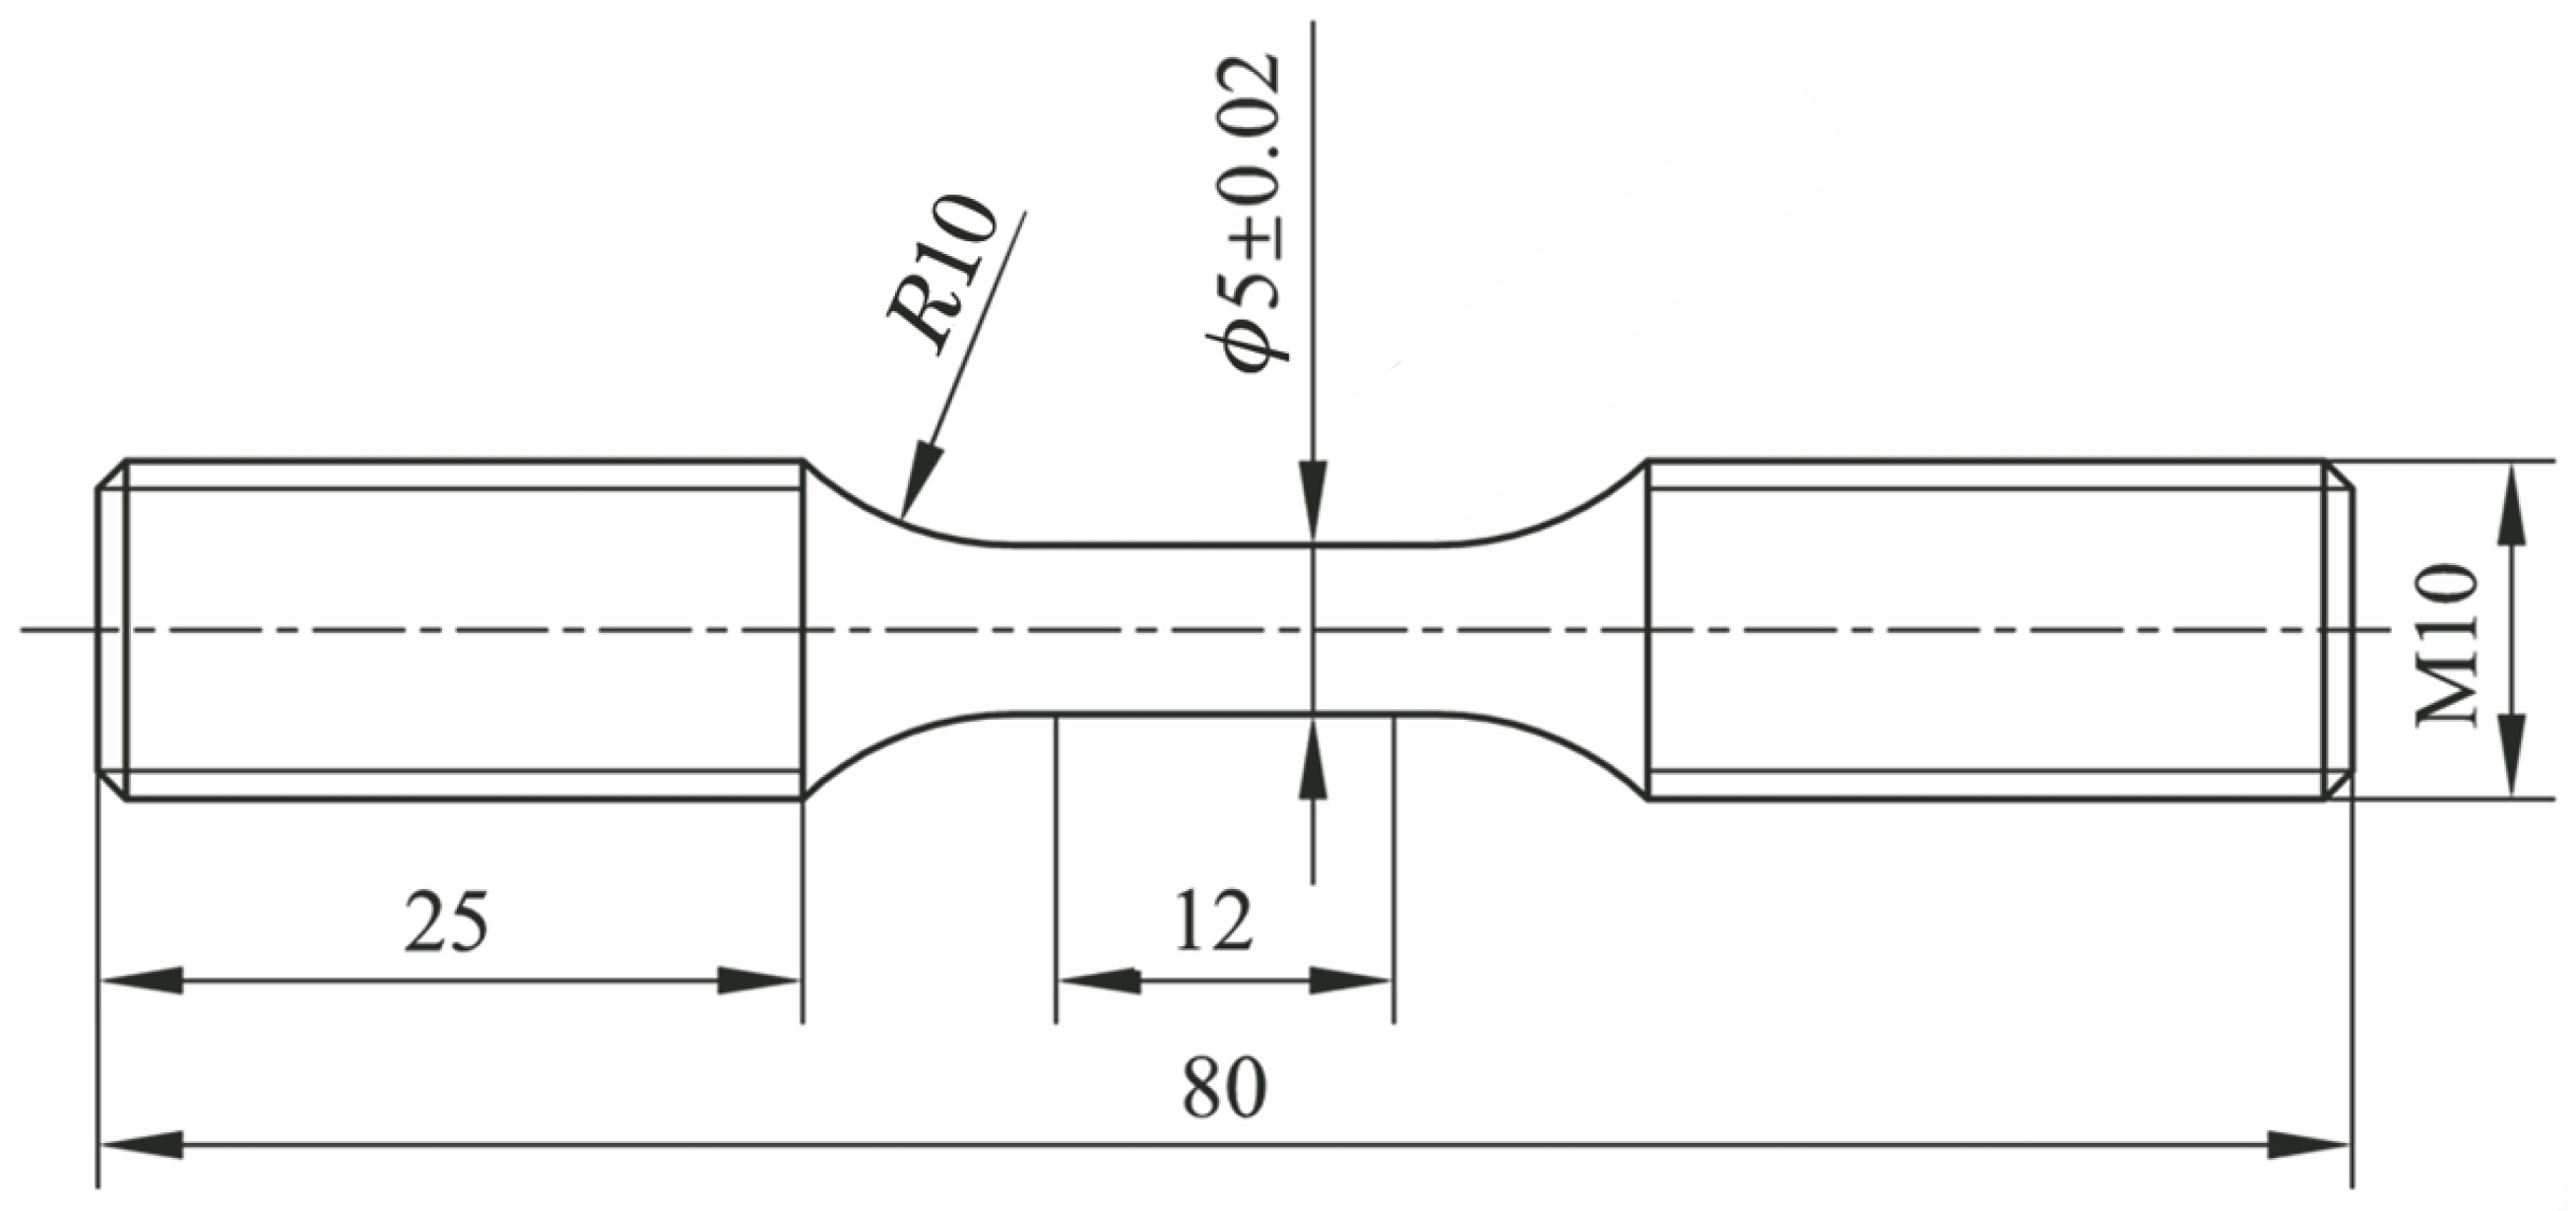
2. Materials and Methods

The material used in this study is the nickel-based superalloy GH4169, a precipitation-hardening superalloy. It has a wide range of aerospace applications due to its high strength, good fatigue properties, oxidation resistance, and corrosion resistance in the temperature range of −253 °C to 650 °C [1]. According to the Chinese National Standard GB/T 40303-2021 [25], the basic chemical composition and mechanical properties of GH4169 alloy are shown in Table 1 and Table 2, respectively. The standard heat treatment regime for GH4169 was determined as follows: 980 °C ± 10 °C/1 h (AC) + 720 °C ± 10 °C/8 h (FC at 50 °C ± 10 °C/h → 620 °C ± 10 °C) + 620 °C ± 10 °C/8 h (AC). The specimen dimensions are as shown in Figure 1.
In this fatigue test, an MTS 370.25 electro-hydraulic servo fatigue testing machine was employed. The testing system is controlled via an electro-hydraulic servo mechanism and interfaced with a computer to enable fully automated loading process control. LCF testing with strain amplitude control was systematically conducted in this investigation. Initial baseline testing employed multiple strain amplitudes at 650 °C under fully reversed cyclic loading (R = −1) to establish material performance characteristics. Subsequent variable-amplitude LCF testing at identical thermal-mechanical conditions utilized strategically selected strain levels of 0.7% and 0.5%. All specimens underwent surface polishing treatment to mitigate potential interference from surface imperfections.
Post-mortem analysis involved comprehensive SEM characterization of fracture surfaces and crack propagation features across different failure stages, encompassing both constant-strain fatigue specimens and variable-load testing configurations.

3. Results

3.1. Low Cycle Fatigue Results

To investigate microstructural evolution differences in fatigue damage under varying strain conditions, we performed LCF tests under two configurations: strain-controlled tests with different amplitudes and variable-load tests with varied initial cycle counts, with results systematically documented in Table 3 and Table 4. In Table 4, N f 1 and N f 2 represent the fatigue life at strain amplitudes of 0.7% and 0.5%, with values of 1278 and 5709 cycles, respectively. D 1 and D 2 denote the damage calculated using Miner’s rule under the first-stage and second-stage loads, while D represents the total damage from both stages. The results show that under the high-to-low loading sequence, the total damage is significantly less than 1, with a difference exceeding 20%. Conversely, under the low-to-high loading sequence, the total damage is slightly greater than one.

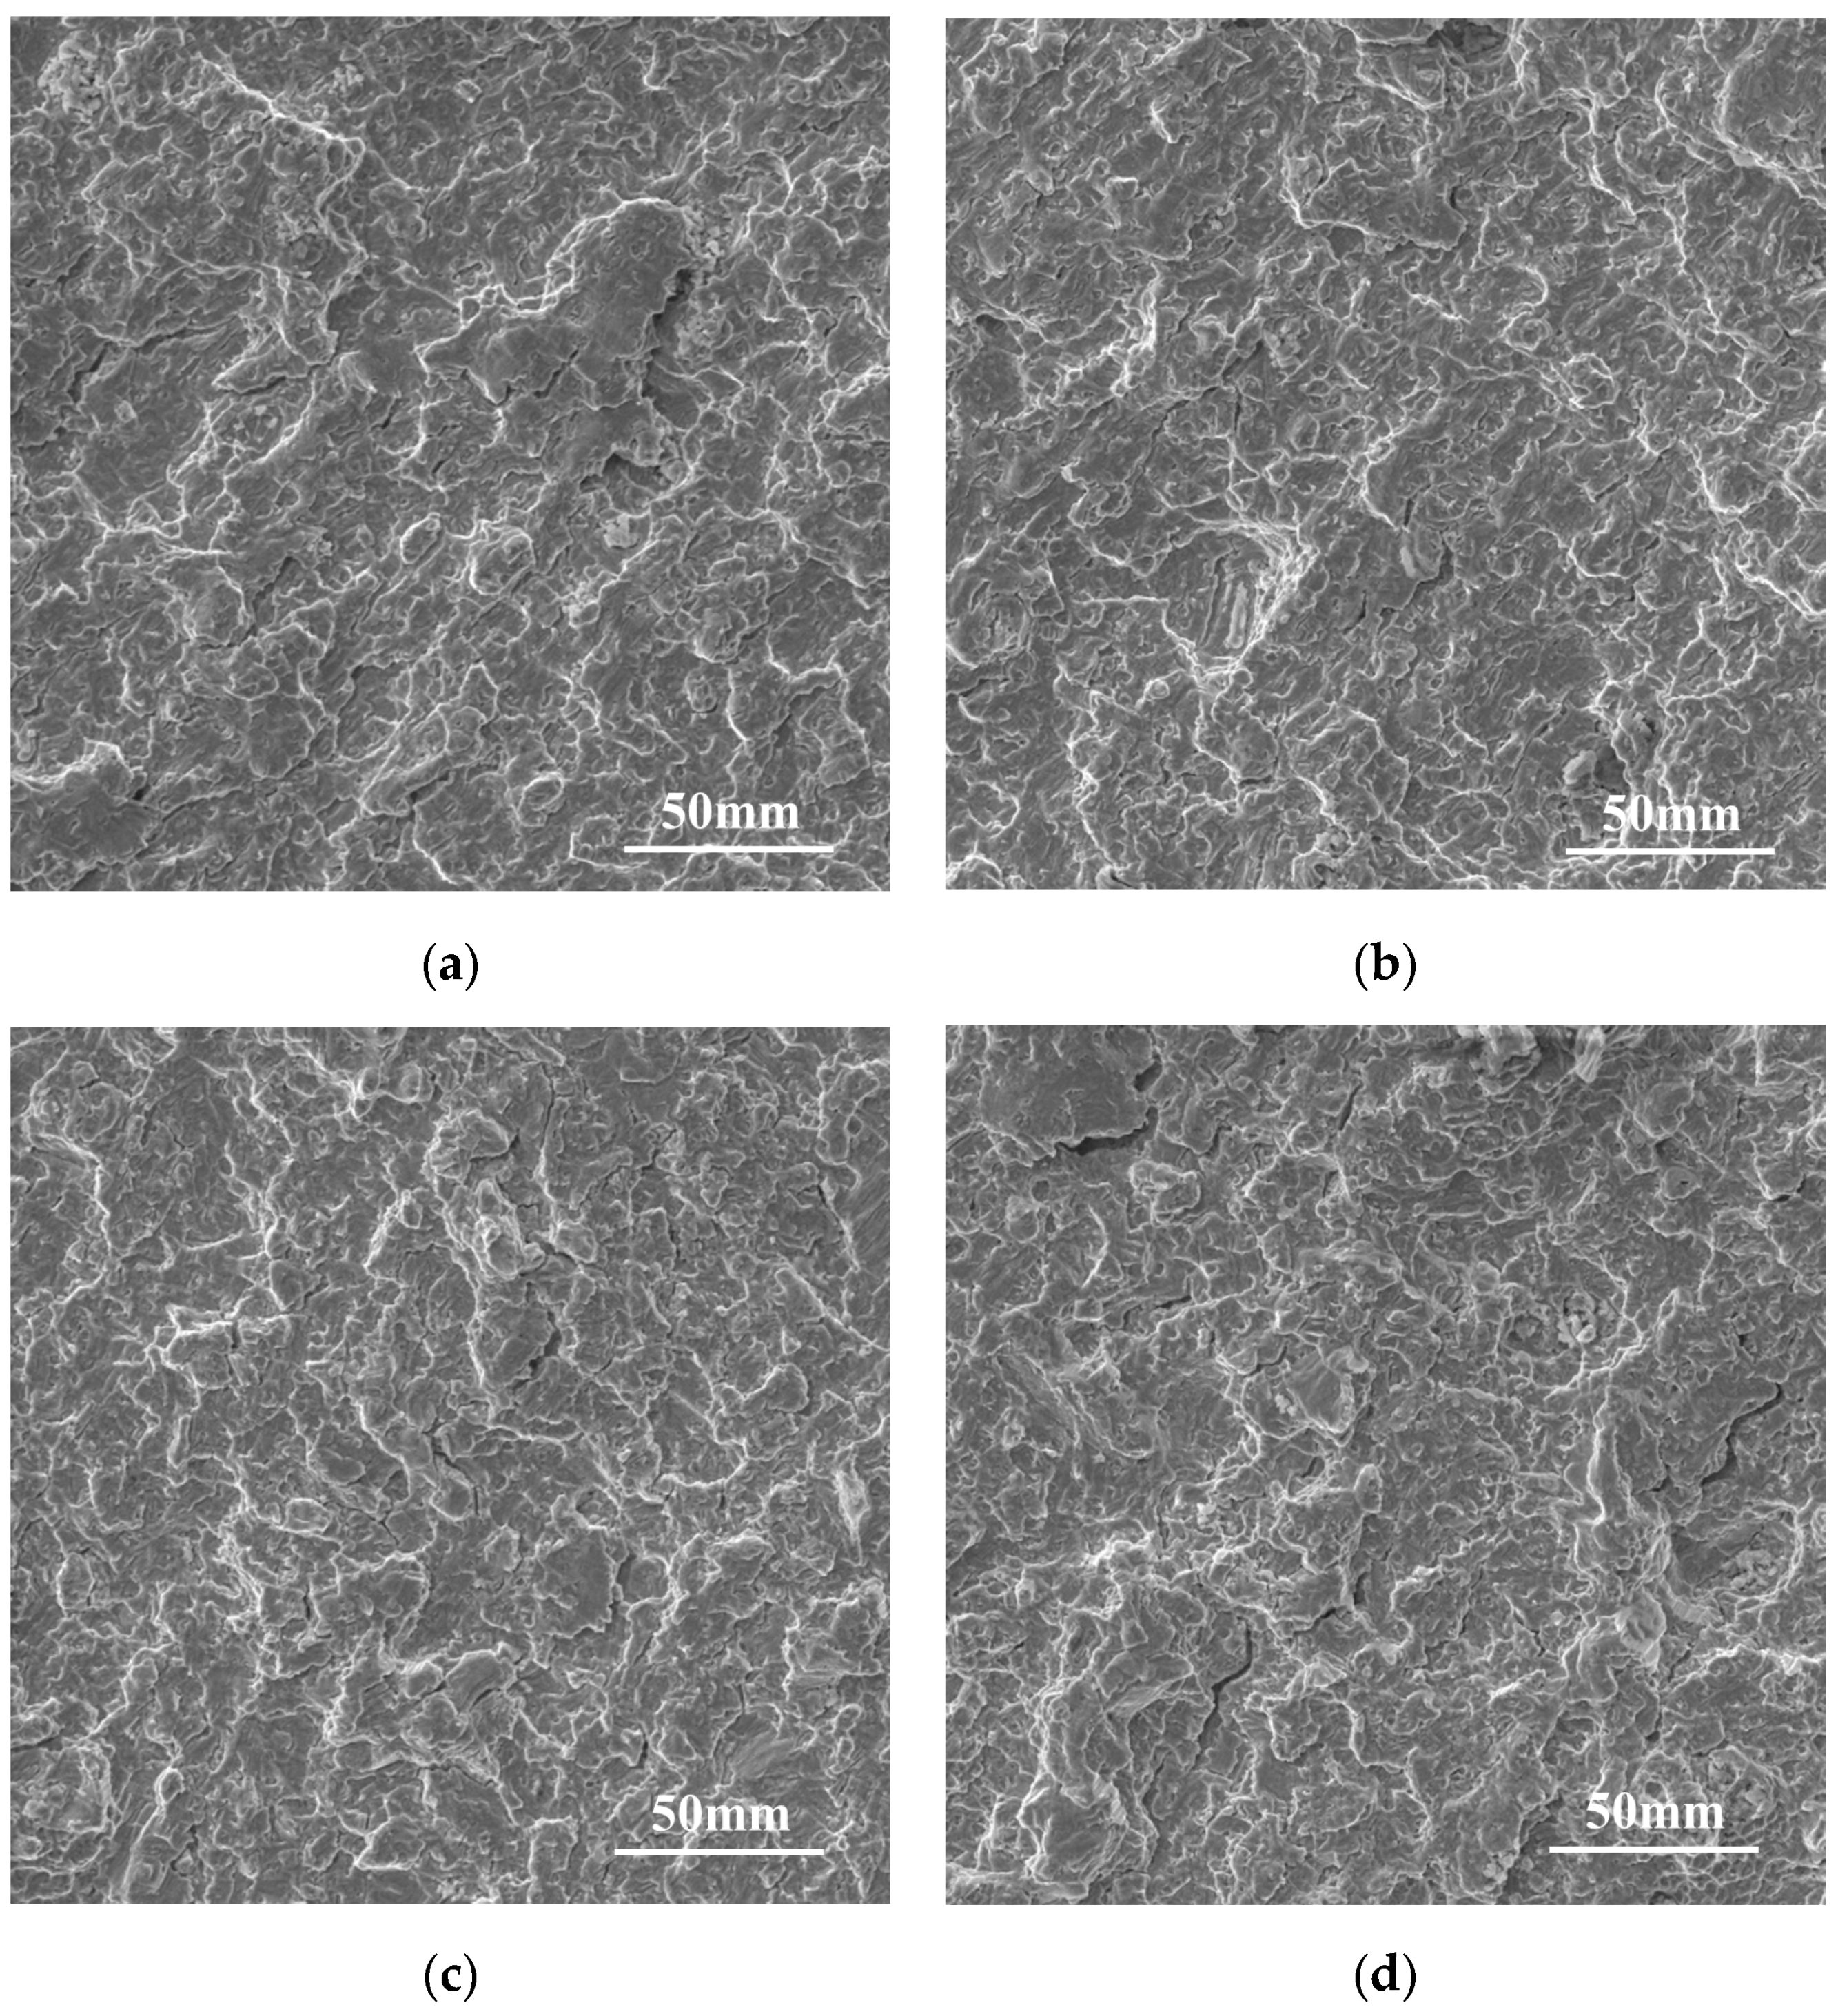
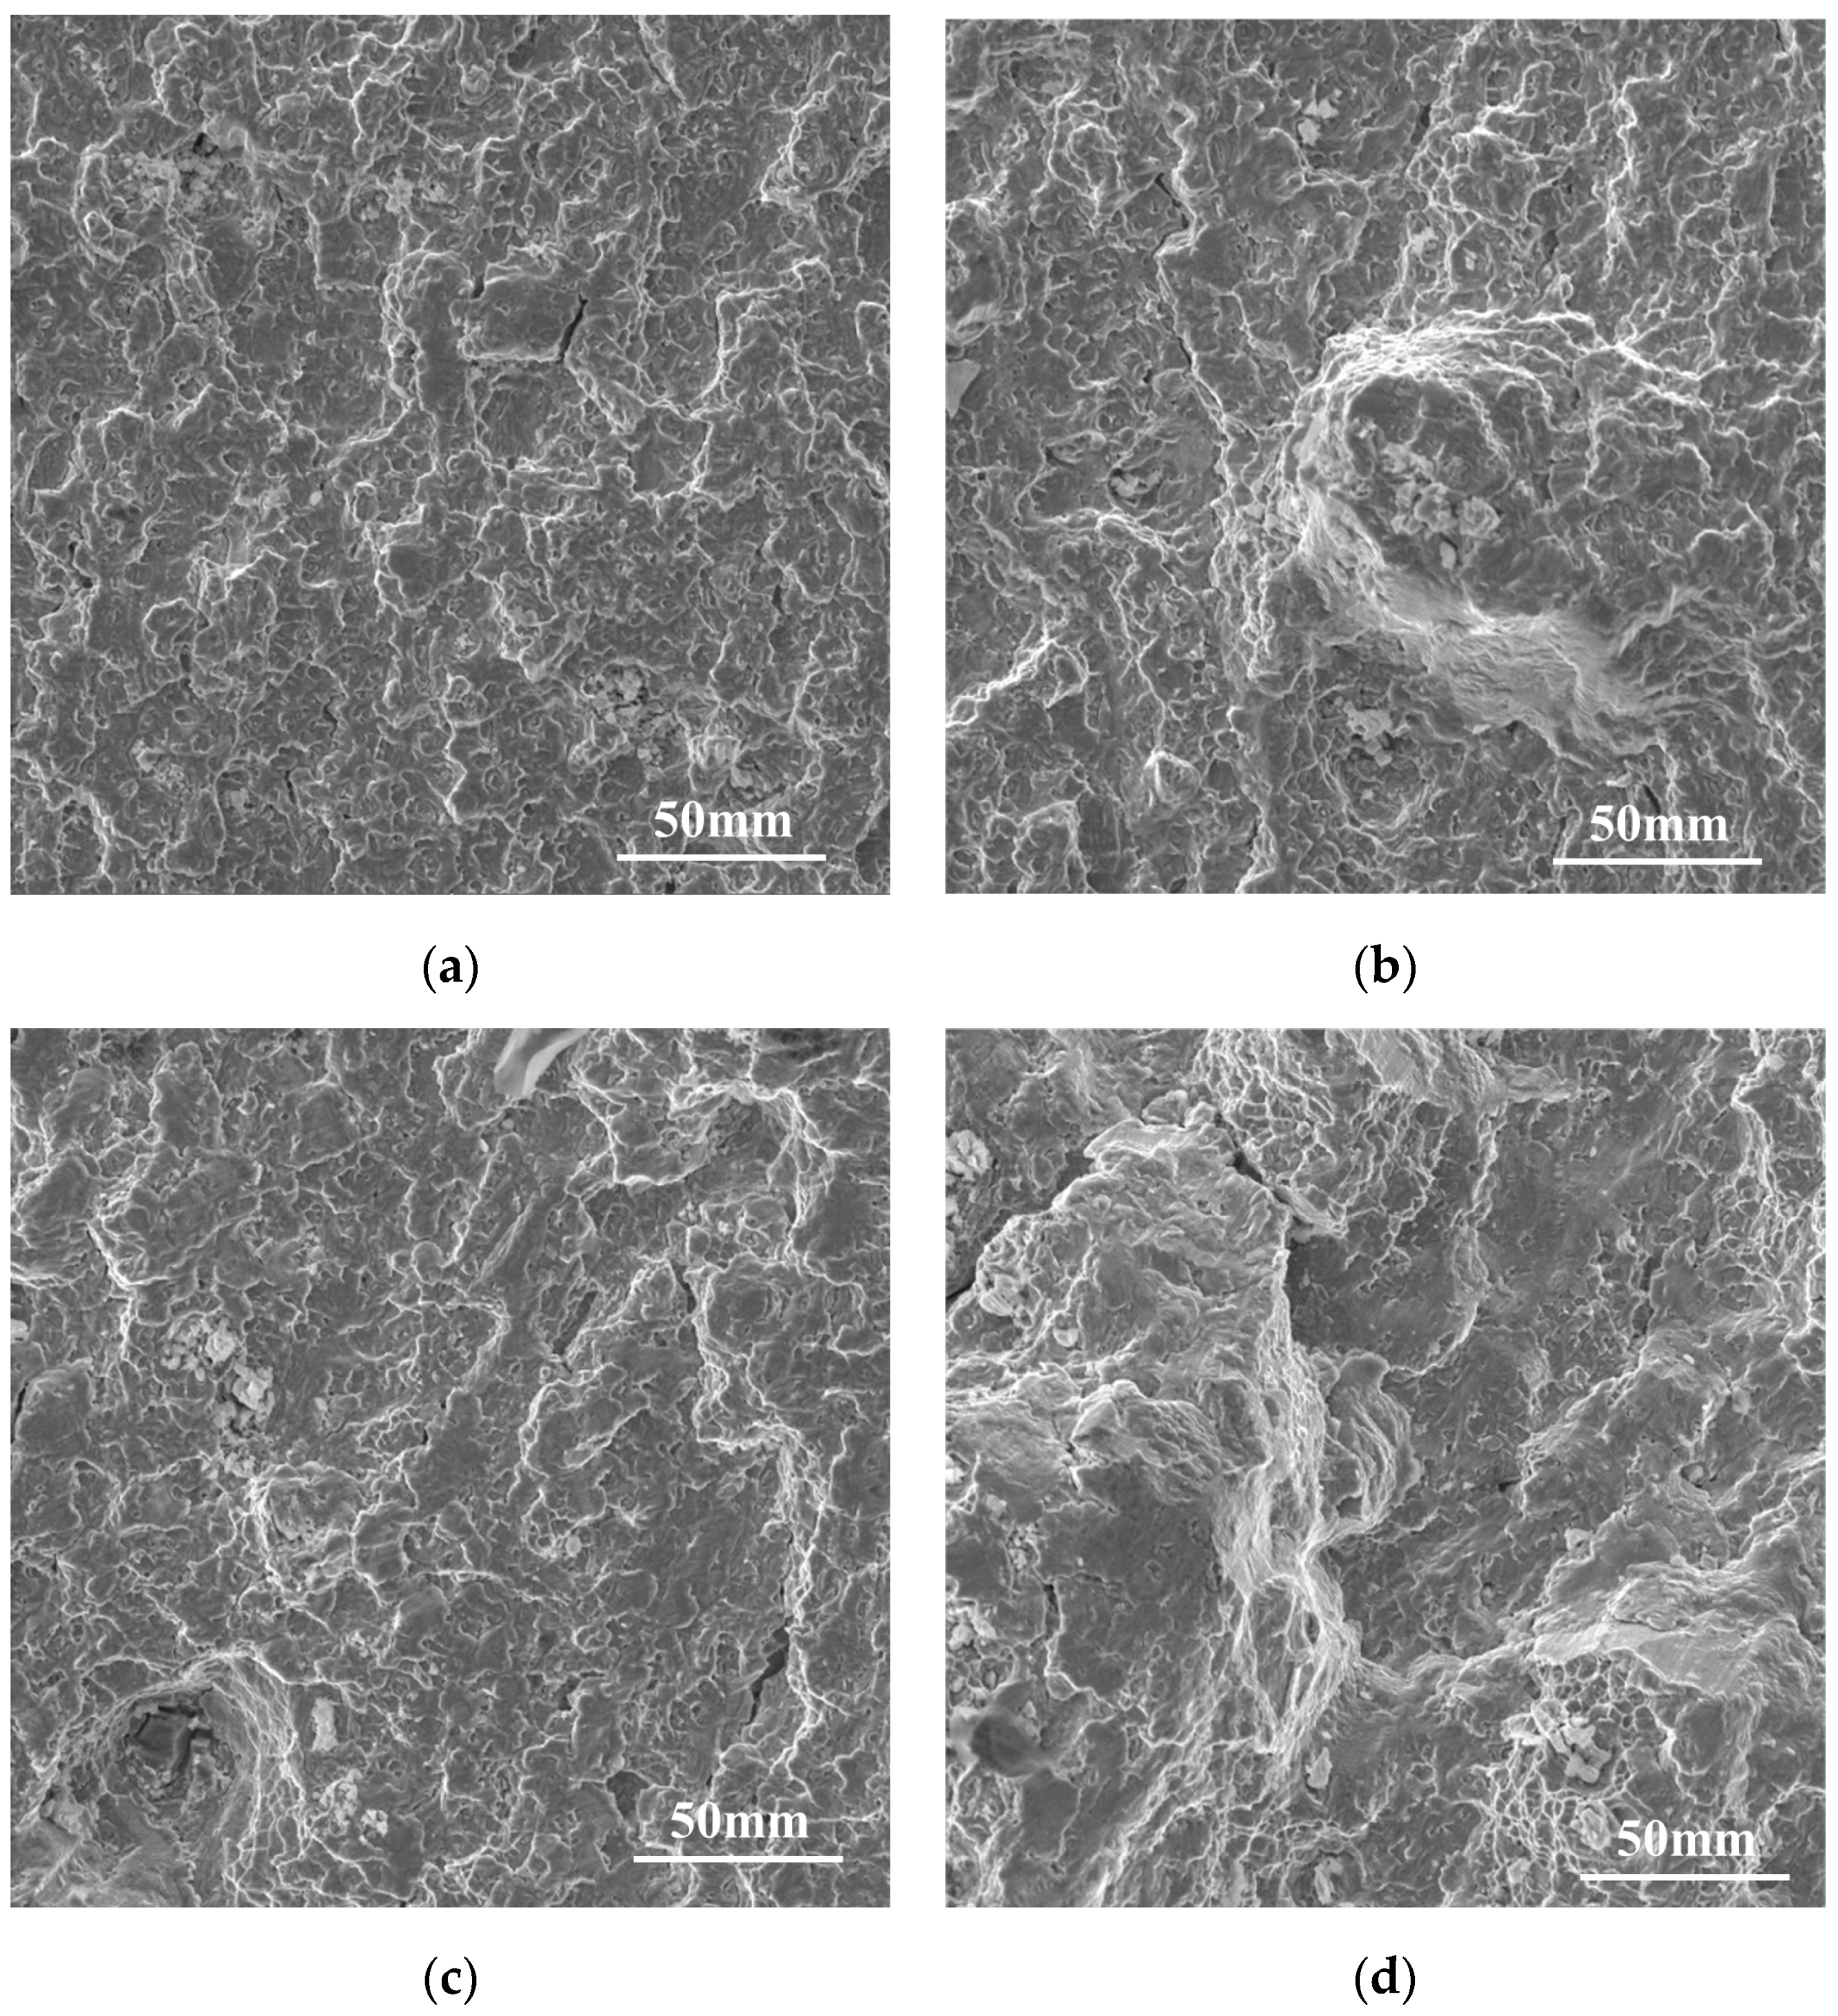
3.2. SEM Microstructure Scanning and Analysis

Fatigue fracture characterization was conducted using SEM across all specimens, with focused microstructural analysis performed on three critical zones: crack initiation region, propagation region, and final fracture zone along the crack path. Given the pronounced influence of variable loading on damage evolution within the propagation region, high-resolution observations were systematically implemented for both early-stage and late-stage propagation subzones. Identical microstructural features observed in the initiation and final fracture regions excluded them from presentation, with analytical emphasis retained on the propagation region.
Figure 2 illustrates representative fatigue fracture morphology under varying strain amplitudes, where white arrows denote crack propagation direction. Notably, consistent morphological patterns persist between early and late propagation stages during stable crack growth, indicative of steady-state fracture mechanics. Subsequent microstructural analysis in Figure 3 compares early-versus late-stage propagation characteristics under condition Δ ε / 2 = 0.7 % and Δ ε / 2 = 0.5 % . Despite theoretical expectations of progressive damage accumulation during stable propagation, quantitative microstructural evolution remained statistically indistinguishable across observation intervals.
Figure 4 presents electron micrographs of fractures in variably-loaded low circumferential fatigue specimens, with subfigures (a) and (b) arranged sequentially by descending load magnitude (high-to-low) and (c)–(d) following the inverse sequence (low-to-high). The initial load cycles for each condition are quantified as follows: (a) 720 cycles, (b) 240 cycles, (c) 3300 cycles, and (d) 1100 cycles, where directional white arrows consistently mark crack propagation paths. Comparative analysis between (a)–(b) reveals minimal microstructural variation between initial and terminal stages during crack extension under descending load hierarchy. Conversely, the reverse loading sequence (c)–(d) exhibits significant stage-dependent morphological divergence, characterized by progressive defect amplification along the propagation trajectory.
To further elucidate this phenomenon, detailed observations were conducted on the crack extension regions of fractures. Figure 5 and Figure 6 respectively demonstrate microstructural characteristics at different propagation stages for specimens subjected to high-low and low-high loading sequences. Specifically, Figure 5a,b display the crack extension region microstructure during initial and final phases under 720 initial load cycles, while Figure 5c,d correspond to 240-cycle specimens. These observations indicate minimal microstructural evolution between stages, suggesting load reduction induces negligible morphological alterations in crack propagation paths.
Contrastingly, Figure 6a,b reveal the crack extension morphology under 3300 initial cycles, with Figure 6c,d representing 1100-cycle specimens. Significant stage-dependent morphological variations emerge, aligning with macroscopic fracture patterns. During initial cracking phases, microstructures mirror conventional fatigue behavior; however, load escalation from low to high magnitudes markedly intensifies defect formation density. Specimens with reduced cycle counts (Figure 6c) fail to replicate early-stage morphologies observed in 3300-cycle samples, likely attributable to variable loading effects manifesting during initial crack advancement.
Comparative analysis of crack propagation morphology under varying load sequences reveals significant sequence-dependent effects on fatigue crack extension behavior. This phenomenon likely originates from differential damage accumulation mechanisms: high-load cycles induce substantial initial damage, with subsequent low-load cycles partially inheriting this pre-conditioned damage state, thereby amplifying low-load damage contributions in mixed-mode loading. Material adaptation mechanisms further modulate this process—pre-exposure to cyclic loads establishes microstructural “memory”, effectively raising the damage threshold for subsequent high-load impacts and necessitating larger defect generation to overcome the strengthened material state. Crucially, low-load cycling demonstrates measurable strengthening effects compared to high-load dominant sequences, providing a counterintuitive reinforcement mechanism during both loading phases.

3.3. Theoretical Analysis

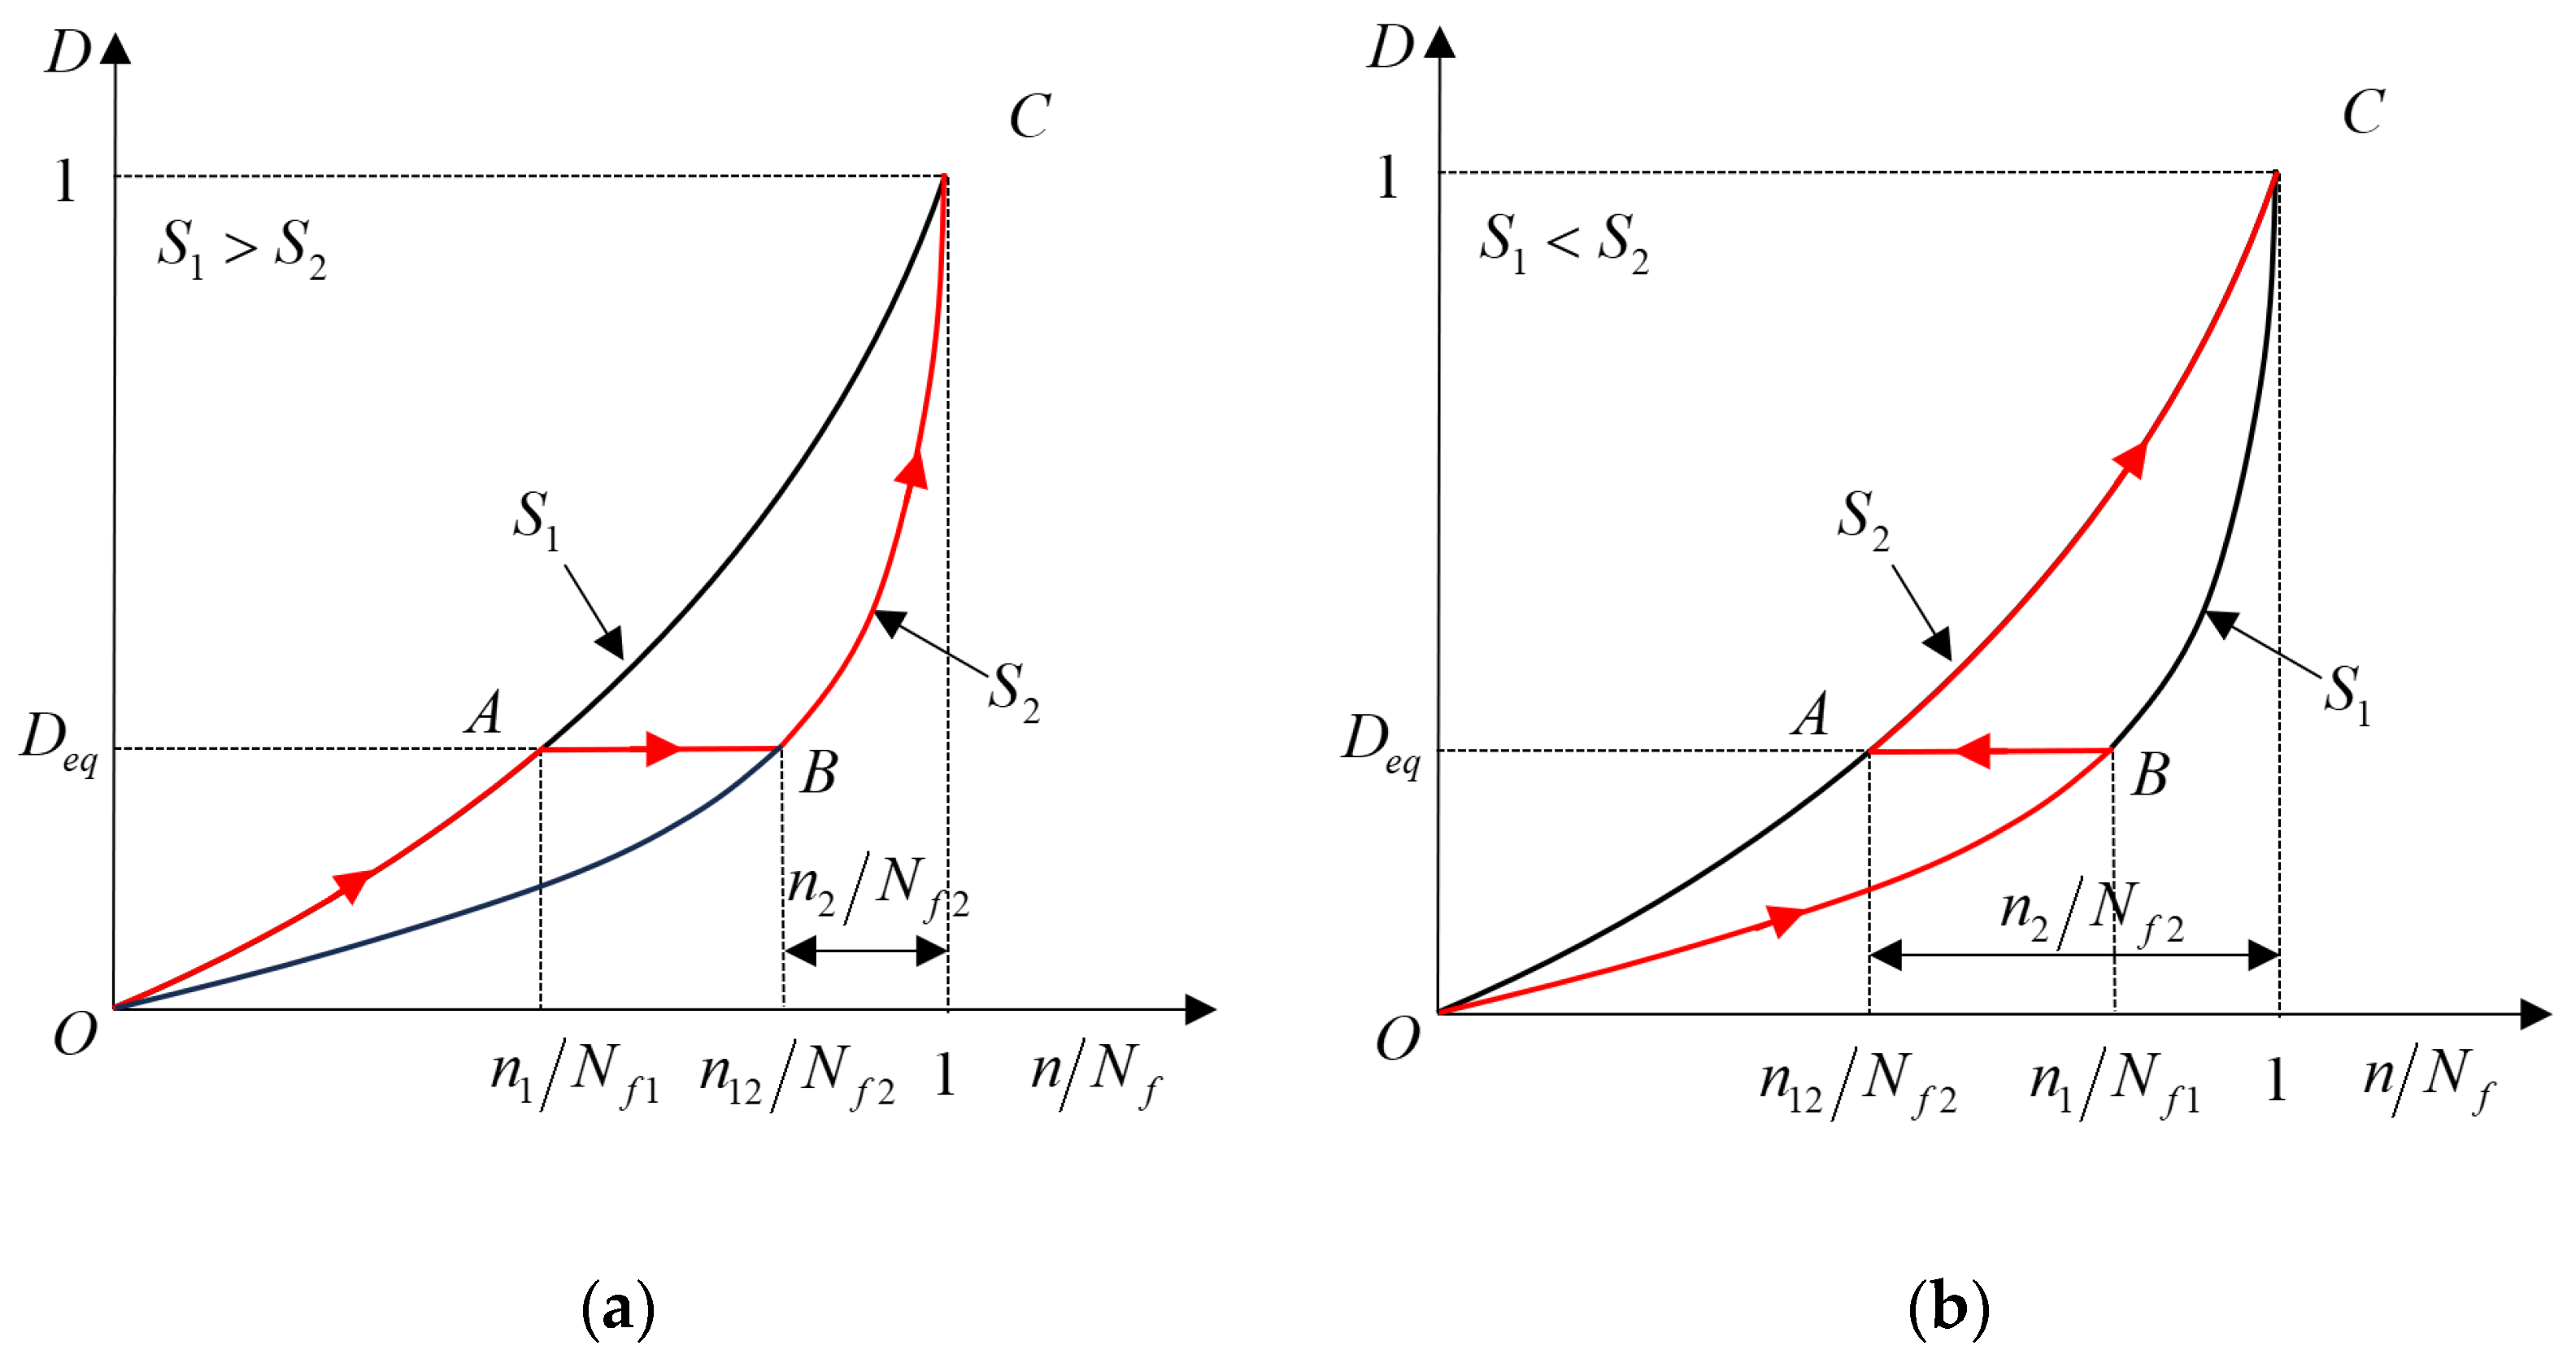
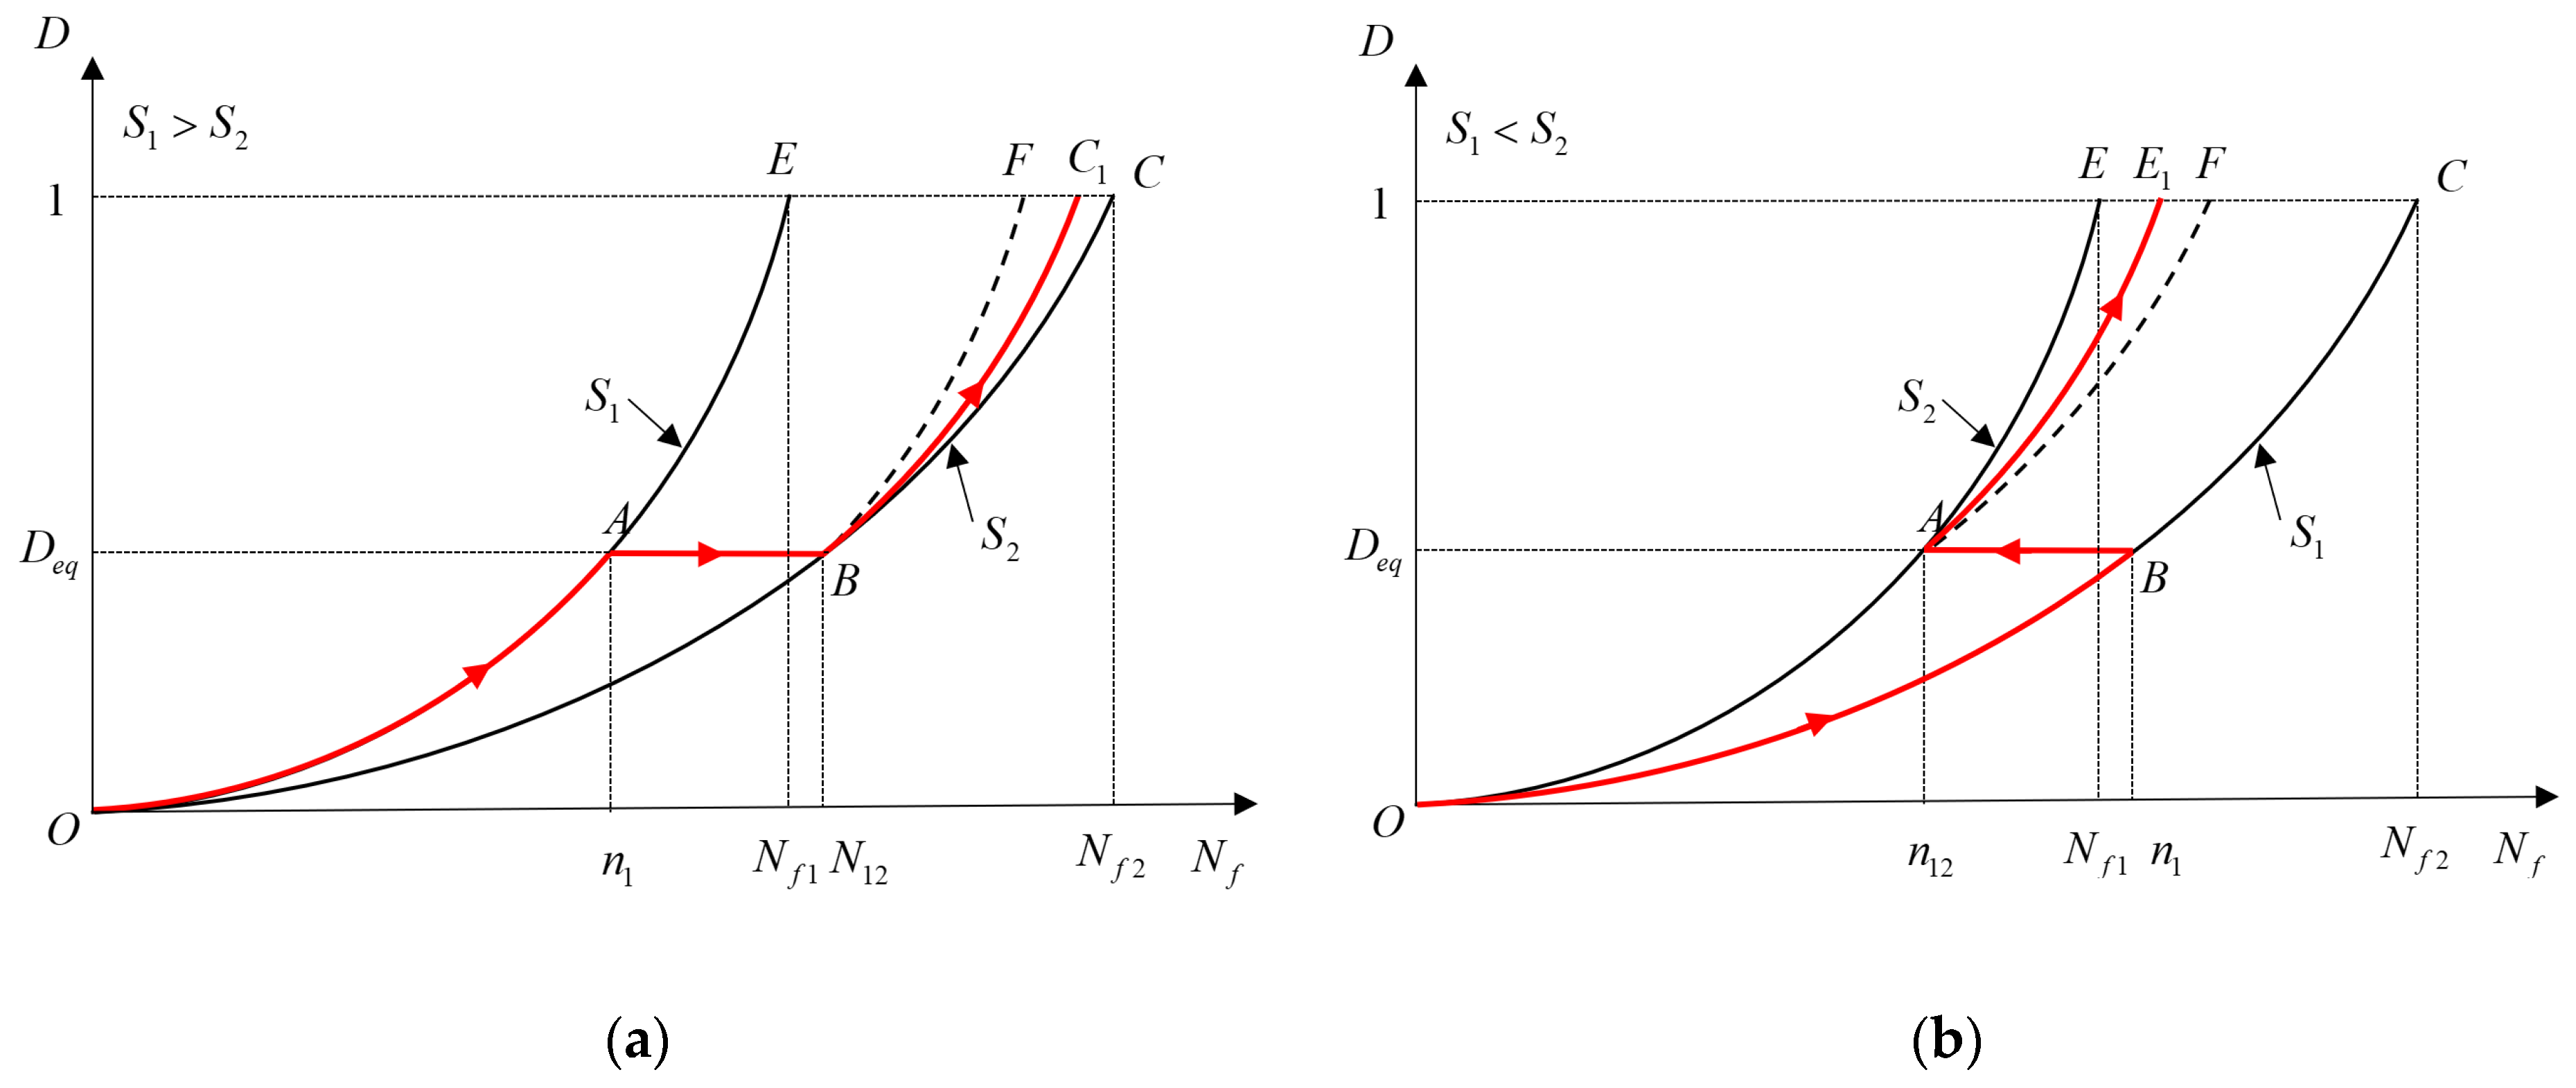
3.3.1. Fatigue Damage Accumulation

Fatigue behavior is fundamentally governed by multifactorial interactions between external environmental conditions and intrinsic material properties, imparting inherent complexity to damage accumulation processes. The amount of fatigue damage can be expressed as [17]:
D = F S , n , f , T , φ , κ
where D is the amount of damage, S is the stress level, n is the number of cycles, f is the frequency, T is the temperature, φ is the humidity, and κ is the material property parameter.
Fatigue damage is exclusively dependent on applied load magnitude and cycling count, with operational frequency, thermal conditions, and material heterogeneity excluded from the parameter space. Consequently, Equation (1) admits the following reformulation:
D = F S , n
From Equation (2), the single fatigue cycle damage can be expressed as
d D d n = f n S , n
Assuming that the relative increment of damage is linearly related to the relative increment of loading cycles, the
d D D = f S d n n
f S denotes any load, since damage is an irreversible process.
For a given load, f S can determined, and integrate Equation (4) by
d D D = f S d n n
ln D = f S ln n + C
where C is the integration constant, when the material reaches destruction, n = N f and D = 1 , and with this boundary condition, we can get
C = f S ln N
Combining Equation (6) and Equation (7) yields:
D = n N f S
Under two-stage loading protocols, structural components undergo cyclic loading at stress amplitude S 1 for n 1 cycles, followed by amplitude S 2 for n 2 cycles until fatigue failure occurs. Implementing the Equivalent Damage Theory (EDT), cumulative damage equivalence is established between the initial loading phase ( D 1 = a 1 m n 1 ) and subsequent loading ( D 2 = a 2 m n 2 ), enabling calculation of residual lifetime n 2 through:
n 2 = n 1 S 1 S 2 m ( where   m = material   constant )
When f(S) is a constant independent of load, the cumulative damage is only related to the load loading sequence, as shown in Figure 7. When S 1 > S 2 , the damage accumulation process is OABC, the cumulative damage D = n i N f i < 1 ; When S 1 < S 2 , the curve path is OBAE, the cumulative damage D = n i N f i > 1 . In the two-stage cyclic loading, when the first stage is high load, it accelerates the generation of cracks, and when the load decreases, it leaves the harmful residual stresses to shorten the fatigue life; when the first stage is low load, the material properties are strengthened, and when the load increases, it leaves the favorable residual stresses to extend the fatigue life. This phenomenon explains the effect of loading sequence on cumulative damage.
When f(S) is a load-dependent function, the cumulative damage is related to load interaction and loading sequence, as shown in Figure 8. When S 1 > S 2 without considering the effect of loading order, the damage accumulation process can be expressed as O A B C ; while considering the load interaction, high and low loading have accelerated the cumulative damage process, so that the fatigue life is reduced, the damage curve will be shifted, and the path of the damage accumulation process is changed to O A B C 1 .When S 1 < S 2 , regardless of the loading sequence, the curve path is O B A E ; at the same time, considering the load interaction, the low and high loading has a delaying effect on the cumulative damage process, so that the fatigue life will be extended, and the path of the damage curve becomes O B A E 1 .

3.3.2. LCF Cumulative Damage Modeling

Miner’s rule is a dominant linear damage accumulation method [6], which assumes that the fatigue damage is equal to the sum of the cumulative cycle ratios at each load, as shown in Equation (10).
D = n i N f i
where D is the total damage, n i and N f i are the number of cycles under S i at level i and the fatigue life at that load level, respectively.
Ye and Wang [16] found that the static toughness of mechanical property parameters changed significantly during damage evolution and static toughness reduction, reflecting the inherent energy absorption capacity of the material. Based on the depletion and dissipation of static toughness and cyclic plastic strain energy during fatigue evolution, a fatigue dissipation model based on static toughness and cyclic plastic strain energy is proposed:
D = 1 ln N ln 1 n N
where n represents the current number of cycles, and N denotes the fatigue life.
The model reflects the decreasing trend of the mechanical behavior of the material and has better performance in life prediction and damage accumulation; however, the effect of load interaction is not taken into account under variable-amplitude cyclic loading. Lv [26] modified the model by introducing a load interaction term σ i / σ max , which can provide more accurate predictions, and gave the model:
D = 1 ln N ln 1 n N σ i σ max
The experimentally determined characterization of the change in static toughness after fatigue, which approximately follows a logarithmic law with the rate of change varying with the applied stress level and the number of cycles, can generally be set up as an expression describing the depletion of static toughness:
U T N = A B e n N f α
where U T N is the static toughness of the material for pre-fatigue n cycles, and A and B are material parameters.
Equation (13) requires the following conditions to be met:
When n = 0, U T N = U T 0 ;
When n = N − 1, U T N 0 .
Thus Equation (13) can be expressed as:
U T N = U T 0 e e 1 1 e 1 e n N f α
where α is a parameter related to the material and load.
Fatigue damage can be expressed in terms of static toughness dissipation by the following equation:
D n = 1 U T n U T 0
Substituting Equation (14) into Equation (15) yields:
D n = e n N f α 1 e 1
According to Equation (16), the rate of decrease in static toughness of a material is related to the magnitude of the α value. Also, according to the fatigue properties of the material, the rate of decline of static toughness is positively related to the load level and negatively related to the fatigue life of the material. Therefore, the α value is positively related to the fatigue life of the material. Therefore, Chen [27] suggested to calculate the value of α according to Equation (17):
α = ln N f E
where E is the modulus of elasticity of the material in GPa.
In the case of two-stage loading, such as Figure 7a, the cumulative damage of the first stage under S 1 loading reaches point A. According to Equation (16), the calculation of the cumulative damage D n 1 at point A can be expressed as:
D n 1 = e n 1 N f 1 α 1 1 e 1
Similarly, the cumulative damage D n 12 at point B is:
D n 12 = e n 12 N f 2 α 12 1 e 1
The cumulative damage at points A and B are equal when load interactions are not considered, there:
D n 1 = D n 12
Joint Equations (18)–(20) is obtained:
n 2 n f 2 = 1 n 12 n f 2 = 1 n 1 n f 1 α 1 α 2
The current formulation omits the loading sequence effect in cumulative damage conversion processes. For non-equivalent damage accumulation scenarios (Figure 8a), Equation (21) can be extended through sequential loading factor ( δ ) integration:
n 2 n f 2 = 1 n 1 n f 1 α 1 α 2 S 2 S 1 = 1 n 1 n f 1 δ δ = α 1 α 2 S 2 S 1

4. Discussion

The predictive accuracy of the proposed model was validated against experimental datasets. Comparative analysis with established methodologies—including Miner’s law, Ye’s model [24], and the static toughness dissipation model (excluding load interaction effects)—was conducted to assess relative performance. As summarized in Table 5, prediction errors were quantified through the normalized discrepancy metric defined in Equation (23) [28], with all statistical measures derived from experimental trials.
e r r o r = log ( n p ) log n t
where n t is the experimentally obtained residual fatigue life and n p is the residual fatigue life predicted by the model.
Comparative analysis of model predictions versus experimental results is presented in Figure 9, with subfigures (a) and (b) representing high-low and low-high loading sequences respectively. Under high-low sequential loading (Figure 9a), Miner’s law—as a linear cumulative damage model—demonstrates the poorest predictive accuracy (mean error: 0.384). The proposed nonlinear model achieves superior performance, with all predictions except one outlier falling within the twofold error tolerance band. Conversely, all models maintain acceptable precision for low-high loading sequences (Figure 9b), indicating sequence-dependent damage accumulation plays diminished role under escalating load conditions.
Figure 10 compares prediction errors of residual life estimation models for GH4169 superalloy, with errors quantified according to Equation (23). Under high-to-low loading sequences, the linear model exhibits significantly higher errors compared to nonlinear cumulative damage frameworks, while the proposed model demonstrates superior accuracy with outcomes aligning most closely with experimental results. For low-to-high loading sequences, competing models yield comparable error magnitudes, reflecting reduced sensitivity to load-path variations in this configuration.
The proposed model requires only two material parameters: Young’s modulus and low-cycle fatigue (LCF) life. Numerical validation demonstrates its prediction error constitutes 40% of Miner’s law under high-low load conditions. Consequently, the model demonstrates significantly improved accessibility, requiring far fewer parameters and markedly reduced computational resources compared to traditional methods, as validated through comprehensive efficiency evaluations.

5. Conclusions

The accurate prediction of fatigue life for materials and structures under variable amplitude loading remains a critical challenge. To address this limitation, variable amplitude fatigue testing was performed on GH4169 superalloy specimens. By integrating these experimental findings with material static toughness degradation analysis, we developed a nonlinear fatigue damage accumulation model that systematically incorporates loading sequence effects inherent to variable amplitude loading conditions. This model demonstrates superior competence in predicting residual life under multi-stage loading scenarios compared to conventional methodologies.
(1).
Strain-controlled variable-amplitude LCF testing conducted on GH4169 revealed distinct damage accumulation behaviors: two-stage high-low loading sequences exhibited cumulative damage values below 1 (with a maximum of 0.73), whereas low-high loading sequences resulted in values marginally exceeding this threshold, ranging from 0.91 to 1.3.
(2).
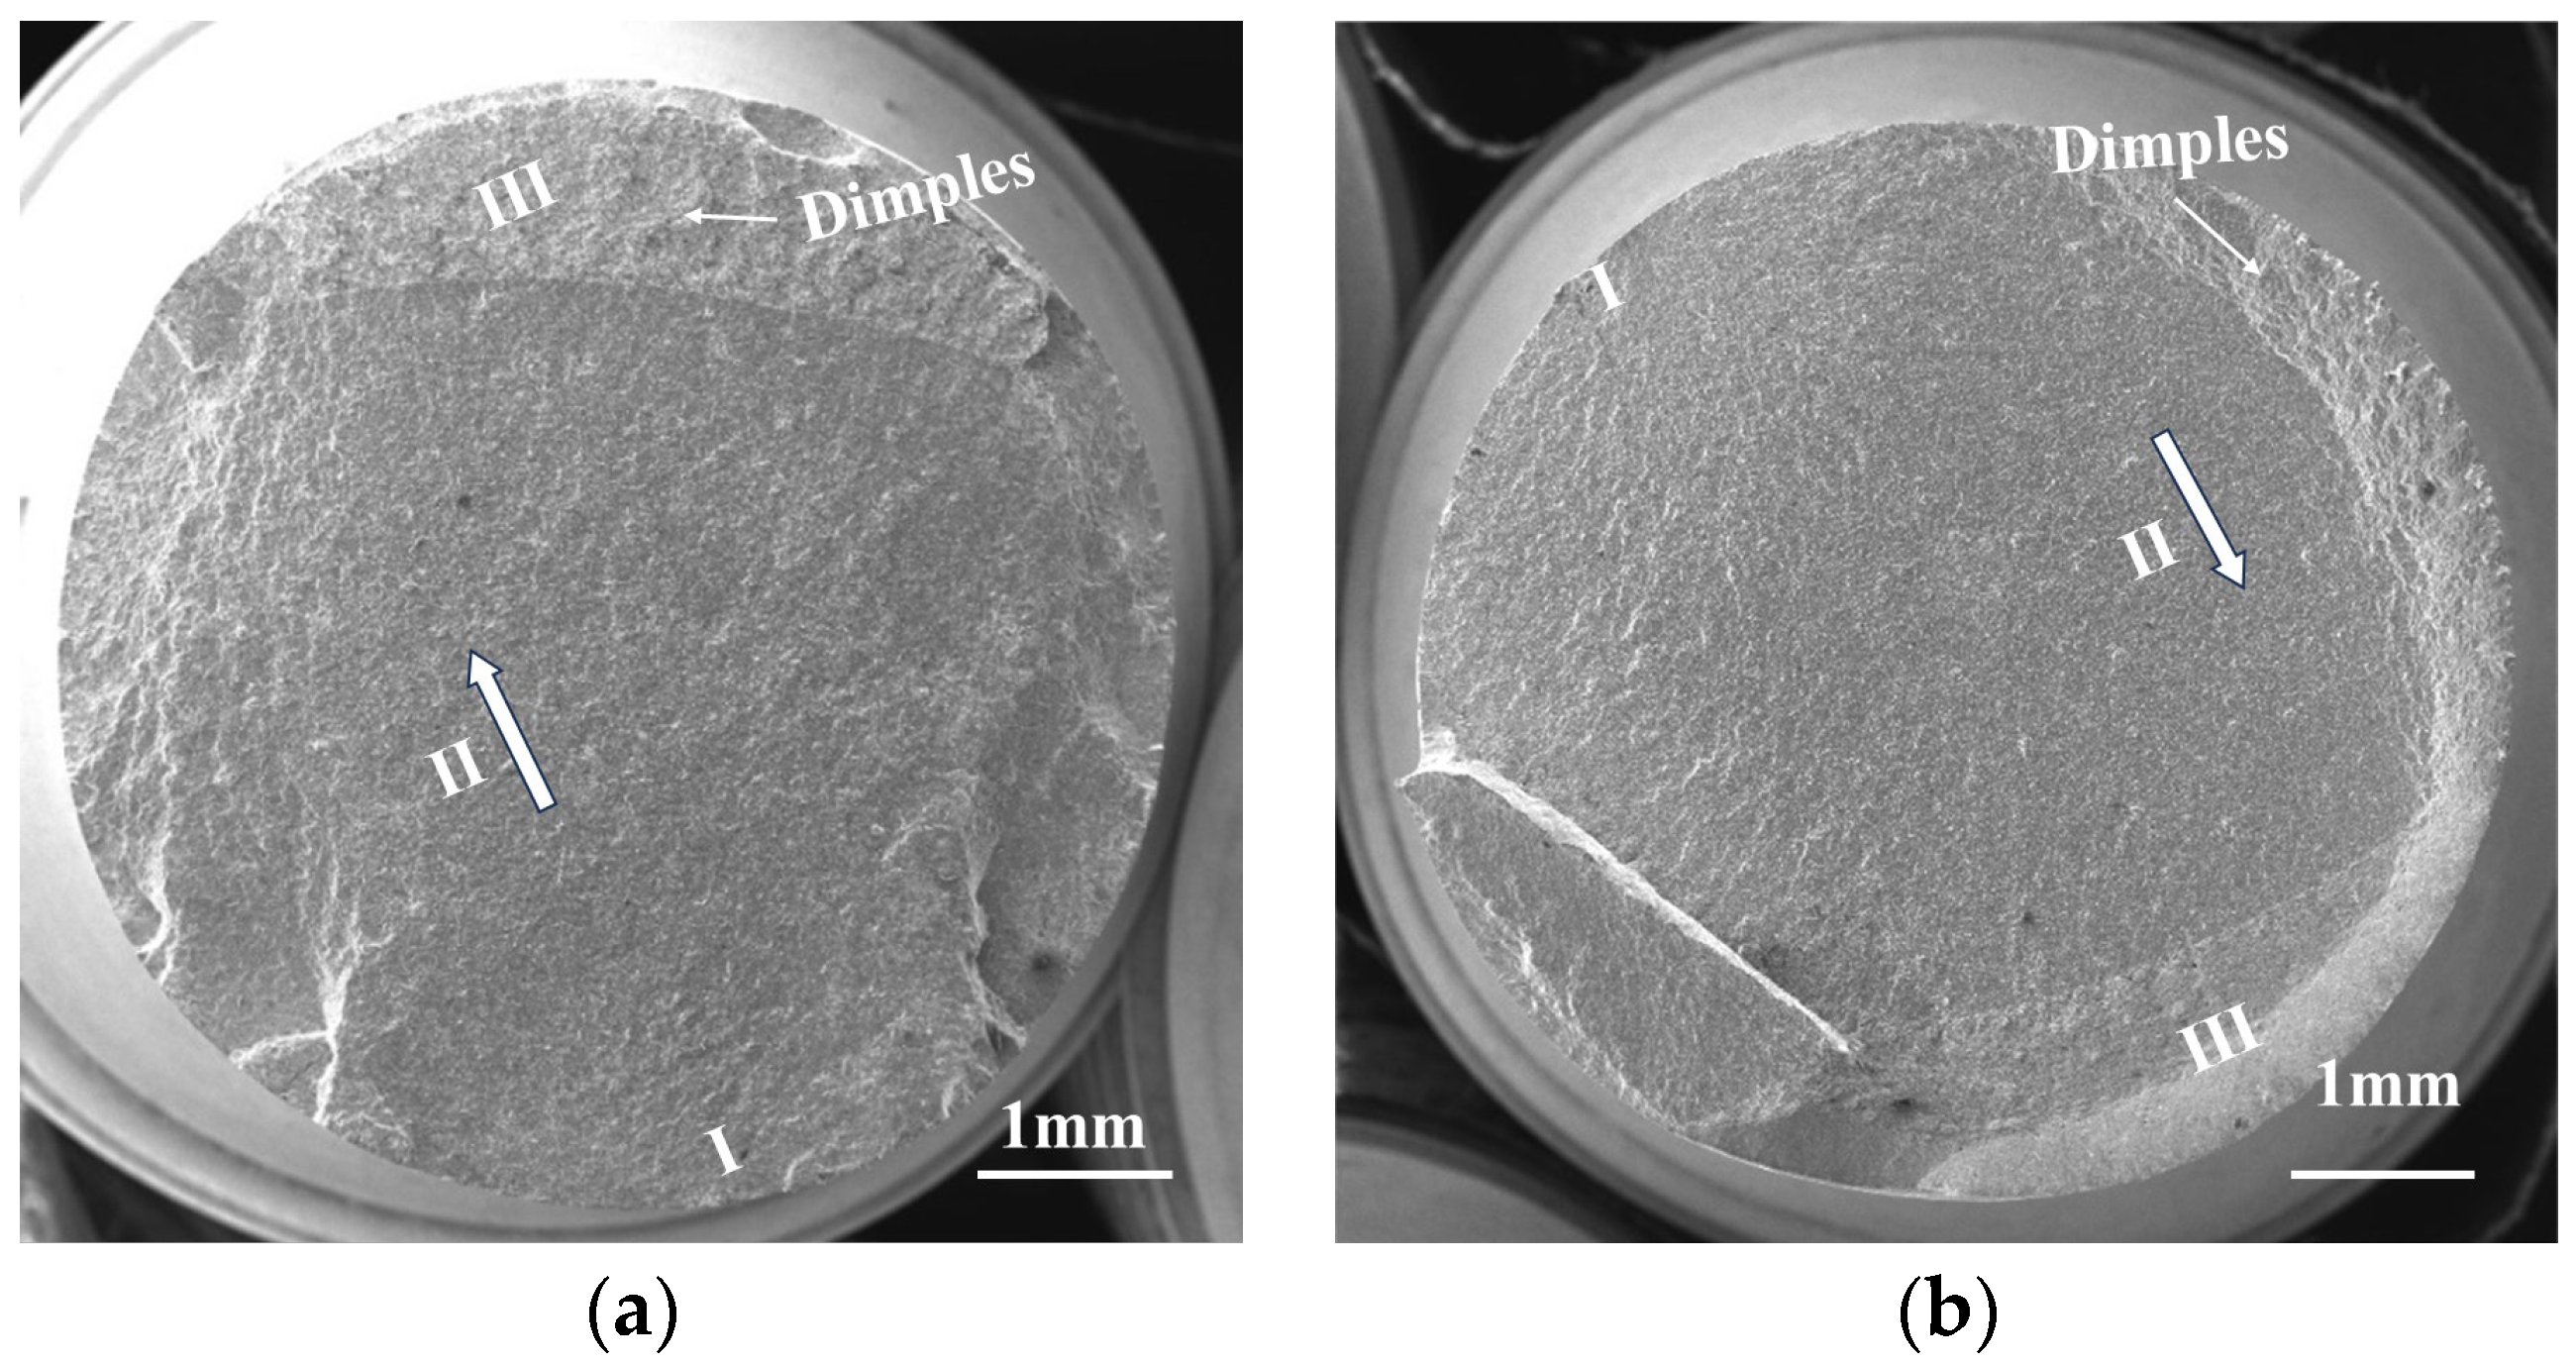
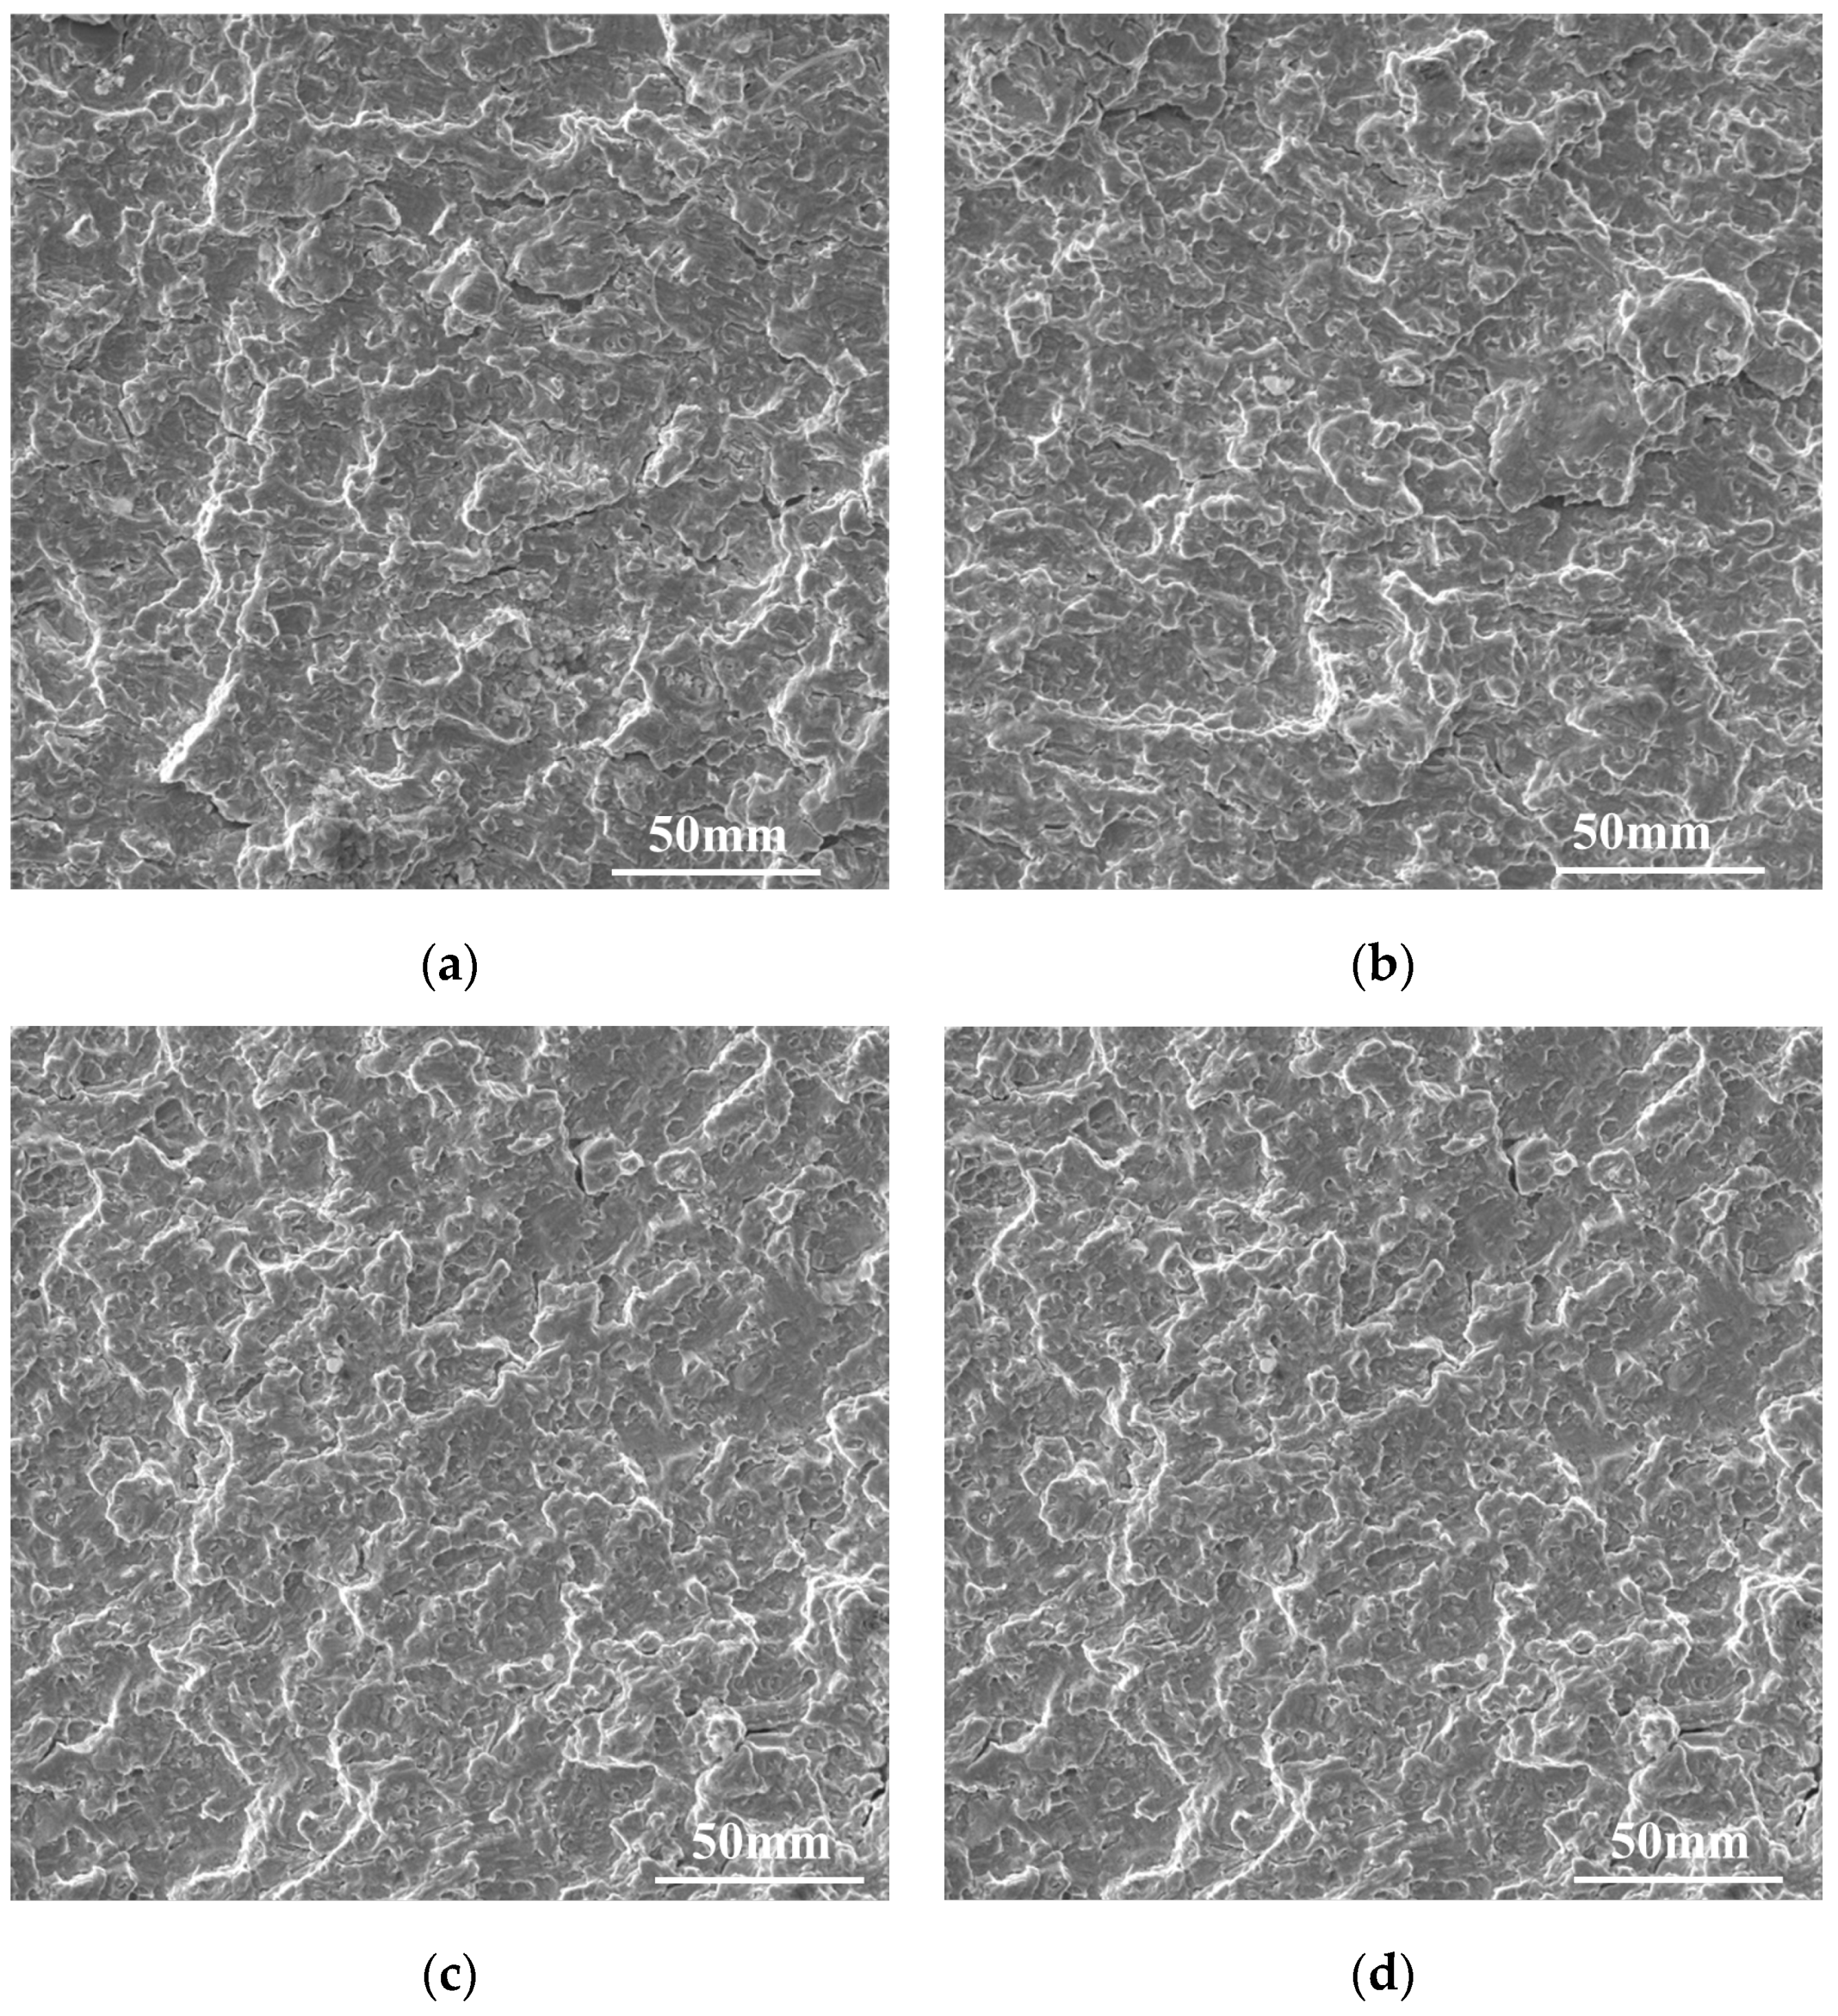
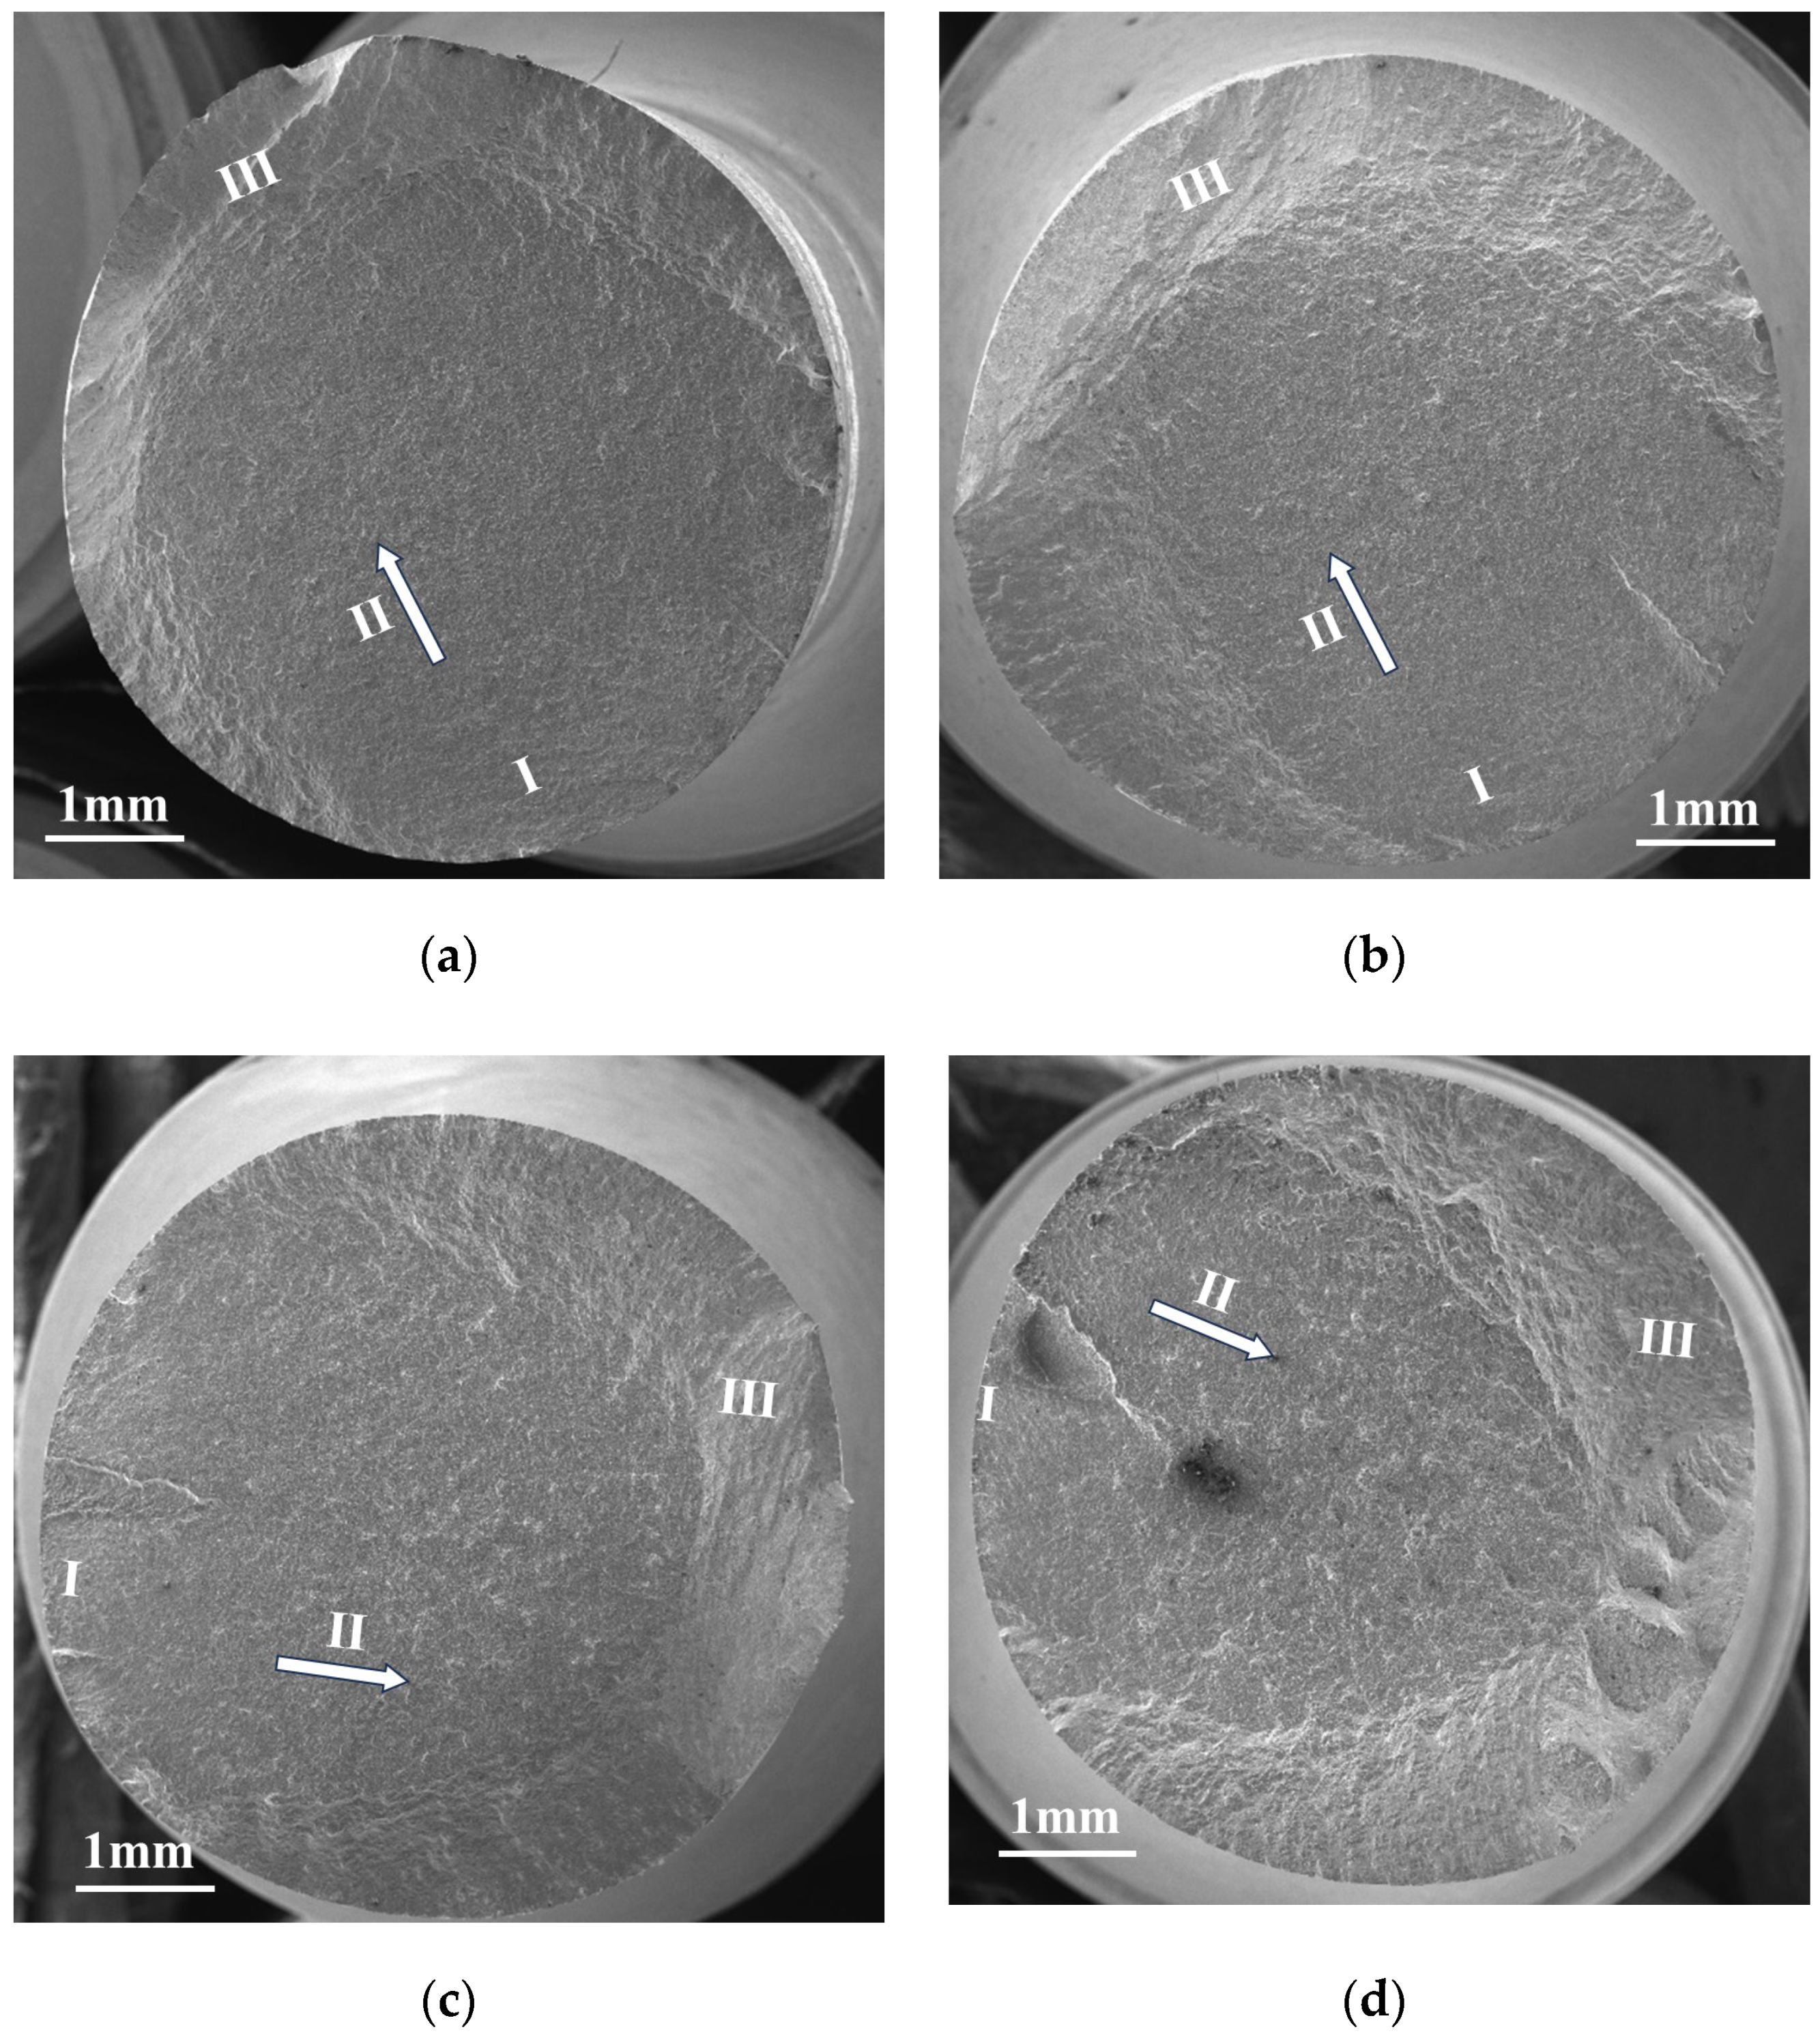
The microstructural evolution of specimen fractures was observed and analyzed under different variable-amplitude loading sequences. It was found that the fracture microstructure exhibits minimal changes during both the initial and final stages of the crack propagation phase under high-low loading sequences. This phenomenon can be attributed to two primary mechanisms: First, the high-load phase elevates the material’s damage state, leading to an amplified damage effect during subsequent low-load application. Second, under low-high loading sequences, the strengthening effect induced by low-load cycling (compared to high-load conditions) creates greater resistance to damage accumulation as loading intensity increases. Consequently, the microstructure demonstrates more pronounced defect formation compared to conventional loading patterns.
(3).
A novel life prediction model incorporating loading sequence effects was developed based on damage evolution equations and the damage equivalence principle for materials under constant-amplitude loading. The proposed model offers distinct advantages over existing counterparts: simplified implementation procedures while maintaining reasonable prediction accuracy, making it particularly suitable for engineering applications.
(4).
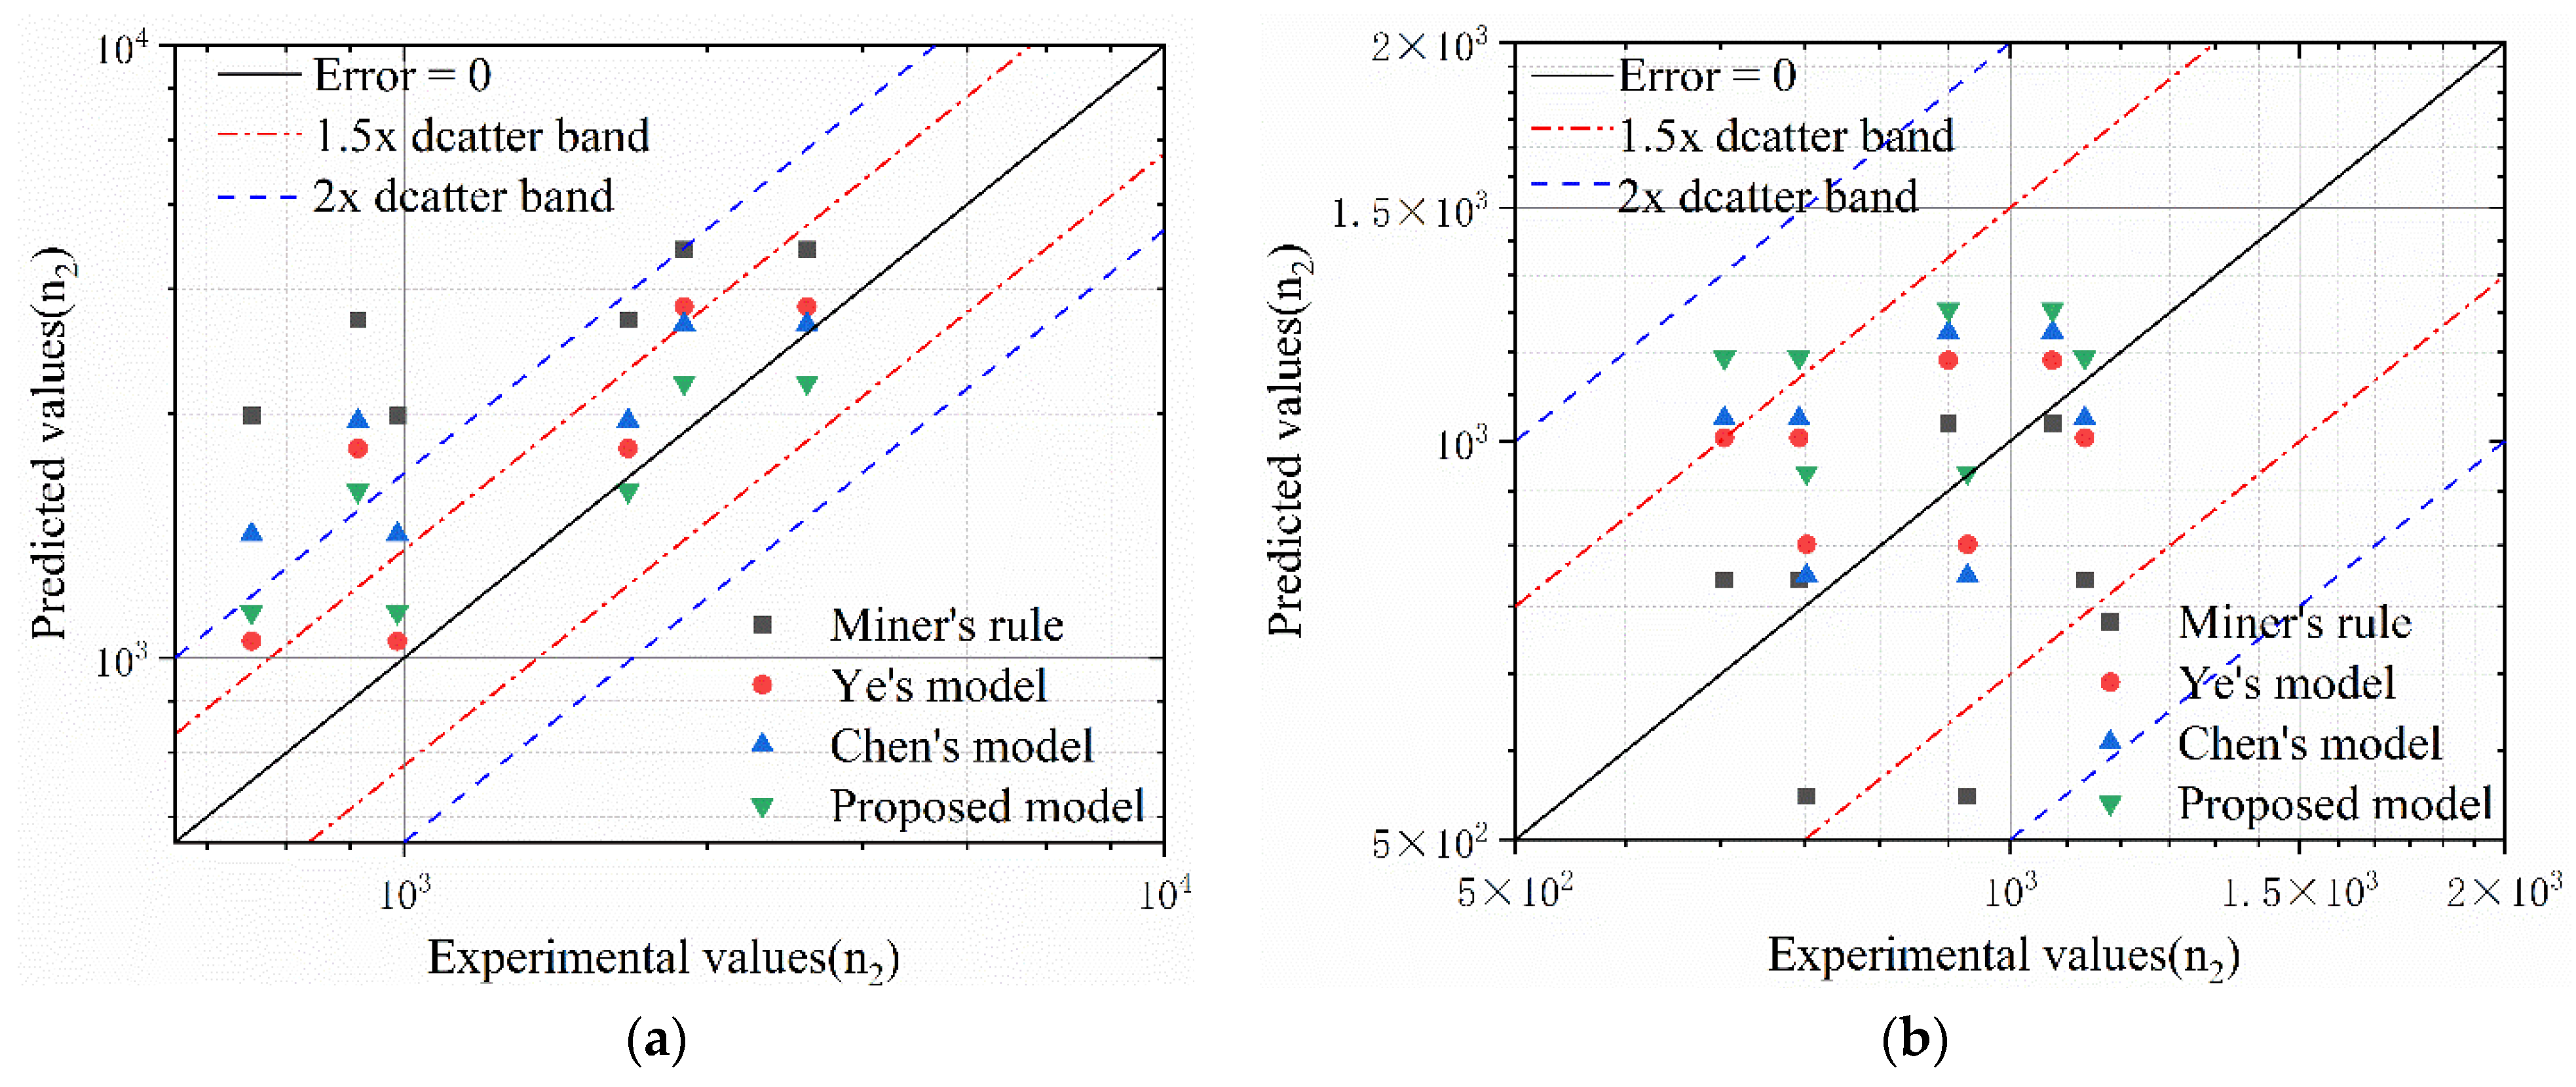
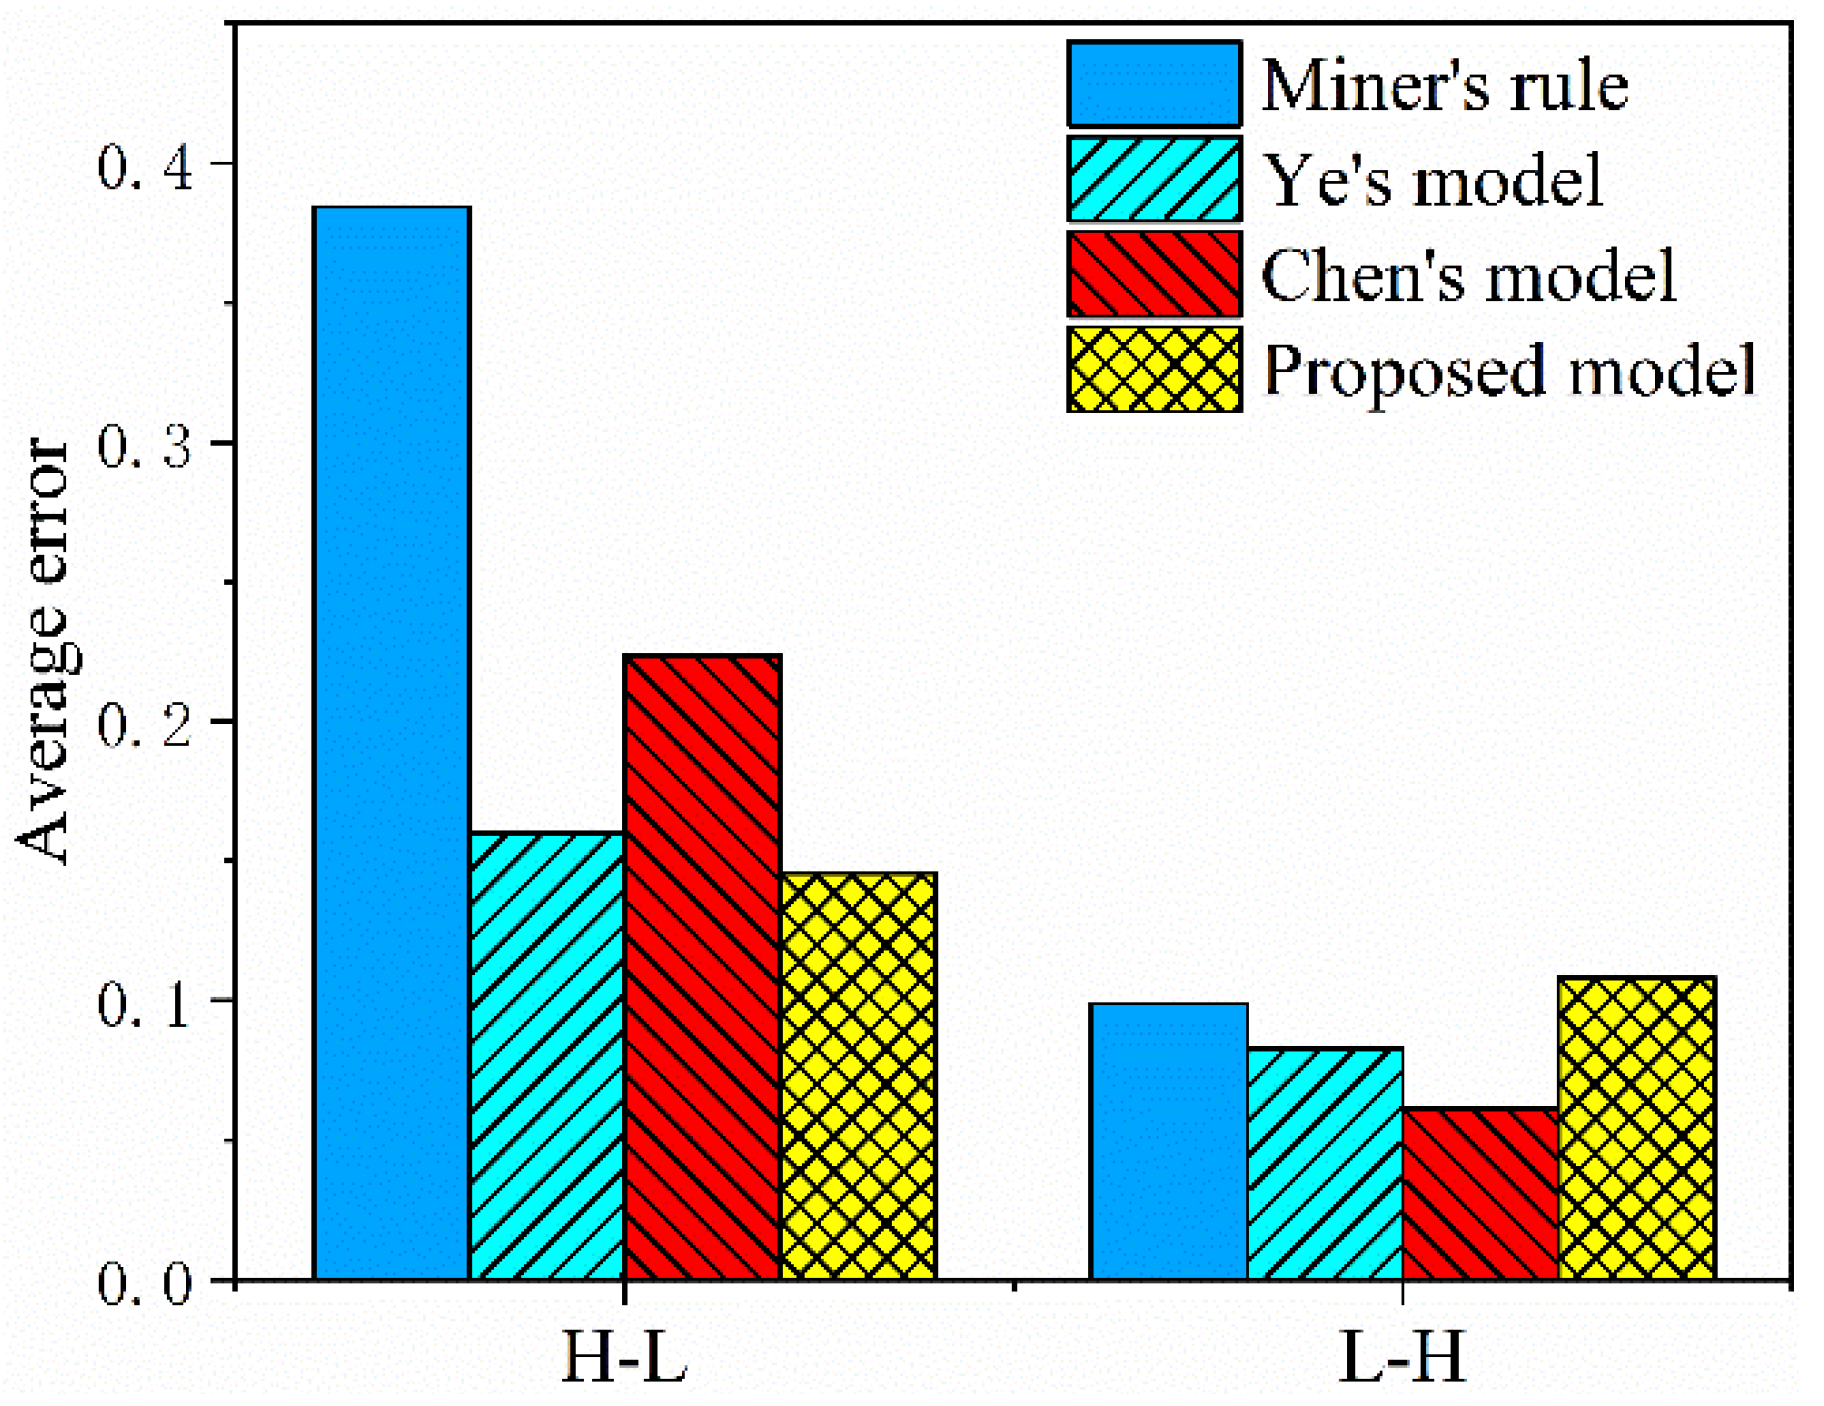
Experimental validation using multiple predictive models demonstrated that the proposed framework achieved superior fitting accuracy for LCF test results. Compared to Chen’s model (which neglects load interaction effects), our model reduced prediction errors under high-low load interactions to 0.164 (the best among the four models), while low-high loading errors reached 0.108. Notably, most predictions resided within the twofold-error tolerance band.

Author Contributions

Conceptualization, Q.Y.; Funding acquisition, Q.Y.; Investigation, Y.D.; Methodology, Y.D.; Project administration, Q.Y.; Resources, J.S. and C.J.; Supervision, J.S. and C.J.; Writing—original draft, Y.D.; Writing—review & editing, J.S. and Q.Y. All authors have read and agreed to the published version of the manuscript.

Funding

This research was funded by China Ocean Innovation Fund (COIF) (Grant No. JJ-2021-703-27); Joint Funds of the National Natural Science Foundation of China (“Ye Qisun” Science Funds, Grant No. U2241251).

Data Availability Statement

The data used to support the findings of this study are included within the article.

Conflicts of Interest

The authors declare that they have no known competing financial interests or personal relationships that could have appeared to influence the work reported in this paper.

References

  1. Liu, P.; Wang, X.; Shen, Q.; Guo, H.; Wang, Y.; Sun, Y. A nonlinear cumulative fatigue damage life prediction model under combined cycle fatigue loading considering load interaction. Int. J. Fatigue 2023, 177, 107972. [Google Scholar] [CrossRef]
  2. Ye, D.; Wang, Z. A new approach to low-cycle fatigue damage based on exhaustion of static toughness and dissipation of cyclic plastic strain energy during fatigue. Int. J. Fatigue 2001, 23, 679–687. [Google Scholar]
  3. Zhang, W.; Wang, X.; Li, X.; Gong, J.; Wahab, M.A. Influence of prior low cycle fatigue on microstructure evolution and subsequent creep behavior. Int. J. Fatigue 2018, 109, 114–125. [Google Scholar] [CrossRef]
  4. Ahiale, G.K.; Choi, W.; Cho, S.; Park, Y.-H.; Chun, Y.-B.; Oh, Y.-J. Low-cycle fatigue behavior of reduced activation ferritic-martensitic steel at elevated temperatures. Met. Mater. Int. 2022, 29, 71–80. [Google Scholar] [CrossRef]
  5. Ni, K.; Zhang, S. Fatigue reliability analysis under two-stage loading. Reliab. Eng. Syst. Saf. 2000, 68, 153–158. [Google Scholar] [CrossRef]
  6. Miner, M.A. Cumulative damage in fatigue. J. Appl. Mech. Tech. Phys. 1945, 12, A159–A164. [Google Scholar] [CrossRef]
  7. Li, H.W.X.; Chelidze, D. Fatigue life estimation of structures under statistically and spectrally similar variable amplitude loading. Mech. Syst. Signal Process. 2021, 161, 107856. [Google Scholar] [CrossRef]
  8. Cheng, G.; Plumtree, A. A fatigue damage accumulation model based on continuum damage mechanics and ductility exhaustion. Int. J. Fatigue 1998, 20, 495–501. [Google Scholar] [CrossRef]
  9. Liu, Q.; Gao, Y.; Li, Y.; Xue, Q. Fatigue life prediction based on a novel improved version of the Corten-Dolan model considering load interaction effect. Eng. Struct. 2020, 221, 111036. [Google Scholar] [CrossRef]
  10. Zhang, L.; Jin, J.; Zhou, W.; Li, W.-L.; Qiao, M. A nonlinear fatigue damage model based on equivalent transformation of stress. J. Eng. 2021, 2021, 5581307. [Google Scholar] [CrossRef]
  11. Gan, L.; Wu, H.; Zhong, Z. Estimation of remaining fatigue life with an energy-based model considering the effects of loading sequence and load interaction. Int. J. Damage Mech. 2023, 32, 340–361. [Google Scholar] [CrossRef]
  12. Zhu, S.P.; Liao, D.; Liu, Q.; Correia, J.A.; De Jesus, A.M. Nonlinear fatigue damage accumulation: Isodamage curve-based model and life prediction aspects. Int. J. Fatigue 2019, 128, 10518. [Google Scholar] [CrossRef]
  13. Wang, B.; Xue, Q. Nonlinear fatigue life prediction models based on material damage state correction. J. Mech. Sci. Technol. 2021, 35, 5477–5487. [Google Scholar] [CrossRef]
  14. Li, H.; Liu, Y.; He, X.; Yin, W. New nonlinear cumulative fatigue damage model based on ecological quality dissipation of materials. Int. J. Aerosp. Eng. 2021, 2021, 5555812. [Google Scholar] [CrossRef]
  15. Zhao, G.; Liu, Y.; Ye, N. An improved fatigue accumulation damage model based on load interaction and strength degradation. Int. J. Fatigue 2022, 156, 106636. [Google Scholar] [CrossRef]
  16. Ye, D.; Wang, Z. An approach to investigate pre-nucleation fatigue damage of cyclically loaded metals using Vickers microhardness tests. Int. J. Fatigue 2001, 23, 85–91. [Google Scholar] [CrossRef]
  17. Hectors, K.; De Waele, W. Cumulative damage and life prediction models for high-cycle fatigue of metals: A review. Metals 2021, 11, 204. [Google Scholar] [CrossRef]
  18. Zhou, J.; Huang, H.-Z.; Barnhart, M.V.; Huang, G.; Li, Y.-F. A novel non-linear cumulative fatigue damage model based on the degradation of material memory. Int. J. Damage Mech. 2019, 29, 610–625. [Google Scholar] [CrossRef]
  19. Chaboche, J.L. Constitutive equations for cyclic plasticity and cyclic viscoplasticity. Int. J. Plast. 1989, 5, 247–302. [Google Scholar] [CrossRef]
  20. Jean, L.; Dufailly, J. Damage measurements. Eng. Fract. Mech. 1987, 28, 643–661. [Google Scholar]
  21. Rotem, A. Residual strength after fatigue loading. Int. J. Fatigue 1988, 10, 27–31. [Google Scholar] [CrossRef]
  22. Pineau, A.; Mcdowell, D.L.; Busso, E.P.; Antolovich, S.D. Failure of metals II: Fatigue. Acta Mater. 2016, 107, 484–507. [Google Scholar] [CrossRef]
  23. Bhattacharya, B.; Ellingwood, B. A new CDM-based approach to structural deterioration. Int. J. Solids Struct. 1999, 36, 1757–1779. [Google Scholar] [CrossRef]
  24. Krajcinovic, D. Damage mechanics: Accomplishments, trends and needs. Int. J. Solids Struct. 2000, 37, 267–277. [Google Scholar] [CrossRef]
  25. GB/T 40303-2021; General Specification for GH4169 Alloy Bars. Standardization Administration of China: Beijing, China, 2021.
  26. Benkabouche, S.; Guechichi, H.; Amrouche, A.; Benkhettab, M. A modified nonlinear fatigue damage accumulation model under multiaxial variable amplitude loading. Int. J. Mech. Sci. 2015, 100, 180–194. [Google Scholar] [CrossRef]
  27. Chen, H.; Yang, F.; Wu, Z.; Yang, B.; Huo, J. A nonlinear fatigue damage accumulation model under variable amplitude loading considering the loading sequence effect. Int. J. Fatigue 2023, 177, 107945. [Google Scholar] [CrossRef]
  28. Ince, A.; Glinka, G. A modification of Morrow and Smith-Watson-Topper mean stress correction models. Fatigue Fract. Eng. Mater. Struct. 2011, 34, 854–867. [Google Scholar] [CrossRef]
Figure 1. Schematic diagram of fatigue specimen.
Processes 13 01477 g001
Figure 2. Non-variable load fatigue fracture morphology, (a) Δ ε / 2 = 0.7 % , (b) Δ ε / 2 = 0.5 % . (Ⅰ: Crack initiation zone; Ⅱ: Stable propagation region; Ⅲ: Final rupture area).
Processes 13 01477 g002
Figure 3. Microstructure of crack extension stage, (a) Δ ε / 2 = 0.7 % initial phase (b) Δ ε / 2 = 0.7 % later phase, (c) Δ ε / 2 = 0.5 % initial phase (d) Δ ε / 2 = 0.5 % later phase.
Processes 13 01477 g003
Figure 4. Variable load fatigue fracture morphology (a) H-L n1 = 720, (b) H-L n1 = 240, (c) L-H n1 = 3300, (d) L-H n1 = 1100. (Ⅰ: Crack initiation zone; Ⅱ: Stable propagation region; Ⅲ: Final rupture area).
Processes 13 01477 g004
Figure 5. Microstructure of crack extension stage (a) initial stage, H-L, n1 = 720 (b) final stage, H-L, n1 = 720 (c) initial stage, H-L, n1 = 240 (d) final stage, H-L, n1 = 240.
Processes 13 01477 g005
Figure 6. Microstructure of crack extension stage (a) initial stage, L-H, n1 = 3300 (b) final stage, L-H, n1 = 3300 (c) initial stage, L-H, n1 = 1100 (d) final stage, L-H, n1 = 1100.
Processes 13 01477 g006
Figure 7. Fatigue damage accumulation curves without considering the effect of loading sequence. (a) High-low load loading; (b) Low-high load loading.
Processes 13 01477 g007
Figure 8. Fatigue damage accumulation curve considering the effect of loading sequence. (a) High-low load loading; (b) Low-high load loading.
Processes 13 01477 g008
Figure 9. Predicted versus experimental fatigue life for GH4169 superalloy across two-stage loading conditions. (a) GH4169(H-L); (b) GH4169(L-H).
Processes 13 01477 g009
Figure 10. Predictive accuracy comparison of residual life models under two-stage variable loading conditions.
Processes 13 01477 g010
Table 1. Basic chemical composition of GH4169 (wt%) [25].
ElementNi CrNbMoTiAlCFe
Content/(wt%)50.0~55.017.00~21.004.75~5.50 2.80~3.30 0.75~1.150.30~0.700.015~0.060 Rest
CoSiMnCuTaP SMgB
≤1.00≤0.35≤0.35≤0.30≤0.10≤0.015≤0.015≤0.01≤0.006
Table 2. Basic mechanical properties of GH4169 [25].
Temperature (°C) σ b MPa σ p 0.2 MPa δ 0.5 % ψ %
room temperature≥1275≥1035≥12≥15
650≥1000≥860≥12≥15
Table 3. Low cycle fatigue test results.
Strain Δ ε / 2 /%0.90.80.80.80.70.70.70.70.50.50.5
Fatigue life/n1375527107961433100512021200672935646734
Table 4. Variable-load low-cycle fatigue test matrix and experimental results.
Loading SequenceExperimental DataDamage Calculation for Each Stage
H-L
( Δ ε 1 / 2 = 0.7 %
Δ ε 2 / 2 = 0.5 % )
n 1 n 2 D 1 = n 1 / N f 1 D 2 = n 2 / N f 2 D = D 1 + D 2
7206300.5630.1100.673
7209800.5630.1710.734
4808700.3750.1520.527
48019700.3750.3450.720
24033870.1870.5930.781
24023350.1870.4090.596
L-H
( Δ ε 1 / 2 = 0.5 %
Δ ε 2 / 2 = 0.7 % )
33007520.5780.5881.166
33009420.5780.7361.315
22006700.3850.5240.909
22007440.3850.5820.967
220011100.3850.8681.253
11009170.1920.7170.910
110010610.1920.8291.022
Table 5. Experimental and predicted data of GH4169 under 2-stage loading.
Loading SequenceExperimental DataPredicted Data
Miner’s RuleYe’s ModelChen’s ModelProposed Model
S ( % ) n 1 t n 1 t / N 1 t n 2 t n 2 p n 2 p n 2 p n 2 p
H-L7200.5636302492106415881186
7200.5639802492106415881186
4800.3758703563219724361872
4800.37519703563219724361872
2400.18733874634374335012813
2400.18723354634374335012813
mean error0.3840.1600.2240.145
L-H33000.578752538834790946
33000.578942538834790946
22000.385670785100510391155
22000.385744785100510391155
22000.3851110785100510391155
11000.1929171031115012071256
11000.19210611031115012071256
mean error0.0990.0830.0610.108
Disclaimer/Publisher’s Note: The statements, opinions and data contained in all publications are solely those of the individual author(s) and contributor(s) and not of MDPI and/or the editor(s). MDPI and/or the editor(s) disclaim responsibility for any injury to people or property resulting from any ideas, methods, instructions or products referred to in the content.

