Article

A Generic Fracture Conductivity Model for Partially Propped Fracture Networks with Proppant Embedment and Proppant Pack Deformation

1
Shengli Oilfield Petroleum Exploitation Center, Sinopec, Dongying 257000, China
2
State Key Laboratory of Oil and Gas Reservoir Geology and Exploitation, Southwest Petroleum University, Chengdu 610500, China
*
Authors to whom correspondence should be addressed.
Processes 2025, 13(5), 1462; https://doi.org/10.3390/pr13051462
Submission received: 27 March 2025 / Revised: 4 May 2025 / Accepted: 9 May 2025 / Published: 10 May 2025

Abstract

Hydraulic fracturing involving proppant injection is currently the most effective technology to stimulate tight, unconventional reservoirs. The conductivity offered by the created propped and unpropped fracture segments is directly linked to the well deliverability. The accurate modeling of the fracture network conductivity is key to well performance prediction. Unlike most previous studies that have focused on the single-fracture conductivity, a comprehensive fracture network conductivity model was developed by incorporating more complex rock and proppant deformation mechanisms and integrating the conductivity of different propped and unpropped fracture segments through hydraulic–electric analogies. Specifically, for propped fracture segments, the proppant pack permeability was described by simultaneously considering the viscous shear from fracture walls, stress sensitivity, and multiple- or single-proppant-layer placement, while the dynamic width was controlled through proppant pack compaction and proppant embedment. In unpropped fracture segments, as self-supported fracture surface deformation changes the fracture compressibility, the stress-dependent compressibility was utilized to depict the dynamic width. The developed propped and unpropped fracture conductivity models were separately verified against experimental measurement data. Through the hydraulic–electric analogies, a new partially propped fracture network conductivity model was established. For propped fracture segments, an increase in the proppant pack compressibility significantly reduced the fracture conductivity, particularly under high-stress conditions. A larger initial propped fracture aperture offered higher fracture conductivity under identical stress conditions. For single-layer propped fractures, a decrease in the fracture surface elastic modulus from 15 GPa to 10 GPa slightly reduced the fracture conductivity due to greater proppant embedment. For unpropped fractures, a larger compressibility reduction rate (lower fracture compressibility) led to better fracture conductivity maintenance. The fracture network conductivity was dominated by the unpropped fracture segment conductivity when the unpropped length reached 45.5% of the total fracture network length.

1. Introduction

Tight, unconventional reservoirs normally require massive hydraulic fracturing to create high-conductivity fractures or fracture networks and facilitate hydrocarbon extraction. Hydraulic fracturing has become a “game-changer” for unconventional oil and gas resource development [1]. During hydraulic fracturing, proppants are injected to prevent fracture closure and maintain the fracture conductivity under compressive stresses [1]. The created fractures serve as conductive pathways for oil and gas to flow from the reservoir to the wellbore [2]. In proppant injection processes, it is almost impossible to prop the entire fracture domain due to proppant settlement [3]. As a result, the effectively propped fracture length is smaller than the created fracture length. In terms of fracture networks with fracture branches, it is difficult for proppants to enter the fracture branches, depending on the angles between the main fracture and fracture branches [4]. The ease of fluid flow in propped and unpropped fractures is crucial for the well production process [2]. The fluid–rock reaction during fracture propagation and proppant transport will influence the proppant placement pattern [5,6], resulting in three types of fracture segments: multi-layer propped, single-layer propped, and unpropped fracture segments. The above-mentioned fracture segment conductivity plays a pivotal role in the stimulation efficiency of hydraulic fracturing because it is directly linked to the well deliverability [7]. The changes in the fracture conductivity due to stress variations control the long-term well productivity [8].
Over the years, a lot of experimental work has been conducted, trying to understand the evolution in the behavior of the conductivity for different types of fractures [7,9,10,11]. Based on new insights on fracture conductivity variation obtained from laboratory tests, numerous theoretical models have been established to predict the fracture conductivity under different stress conditions. Van der Vlis et al. [12] summarized the empirical relations between the closure stress and fracture conductivity with a certain amount of accuracy. The impact of the fracture surface hardness and closure stress was discussed. Volk et al. [13] derived empirical equations for non-crushing proppant embedment into sandstone and shale rocks. The embedment curves for different monolayer proppant concentrations were plotted. Li et al. [14] provided an analytical fracture conductivity expression focusing on the impact of proppant embedment on the conductivity. Awoleke et al. [15] developed an empirical conductivity model and a semiempirical conductivity model involving proppant pack damage. Their models had good applicability for short-term fracture conductivity prediction. Zhang et al. [16] derived a shale fracture conductivity model incorporating the impacts of the proppant size, sorting, packing, crushing, rearrangement, and embedment. Their calculation results matched well with the fracture conductivity of shale after water damage. Zhu et al. [17] established a fracture conductivity model for channel fracturing where the proppant pillar deformation is nonlinear. They figured out the optimal ratio of the pillar diameter to the distance to achieve the maximum conductivity. Wu and Sharma [2] proposed a numerical model to capture the elastoplastic deformation of the rough fracture surface contact and found that the roughness and yield stress exhibited a greater influence on fracture closure compared to Young’s modulus. Liu et al. [18] derived a conductivity model for fractures with a single proppant layer formed of multi-sized proppants. Their results indicated that a higher proportion of large-sized proppants slows down the sharp conductivity decline. Similar theoretical research on the conductivity of proppant packs with different sizes of proppants was also performed [19,20]. Shamsi et al. [8] used the Lattice Boltzmann model and the discrete element method to analyze the propped fracture segment conductivity and evaluate its variation under different stress conditions. They stated that fractures with uniformly graded proppants offer higher permeability compared to that of a well-graded proppant pack. The interlocking effects of a well-graded proppant pack generate a strong bond that mitigates movement. Teng et al. [21] considered the influence of the fracture-wall-induced viscous shear on the propped fracture permeability. Their research showed that, based on the values of the Darcy parameters, the fluid flow in the proppant pack could be classified into viscous-shear-dominated flow, transient flow, and the flow dominated by Darcy’s law.
The above models are versatile enough to replicate and explain certain experimental observations. However, they mainly focus on one type of fracture’s conductivity without considering a combination of different fracture segments. More importantly, most of the previous studies have failed to comprehensively investigate the impacts of proppant embedment, proppant pack compaction, fracture-wall-induced viscous shear effects, and unpropped fracture compaction with stress-dependent compressibility on the fracture network permeability and conductivity. As shown in Figure 1, a fracture network usually contains a partially propped main fracture and unpropped or partially propped fracture branches. The fracture conductivity is defined as the fracture permeability times the fracture width. If the permeability and width of each fracture segment are obtained, the corresponding conductivity can be obtained. In this study, the following models and methods were utilized to derive a new propped fracture conductivity model and eventually establish a fracture network conductivity model: (1) Dynamic propped fracture width variation was induced through proppant embedment and proppant pack compaction. Proppant embedment was described using the Hertz contact theory [22], while the compaction-induced fracture width change was characterized using the proppant pack’s apparent mechanical properties and the poroelasticity theory. (2) The proppant pack permeability model was derived based on the Brinkman equation, which included the viscous shear effect from the fracture walls. The permeability model was a function of the propped fracture’s dynamic width and porosity. (3) The dynamic width of the unpropped fractures was calculated using the stress-dependent fracture compressibility because the compressibility changed during the rock bridge deformation of the rough fracture surfaces. (4) The unpropped fractures’ permeability was defined as a function of the fractures’ dynamic width. (5) As the fracture network consisted of propped and unpropped segments, the overall fracture network conductivity was calculated by integrating the conductivity of different fracture segments using hydraulic–electric analogies. The novelty of this model is that it involves complex fracture and proppant deformation mechanisms for different fracture segments and describes the fracture network conductivity based on hydraulic–electric analogies.

2. Model Development

2.1. Dynamic Propped Fracture Width Model

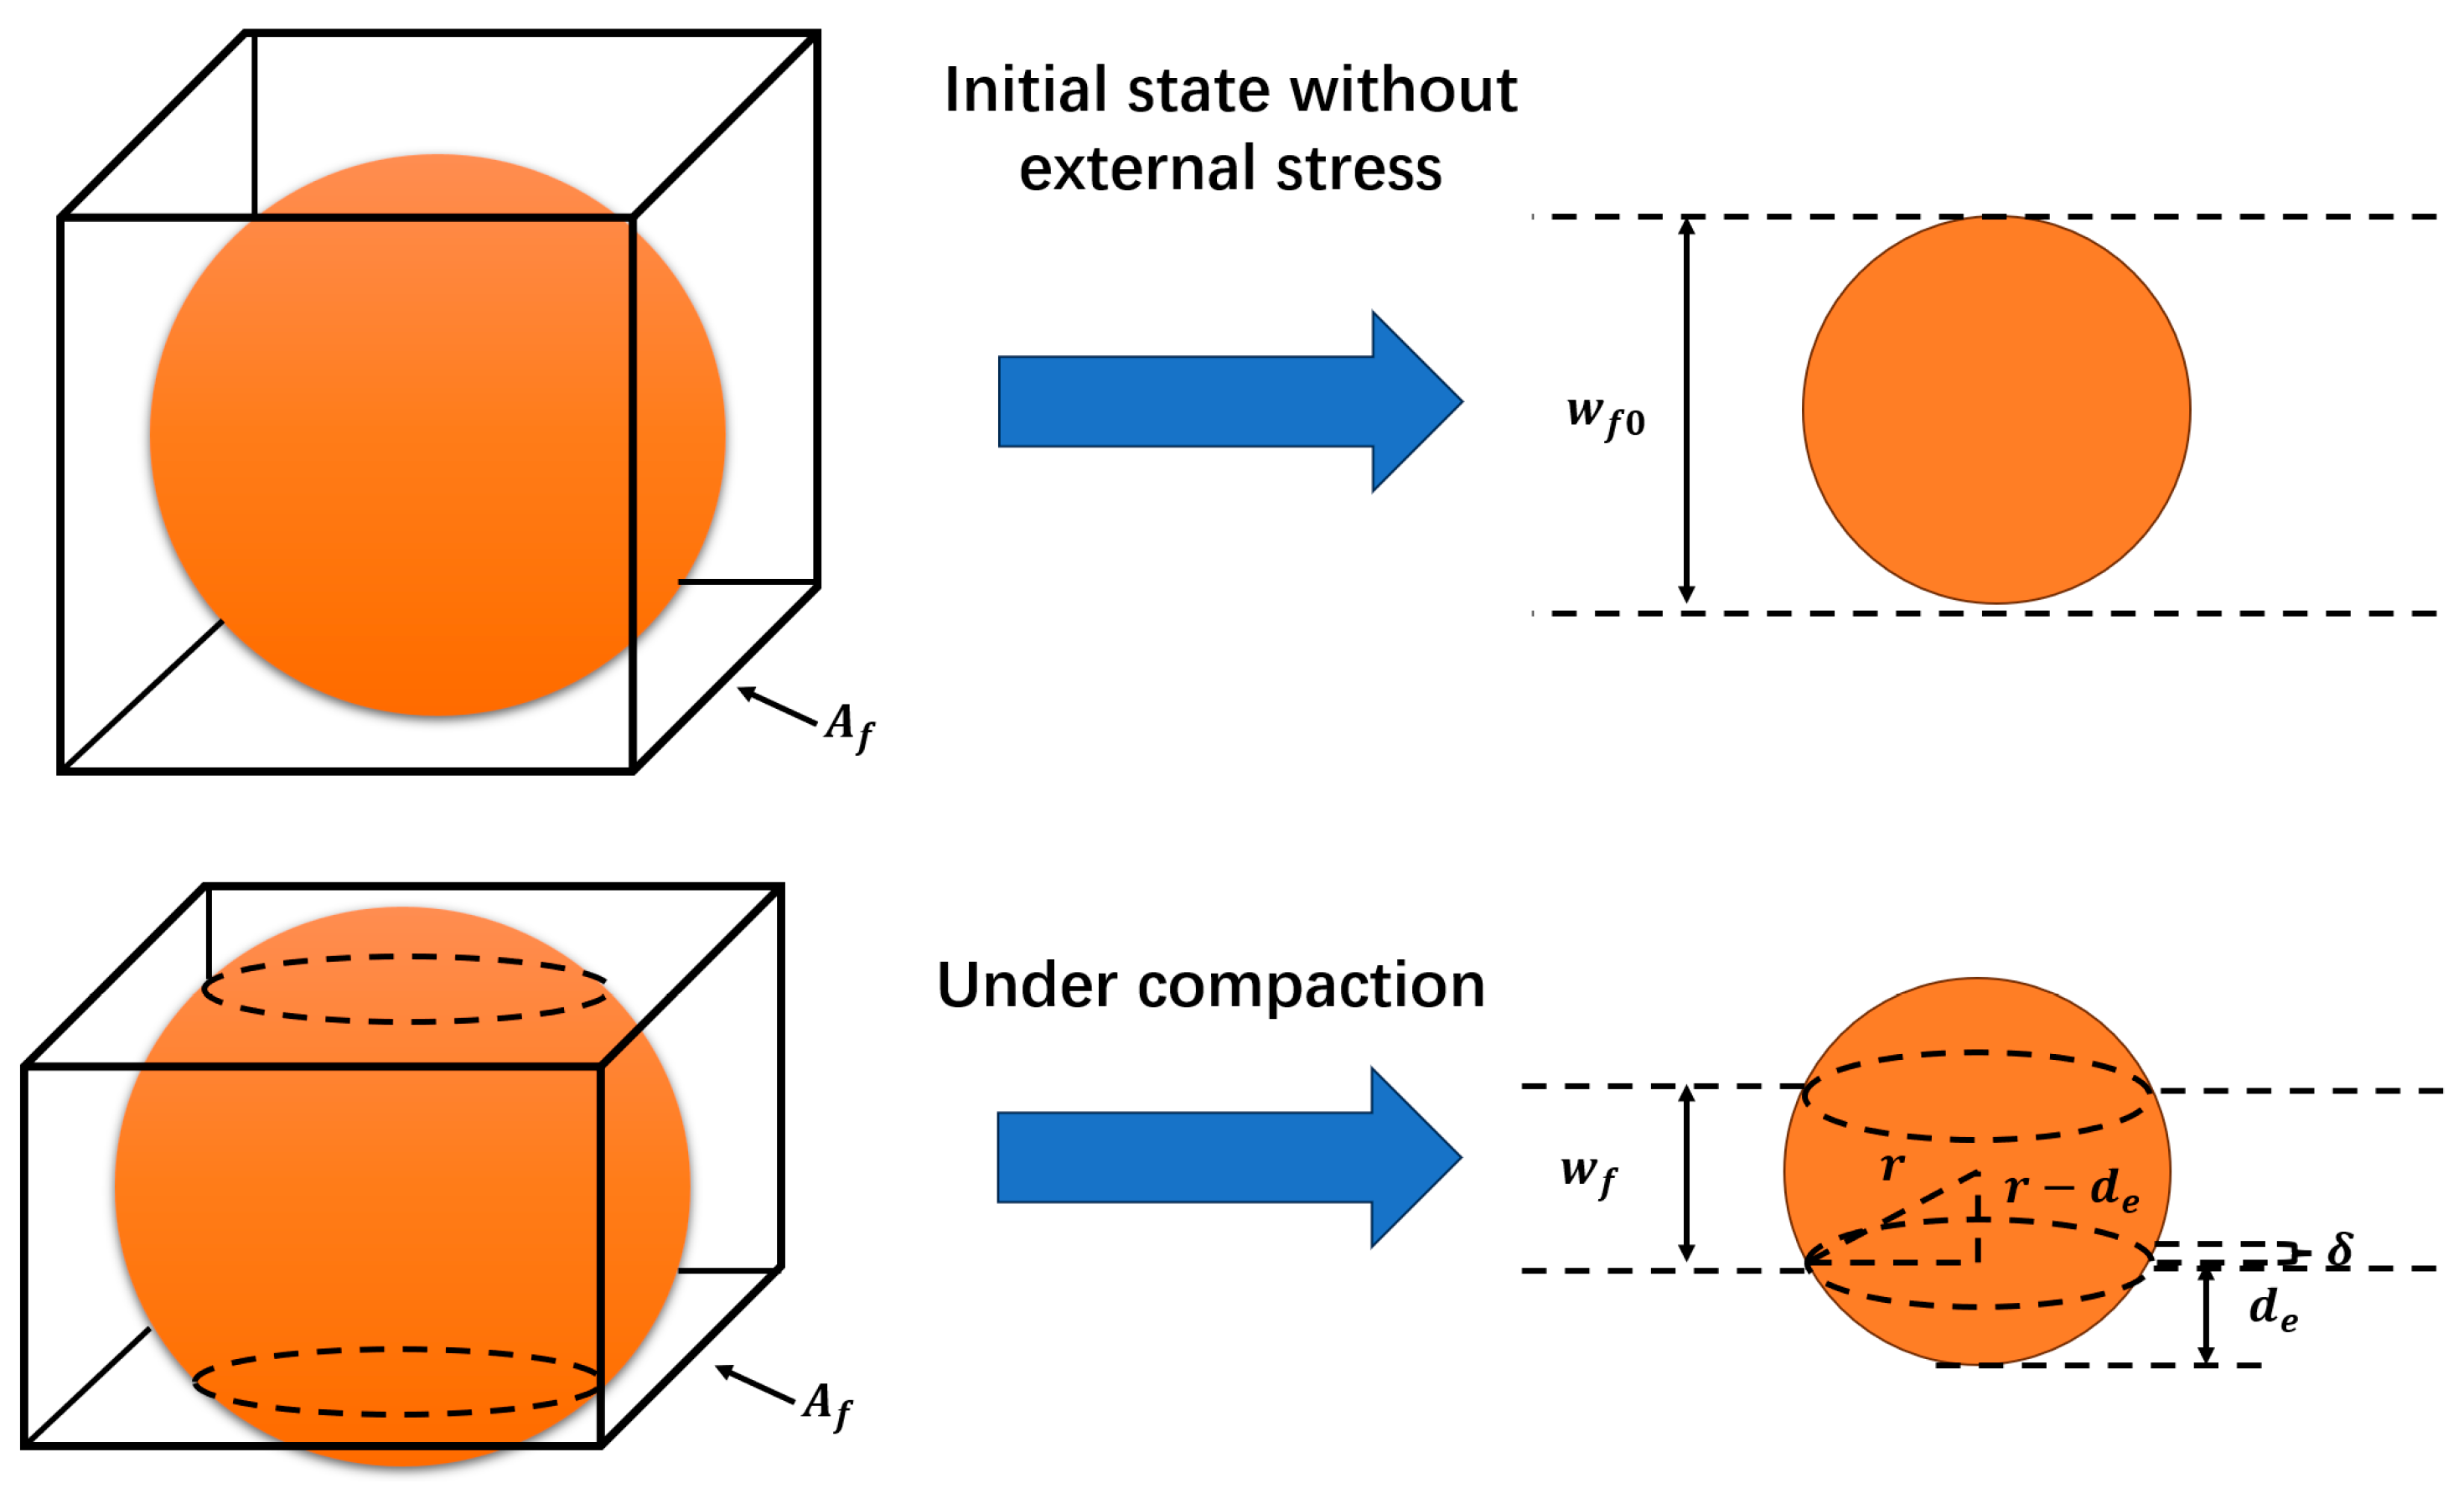
After a hydraulic fracturing operation, the fracture pressure drops rapidly due to fluid leakage [24]. Under a certain amount of closure stress, both proppant embedment and proppant pack compaction lead to fracture width reduction. Proppant embedment is particularly noticeable in fractures in weakly consolidated coal, sandstone, and shale rocks [14]. Assuming that proppants are evenly distributed and are in contact with each other under the single-layer proppant placement condition (see Figure 2), the propped fracture width change is due to proppant embedment and proppant particle deformation [20]. The proppant embedment depth is expressed as [22]
d e = 3 p e c l p r 2 r 4 E * 2 / 3 1 r = r 3 p e c E * 2 / 3
where d e is the embedment depth; p e c is the effective stress; r is the proppant radius; l p r is the distance between two proppant particle centers and is equal to 2 r ; and E * is the effective elastic modulus. Note that d e is the one-sided embedment depth for the single-layer proppant case. The proppant deformation due to compaction is proportional to the effective stress [20]:
δ = 2 r ε p = 2 r p e c E p
where δ is the total deformation of proppants caused by compaction (single-layer case); ε p is the compaction-induced strain on the proppants; and E p is the proppant elastic modulus. Thus, the dynamic fracture width can be written as
w f s = w f 0 δ 2 d e
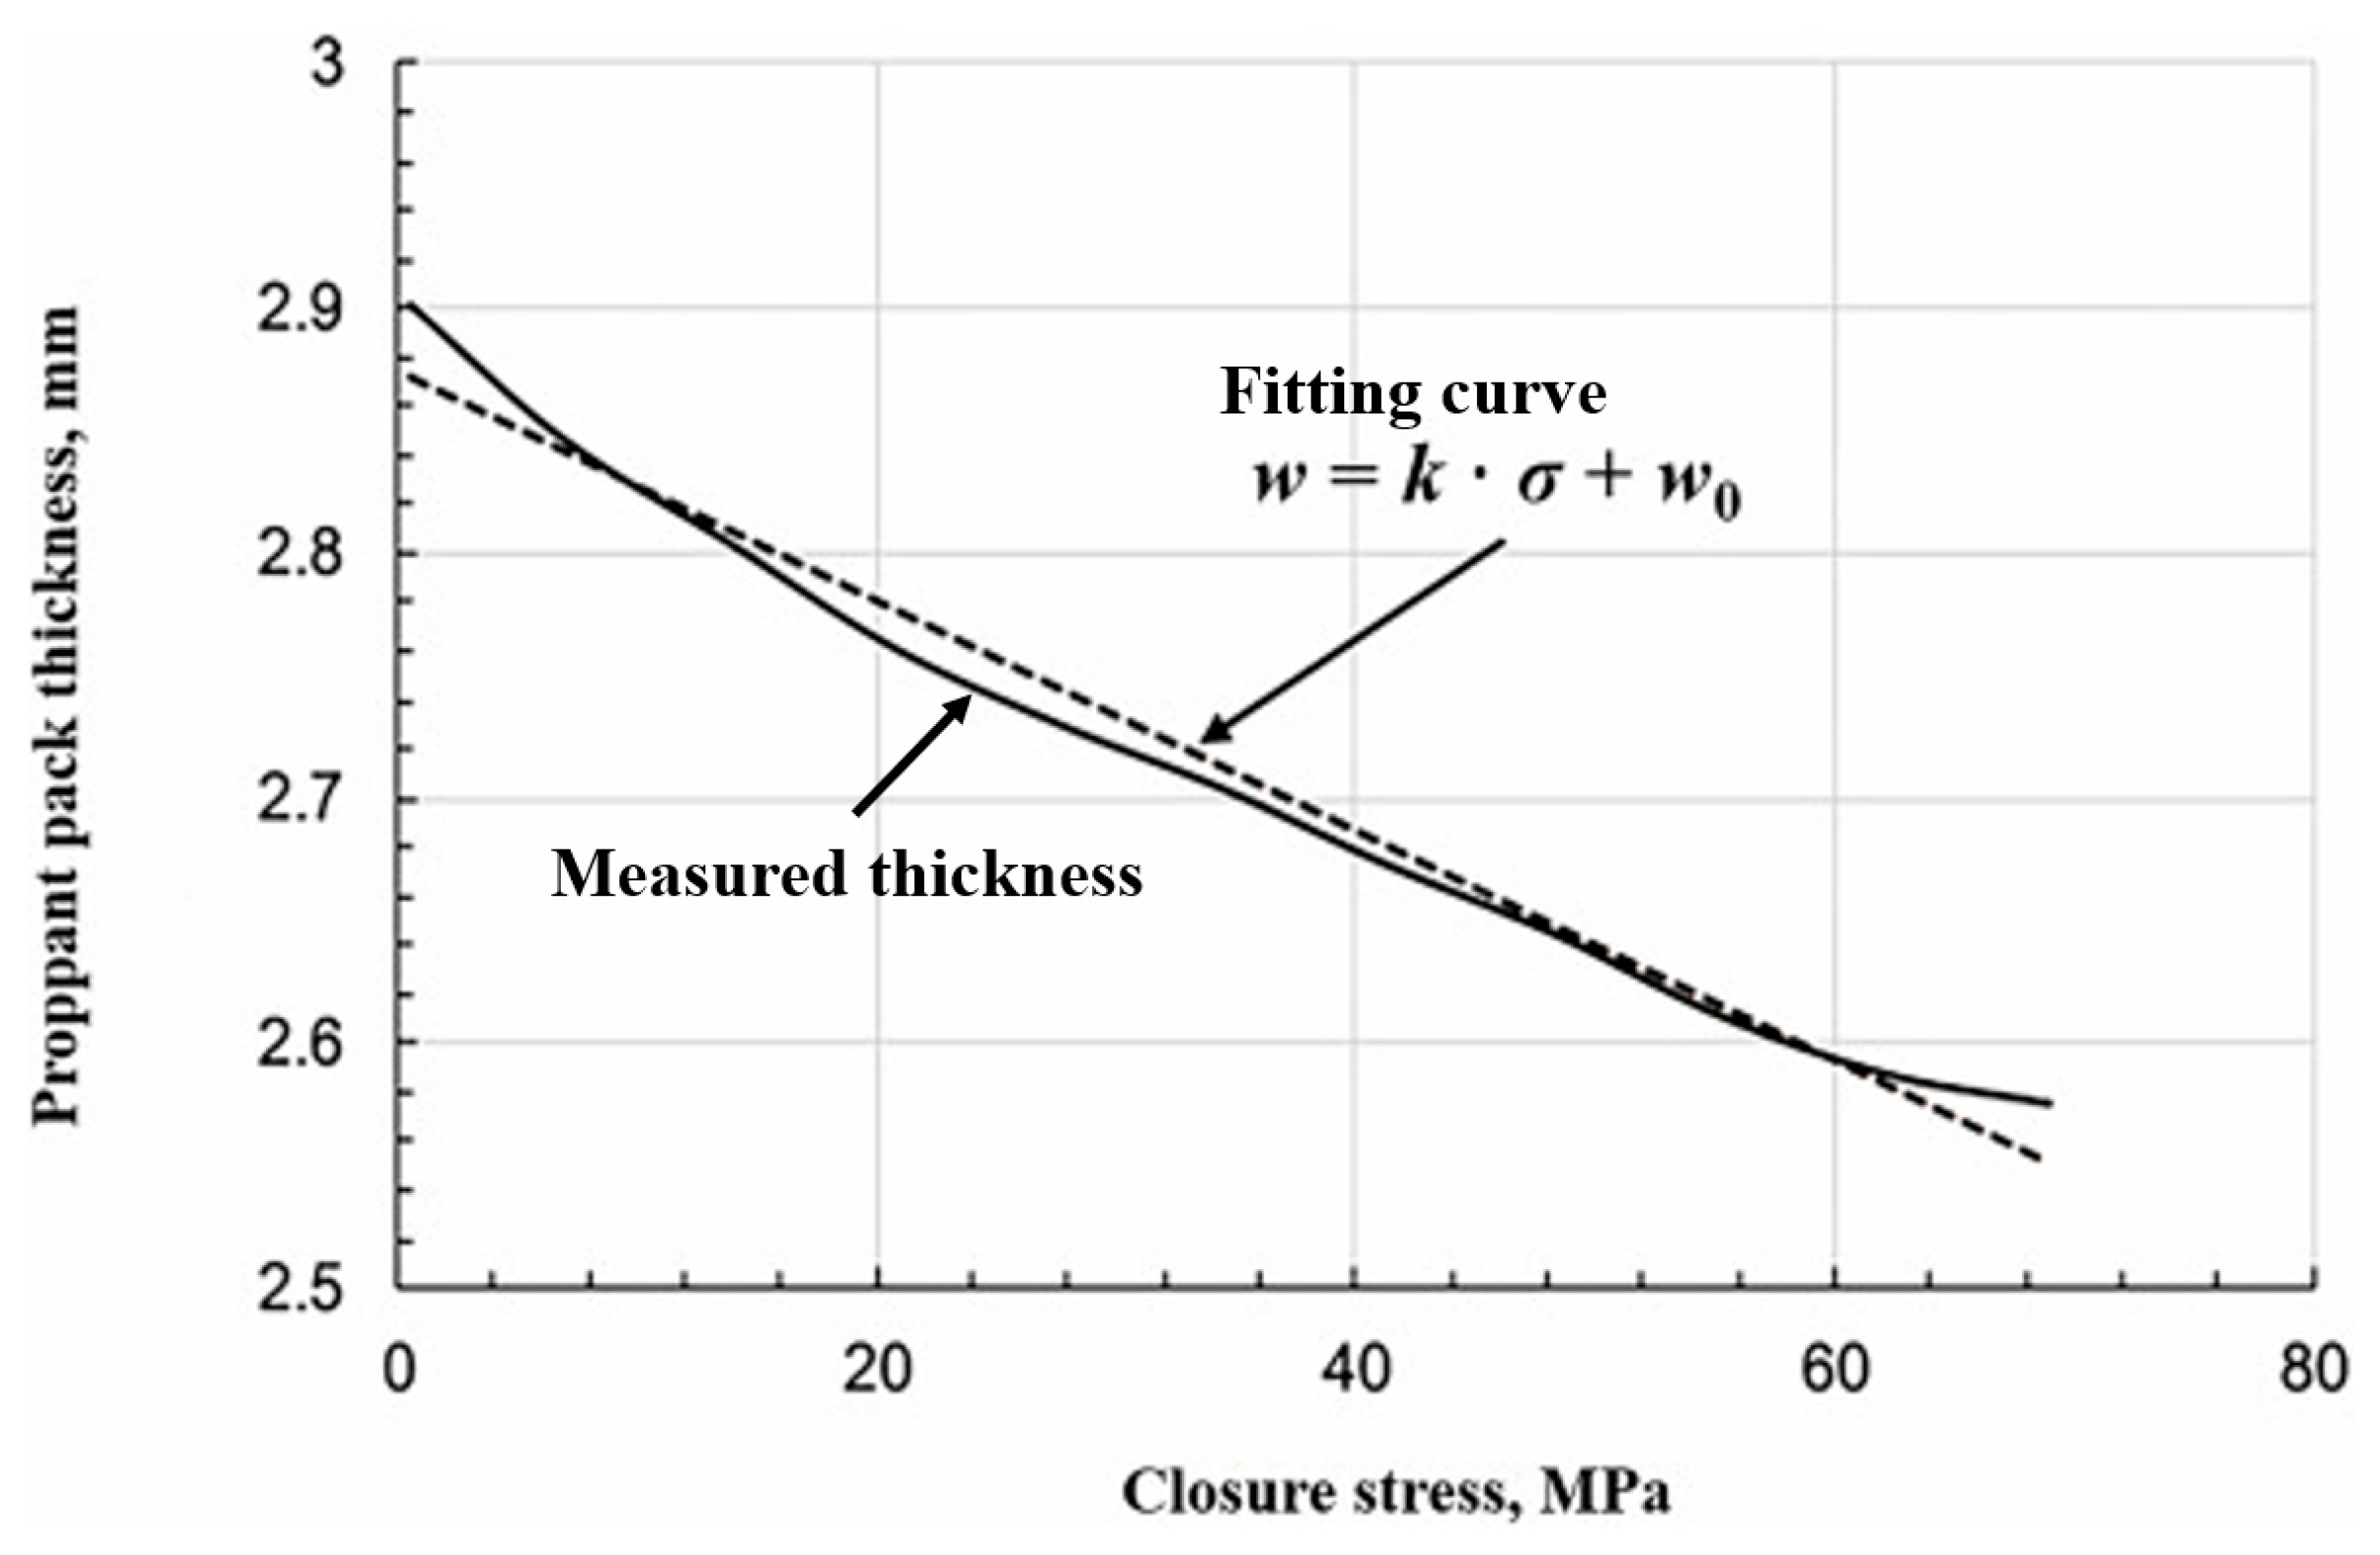
where w f s is the dynamic fracture width in the single-layer proppant case, and w f 0 is the corresponding initial fracture width. In the near-wellbore fracture region, the proppant concentration is higher due to proppant settlement. Therefore, in these regions, a multi-layer proppant placement pattern is frequently observed. As for multi-layer proppant placement conditions (see Figure 3), there are two types of deformation regions [25]: the first type is the embedment region on the fracture surface, and the second type involves proppant pack deformation. The embedment deformation can be calculated using Equation (1). For the proppant pack’s deformation, its apparent Young’s modulus can be used to describe the rigidity of the entire pack according to the experimental study by Liu et al. [10]. They found the following relationship between the closure stress and dynamic proppant pack thickness (see Figure 4):
w = w 0 + p c K
where w is the dynamic proppant pack thickness; w 0 is the initial proppant pack thickness; p c is the closure stress; and K is the slope of the closure stress and proppant pack thickness curve (a negative value). Here,
K = w w 0 p c = ε a w 0 p c = w 0 E a
where ε a is the strain caused by proppant compaction, and E a is the apparent Young’s modulus. Therefore, the deformation of the whole proppant pack in the fracture width direction can be expressed as
d p = p e c w 0 E a
Therefore, the dynamic width is
w f m = w f 0 d p 2 d e
where w f m is the dynamic fracture width for the multi-layer proppant placement case.

2.2. Propped Fracture Permeability Model

After deriving the propped fracture dynamic width model, the proppant pack permeability model should be developed to calculate the corresponding fracture conductivity. When a fluid flows through a porous medium and is affected by the viscous shear from the sides of the flow channel, the pressure gradient can be expressed as the sum of the pressure gradients of the Navier–Stokes flow and the Darcy flow [21]:
p = μ 2 v μ k v , · v = 0
where p is the fluid pressure; μ is the fluid viscosity; k is the permeability; and v is the fluid flow velocity. Equation (8) is the Brinkman equation. In a porous medium, the real fluid flow velocity is expressed as v r = v s / ϕ p , where v s is the superficial fluid flow velocity, and ϕ p is the porosity of the porous medium. The velocity in the Navier–Stokes flow term in Equation (8) is the superficial velocity. Thus, it can be rewritten as
p = μ 2 v ϕ p μ k p v , · v = 0
where k p is the proppant pack permeability. By assuming that l x represents the fracture length direction, while l y indicates the fracture width direction, the following equation group can be obtained:
2 v = d 2 v d l y 2 p = p l x
Here, the velocity is in the l x direction. Substituting Equation (10) into Equation (9) yields
μ ϕ p d 2 v d l y 2 μ k v p l x = 0 , · v = 0
At the boundaries of the flow channel (fracture surfaces), the velocity is v 0 , as shown in Figure 5. Thus, v = v 0 ( l y = 0 and l y = w f ). With this boundary condition, the general solution of Equation (11) can be obtained [21]:
v = k p μ p l x 1 v 0 k p μ p l x + 1 s i n h ϕ p k p l y + s i n h ϕ p k p w f l y s i n h ϕ p k p w f
Recalling the definition of fluid flux, the following expression can be obtained [21]:
q f = h f 0 w f v d l y = h f w f k p μ p l x 1 + 2 w f v 0 k p μ p l x + 1 k p ϕ p c s c h ϕ p k p w f c o t h ϕ p k p w f
where h f is the fracture height, and w f is the fracture width. According to Darcy’s law, q f = h f w f k f d p / μ d l x . Therefore, the fracture permeability is
k f = k p 1 + 2 w f v 0 k p μ p l x + 1 k p ϕ p c s c h ϕ p k p w f c o t h ϕ p k p w f
Due to the viscous shear from the fracture walls, the v 0 at the two fracture walls is zero. Equation (14) is then simplified as
k f = k p 1 + 2 w f k p ϕ p c s c h ϕ p k p w f c o t h ϕ p k p w f
Equations (3) and (7) give the expressions of w f for the single-layer and multi-layer conditions. The proppant pack permeability is given by [26]
k p = ϕ p w f 2 12
In Equation (16), w f is already known. If the dynamic value of ϕ p is obtained, one can calculate k p and hence k f . As shown in Figure 6, for the single-layer proppant placement condition, the initial porosity and the porosity under compaction are expressed as follows (the proppant deformation δ is negligible compared with the embedment depth):
ϕ p 0 = A f w f 0 4 π r 3 3 / A f w f 0 = 2 r A f 4 π r 3 3 / A f w f 0
ϕ p = A f w f 4 π r 3 3 2 π d e 2 3 r d e 3 / A f w f = A f w f 0 δ 2 d e 4 π r 3 3 2 π d e 2 3 r d e 3 / A f w f
Here, A f is the fracture surface area per proppant particle. Because the fracture height and length are constant, the fracture surface area A f is a constant [27]. As mentioned before, under multi-layer proppant placement conditions, the proppant pack is treated as a porous medium that has its own mechanical properties [10]. Figure 1 shows the pore space within a multi-layer proppant pack. The porosity is a function of the effective stress [28]:
ϕ p = ϕ p 0 e x p 1 K p b 1 K p p Δ p c e
where K p b is the proppant pack bulk modulus, and K p p is the proppant pack pore modulus. Here, 1 / K p b 1 / K p p can be treated as a compressibility term, C f . Therefore, by combining Equations (1)–(3), (6), (7), (15), (16), (18), and (19), the dynamic conductivity for propped fracture segments can be obtained.

2.3. Dynamic Unpropped Fracture Width Model

For unpropped and self-supporting fractures, their mechanical properties may change during compaction [29]. The compressibility of unpropped fractures is [25,29]
C u f = C u f 0 α Δ p e c 1 e x p α Δ p e c
where C u f is the unpropped fracture compressibility; C u f 0 is the initial unpropped fracture compressibility; and α is the rate at which the compressibility decreases. Therefore, with a change in the effective stress, the variation in the unpropped fracture width is given by [30]
w u f = w f 0 w f 0 C u f Δ p e c
The permeability of a self-supporting fracture is simply a function of the fracture width [26]:
k f = w f 2 12
Combining Equations (21) and (22), the dynamic conductivity of unpropped fractures can be calculated.

2.4. Partially Propped Fracture Network Conductivity Model

The fracture network conductivity is a combination of the fracture conductivities for different propped and unpropped fracture segments. It is calculated using hydraulic–electric analogies [31]. The pressure difference is similar to the voltage difference, while the flow rate is similar to the current. Therefore, the following equation for fluid flow can be obtained:
q i = k f i w f i H i p μ L i = p μ L i F c d i H i
According to Guo et al. [32], the equivalent flow resistance is similar to the electrical resistance:
E R f = μ L i F c d i H i
Taking the fracture network in Figure 7 as an example, the equivalent fracture flow resistance is
E R f = E R 1 + 1 1 E R 2 + E R 3 + 1 E R 2 + E R 3 + 1 E R 4 + E R 5
Finally, the equivalent conductivity of the fracture system is
F c d = μ L f E R f H f
where L f , H f , and E R f are the length, height, and equivalent flow resistance of the fracture system.

3. Model Validation

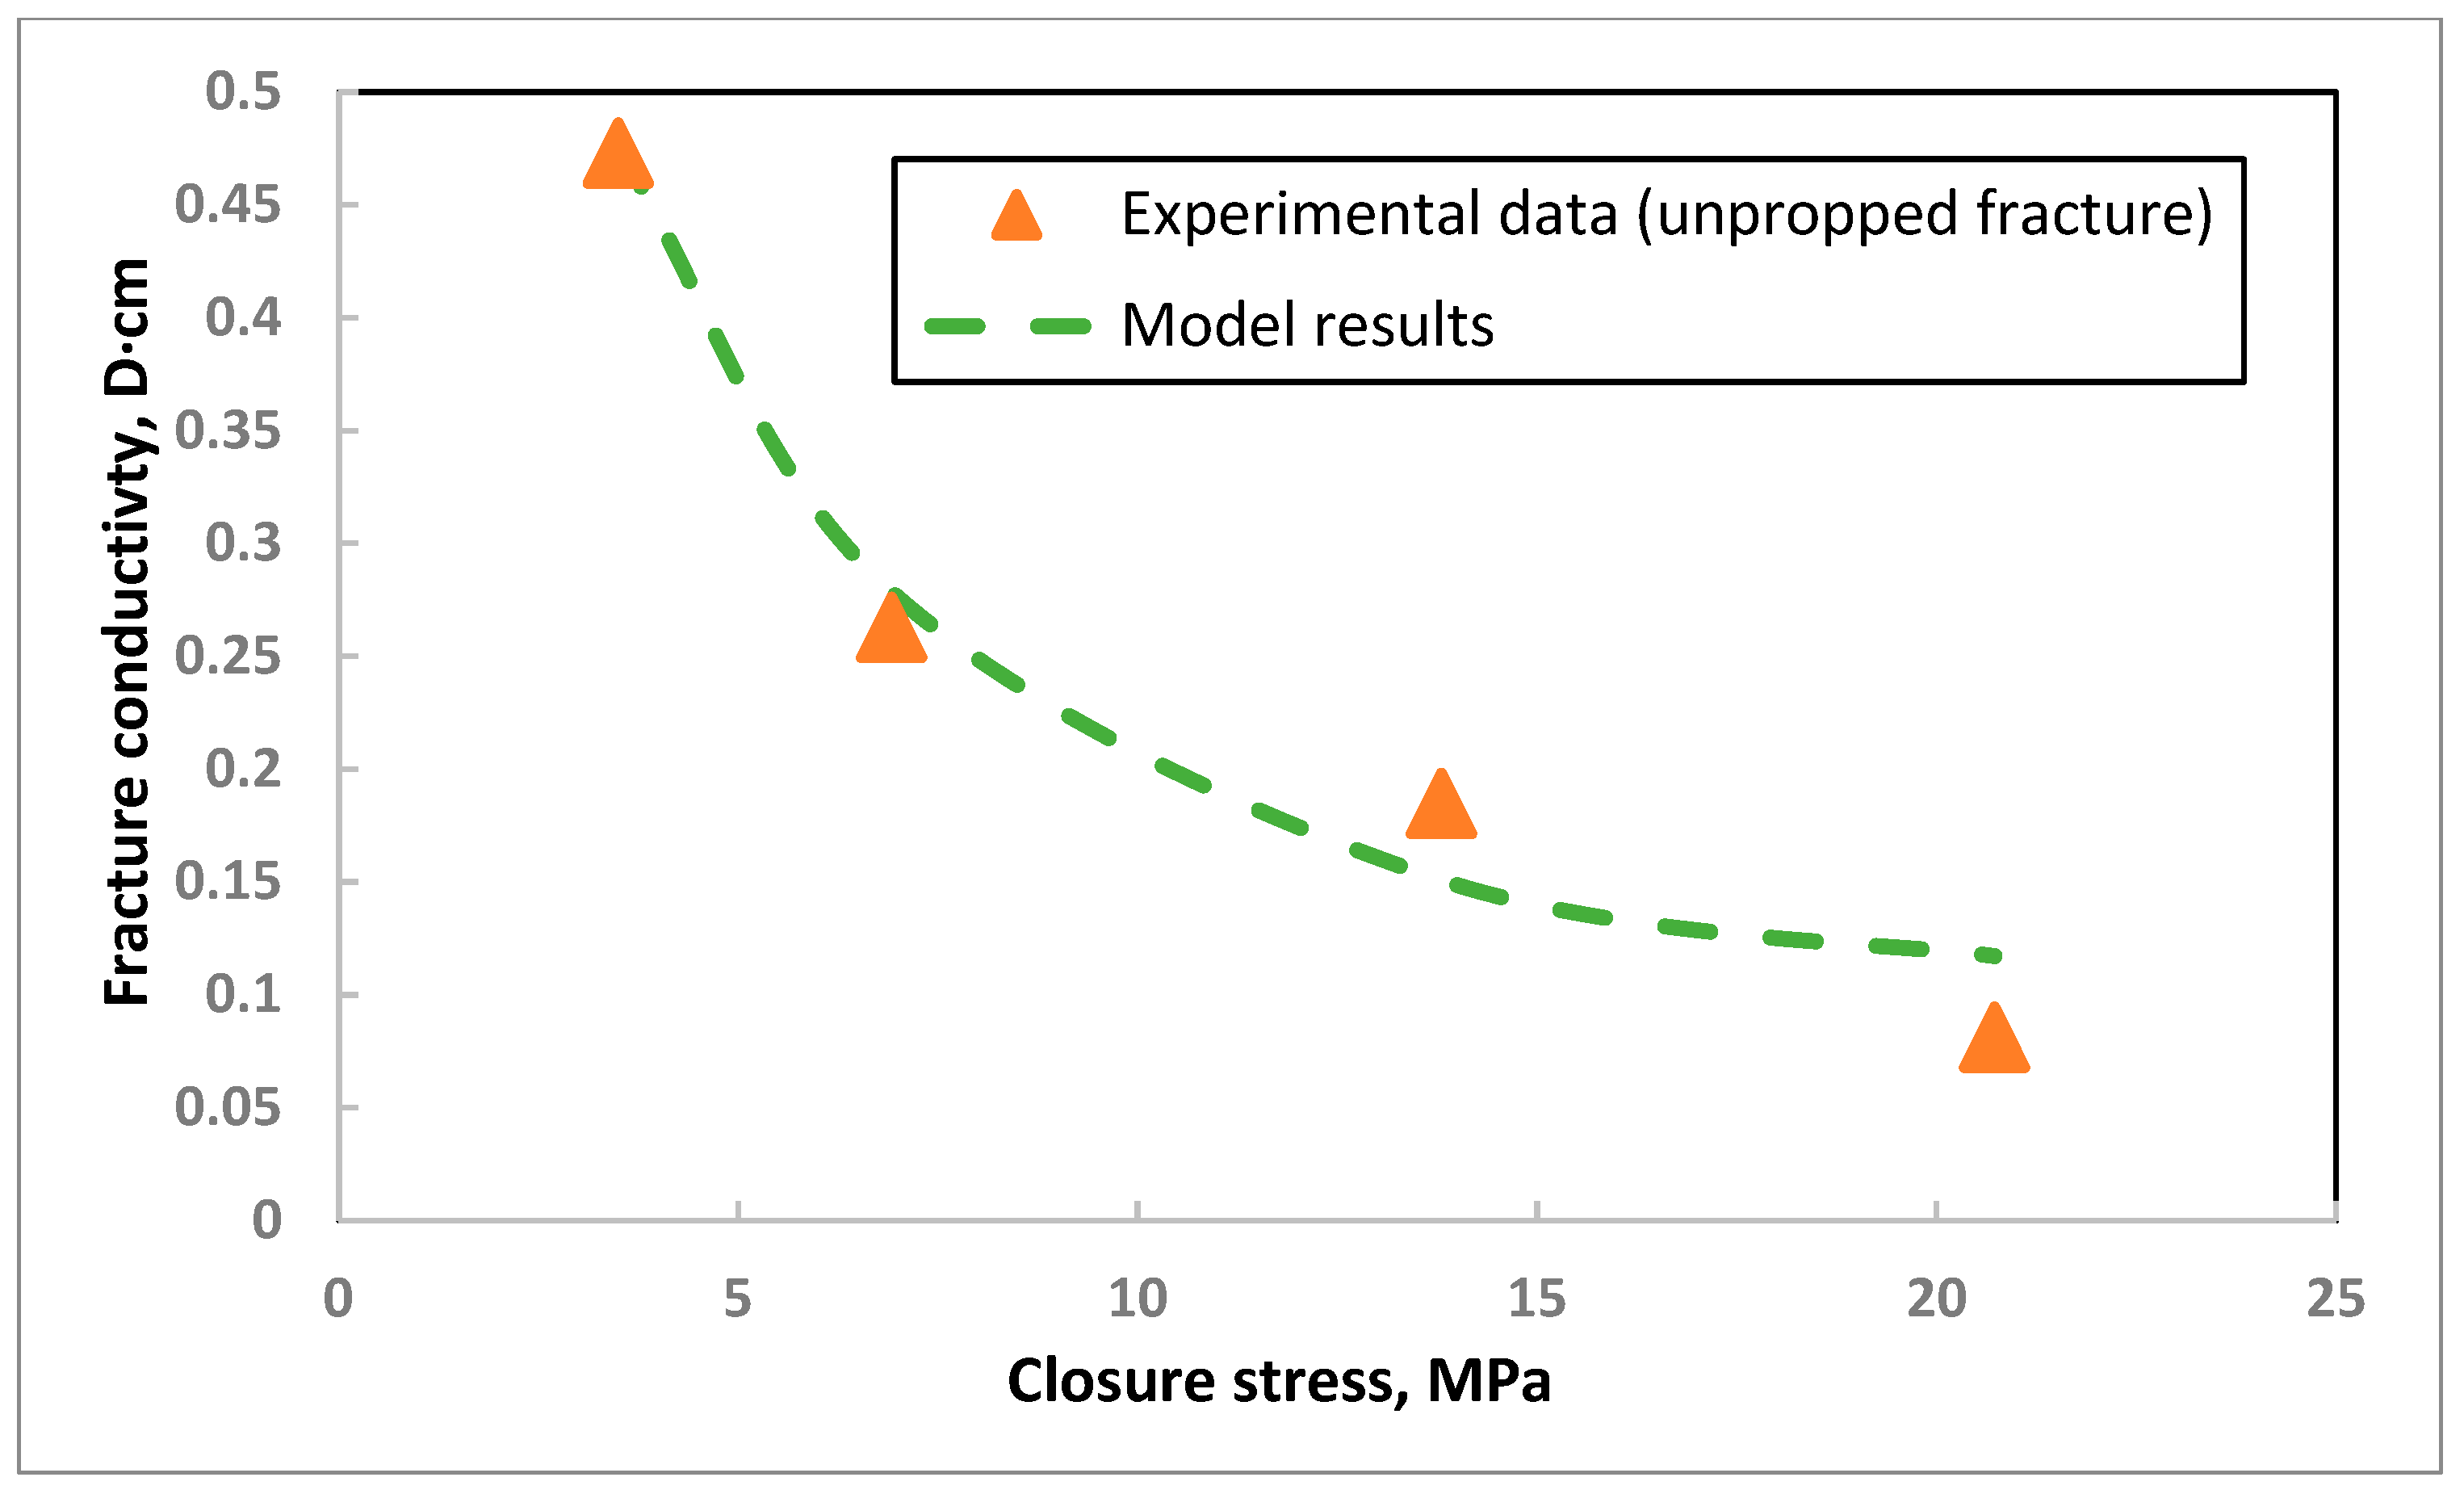
The proposed fracture conductivity models for propped and unpropped fracture segments were verified against experimental data. Unpropped and propped fracture conductivity measurement experiments were performed by Zhang et al. [33]. Barnett Shale samples were placed in an API conductivity cell during the experiments. Note that the experimental apparatus was more representative of controlled laboratory conditions. Dry nitrogen gas was injected as the flowing fluid. The unpropped shale fractures contained anhydrite, while the propped shale fractures were filled with multi-layer 100-mesh proppants. The closure stress could be approximated as the effective stress under a relatively low gas pressure. The input parameters are listed in Table 1. These values are reasonable compared with those reported in the literature [10,22,25,34]. As shown in Figure 8 and Figure 9, good agreement between the laboratory observations and calculation results was achieved, indicating that the proposed conductivity model could describe the dynamic conductivity of both propped and unpropped fractures. In Figure 8, the average error between the four data points and our calculation results is shown to be 5.8%, while the average error in Figure 9 is 8.1%. The conductivity values of both unpropped fractures and propped fractures dropped with an increase in the closure stress. Specifically, the unpropped fracture conductivity was always lower than the propped fracture conductivity, but the overall decline rate was similar for both. For the hydraulic conductivity, the unit was a combination of the permeability’s unit (Darcy) and the fracture width’s unit (cm). Regarding the propped fracture, its conductivity decreased from 4 D·cm to 0.42 D·cm as the closure stress changed from 3.5 MPa to 27.6 MPa. Regarding the unpropped fracture, the conductivity dropped from 0.47 D·cm to 0.08 D·cm with a closure stress rising from 3.5 MPa to 20.7 MPa.

4. Results and Discussion

After the validation of the proposed fracture conductivity model, sensitivity investigations of the influences of fracture properties, such as the proppant pack compressibility, compressibility decline rate of the self-supporting area, fracture surface’s mechanical properties, and propped fracture’s initial aperture, on the conductivity evolution were conducted, and the results are discussed and documented. For an accurate description of the fracture conductivity evolution, the effective stress was used to demonstrate the stress state instead of using the closure stress [22].

4.1. The Impacts of the Proppant Pack Compressibility

Here, the proppant pack compressibility essentially refers to the porosity compressibility. It controls the permeability of propped fractures. Regarding the measured apparent compressibility of proppant packs [35], in this paper, it ranged from 0.008 MPa−1 to 0.08 MPa−1. Considering a wider range of effective stress values (in both shallow and deep formations), the dynamic conductivity is shown in Figure 10. As expected, the conductivity continuously decreased with increasing effective stress. The larger the compressibility was, the more significant the conductivity reduction was. When the compressibility was 0.008 MPa−1, the residual conductivity at a 100 MPa effective stress was 28.3% of the initial conductivity. However, when the compressibility was increased to 0.05 MPa−1, the conductivity was reduced by 90.4% at a 100 MPa effective stress. With an increasing compressibility, the conductivity dropped significantly under identical stress conditions. When the compressibility values were 0.05 MPa−1 and 0.08 MPa−1, respectively, the conductivity data points almost overlapped with each other under an effective stress of 80 MPa or larger. Overall, the proppant pack compressibility dominated the fracture conductivity reduction rate as the effective stress increased, especially when the effective stress was lower than 80 MPa.

4.2. The Impacts of the Rate at Which the Compressibility Decreased for Unpropped Fractures

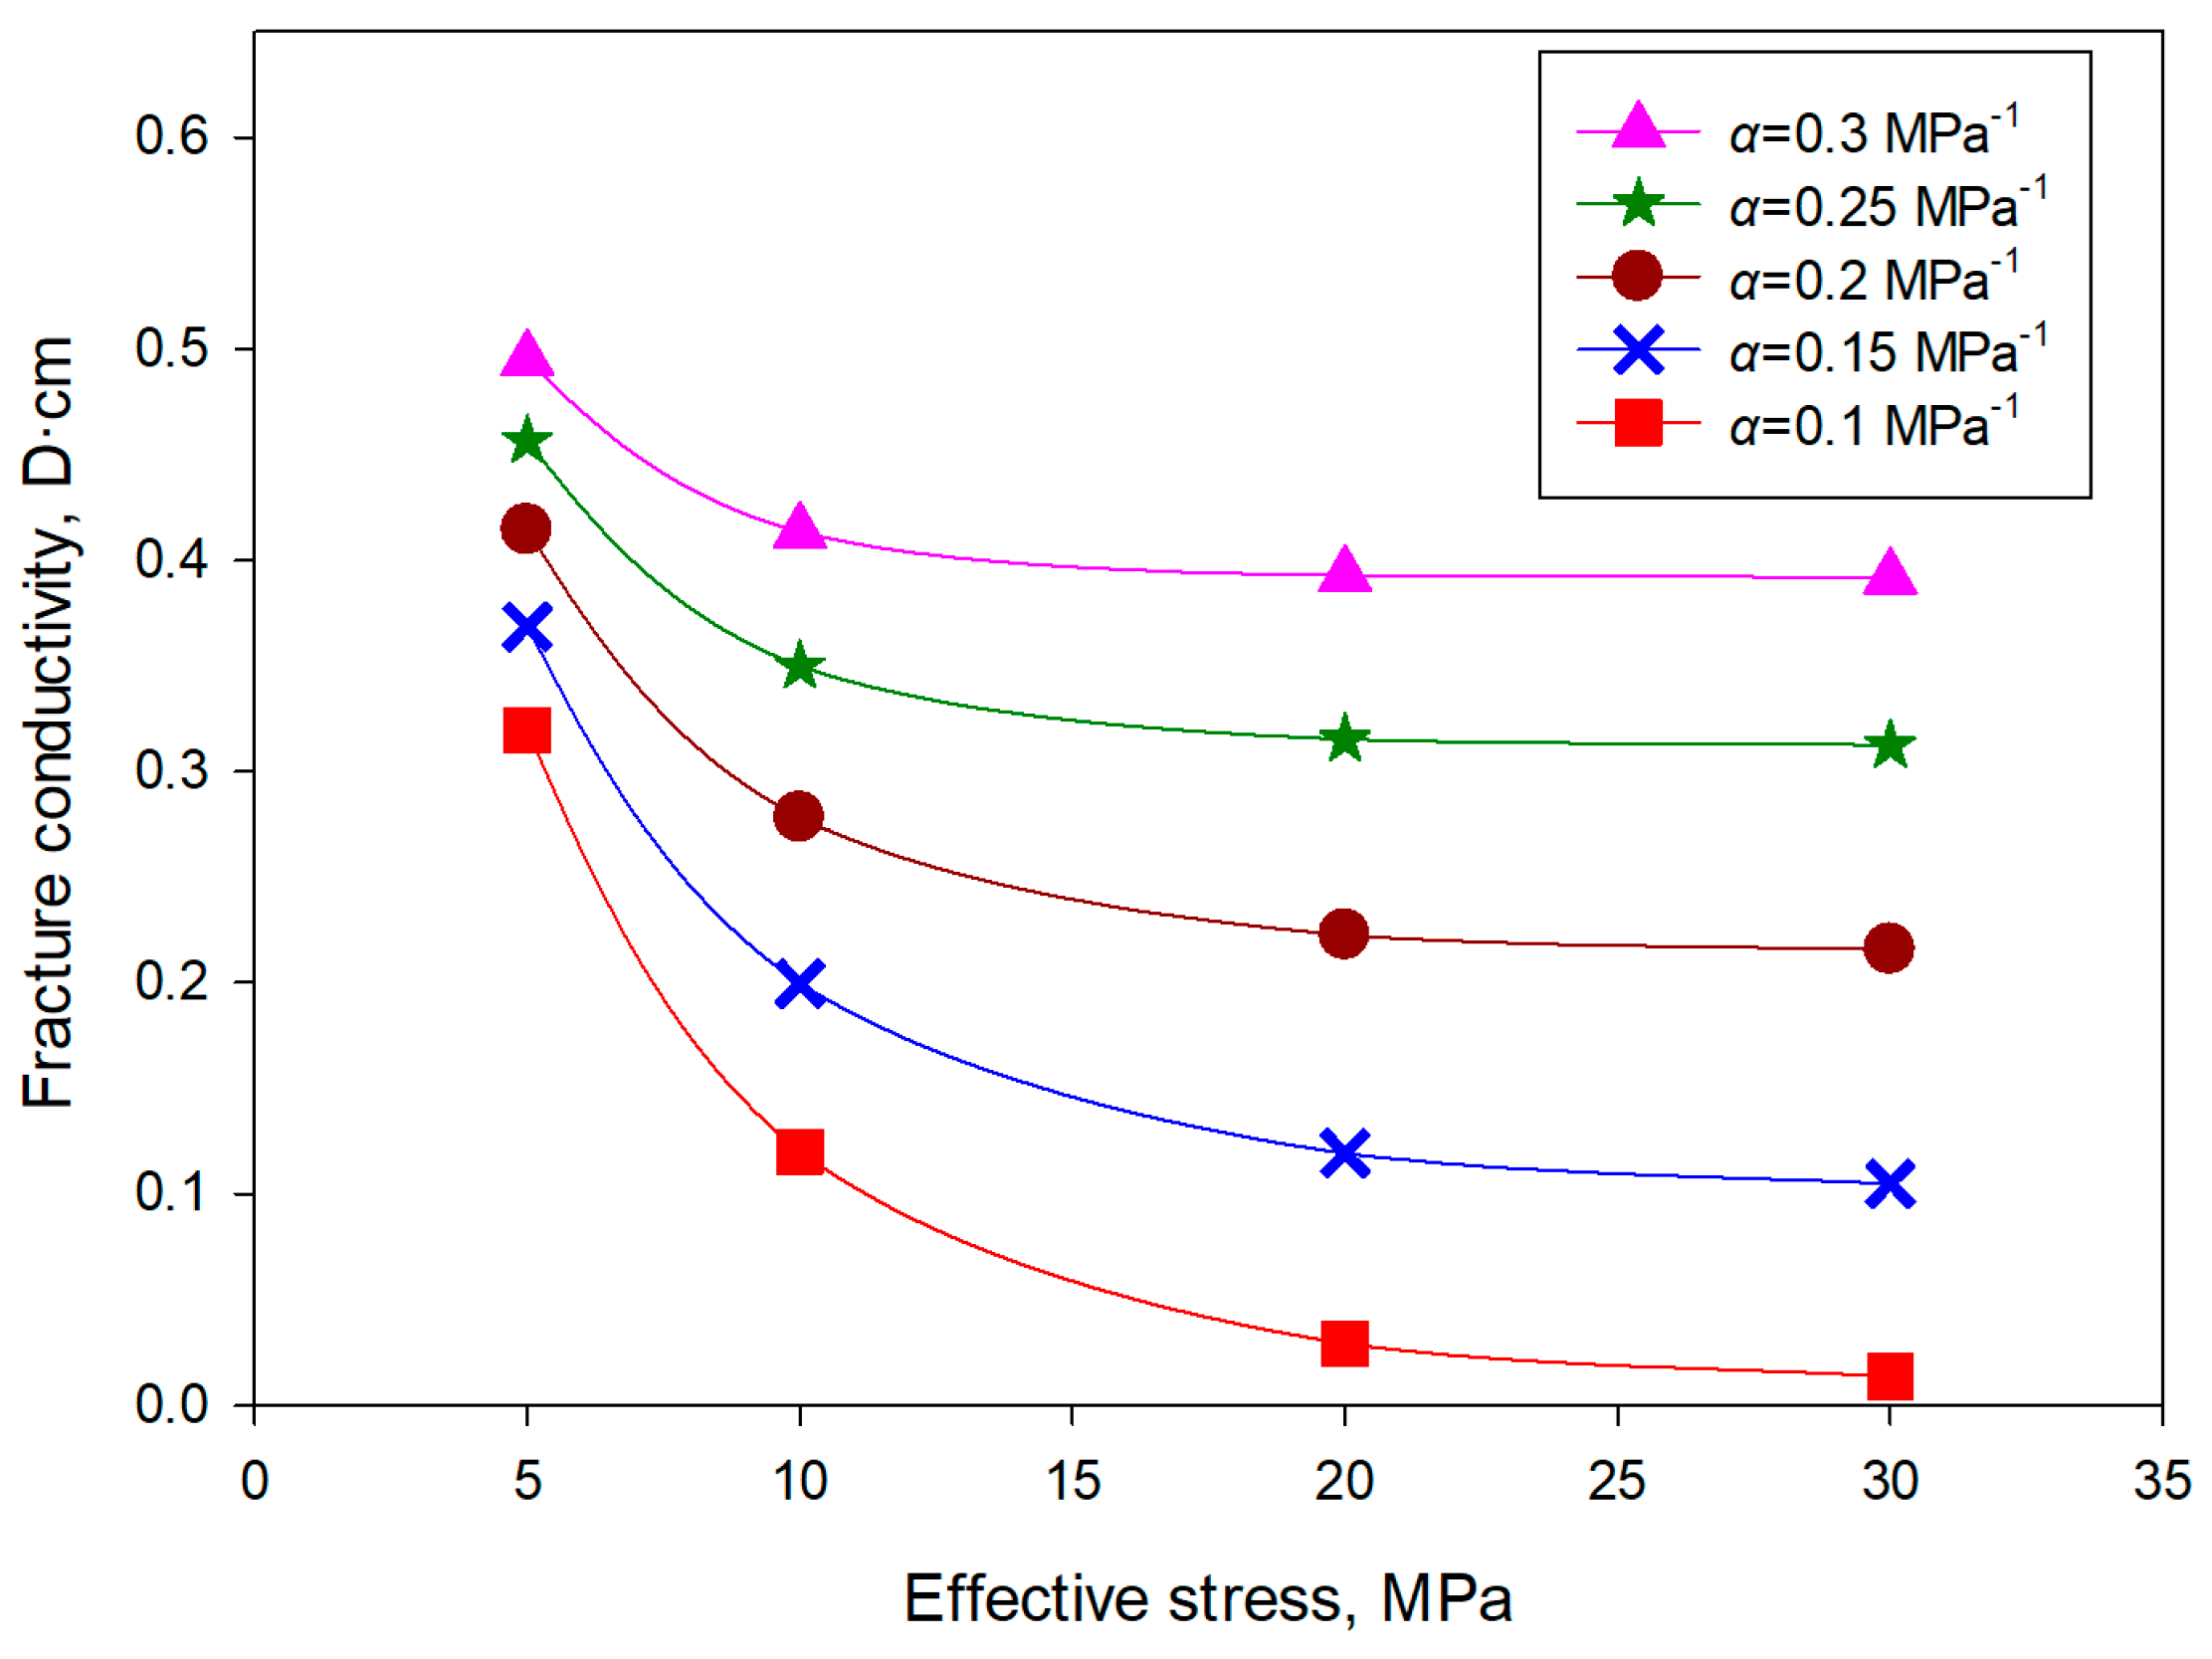
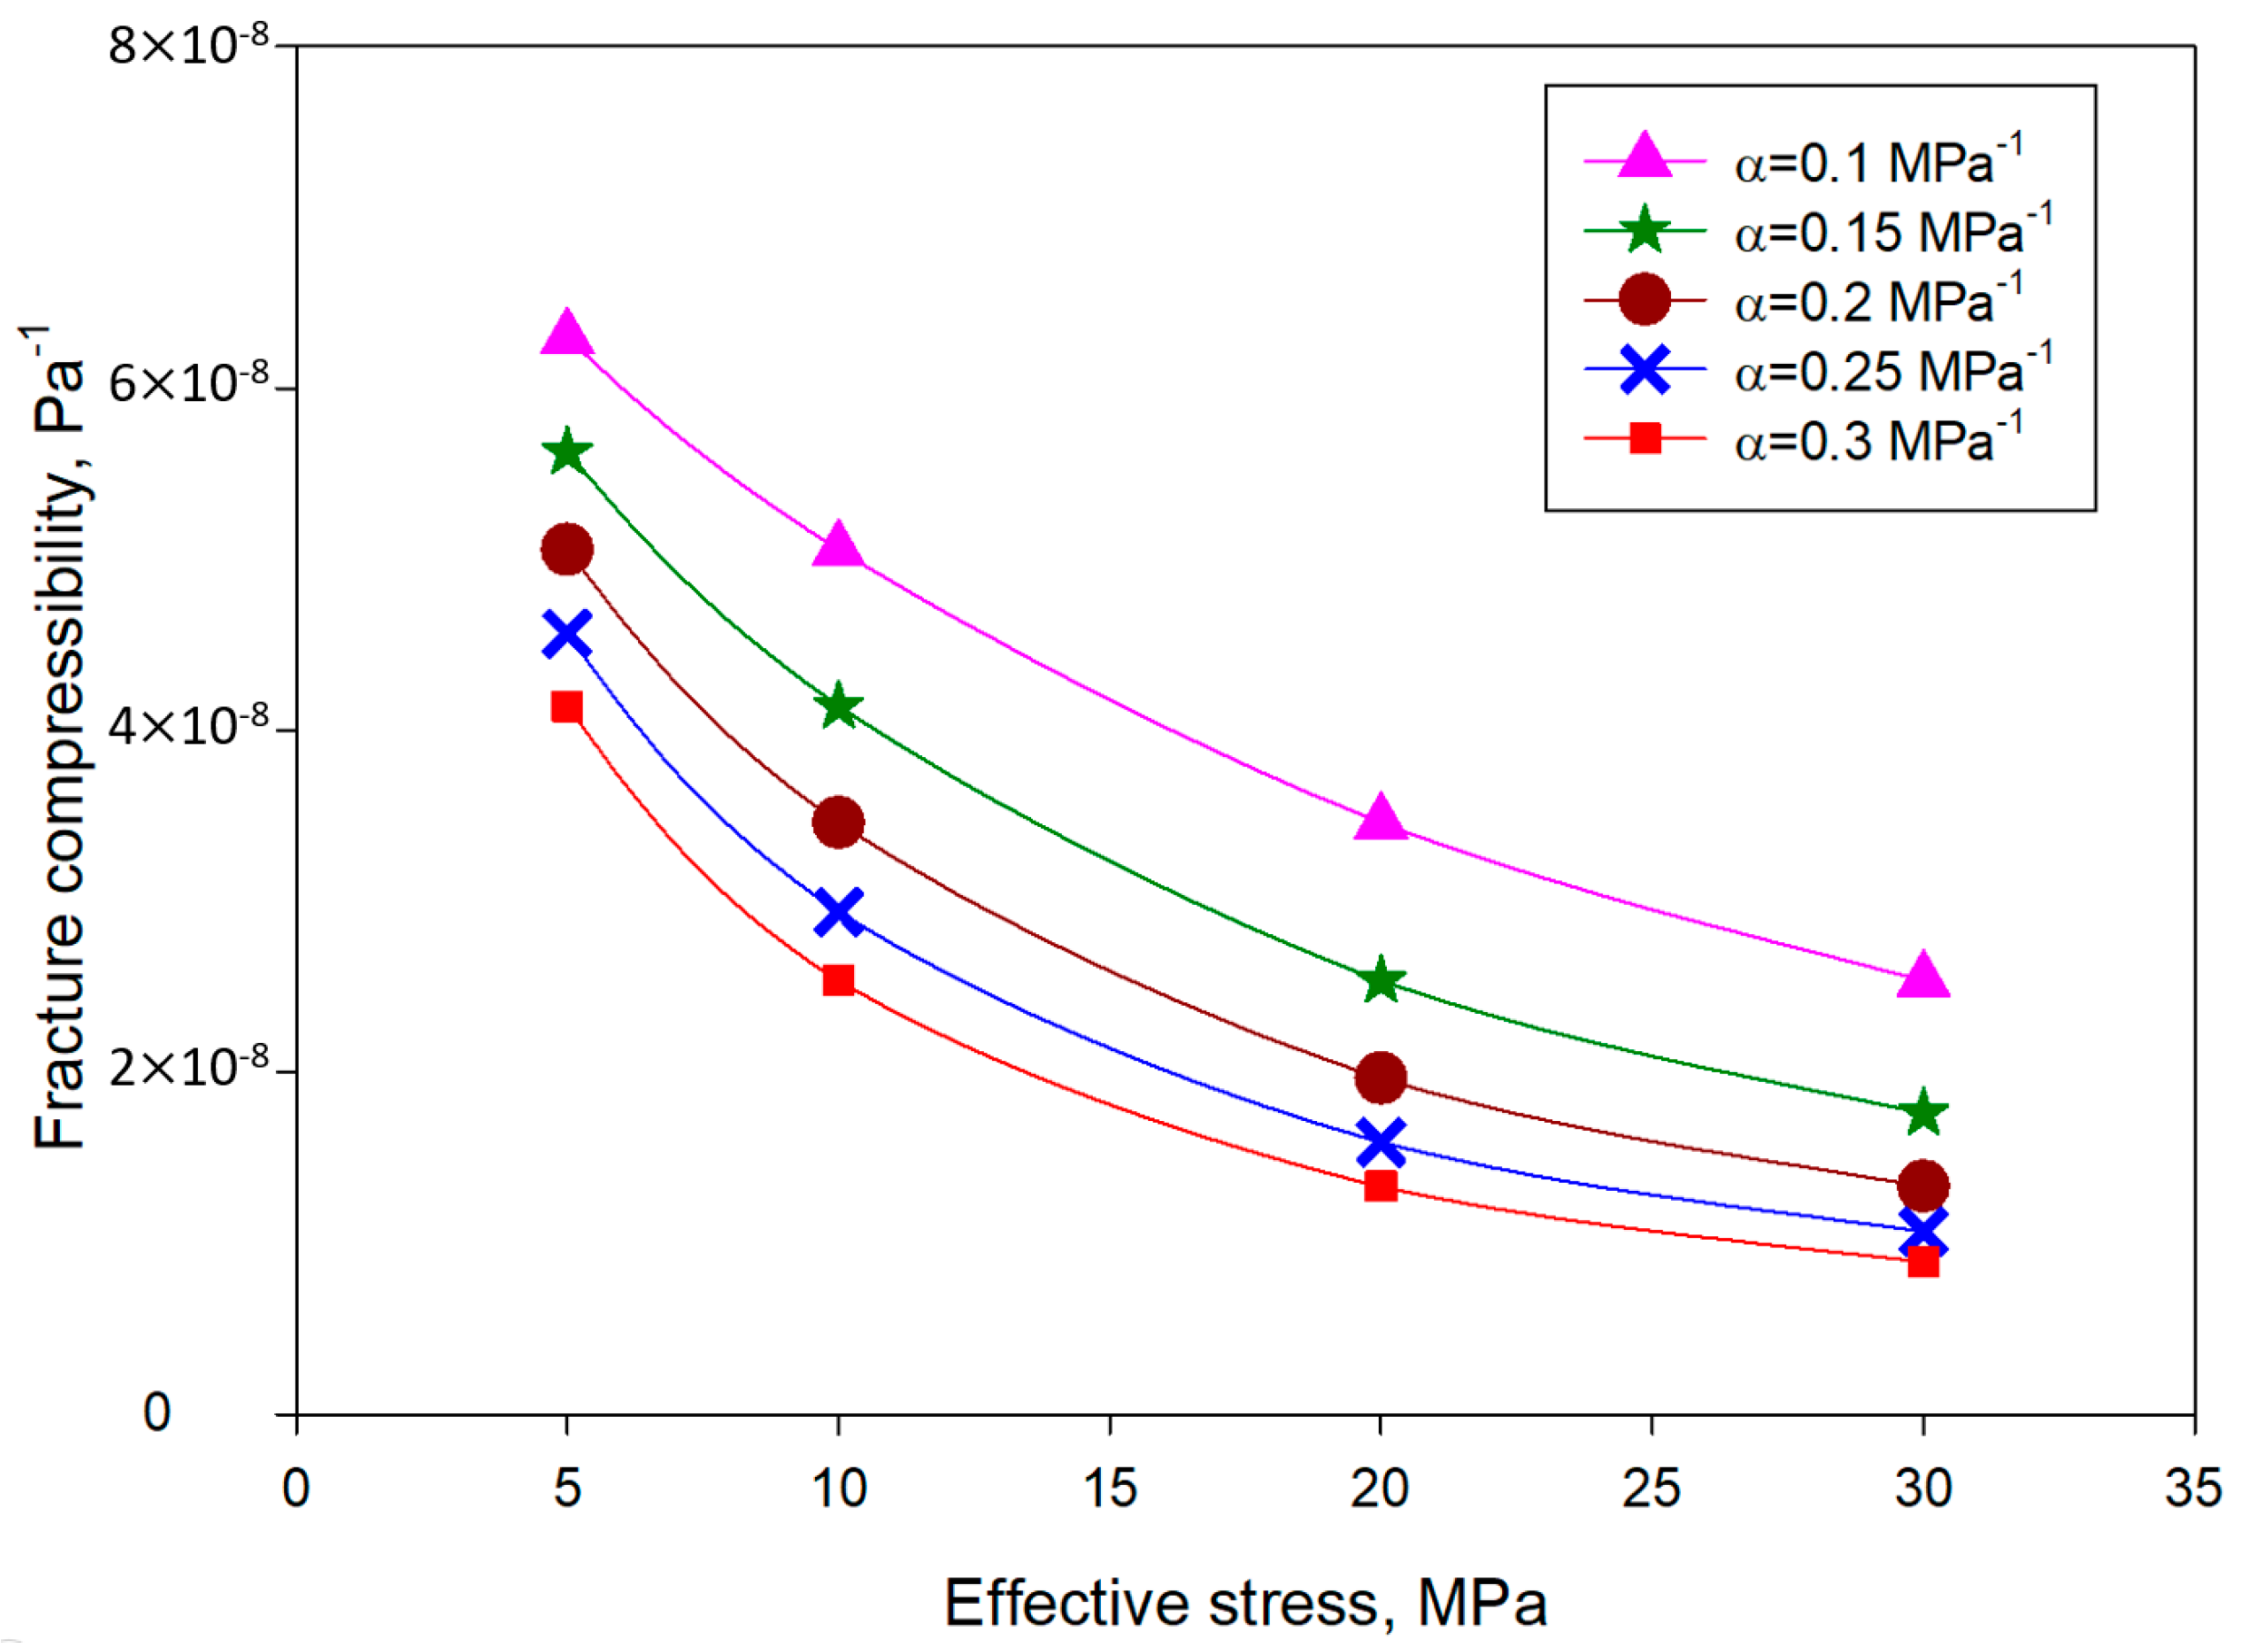
For unpropped fractures, the compressibility is a key factor influencing fracture conductivity variation [36]. Unpropped fractures’ compressibility normally exhibits stress-dependent features [29]. The rate at which the compressibility decreased was used to describe the variation in the fracture compressibility under different stress conditions. In this paper, this parameter was set in the range from 0.1 MPa−1 to 0.3 MPa−1 [25]. The other parameters were the same as in the model validation case. As shown in Figure 11, under the same effective stress conditions, the conductivity decreased with a reduction in the rate at which the compressibility decreased. This was because a lower rate of decrease led to larger compressibility under identical stress conditions (see Figure 12), indicating that the fracture was more compressible. Thus, the conductivity was more sensitive to the effective stress. At a low effective stress, the difference in the fracture conductivity was relatively small. This difference was enhanced with increasing effective stress (see Figure 11). With the same compressibility reduction rate, higher effective stress induced lower fracture compressibility. The compressibility reduction rate determined the unpropped fracture’s compressibility under a certain stress state. Increasing the compressibility reduction rate made the conductivity–stress curve move down.

4.3. Impacts of Fracture Surface Elastic Modulus on Fracture Conductivity

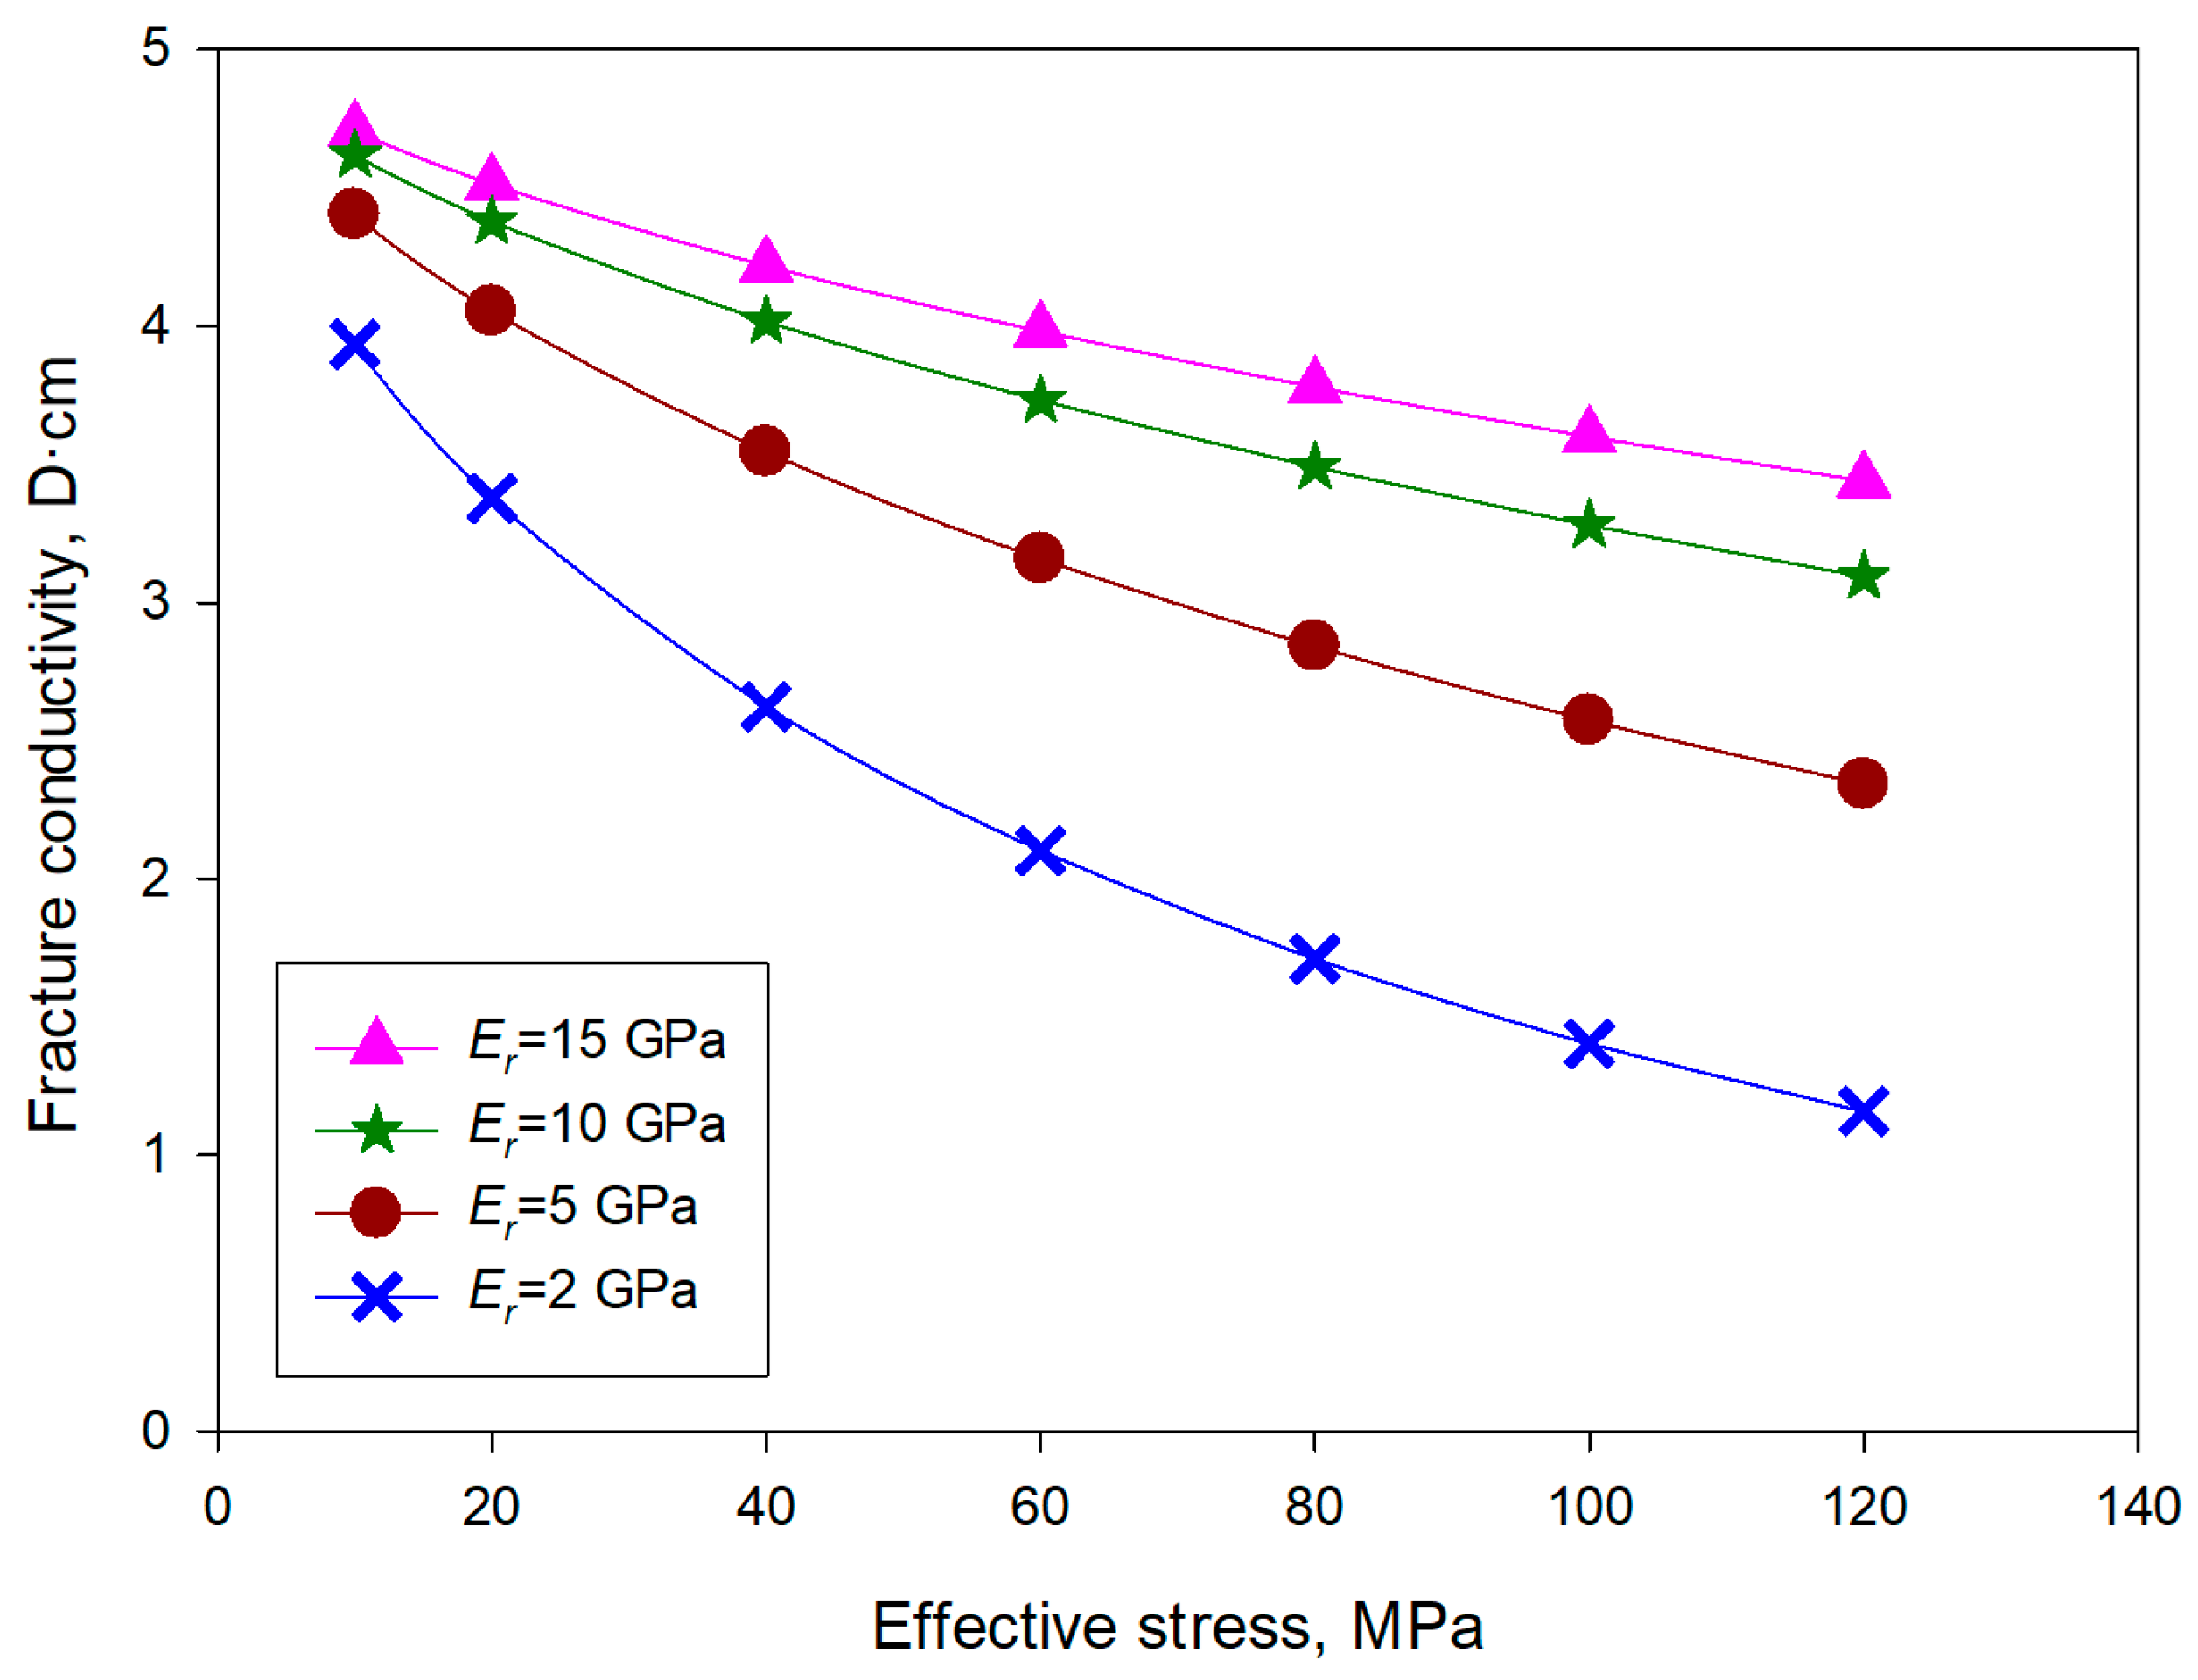
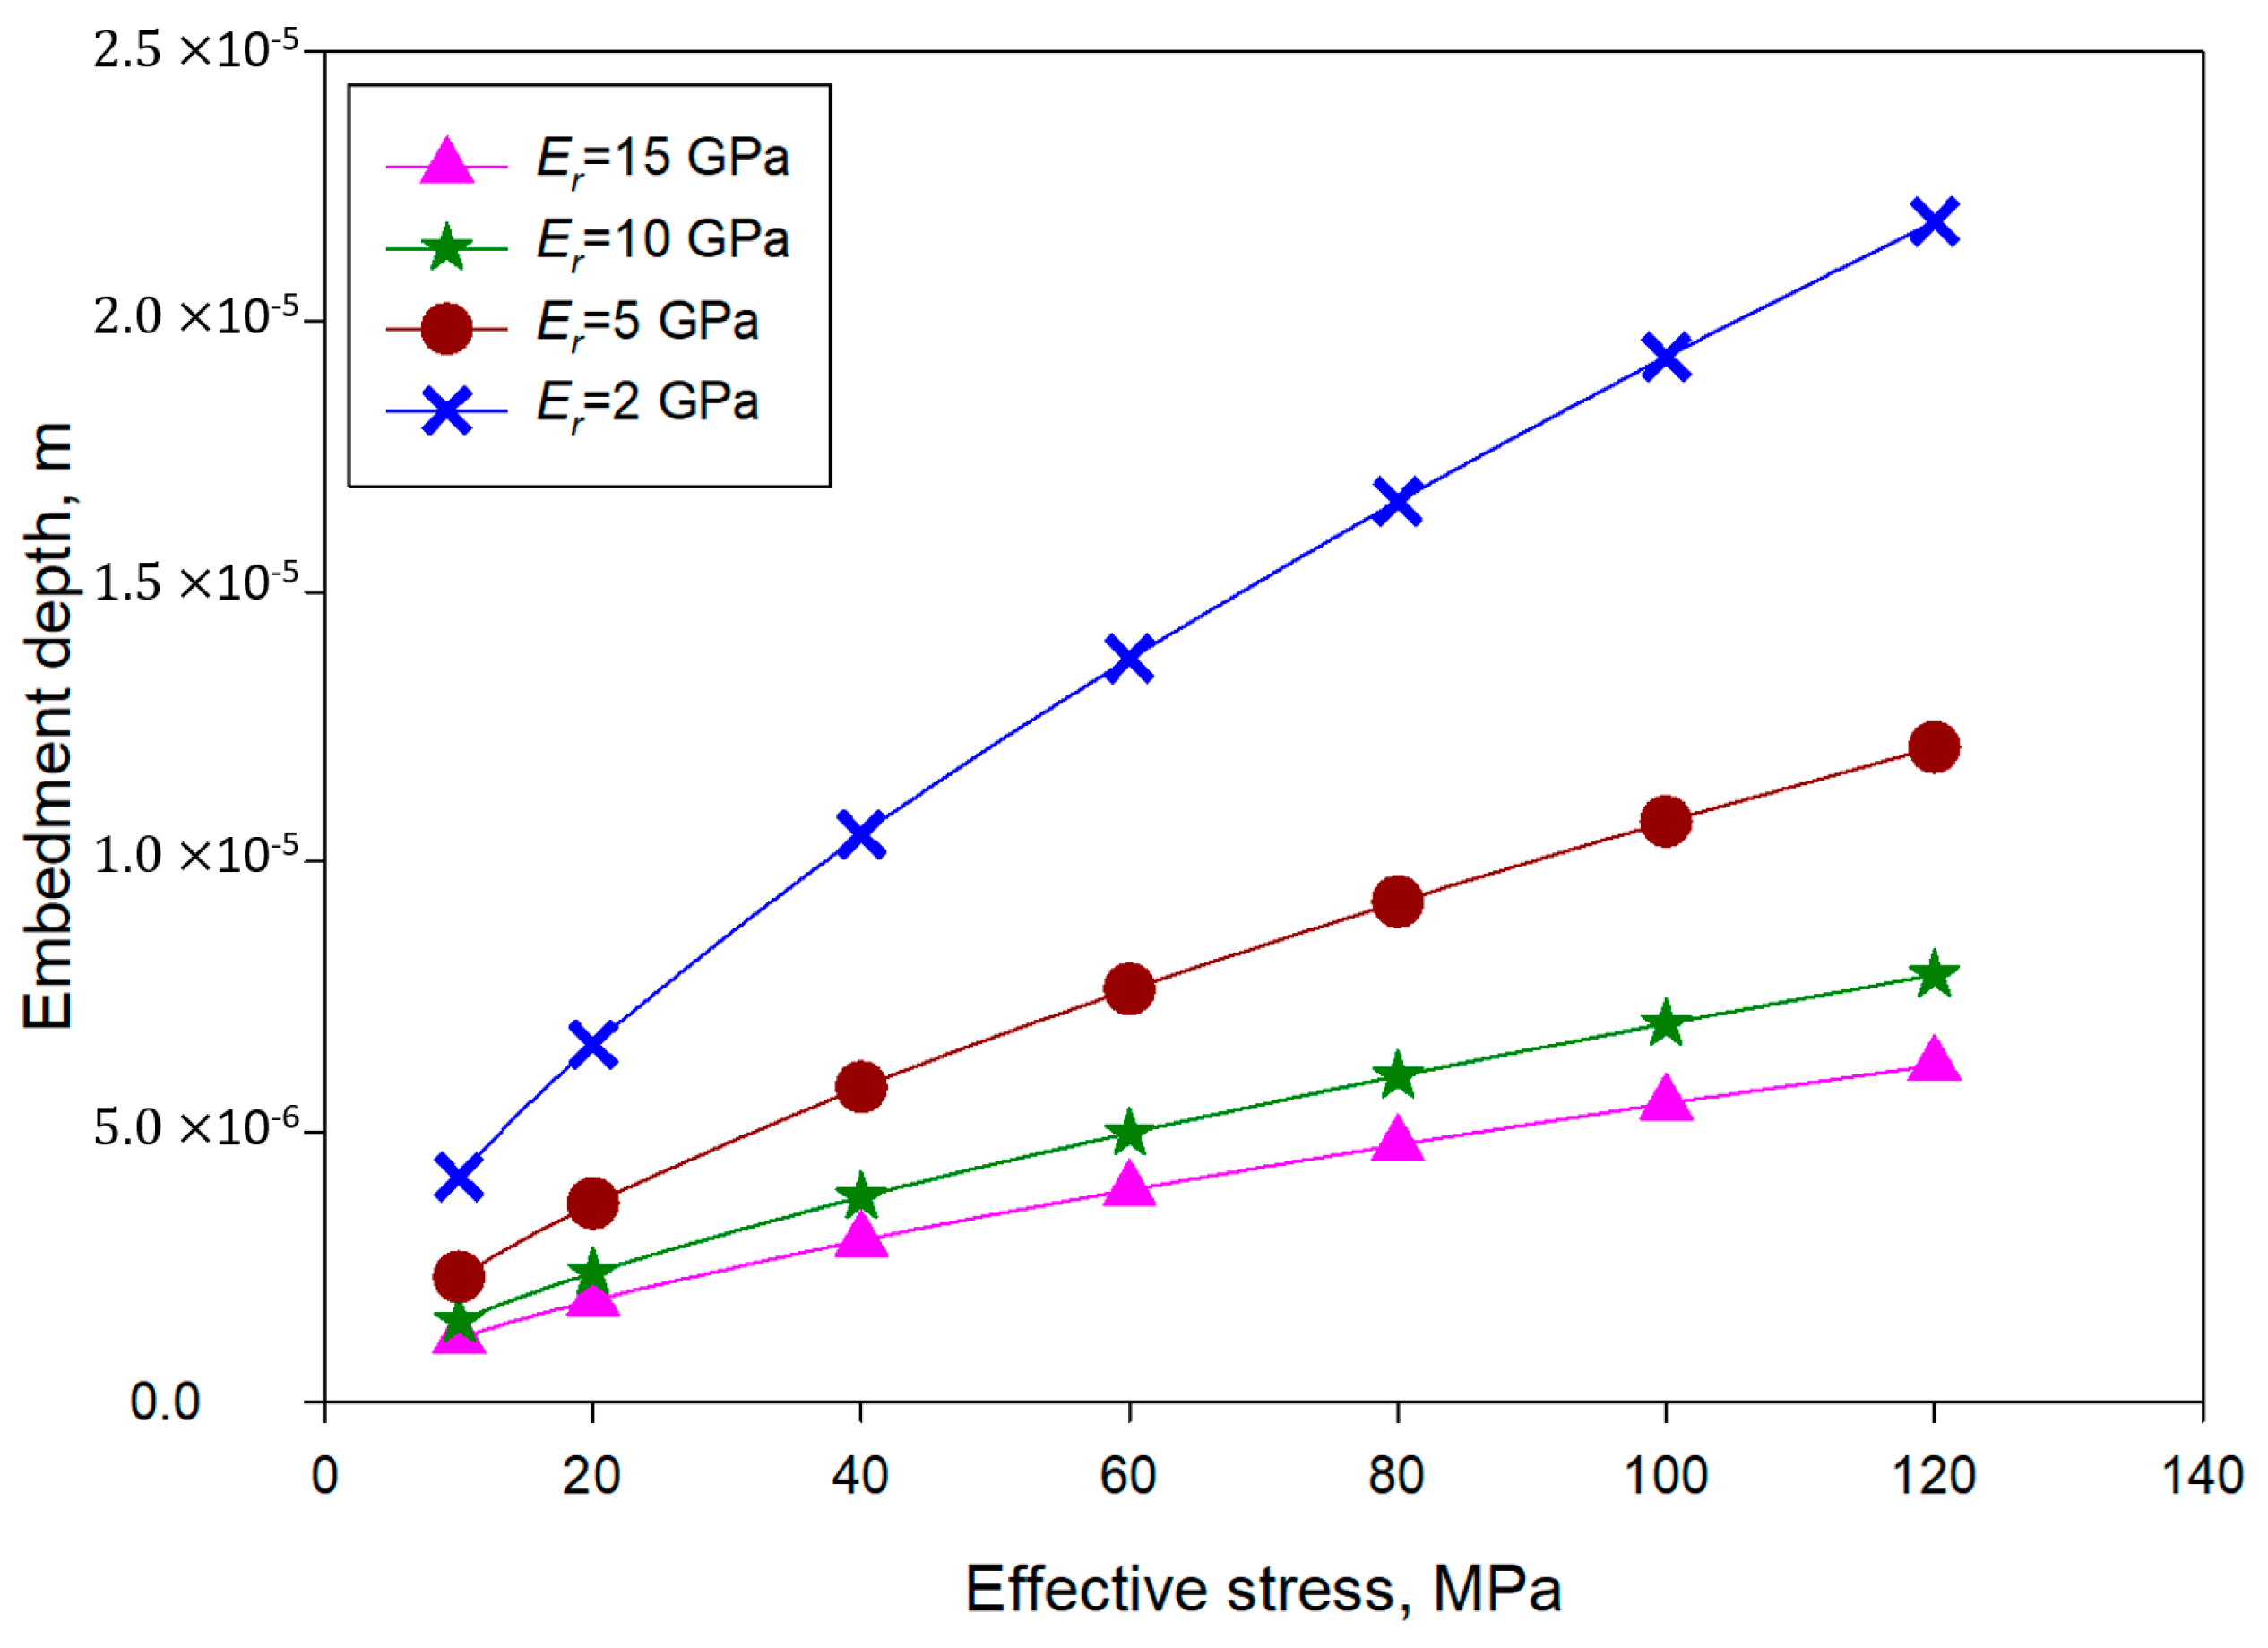
The single-layer propped fracture conductivity was more sensitive to proppant embedment due to a narrower fracture width. Equation (17) was used to calculate the initial porosity, while the initial fracture aperture was equal to the diameter of the proppant particle. Fracturing-fluid-induced hydration softens the fracture surface, leading to a significant fracture surface elastic modulus ( E r ) reduction. This is due to the long-term chemical and physical action of water on the rock [37]. Therefore, the fracture surface elastic modulus here ranged from 5 GPa to 15 GPa. Figure 13 shows the conductivity evolution with different fracture surface elastic moduli. In general, the fracture conductivity dropped with a decrease in the elastic modulus. However, when the modulus changed from 15 GPa to 10 GPa, the conductivity change was marginal. When the modulus further dropped to 5 GPa, a substantial conductivity drop could be observed. For single-layer propped fractures with identical proppants, the difference in the conductivity drop under the same stress state was simply caused by different embedment depths. Figure 14 shows the variation in the embedment depth with different fracture surface elastic moduli under different stress conditions. The embedment depth rose dramatically when the elastic modulus was reduced to 2 GPa. However, as the modulus varied from 15 GPa to 10 GPa, the embedment depth only slightly increased. The impact of the fracture surface’s elasticity on the fracture conductivity became more noticeable when the effective stress was large.

4.4. Impacts of Propped Fracture’s Initial Aperture

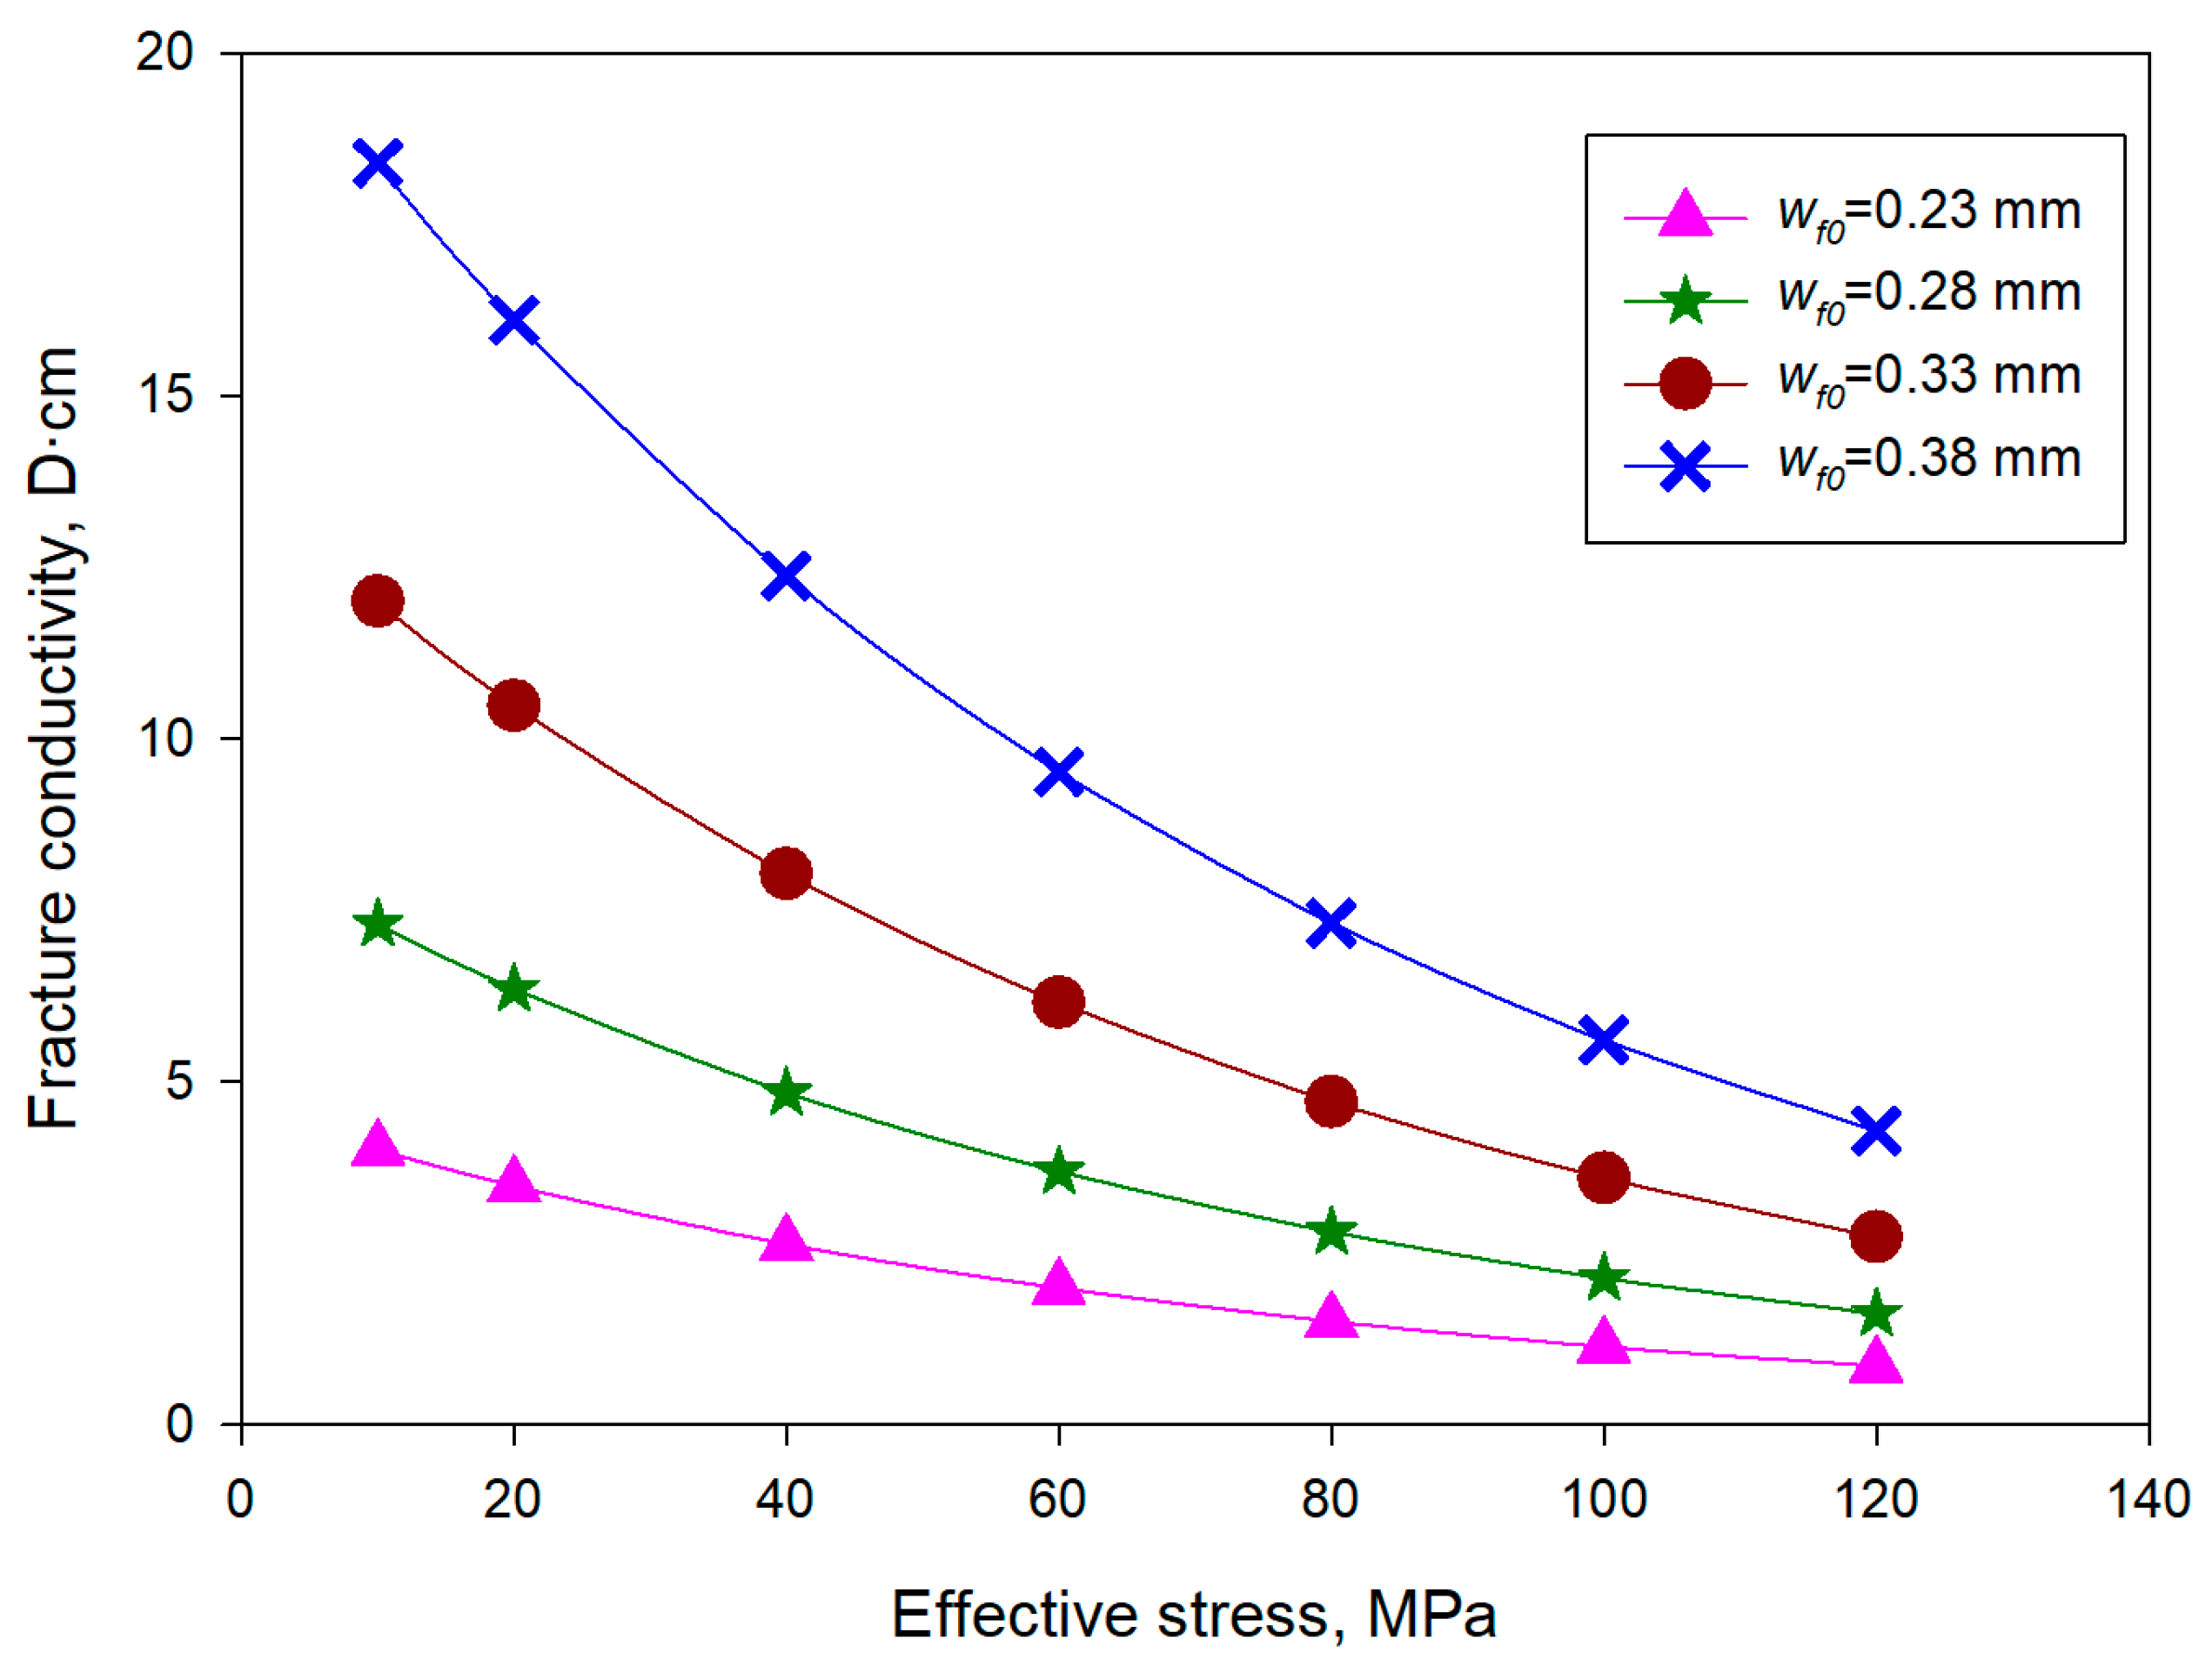
The fracture aperture plays a pivotal role in controlling fractured reservoir production behavior [38]. The initial aperture of propped fractures determines the overall magnitude of the conductivity during the evolution process. The range of the initial fracture aperture depended on the number of proppant layers. Here, the fracture width ranged from 0.23 mm to 0.38 mm. During the fracture compaction process, both the fracture width and permeability dropped. Figure 15 shows the fracture conductivity evolution with different initial fracture apertures. Under low-effective-stress conditions, the conductivity differences among cases with different apertures were relatively large. However, with increasing effective stress, the differences declined significantly. This indicates that for shallow unconventional reservoirs, the proppant concentration is a crucial parameter that determines the initial fracture aperture. Larger-sized proppants can also offer a larger initial fracture aperture. For deep unconventional formations with high in situ stress, the proppant concentration is less important, and field engineers should focus more on the proppant strength to avoid proppant crushing. In addition, their high closure stress can easily close unpropped fractures. Therefore, graded proppant injection (injecting small-sized proppants followed by larger-sized proppants with a decreasing concentration) is recommended to reduce the unpropped fracture length.

4.5. The Evolution of the Overall Fracture Network Conductivity

After gaining an understanding of the evolution behavior of propped and unpropped fractures, the overall fracture network conductivity evolution was analyzed. The fracture geometry and the corresponding fluid flow resistance shown in Figure 7 were used as a conceptual model. The main fracture contained a multi-layer propped fracture area and an unpropped fracture area, while the fracture branches consisted of a single-layer propped area and an unpropped area. Equations (24)–(26) were used to calculate the equivalent conductivity of the fracture system. In Figure 7, the length values of different sections are L 1 = 30 m, L 2 = 30 m, L 3 = 50 m, L 4 = 30 m, and L 5 = 50 m. The basic fracture segment properties are shown in Table 1. The porosity of the multi-layer propped fracture was set as 0.2. For single-layer propped fractures, the basic rock properties were the same as those of multi-layer propped fractures. The total effective length of the fracture network was 110 m. The fracture height and fluid viscosity were assumed to be identical for all the segments. Therefore, the overall fracture conductivity was
F c d , n e t = L t L 1 F c d 1 + 1 1 L 2 F c d 2 + L 3 F c d 3 + 1 L 2 F c d 2 + L 3 F c d 3 + 1 L 4 F c d 4 + L 5 F c d 5
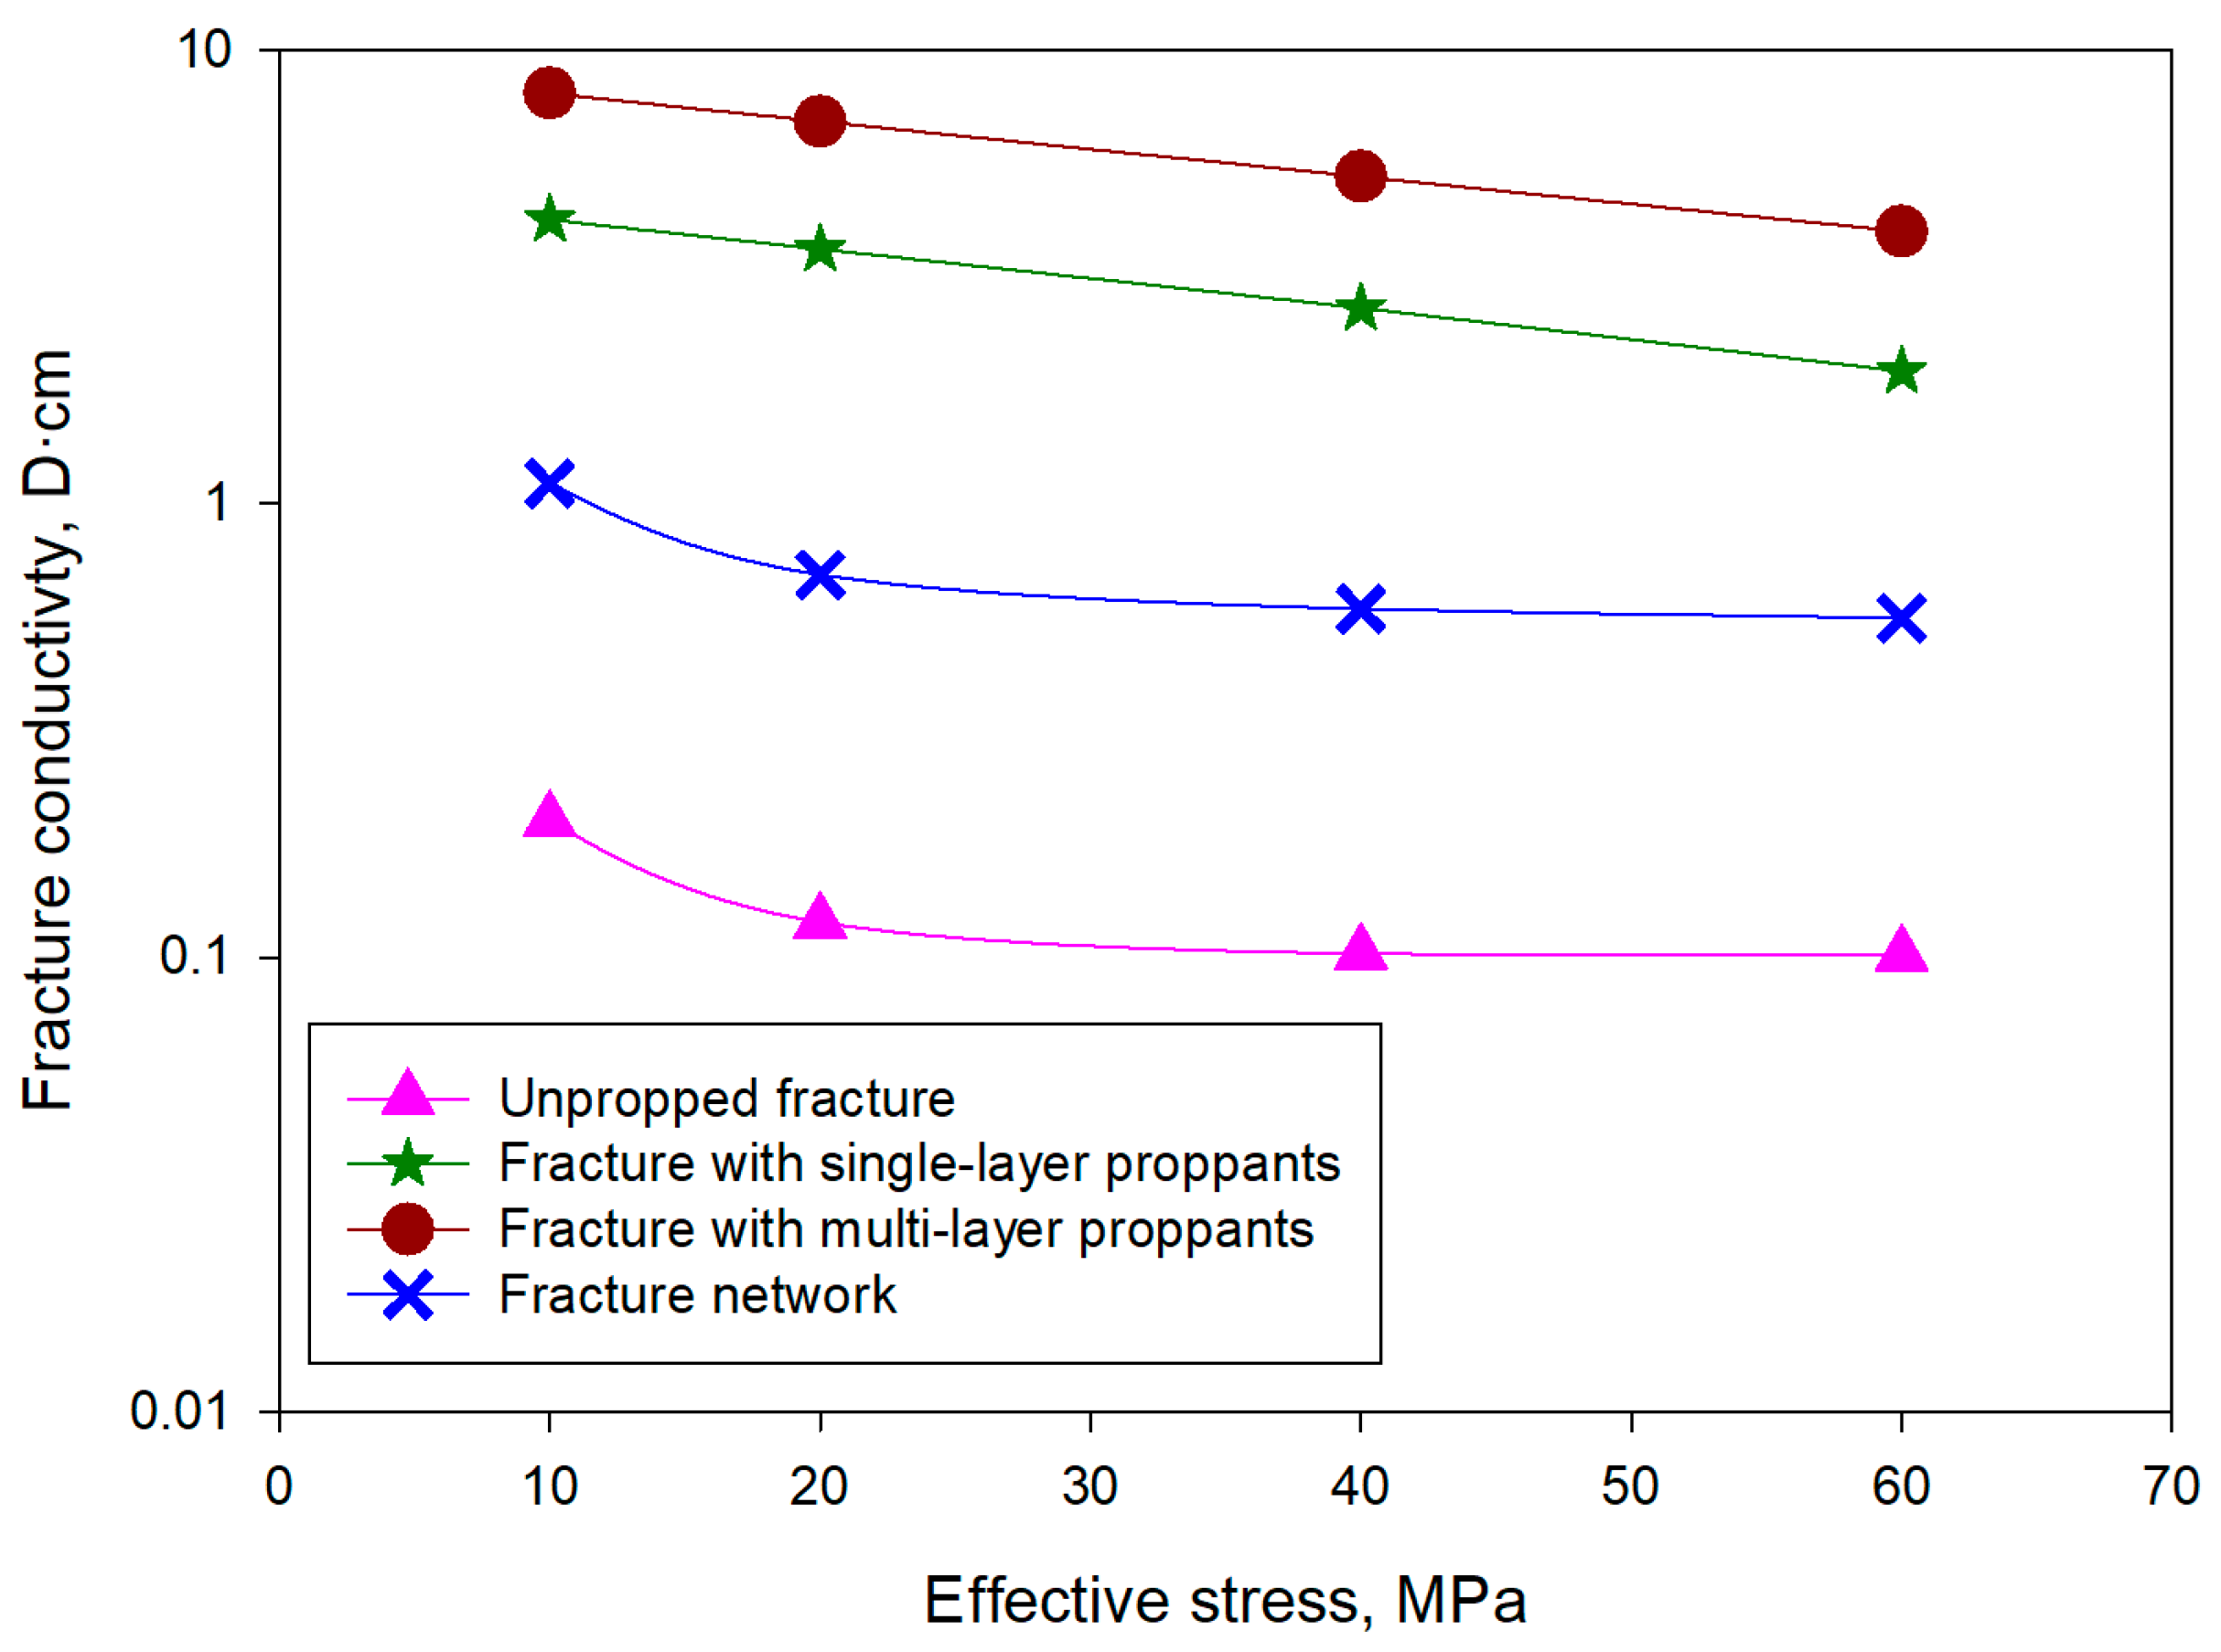
Figure 16 compares the conductivity evolution behavior of different fracture segments and the whole fracture network. The fracture network conductivity was close to the unpropped fracture conductivity. This indicates that the conductivity of unpropped fracture segments dominated the overall fracture network conductivity. Note that Figure 16 is a semi-log plot. Figure 17 shows the impacts of the unpropped fracture segment’s length on the fracture network conductivity. The unpropped fracture length decreased gradually from 50 m to 10 m, while the total length of the main fracture and branches was fixed. With the unpropped section becoming smaller, the fracture network conductivity rose. When the unpropped fracture length decreased to 20 m, a significant conductivity increment could be observed. There was also a transition in the curve’s shape from the shape of unpropped fracture conductivity curves to that of propped fracture conductivity curves. As for the fully propped fracture network, its conductivity was considerably larger than that of those partially propped networks. The above factors further emphasize the importance of the high-efficiency placement of proppants. Partially propped fractures significantly impaired the overall conductivity.

5. Conclusions

In this study, a generic fracture conductivity model incorporating unpropped fracture segments, single-layer propped fracture segments, and multi-layer propped fracture segments was established. For multi-layer propped fracture segments, the viscous shear caused by the fracture walls, proppant embedment, and proppant compaction (dynamic changes in the porosity and height) were considered. For single-layer propped fracture segments, proppant embedment, proppant deformation, and the viscous shear were included. As for unpropped fracture segments, the stress-dependent compressibility was incorporated in the model. The conductivity of the partially propped fracture network was determined by integrating the conductivity of different fracture segments using hydraulic–electric analogies. The model was verified against fracture conductivity measurement data. According to a set of sensitivity analyses, the following key conclusions can be drawn:
(1)
The proppant pack compressibility mainly controlled the porosity of the proppant pack and hence its permeability. An increase in the proppant pack compressibility substantially impaired the conductivity, especially under high-stress conditions. When the compressibility was larger than 0.05 MPa−1, the conductivity was significantly reduced under an effective stress of 80 MPa or larger.
(2)
The unpropped fracture compressibility changed with the effective stress. With an increase in the compressibility reduction rate, the fracture conductivity reduction slowed down as the effective stress increased. When the rate of decrease reached 0.3 MPa−1, the unpropped fracture conductivity was relatively stable, with the effective stress changing from 10 to 30 MPa.
(3)
The fracture surface elastic modulus of single-layer propped fractures mainly influenced the proppant embedment depth. As a result, it dominated the fracture width and propped segment porosity. With a decrease in the elastic modulus from 15 GPa to 10 GPa, the conductivity evolution curves only slightly moved down. As the modulus was decreased to 5 GPa, a significant conductivity reduction and substantial embedment depth increment could be observed.
(4)
A larger initial propped fracture aperture led to a higher fracture conductivity under the same stress conditions. The initial propped fracture aperture is crucial for shallow unconventional reservoirs as the conductivity difference at different initial apertures is more noticeable under low in situ stress conditions. However, this parameter is less important for deep unconventional formations because the high in situ stress narrows the conductivity differences among cases with different initial fracture apertures.
(5)
The overall fracture network conductivity was heavily influenced by the proportion of unpropped fracture segments. The fracture network conductivity was close to the unpropped fracture segment’s conductivity, even though the unpropped section length was half of the fracture network length. The shape of the fracture network conductivity evolution curve changed from that of the unpropped fracture conductivity curve to that of the propped fracture conductivity curve as the unpropped length proportion decreased from 45.5% to 9.1%. Achieving high proppant placement efficiency is vital for achieving overall high conductivity for a fracture network.
The proposed model can be further modified by adding the impact of two-stage or three-stage rock creep deformation for deep formations. In addition, the current propped fracture conductivity model only fully considers the support provided by proppants in the vertical direction. Further research could be performed on the conductivity of fracture segments that are partially propped in the vertical direction. Moreover, the high-velocity non-Darcy flow could be considered to address the fracture fluid flow in high-productivity wells.

Author Contributions

Conceptualization, J.Z. and C.L.; methodology, G.S., Y.Z., X.J., J.Z., S.X. and C.L.; validation, Q.W. and J.Z.; formal analysis, G.S., Y.Z., Z.Z., Q.W. and S.X.; investigation, G.S., Y.Z., X.J. and C.L.; data curation, Z.Z., Q.W. and J.Z.; writing—original draft, G.S., Y.Z., X.J., Q.W. and J.Z.; writing—review and editing, S.X. and C.L. All authors have read and agreed to the published version of the manuscript.

Funding

This research was funded by [National Natural Science Foundation of China] grant number [52404045], [China Postdoctoral Science Foundation] grant number [2023M732925], [International Postdoctoral Exchange Fellowship Program] grant number [YJ20220169].

Data Availability Statement

The original contributions presented in this study are included in the article. Further inquiries can be directed to the corresponding authors.

Conflicts of Interest

Authors Guolin Shao, Yizhong Zhao, Xiaodong Jia, Zhaoyang Zhi and Qijing Wang were employed by the company Shengli Oilfield Petroleum Exploitation Center, Sinopec. The remaining authors declare that the research was conducted in the absence of any commercial or financial relationships that could be construed as a potential conflict of interest.

References

  1. Danso, D.K.; Negash, B.M.; Ahmed, T.Y.; Yekeen, N.; Ganat, T.A.O. Recent advances in multifunctional proppant technology and increased well output with micro and nano proppants. J. Pet. Sci. Eng. 2021, 196, 108026. [Google Scholar] [CrossRef]
  2. Wu, W.; Sharma, M.M. A model for the conductivity and compliance of unpropped and natural fractures. SPE J. 2017, 22, 1893–1914. [Google Scholar] [CrossRef]
  3. Neto, L.B.; Khanna, A.; Kotousov, A. Conductivity and performance of hydraulic fractures partially filled with compressible proppant packs. Int. J. Rock Mech. Min. Sci. 2015, 74, 1–9. [Google Scholar] [CrossRef]
  4. Zuo, L.; Li, X.; Han, Z.; You, Q.; Liu, X. Numerical Simulation of Proppant Transport in Major and Branching Fractures Based on CFD-DEM. ACS Omega 2024, 9, 13163–13171. [Google Scholar] [CrossRef]
  5. Li, Q.; Li, Q.; Cao, H.; Wu, J.; Wang, F.; Wang, Y. The Crack Propagation Behaviour of CO2 Fracturing Fluid in Unconventional Low Permeability Reservoirs: Factor Analysis and Mechanism Revelation. Processes 2025, 13, 159. [Google Scholar] [CrossRef]
  6. Barboza, B.R.; Chen, B.; Li, C. A review on proppant transport modelling. J. Pet. Sci. Eng. 2021, 204, 108753. [Google Scholar] [CrossRef]
  7. Guerra, J.; Zhu, D.; Hill, A.D. Impairment of fracture conductivity in the eagle ford shale formation. SPE Prod. Oper. 2018, 33, 637–653. [Google Scholar] [CrossRef]
  8. Shamsi, M.M.M.; Nia, S.F.; Jessen, K. Dynamic conductivity of proppant-filled fractures. J. Pet. Sci. Eng. 2017, 151, 183–193. [Google Scholar] [CrossRef]
  9. Mittal, A.; Rai, C.S.; Sondergeld, C.H. Proppant-conductivity testing under simulated reservoir conditions: Impact of crushing, embedment, and diagenesis on long-term production in shales. SPE J. 2018, 23, 1304–1315. [Google Scholar] [CrossRef]
  10. Liu, Y.X.; Zhou, H.Y.; Guo, J.C.; Zhang, Q.; Chen, C. Controlling factors of fracture aperture reduction based on experimental study using proppant pack apparent Young’s modulus. J. Pet. Sci. Eng. 2022, 208, 109506. [Google Scholar] [CrossRef]
  11. Geng, S.; Wang, Q.; Zhu, R.; Li, C. Experimental and numerical investigation of Non-Darcy flow in propped hydraulic fractures: Identification and characterization. Gas Sci. Eng. 2024, 121, 205171. [Google Scholar] [CrossRef]
  12. Van der Vlis, A.C.; Haafkens, R.; Schipper, B.A.; Visser, W. Criteria for proppant placement and fracture conductivity. In Proceedings of the SPE Annual Technical Conference and Exhibition, Dallas, TX, USA, 28 September–1 October 1975; SPE: Calgary, AB, Canada, 1975. [Google Scholar]
  13. Volk, L.J.; Raible, C.J.; Carroll, H.B.; Spears, J.S. Embedment of high strength proppant into low-permeability reservoir rock. In Proceedings of the SPE Rocky Mountain Petroleum Technology Conference/Low-Permeability Reservoirs Symposium, Denver, CO, USA, 27–29 May 1981; SPE: Calgary, AB, Canada, 1981. [Google Scholar]
  14. Li, K.; Gao, Y.; Lyu, Y.; Man, W. New Mathematical Models for Calculating Proppant Embedment and Fracture Conductivity. SPE J. 2015, 20, 496–507. [Google Scholar] [CrossRef]
  15. Awoleke, O.O.; Zhu, D.; Hill, A.D. New propped-fracture-conductivity models for tight gas sands. SPE J. 2016, 21, 1508–1517. [Google Scholar] [CrossRef]
  16. Zhang, J.; Zhu, D.; Hill, A.D. Water-induced damage to propped-fracture conductivity in shale formations. SPE Prod. Oper. 2016, 31, 147–156. [Google Scholar] [CrossRef]
  17. Zhu, H.; Zhao, Y.P.; Feng, Y.; Wang, H.; Zhang, L.; McLennan, J.D. Modeling of fracture width and conductivity in channel fracturing with nonlinear proppant-pillar deformation. SPE J. 2019, 24, 1288–1308. [Google Scholar] [CrossRef]
  18. Liu, Y.; Mu, S.; Guo, J.; Chen, C.; Wang, S. Model for fracture conductivity considering particle size distribution in a proppant monolayer. J. Nat. Gas Sci. Eng. 2021, 95, 104188. [Google Scholar] [CrossRef]
  19. Liu, Y.; Mu, S.; Guo, J.; Yang, X.; Chen, C.; Liu, H. Analytical model for fracture conductivity with multiple particle sizes and creep deformation. J. Nat. Gas Sci. Eng. 2022, 102, 104607. [Google Scholar] [CrossRef]
  20. Cheng, Q.; Zhou, S.; Li, B.; Pan, Z.; Liu, D.; Yan, D. Integrating embedment and creep behavior for multisize proppant in shale: Conceptual model and validation. SPE J. 2023, 28, 3389–3408. [Google Scholar] [CrossRef]
  21. Teng, B.; Li, H.; Yu, H. A novel analytical fracture-permeability model dependent on both fracture width and proppant-pack properties. SPE J. 2020, 25, 3031–3050. [Google Scholar] [CrossRef]
  22. Chen, Y.; Wang, H.; Li, T.; Wang, Y.; Ren, F.; Ma, G. Evaluation of geothermal development considering proppant embedment in hydraulic fractures. Renew. Energy 2020, 153, 985–997. [Google Scholar] [CrossRef]
  23. Kohshour, I.O.; Leshchyshyn, T.; Munro, J.; Yorro, M.C.; Adejumo, A.T.; Ahmed, U.; Barati, R.; Kugler, I.; Reynolds, M.; Cullen, M.; et al. Examination of water management challenges and solutions in shale resource development-could waterless fracturing technologies work? In Proceedings of the SPE/AAPG/SEG Unconventional Resources Technology Conference, URTEC, San Antonio, TX, USA, 1–3 August 2016.
  24. Xu, J.; Ding, Y.; Yang, L.; Liu, Z.; Gao, R.; Yang, H.; Wang, Z. Effect of proppant deformation and embedment on fracture conductivity after fracturing fluid loss. J. Nat. Gas Sci. Eng. 2019, 71, 102986. [Google Scholar]
  25. Li, J.; Li, B.; Lu, J.; Duan, S.; Gao, Z. Evolution of fracture permeability and its compressibility in proppant-supported shale. J. Nat. Gas Sci. Eng. 2022, 105, 104713. [Google Scholar]
  26. Reiss, L.H. The Reservoir Engineering Aspects of Fractured Formations; Editions Technip: Paris, France, 1980. [Google Scholar]
  27. Xu, Y.; Ezulike, O.; Dehghanpour, H. Estimating compressibility of complex fracture networks in unconventional reservoirs. Int. J. Rock Mech. Min. Sci. 2020, 127, 104186. [Google Scholar]
  28. Cui, X.; Bustin, R.M. Volumetric strain associated with methane desorption and its impact on coalbed gas production from deep coal seams. AAPG Bull. 2005, 89, 1181–1202. [Google Scholar] [CrossRef]
  29. McKee, C.R.; Bumb, A.C.; Koenig, R.A. Stress-dependent permeability and porosity of coal and other geologic formations. SPE Form. Eval. 1988, 3, 81–91. [Google Scholar] [CrossRef]
  30. Zeng, F.; Peng, F.; Guo, J.; Rui, Z.; Xiang, J. Gas mass transport model for microfractures considering the dynamic variation of width in shale reservoirs. SPE Reserv. Eval. Eng. 2019, 22, 1265–1281. [Google Scholar] [CrossRef]
  31. Ji, G.; Chen, S.; Zhou, T.; Huang, Z.; Li, F. A new method of predicting network fracture conductivity based on the similitude principle of water and electricity. Phys. Fluids 2021, 33, 116605. [Google Scholar] [CrossRef]
  32. Guo, J.; Ren, J.; Wang, S.; Chen, C.; Lai, J.; Gou, B. Comprehensive study of fracture flow characteristic and feasibility of hybrid volume stimulation technique in tight fractured carbonate gas reservoir. J. Pet. Sci. Eng. 2019, 174, 362–373. [Google Scholar] [CrossRef]
  33. Zhang, J.; Kamenov, A.; Zhu, D.; Hill, A.D. Laboratory Measurement of Hydraulic Fracture Conductivities in the Barnett Shale. SPE Prod. Oper. 2014, 29, 216–227. [Google Scholar] [CrossRef]
  34. Tan, Y.; Pan, Z.; Liu, J.; Feng, X.T.; Connell, L.D. Laboratory study of proppant on shale fracture permeability and compressibility. Fuel 2018, 222, 83–97. [Google Scholar] [CrossRef]
  35. Chen, T.; Fu, Y.; Feng, X.T.; Tan, Y.; Cui, G.; Elsworth, D.; Pan, Z. Gas permeability and fracture compressibility for proppant-supported shale fractures under high stress. J. Nat. Gas Sci. Eng. 2021, 95, 104157. [Google Scholar] [CrossRef]
  36. Tang, J.; Zhu, J.; Shao, T.; Wang, J.; Jiang, Y. A coal permeability model with variable fracture compressibility considering triaxial strain condition. Nat. Resour. Res. 2021, 30, 1577–1595. [Google Scholar] [CrossRef]
  37. Ding, M.; He, M. Effect of water-induced rock softening on rock anisotropy during drilling process. Rock Mech. Rock Eng. 2024, 57, 8193–8214. [Google Scholar] [CrossRef]
  38. Pouraskarparast, Z.; Aghaei, H.; Colombera, L.; Masoero, E.; Ghaedi, M. Fracture aperture: A review on fundamental concepts, estimation methods, applications, and research gaps. Mar. Pet. Geol. 2024, 164, 106818. [Google Scholar] [CrossRef]
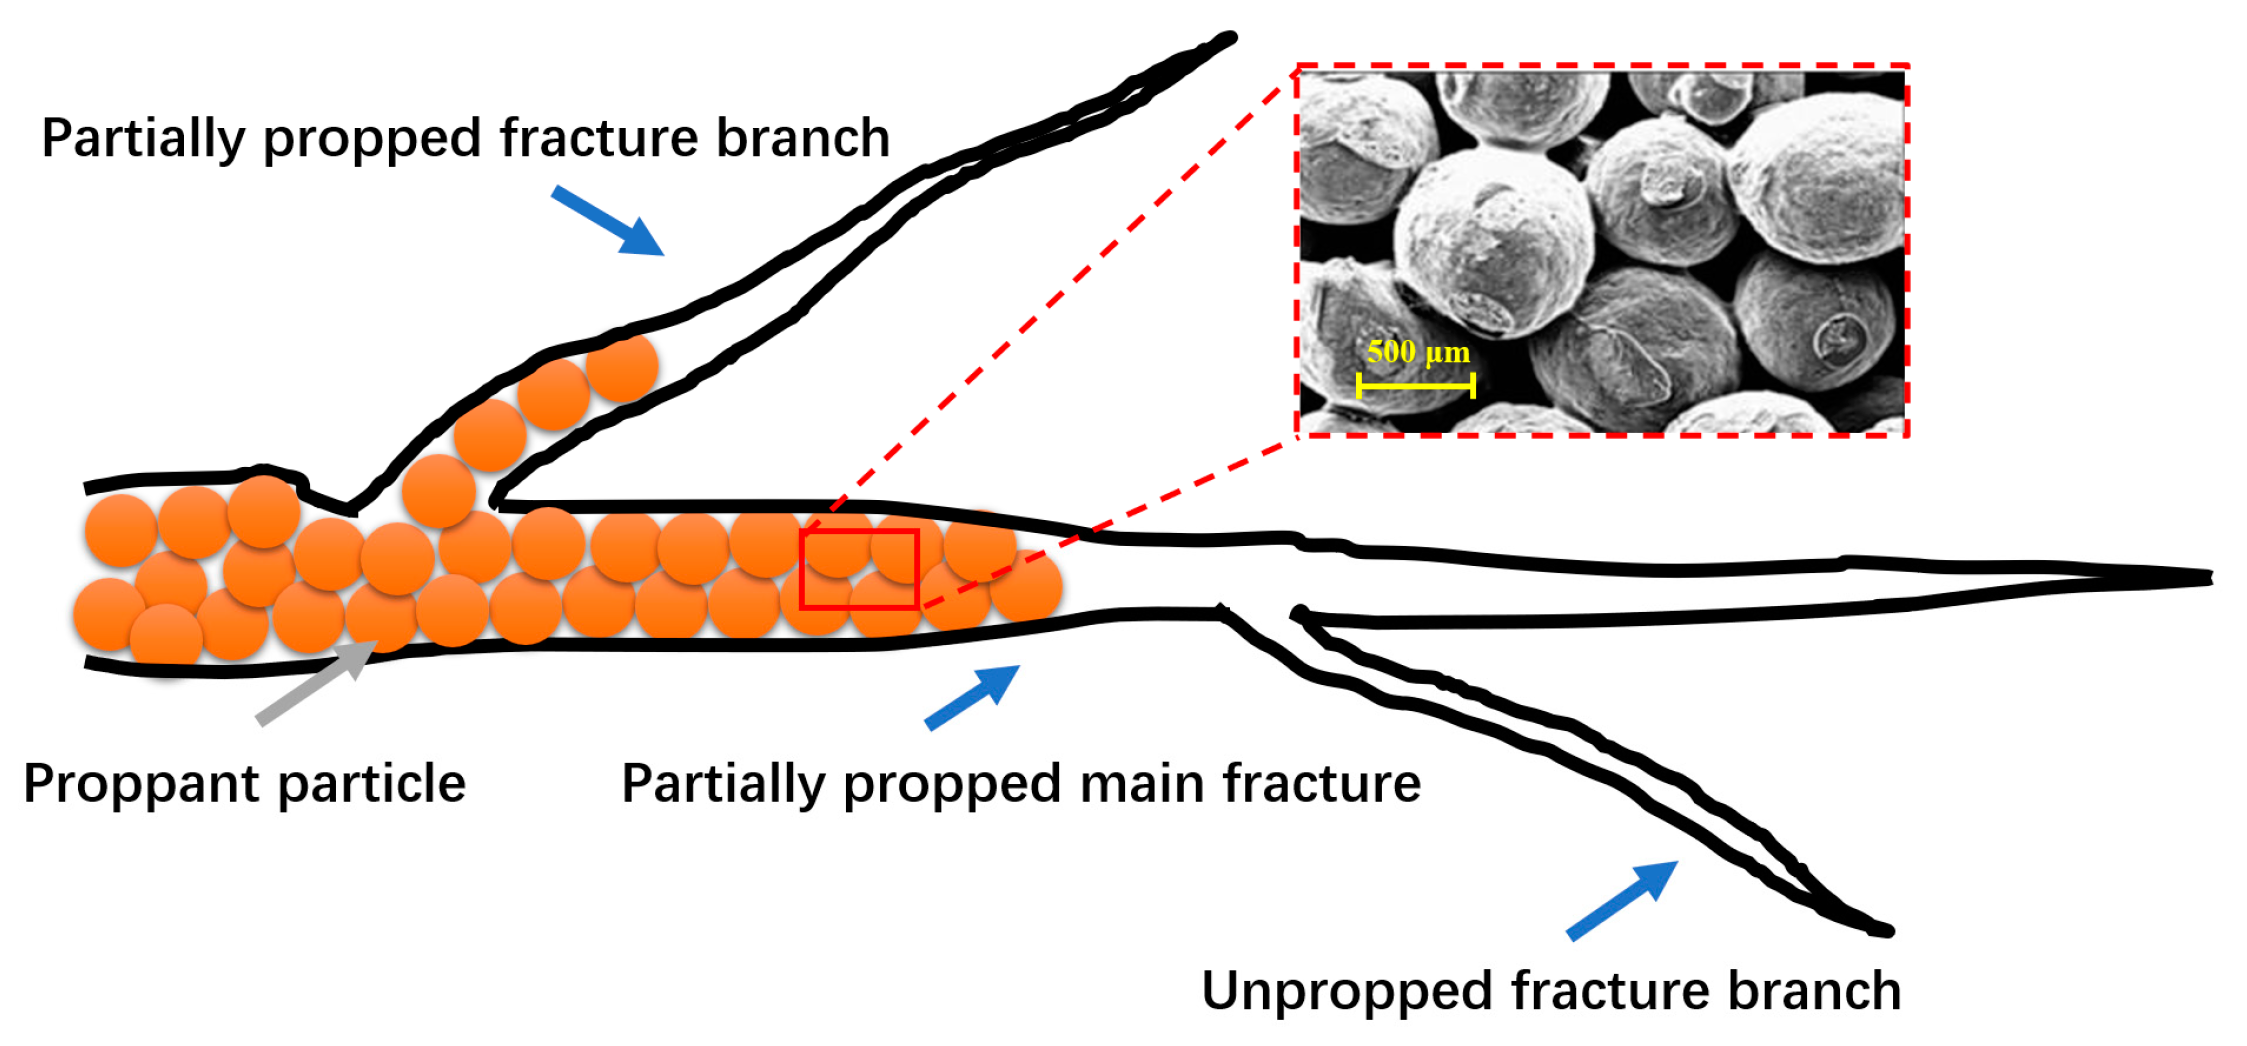
Figure 1. Schematic diagram of a partially propped fracture network (half-fractured network, modified from Oraki Kohshour et al. [23]).
Processes 13 01462 g001
Figure 2. Proppant embedment and the fracture aperture width change for the single-layer proppant placement condition.
Processes 13 01462 g002
Figure 3. Proppant embedment, proppant pack compaction, and the fracture aperture width change for the multi-layer proppant placement condition.
Processes 13 01462 g003
Figure 4. The relationship between the closure stress and the proppant pack thickness [10].
Processes 13 01462 g004
Figure 5. Fluid flow within a proppant pack that is sandwiched between the fracture surfaces ( l x is the fracture length direction and l y is the fracture width direction).
Processes 13 01462 g005
Figure 6. Porosity evolution due to compaction under a single-layer proppant placement condition.
Processes 13 01462 g006
Figure 7. Schematic of a fracture network and its flow resistance.
Processes 13 01462 g007
Figure 8. Comparison between the measured propped fracture conductivity data from Zhang et al. [33] and the calculation results.
Processes 13 01462 g008
Figure 9. Comparison between the measured unpropped fracture conductivity data from Zhang et al. [33] and the calculation results.
Processes 13 01462 g009
Figure 10. Impacts of proppant pack compressibility on fracture conductivity evolution.
Processes 13 01462 g010
Figure 11. Impacts of the compressibility reduction rate on the fracture conductivity evolution.
Processes 13 01462 g011
Figure 12. Impacts of the compressibility reduction rate on the fracture compressibility under different stress conditions.
Processes 13 01462 g012
Figure 13. Impacts of fracture surface elastic modulus ( E r ) on single-layer propped fracture conductivity.
Processes 13 01462 g013
Figure 14. Impacts of the fracture surface elastic modulus ( E r ) on the proppant embedment depth for single-layer propped fractures.
Processes 13 01462 g014
Figure 15. Impacts of propped fracture’s initial aperture on conductivity evolution.
Processes 13 01462 g015
Figure 16. Comparison of the conductivity of unpropped fractures, single-layer propped fractures, multi-layer propped fractures, and the fracture network.
Processes 13 01462 g016
Figure 17. Comparison of conductivity of fracture networks with different unpropped lengths.
Processes 13 01462 g017
Table 1. Input parameters of the fracture conductivity model (selected based on references [10,22,25,34]).
Propped FractureUnpropped Fracture
ParametersValuesParametersValues
w f 0 0.23 mm w f 0 0.049 mm
E * 93 GPa C u f 0 0.08 MPa−1
E a 0.8 GPa α 0.15 MPa−1
r 0.07 mm
ϕ p 0 0.1
C f 0.08 MPa−1
Disclaimer/Publisher’s Note: The statements, opinions and data contained in all publications are solely those of the individual author(s) and contributor(s) and not of MDPI and/or the editor(s). MDPI and/or the editor(s) disclaim responsibility for any injury to people or property resulting from any ideas, methods, instructions or products referred to in the content.