Abstract
Sunscreens are a major environmental concern because they are continually used and contain some of the most toxic compounds found in wastewater. The removal of sunscreen Types A and B was evaluated separately by modeling the effects of domestic waste-containing sunscreens. Different methods, such as electrocoagulation (EC), electro-oxidation (EO), ozonation (O3), and a combined electrooxidation-ozonation method (EO-O3), were analyzed based on the TOC and COD. All treatment methods exhibited high efficiency in degrading Type B sunscreen solutions. For Type A treatment, the best methods involved the use of ozone, with efficiencies of up to ~99% removal for Type B sunscreen and ~81% for Type A sunscreen. Overall, the best treatment method was the combined EO-O3 (99.1% removal for Type B and 88.8% for Type A). EO-O3 treatment was applied to pool water samples, achieving a COD removal of 79.5% after 15 min of treatment. Bioassays were performed using organic sativa common lettuce seeds to demonstrate the toxicity of the treated sunscreen-contaminated water before and after treatment. This paper offers promising results for a sustainable method of sunscreen removal, evaluating complete formulas rather than isolated UV filters.
1. Introduction
In recent years, some substances have been identified that were not previously considered pollutants, these substances have been identified and classified as emerging pollutants owing to the scientific developments in toxicity and pollution. Emerging contaminants (ECs) are also known as emerging pollutants (EPs), contaminants of emerging concern (CEC), and trace organic compounds (TrOCs). The United States Geological Survey defines them as natural or synthetic chemicals that are not monitored and whose effects are still under study []. A major part of such pollutants includes pharmaceutical and personal care products (PPCPs), including pharmaceuticals, hormones, pesticides, illicit drugs, artificial sweeteners, and UV filters.
Regarding sunscreens, some components have been mentioned for their toxicity, such as octocrylene. Octocrylene was an active ingredient in the sunscreens studied in this study. It is a clear, colorless, and viscous oil that was introduced into sunscreen and anti-aging cream formulas 15 years ago. The active ingredients most frequently found in surface water and treatment plants are octocrylene and benzophenone. The European Union monitors this product to ensure its safety, and it has been found in various environments to the point that it is considered an emerging micropollutant, similar to some pesticides, pharmaceuticals, hormones, and cosmetics []. Octocrylene is found in everyday facial care products and is used as a stabilizer for other UV filters. Current data on octocrylene indicate its low biodegradability. Chronic toxicity tests conducted with Daphnia have shown high toxicity values [].
Conventional treatments have been tested, such as biological treatments to degrade UV filters, adsorption, and filtration/flocculation with low efficiencies. There have been no significant studies on sunscreen treatment. UV filters are expected to photodegrade; however, their high lipophilicity makes them poorly biodegradable [].
Typical physicochemical treatments include electrocoagulation and advanced oxidation processes (AOPs). Electrocoagulation works when electricity is passed through water and produces coagulant precursors, and the colloidal matter is clustered from the dissolution of a suitable anode (e.g., Fe, Al, Zn). As a result, insoluble hydroxide three-dimensional gels are obtained, which retain the contaminants.
In AOPs, free radicals are formed that allow pollutants to be converted into more biodegradable compounds. In electro-oxidation (i.e., anodic oxidation), an electrical current is passed between two electrodes in an aqueous medium, producing hydrogen peroxide and hydroxyl radicals [].
With a global reaction:
Sunscreens contain active agents that are classified into two classes: organic and inorganic. Sunscreens have complex chemical compositions with preservatives and stabilizers, such as coloring compounds, emulsifiers, emollients, fragrances, and about 30% of sun protection substances. UV filters include broad-spectrum filters, as well as UVA and UVB protection [,]. The consequences of their use for marine biota are diverse, altering biogeochemical cycles, increasing the viral abundance of marine bacterio-plankton, and coral bleaching, leading to consequences similar to those produced by some metals. Pertinent studies are needed to evaluate the consequences in different bodies of water, and knowledge integration is urgently needed []. Recent research has focused mainly on compound detection and the extent of contamination. Toxicity studies typically focus on human health, observing hormonal effects in cell lines, effects on thyroid function, and neurological development in mammals [].
A study to determine if sunscreens are applied at a rate that can provide protection, based on the FDA recommendation for the in vitro application of 0.75 mg/cm2 of sunscreen, reflected that the actual use is less than recommended, which decreases the sun protection capacity. In such cases, it is advantageous to use various cosmetics with a sun protection factor []. Most UV filters are hydrophobic and have low solubility in aqueous media; therefore, they do not accumulate at high concentrations in the water column. They accumulate in the 1000-µm surface microlayer of the ocean, which forms the air-water interface, and in marine sediments [].
For many years, the risks of emerging pollutants were mostly ignored because the minute amounts in which they are released (typically nanograms or micrograms) did not seem significant. Until recently, their bioaccumulation potential was noticed, and studies on their effects, for example, over coral reefs, especially as coral bleachers, are now available []. Coral reefs cover less than 0.1 percent of the marine ecosystem, yet one-fourth of the known aquatic species depend on them []. Recent research has shown that some ultraviolet filters cause coral bleaching []. Therefore, many regions have implemented policies regarding sunscreen use. For instance, Hawaii has banned sunscreens containing benzophenone-3 and ethyl hexyl methoxycinnamate (EHMC or octinoxate) []. In addition, since 1998, no new sunscreens have been approved in the United States, and currently, there are only 16 UV filters with official approval []. Xel-Há Natural Park in Quintana Roo, Mexico, advises using only sunscreens free of organic UVFs, and the US National Park Services advises reducing sunscreen use [].
Risk studies are based on the concentration of UV filters and biotic parameters, such as coral life stages, metabolic capacity, and sensitivity, as well as abiotic parameters, such as solar radiation, the presence of other pollutants, and water temperature []. This leads to controversial regulations, as corals are complex systems to assess, and UV filters are difficult substances to treat. These facts highlight the importance of covering different angles and perspectives to solve this issue and the difficulties that would arise with the treatment of sunscreens []. Sunscreen pollution has been evaluated from different perspectives but in isolation. Such studies need to be compiled into a single database. In 2017, a study on French beaches concluded that for every 3000 people that visit per day, the approximate amount of UV filters released is ~52 kg [].
Along beaches, one can usually find showers where tourists rinse off the sand, and a recent study in Hawaii [] showed that this results in high contamination of petrochemical residues. The European Commission guidance is normally followed to calculate the risk quotients (RQs). Values greater than 1.0 mg/ft2 indicate an unacceptable risk that requires immediate action, while values between 0.5 and 1.0 indicate a moderate concern, and values between 0.1 and 0.49 mg/ft2 indicate a low-risk impact. (Values below 0.1 raise no significant concerns.) Oxybenzone levels, according to this RQ classification, are often above 1 mg/ft2 and can be found in areas with high tourism density. Octocrylene was also above 1 mg/ft2, except at the Wailupe Beach Park site (0.71 mg/ft2). This site is groomed every day between 4 and 6 a.m., and this physical motion could alter the results.
Sunscreens labeled as “reef safe” normally lack scientific evidence to hold this classification, as there is no exact definition or appropriate regulation []. Therefore, the establishment of global parameters for hazardous assessment is urgently needed. Pollution mitigation works through three main strategies: (a) reducing the use of pollutants, (b) prohibiting pollutants, and (c) removing pollutants. Some areas in Hawaii are implementing all three strategies, educating tourists and locals about compounds to avoid in sunscreens and encouraging them to wear sun-protective clothing to reduce the frequency of sunscreen application [,].
During COVID-19, as human activity slowed worldwide, the perfect opportunity to measure whether this would affect pollution levels appeared, and the evaluation done in two different national parks in the USA showed a decrease in the concentration of UV filters []. One of the worst consequences of the increase in sunscreen usage is the increased concentration of these chemicals as the food chain advances, which suggests biomagnification. Bioaccumulation in mammals was reported for the first time in 2013, and the presence of octocrylene was detected in 21 of the 56 species evaluated. These investigations were precursors to evaluating bioaccumulation in humans, although they remain unproven []. The temporary closure of some Thai beaches has led to their ecological recovery. An example of this is Maya Bay, which did not allow tourism for three years and then began to control the number of tourists it received [].
Although the impact of sunscreen on reef bleaching was already known, it was only in 2020 that an article was published clarifying that some active ingredients in sunscreen affect freshwater ecosystems. For instance, avobenzone, octocrylene, and oxybenzone are lethal to some aquatic organisms []. The implementation of the second strategy prohibits the use of sunscreens containing oxybenzone, octinoxate, or octocrylene. The best example of this is Hawaii, where sunscreen dispensers that do not contain these components are installed in certain areas [].
The third strategy for pollution mitigation from sunscreen involves their removal. While this is still theoretical, proposals include the use of microbeads to adsorb aromatic compounds from UV filters and the collection of shower water for treatment before being released into seawater or rivers. Nonetheless, an additional treatment method must be implemented, as tap water treatments are insufficient to remove drugs, sunscreens, and cosmetics. This is especially important because the use of biosolids in agricultural settings may result in indirect contamination by sunscreens [].
Sunscreens can bioaccumulate in mussels, crustaceans, shrimp, squid, fish, sea urchins, dolphins, and cormorants [,]. Other adverse effects include coral bleaching, alterations in the behavior of species, endocrine disruption, reproductive modification, neurotoxicity, cytotoxicity, and even death of certain organisms [,]. The endocrine-disrupting effects of UV filters are difficult to predict since sunscreens often contain multiple components []. Organic filters in contact with the environment can produce reactive oxygen species capable of damaging lipids, proteins, and DNA due to the high levels of stress they induce in aquatic organisms [].
Sunscreen research on their determination and elimination presents some challenges, as many analytical techniques can be destructive, which does not allow them to be ascertained, although, for example, infrared spectroscopy has proven effective for the non-destructive characterization of sunscreens; the lack of information on these compounds in a global database currently hampers the completion of these studies []. Conventional technologies do not eliminate contaminants of emerging concern, and advanced oxidation processes (AOPs) should overcome the gaps and eliminate these challenging contaminants, which should also be evaluated along with other technologies, such as the use of catalysts and other materials, such as red mud, which have proven efficient for the removal of SO2 and NOx [,]. Different AOPs are widely used for water treatment because they generate significant alterations in the chemical structures of pollutants. Their main benefit is their use under near-ambient conditions. Another advantage is the generation of powerful oxidizing hydroxyl radicals. The treatment methods evaluated in the present investigation were electrocoagulation with zinc electrodes (EC), electro-oxidation with boron-doped diamond electrodes (BDD), and ozonation. Zinc anodes have proven to be efficient, positioning themselves as a more feasible material option than Fe and Al for both technical and economic reasons [].
Thus, in this work, different methods (electrocoagulation (EC), electro-oxidation (EO), ozonation (O3), and a combined electrooxidation-ozonation method (EO-O3)) have been proposed to eliminate emerging contaminants present in sunscreens, and two of them (arbitrarily called Type A and Type B, see below) have been studied as examples. Currently, there are very few studies on the degradation of sunscreen components. This research proposes methods that significantly degrade the components without causing toxicity, as demonstrated through a toxicity study.
2. Materials and Methods
2.1. Electrochemical Characterization
The 10- and 100-ppm sunscreen aqueous solutions were used as working solutions in 0.01 M dibasic potassium phosphate (Analytical Reagent Fermont 98%) as the supporting electrolyte. The 0.01 M K2HPO4 electrolyte was selected because it provided the proper conductivity for the electrochemical reactor and the basic pH for the ozone to react via •OH radicals.
2.2. Electrochemical System
We performed all experiments in a 1000-mL conventional cylindrical reactor (Own manufacture) with an internal diameter of 5 cm and a height of 43 cm. The working solutions contained Type A and Type B commercial sunscreens, tap water, and an analytical reagent grade supporting electrolyte. All experiments were performed at atmospheric temperature and pressure conditions. The combined method was the only one that required the use of a jacket that covered the reactor to maintain a constant temperature. The contents of the commercial sunscreens are listed in Table 1, ordered according to their proportions.

Table 1.
Description of the main active ingredients in each sunscreen type used in this investigation.
2.3. Electrode Preparation for Electrocoagulation
Electrocoagulation was performed using two electrodes in a bipolar arrangement: a zinc anode and an aluminum cathode, with a separation of 1 between the two electrodes. The working surfaces of these electrodes were mechanically polished using sandpaper with two different grit sizes (initially medium-grain sandpaper and then fine-grain sandpaper). A current of 1.0 A was used.
The reactions involved in the electrocoagulation process are shown in Figure 1.
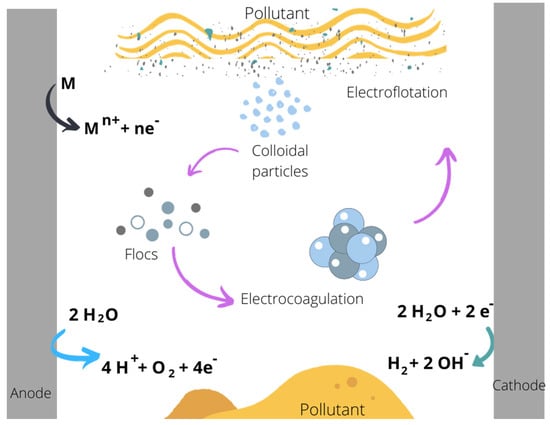
Figure 1.
Reactions occurring during electrocoagulation. (Diagram done in Canva Inicio-Canva).
2.4. Electrode Preparation for Electro-Oxidation
For the responses during electro-oxidation, two BDD electrodes on a CONDIAS brand niobium base (Berlin, Germany), 2.5 cm wide by 20 cm long, were placed 1 cm apart. They were chemically treated with a 0.1 M sulfuric acid solution (H2SO4) (Analytical Reagent, Meyer 95–98%). The corresponding reactions are shown in Figure 2. Both systems (EC and EO) use a similar connection to the power supply (Nice Power, Longgang, Shenzhen). A current of 1.0 A was applied to a 1-L capacity reactor (Own manufacture), with an internal diameter of 5 cm and a height of 43 cm), as shown in Figure 3. The nature of the electrodes used in both methods is different, as described earlier.
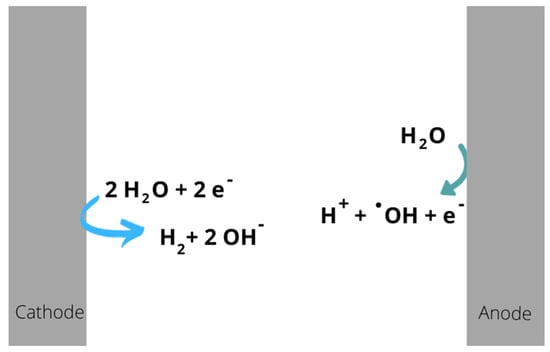
Figure 2.
Reactions that occur during electro-oxidation. (Diagram done in Canva Inicio—Canva).
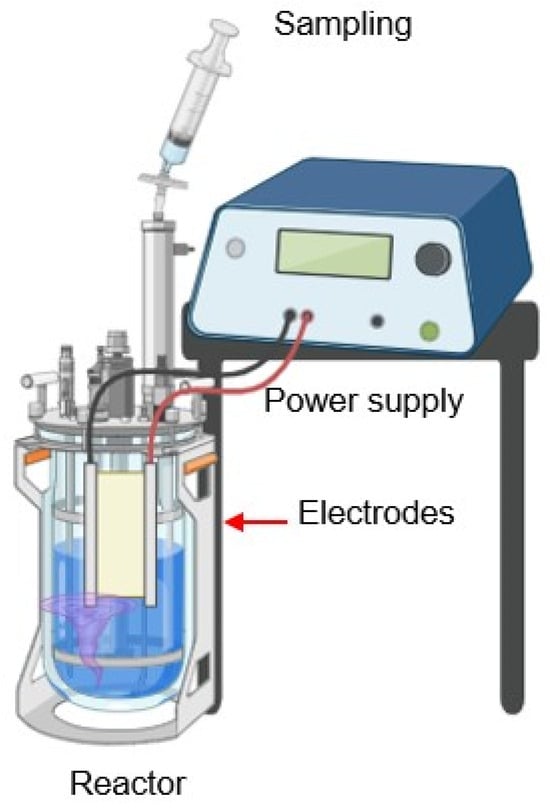
Figure 3.
System construction for electrocoagulation and electro-oxidation. (Done in Biorender, https://www.biorender.com/).
2.5. Ozonation
For the ozone treatment, the experiments were performed in an up-flow bubble column reactor with a 60-cm tall column and 20-cm internal diameter (Own manufacture). The reactor works with the injection of an O3 gas stream, which rises and passes through a stone diffuser that uniformly distributes the ozone in the liquid phase, achieving a high mass transfer efficiency. The system is shown in Figure 4. Ozone was generated from the air in a Pacific Ocean Technology model LAB 21 d41202 (CA, USA), crown-type generator with a regulated airflow of 8 SCHF. Ozone entered through porous glass with a pore size of 2 µm at a flow rate of 0.05 L/min, with a percentage of ozone generation of 90%. The outlet at the top of the reactor directed any ozone excess toward a Pyrex glass trap, where it was broken down by an ozone destructor. The thermal catalytic method catalyzes the conversion of ozone to oxygen without consumables. Here, the off-gas is heated and then passed through a bed of catalyst that converts ozone into oxygen.
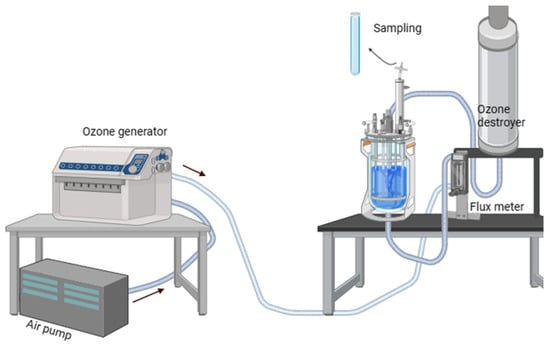
Figure 4.
System components of the ozonation reactor. The diagram was created using Biorender (https://www.biorender.com/).
2.6. Parameters Used to Verify Progress by Treatment
Chemical Oxygen Demand and Total Organic Carbon
The Chemical Oxygen Demand (COD) and Total Organic Carbon (TOC) were measured for the samples obtained during the different treatments to verify the decrease in organic content, as the sunscreens used are essentially organic in nature. A 1-mL sample was used per COD tube and read on the Perkin Elmer UV/Vis Lambda 365 (Shelton, USA). A Shimadzu TOC-L device was used for TOC measurements.
The percentage of COD removal was calculated using the following equation []:
where
- r.e. = removal efficiency
- i = initial conditions
- a.t. = after treatment
2.7. Physicochemical Parameters
pH
The pH was monitored every 15 min during treatment using an OAKTON model 35631-60 Potentiometer (MA, USA).
2.8. Electrical Conductivity
Conductivity measurements were performed every 5 min using a HANNA Meterlab ION 450 conductivity meter (Mexico City, Mexico).
2.9. Turbidity
Turbidity units were read by visible spectrophotometry using a HACH model DR/4000U spectrophotometer (Colorado, USA) at a wavelength of 860 nm, comparing the sample absorbance to a standardized reference for the method assigned to the HACH spectrophotometer. The readings were recorded every 5 min.
2.10. Phytotoxicity Tests
Culture dishes (i.e., Petri dishes) containing 6 mL of the test sample and twenty seeds of lettuce (Lactuca sativa) seeds were placed in an incubator in the dark at a constant temperature for 5 days (exposure time) for germination. The operational definition of seed germination was a visible root. The percentages of relative seed germination (RSG), relative radicle growth (RRG), relative hypocotyl growth (RHG), and germination index (GI) were determined after exposure according to the following equations: The hypocotyl and radicle are shown in Figure 5.
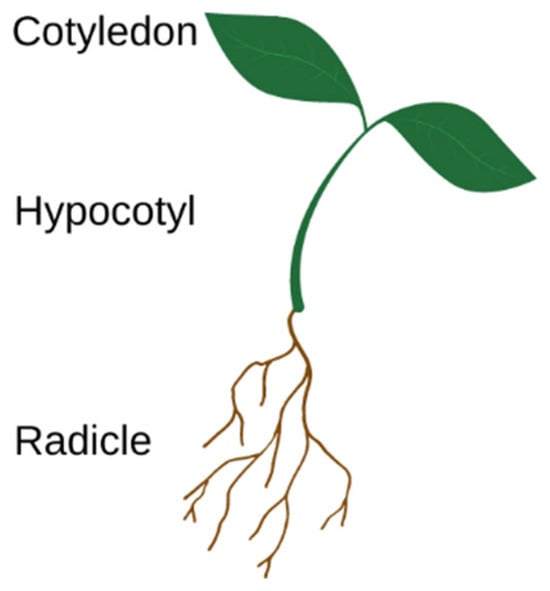
Figure 5.
Germinated seed parts. (Diagram done in Canva Inicio—Canva).
3. Results
3.1. Electrocoagulation of 100-ppm Sunscreen Solutions
The electrocoagulation process was performed in a 1.0 L cylindrical reactor for 1.0 h at 1.0 A with constant stirring for both sunscreens (Type A and Type B) with a sun protection factor (SPF) of 50. Based on our preliminary results, a 0.01 M supporting electrolyte was used in all cases. Physicochemical parameters, such as pH, electrical conductivity, and turbidity, were monitored. The values shown in Figure 6 and Figure 7 show the pH variations for the 100-ppm Type A and Type B sunscreen solutions, respectively.
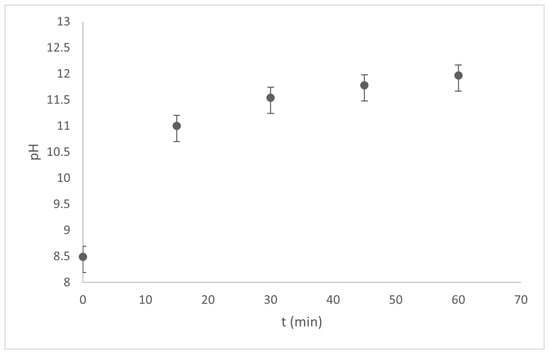
Figure 6.
pH vs time variations during the EC process of Type A sunscreen solutions.
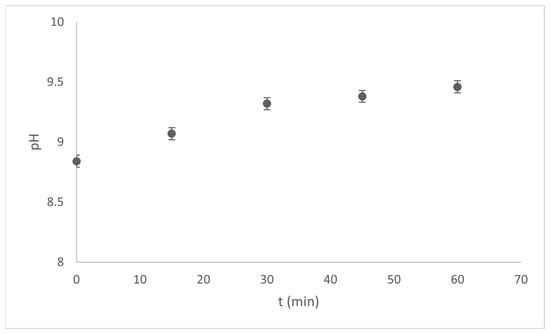
Figure 7.
pH vs time variations during the EC process of Type B sunscreen solutions.
The sample absorbances were measured using a UV-Vis spectrophotometer (HACH DR/4000U, Colorado, USA), and the results are shown in Figure 8 and Figure 9. The wavelengths tested were from 200 to 900 nm, but since no changes were observed above 350 nm, the figures show only the information from 200 to 400 nm, where UV filters can be read. The results between the variations in Figure 8 and Figure 9 are significant because they depend on the components present in both sunscreens; see Table 1.
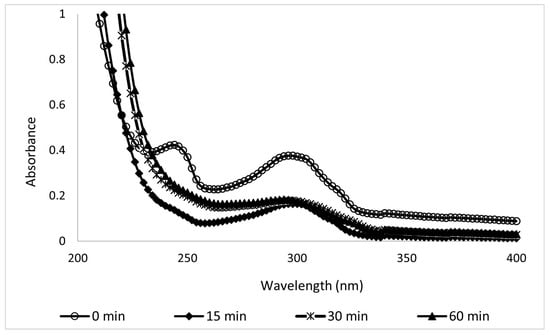
Figure 8.
UV spectra of 100-ppm samples of Type A sunscreen collected during the EC process at different electrolysis times.
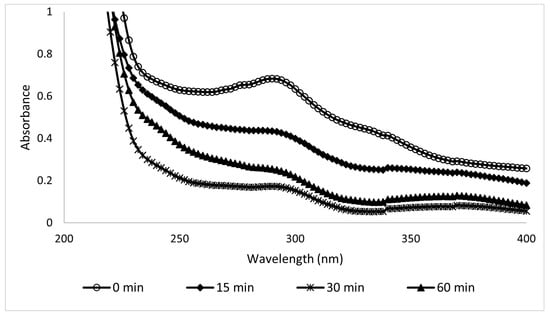
Figure 9.
UV spectra of 100-ppm samples of Type B sunscreen collected during the EC process.
3.2. Treatment of 10-ppm Sunscreen Solutions
3.2.1. Turbidity
Figure 10 shows the turbidity changes occurring during the different treatments applied to Type A sunscreen solutions, and Figure 11 shows the turbidity changes during the treatments applied to Type B sunscreen.
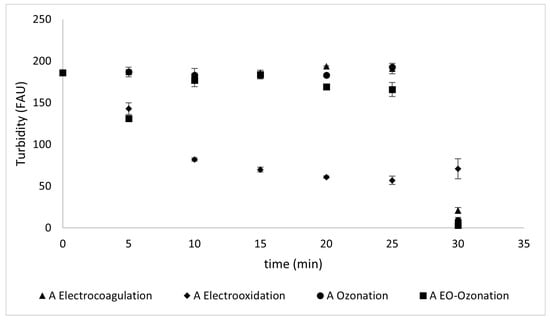
Figure 10.
Turbidity values reflected during different treatments of Type A sunscreen solutions.
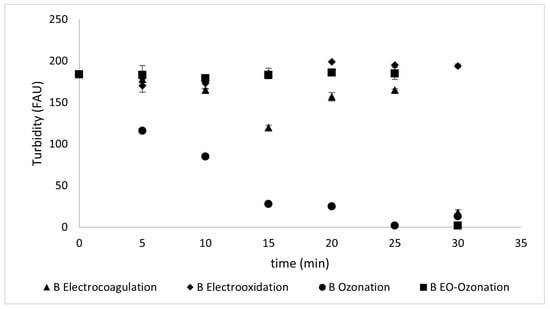
Figure 11.
Turbidity values reflected during different treatments of Type B sunscreen solutions.
Electrocoagulation achieved a decrease in turbidity of 89 ± 3% for the Type A 92 ± 2% for the Type B sunscreen solutions at 30 min. Electro-oxidation, unlike electrocoagulation, was not effective in reducing turbidity, as it removed only 62 ± 3% of the turbidity in both Type A and Type B sunscreen solutions.
Unlike the other removal methods that maintain constant turbidity values for the initial 30 min and then show a decrease, ozonation is the only method in which a gradual decrease can be observed until turbidity is reduced by 95.2% ± 2.8 for Type A and 98.9% ± 0.6 for Type B sunscreen solutions. The combined method was the most successful for both protectors, with a 98.4 ± 2.7% for Type A and 98.9 ± 0.5% removal for Type B solutions.
3.2.2. Conductivity
The conductivity values remained almost constant during the treatment time, as shown in Figure 12 and Figure 13.
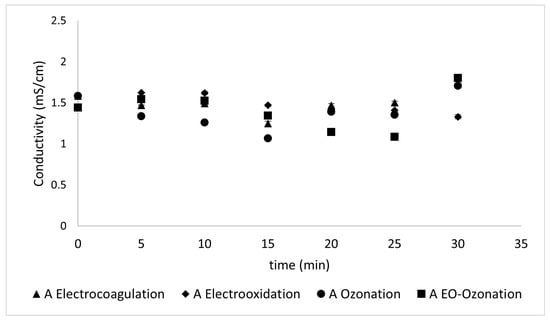
Figure 12.
The conductivity values reflected during the different treatments of Type A sunscreen.
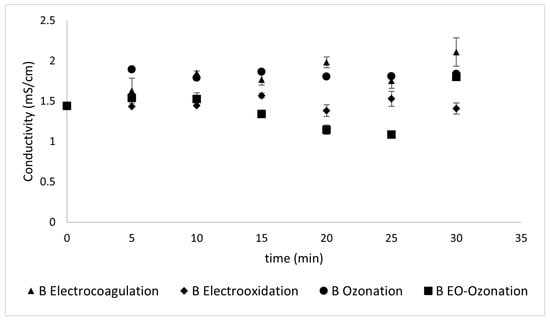
Figure 13.
The conductivity values reflected during the different treatments of Type B sunscreen.
3.2.3. pH
The variations in pH monitored during the different treatments to which the samples were subjected did not show significant variations. As observed in Figure 14 and Figure 15, the pH variation between the treatments for both sunscreens was within a range of ± 0.5 from the initial pH. This may be due to the different conditions applied and their effect on the complex mixture of components in each sunscreen.
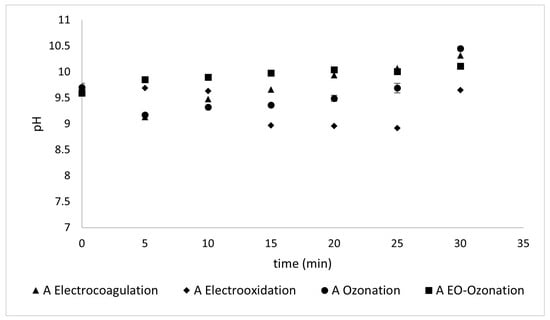
Figure 14.
The pH values reflected during the different treatments of Type A sunscreen.
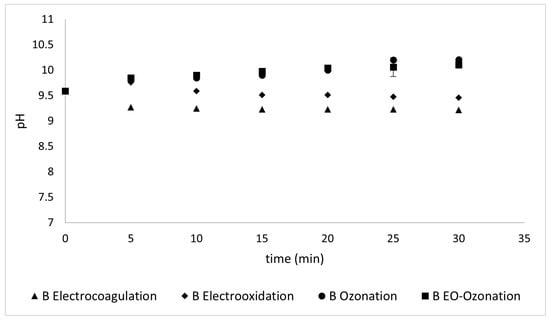
Figure 15.
pH values reflected during different treatments of Type B sunscreen.
3.2.4. UV-Vis
The removal of organic contaminants was also monitored using UV-Vis spectrophotometry, expecting that the main peak shown would decrease as a function of treatment time. Decreasing the concentration of sunscreen had consequences, unlike in the previous graphs, since stability was lost, and the reading of the samples was not clear since the peaks were fainter. The graphical method shown in Figure 16 was used to determine the kinetic order of the overall elimination process. To determine the kinetic order of the overall reaction, the most appropriate result was obtained as pseudo-first-order since the R2 was close to 0.9.
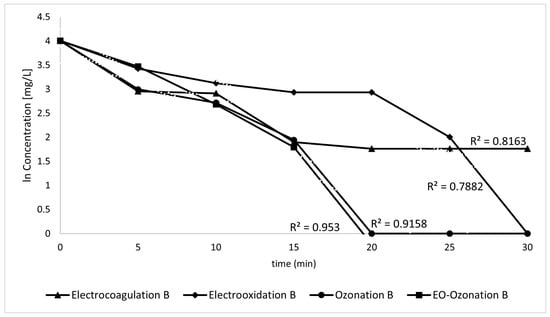
Figure 16.
Graph to determine the reaction kinetics.
Electrocoagulation
The UV-Vis readings of the Type A samples taken during electrocoagulation presented a high dispersion, and it was difficult to draw conclusions from them, as shown in Figure 17. Figure 18 shows the visible spectra of the Type B sunscreen solution during EC treatment. This led to a kinetic constant of k = −0.73 s−1.
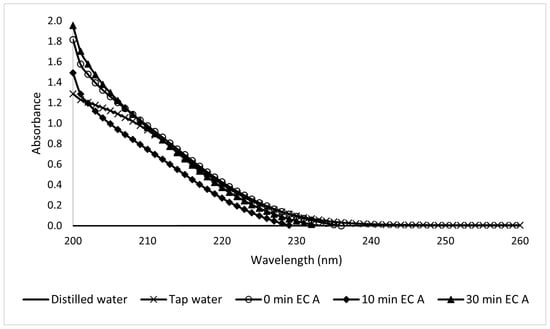
Figure 17.
Ultraviolet spectra analysis of 10-ppm Type A sunscreen samples taken during the EC process at different electrolytic times.
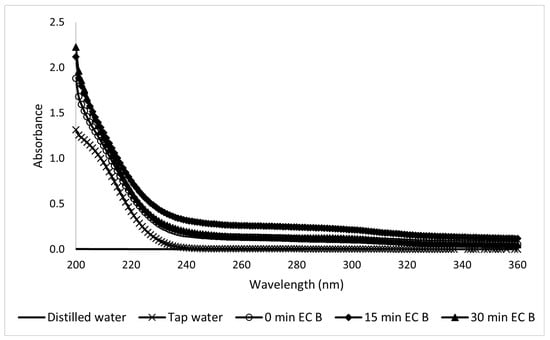
Figure 18.
Ultraviolet spectra analysis of 10-ppm Type B sunscreen samples taken during the EC process at different electrolytic times.
Electro-Oxidation
In the UV region spectra of the Type A samples taken during electro-oxidation, the peaks decreased as the treatment progressed (Figure 19). This reflects a decrease in the concentration as a function of time. Electro-oxidation is efficient for the degradation of contaminants since it can generate peroxides at the cathode. The UV spectra of the Type B sunscreen solutions during electro-oxidation are shown in Figure 20. Unlike the previous case, these show more dispersion, making it difficult to reach conclusions. The corresponding kinetic constant is k = −0.41 s−1.
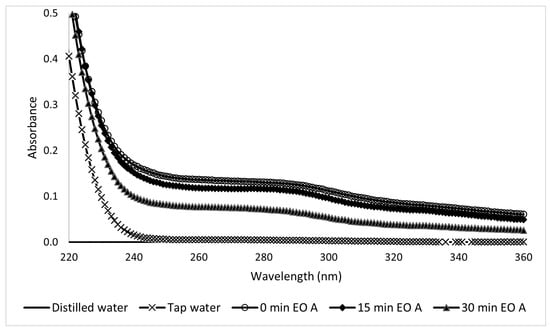
Figure 19.
Ultraviolet spectra of 10-ppm Type A sunscreen samples taken during the EO process at different electrolytic times.
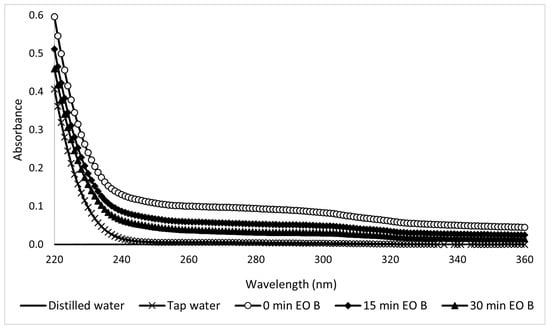
Figure 20.
Ultraviolet spectra of 10-ppm Type B sunscreen samples taken during the EO process at different electrolytic times.
Ozone
In the ozone treatment study, the UV spectra of Type A (Figure 21) and Type B (Figure 22) solutions showed considerable dispersion that hindered a definitive analysis. The Type B results are slightly more readable and lead to a kinetic constant k = −0.46 s−1.
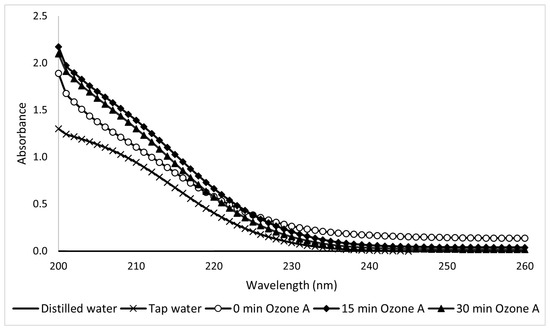
Figure 21.
Ultraviolet spectra of 10-ppm Type A sunscreen samples taken during ozonation at different electrolytic times.
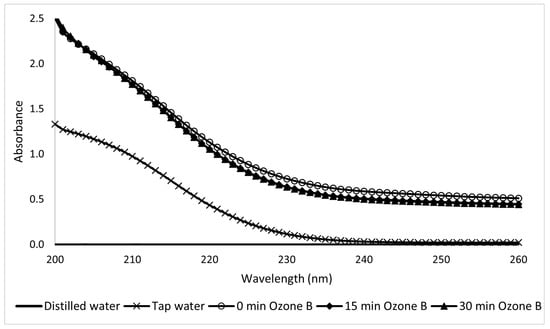
Figure 22.
Ultraviolet spectra of 10-ppm Type B sunscreen samples taken during ozonation at different electrolytic times.
EO-O3
The UV-Vis analysis of the coupled method applied to Type A samples was clearer than in the previous analysis and provided more compelling data with a significant change from the first 5 min of its application. This test clearly reflects how the coupled system yields positive results, which can be observed as a peak decrease in Figure 23. The peak values are listed in Table 2.
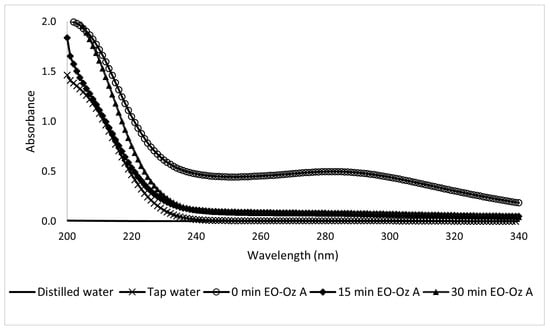
Figure 23.
Ultraviolet spectra of 10-ppm Type A sunscreen samples taken during the EO-O3 process at different electrolytic times.
Table 2.
Peak values as a function of time at 296 nm.
The coupled method applied to the Type B sunscreen yielded UV-Vis spectra that were more difficult to read, with a kinetic constant value of k = 0.93 s−1 (Figure 24).
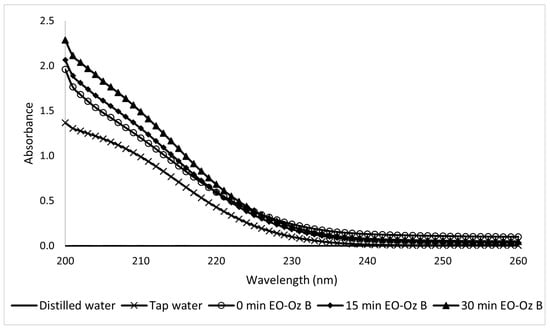
Figure 24.
Ultraviolet spectra of 10-ppm Type B sunscreen samples taken during the EO-O3 process at different electrolytic times.
3.2.5. Removal Analysis Based on COD and TOC
We performed Chemical Oxygen Demand (COD) tests to ensure that the degradation was successful for all treatments, starting at 150 ppm. After 15 min, the COD was no longer detectable within the sensitivity of the method, which is an indicator of compliance with the reduction of the organic load.
Table 3 shows the percentage of COD removal for each treatment method. Very high removal percentages were obtained. With a 10-ppm sunscreen concentration, the EC method for Type B reached a maximum removal of 88.5% after 20 min. With the EO method, a 62.8% removal occurred after 20 min, and an essentially 100% removal was achieved at ~30 min. Both the ozone and combined methods achieved 100% and 99.1% removal at 20 min, respectively.
Table 3.
Type B sunscreen solution degradation according to COD removal (%) as a function of time.
The total organic carbon (TOC) removal for Type A is shown in Figure 25. Here, unlike in the Type B case, most treatment methods were not effective at this concentration. Only the combined method achieved a removal percentage greater than 75.0% (i.e., 80.8% removal).
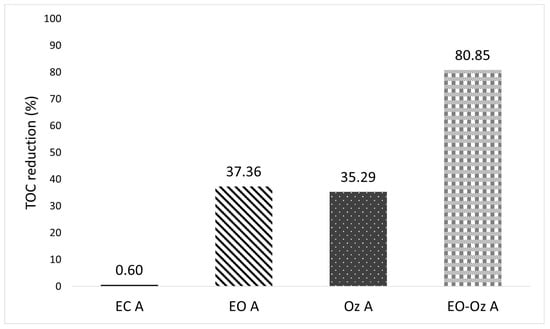
Figure 25.
Percentage of TOC reduction of Type A solutions according to each of the evaluated treatments.
3.2.6. Pool Water Treatment
A sample of pool water was collected from a spa hotel in the west of the State of Morelos, Mexico, and characterized. The initial conditions were a low turbidity of 1 FAU, pH of 8.06, and conductivity of 1.409 mS/cm. By diluting 1.0 mL of the pool water sample with 2.0 mL of distilled water, the reading could be made on the UV-Vis spectrophotometer scale. As the best results in the previous section were obtained using the coupled method, it was selected for the pool water treatment. The results are presented in Table 4 and Figure 26.
Table 4.
Percentage of COD removal using the EO-O3 coupled treatment for pool water.
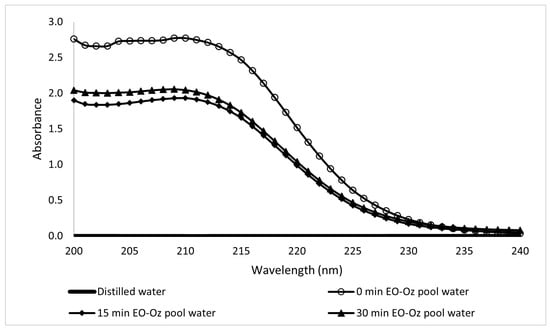
Figure 26.
Ultraviolet spectra of pool water samples after EO-O3 coupled treatment at different electrolytic times.
3.2.7. Toxicity Bioassays
Bioassays using lettuce seeds were used to assess acute toxicity and evaluate the phytotoxic effects on the development of seedlings. Lactuca sativa is commonly used for bioassays due to its sensitivity []. The responses of different samples were compared to the control solution under the same humidity, light, and temperature conditions to determine the presence of toxins in the medium. These are diagnostic tools used to observe the effects of external agents. They require zinc sensitivity testing with ZnSO4.
The bioassay employed here was a short-term toxicity test of root extension. It is a static test performed for 120 h of exposure, observing the effects on the radicle and hypocotyl. This is especially recommended for soluble compounds that are found at very low concentrations since such concentrations may not affect germination but may slow or inhibit the growth of the hypocotyl or root.
Organic Lactuca sativa common lettuce seeds (Figure 27 and Figure 28) were selected after counting more than 700 seeds and measuring each one of them to hand-pick the 660 seeds that were within the average measurements, thus guaranteeing equality of initial conditions. Using a Vernier scale, an average length of 5.03 mm and a width of 1.32 mm were observed, with standard deviations of 0.34 and 0.12 mm, respectively.
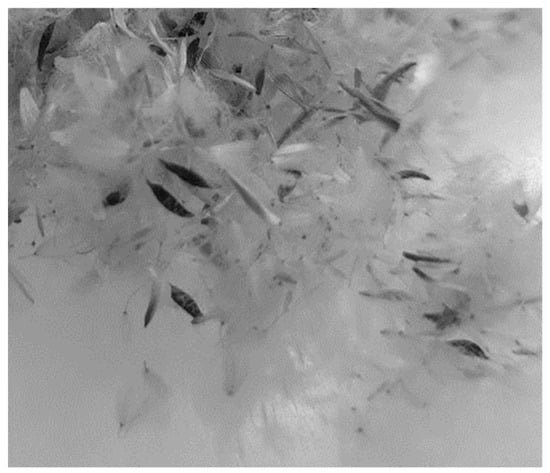
Figure 27.
Organic lettuce seeds.
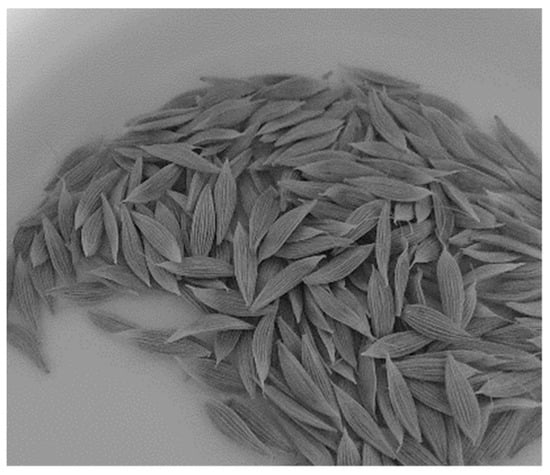
Figure 28.
Clean organic seeds.
From the selected seeds, a triplicate test was performed on paper impregnated with 6 mL of the liquid that was used for the samples and controls, with 20 seeds in each Petri dish distributed evenly in the same direction (Figure 29) and incubated in the dark for 5 days at 20–22 °C. After the incubation period, the average root length was measured and recorded.
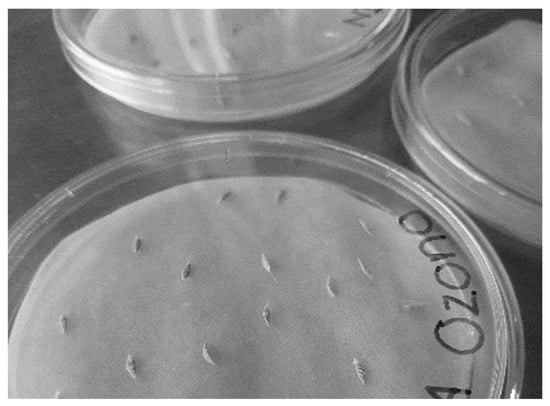
Figure 29.
Clean seeds in Petri dishes.
Germination was considered to have occurred at a growth of 3 mm. The average growth in a ZnSO4 solution for the radicle was 10.28 mm, and the hypocotyl was 9.26 mm, with the germination percentage shown in Table 5.
Table 5.
Germination percentage according to zinc concentration.
Lettuce seeds had a high germination percentage (98.3%) with distilled water (DW), thus efficiently complying with what was established to be considered adequate (i.e., greater than 90% and a radicle length of 33.83 mm with a standard deviation of 1.45), while the other controls had a length of 7.56 mm and 13.14 mm for ZnSO4 (ZS) and K2HPO4 (KP) solutions, respectively, with a variation of 1.47 and 0.78. The average germination percentages were 98.3%, 81.6%, and 90% in DW, ZS, and KP, respectively. According to the phytotoxicity parameters, a solution is considered toxic if the germination percentage is between 75 and 90%. The germination results for the different solutions are shown in Table 6. Qualitative characteristics are also important for toxicity analysis. Even though some radicles were shorter after treatment, hypocotyl length and qualitative characteristics also need to be considered. Both sunscreens after the EO-O3 treatment had ticker and stronger radicles than before the treatment. Photographs of the results for distilled water are shown in Figure 30; seeds after electrocoagulation treatment are shown in Figure 31; seeds after electro-oxidation treatment are shown in Figure 32; seeds after ozonation treatment are shown in Figure 33, and seeds after electrooxidation-ozonation treatment are shown in Figure 34.
Table 6.
Quantitative and qualitative germination results.
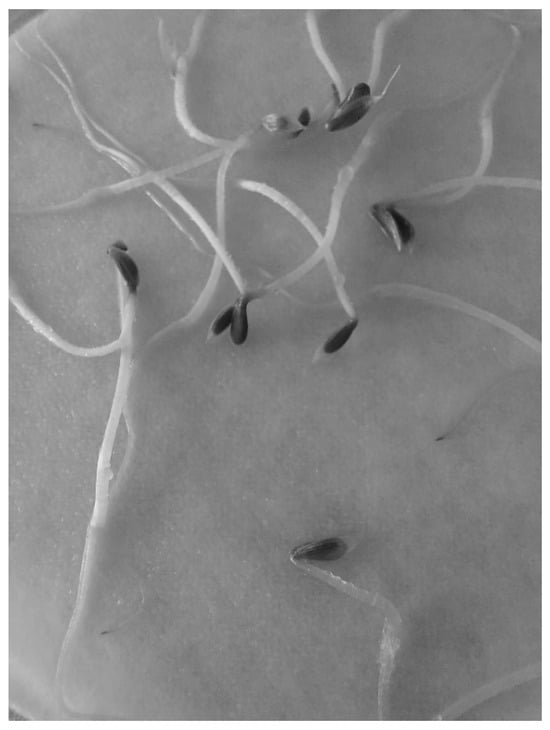
Figure 30.
Germination of lettuce seeds with distilled water.
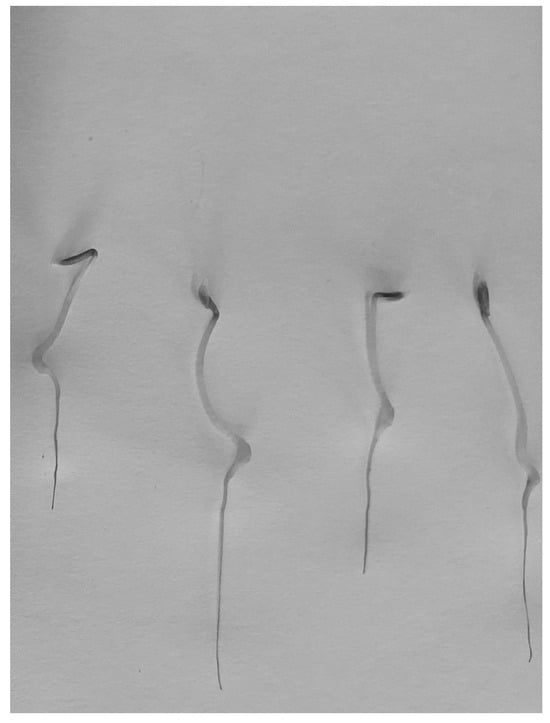
Figure 31.
Germination of lettuce seeds after electrocoagulation treatment.
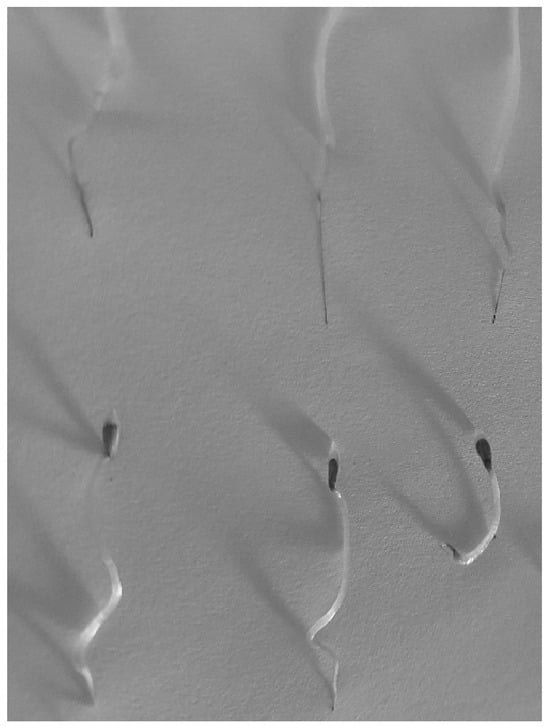
Figure 32.
Germination of lettuce seeds after electro-oxidation treatment.
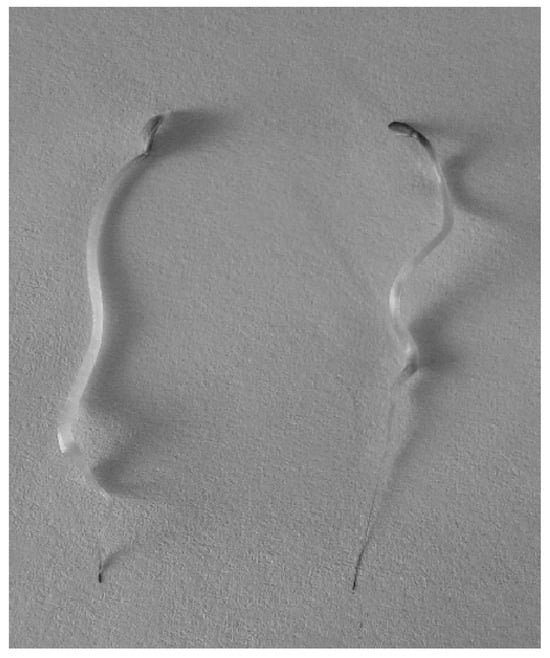
Figure 33.
Germination of lettuce seeds after ozonation treatment.

Figure 34.
Germination of lettuce seeds after electro-oxidation-ozonation treatment.
The inhibition of radicle growth, on the other hand, indicates sublethal levels of toxicity as it is a more sensitive parameter than the germination percentage. If the growth of the radicle was less than 50% of the average in the control, then it was considered a toxic compound. The average radicle in the control is indicated by the red dashed line and 50% of the average by the black dashed line. All radicles with K2HPO4 were below the value of 50% DW, indicating toxicity from phosphate (Figure 35). Using these results, the relative seed germination percentage (RSG), relative growth of the radicle (RRG), relative growth of the hypocotyl (RHG), and germination index (GI) were calculated according to Equations (5)–(8).
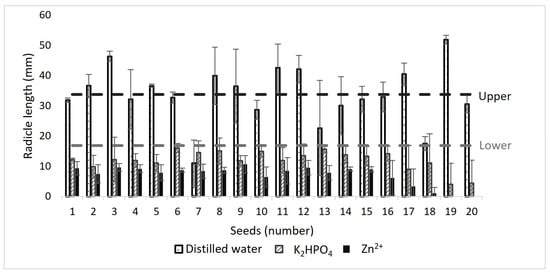
Figure 35.
Bioassay results using controls.
GI values (%) close to zero indicate high toxicity (H), values below 50% indicate moderate toxicity (M), and values close to 100% indicate low toxicity (L). Controls were performed with distilled water, a solution of tap water with 0.1 M K2HPO4, and a positive control of ZnSO4). All results were obtained and calculated in triplicate (Figure 36).
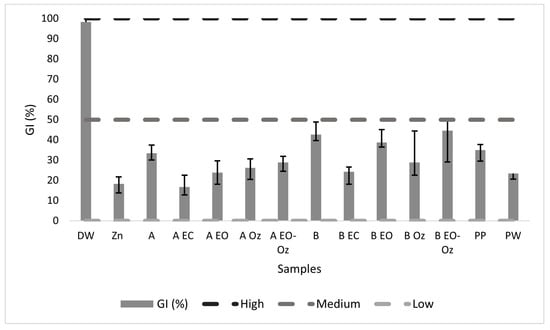
Figure 36.
Bioassay results, GI (%) as a function of treatment. DW: Distilled water; PP: potassium phosphate; PW: pool water.
The bioassays were performed in triplicate, and the average values are shown in Table 7.
Table 7.
Results of bioassays.
4. Discussion
This study is the first to evaluate electrochemical methods for the removal of sunscreen from aqueous media. The lack of literature data regarding the electrochemical treatment of these pollutants makes it impossible to compare the results with those of other studies. The comparison was mainly made between the initial samples and those during the treatment process. This research was inspired by articles in which electrochemical processes were applied for the removal of contaminants of emerging concern.
The pH increase could favor the overall process as it was caused by the accumulation of OH− ions resulting from the reduction process. Therefore, pH values are indirect indicators of the process efficiency. pH changes can be beneficial, unimportant, or problematic during coagulation. Although the effects of pH on EC reactions have not been completely understood, they can be explained by two different mechanisms: ion exchange among hydroxide complexes or the stripping of dissolved carbonate due to the hydrogen bubbles released in the cathode [], which is derived from the interaction between CO2 dissolved in the medium and the hydrogen bubbles produced at the cathode.
The sample absorbance measured using a UV-Vis spectrophotometer decreased as a function of time. This reflects the elimination of chemical species that provide electromagnetic information.
Turbidity is a function of dissolved nutrients and solids in the water. High turbidity can indicate high levels of disease-causing organisms []. Electro-oxidation yielded a constant decrease in turbidity, while electrocoagulation, ozonation, and electrooxidation-ozonation maintained a constant turbidity for up to 30 min, where the three decreased abruptly, signaling flocculation and settlement.
Electrocoagulation has a high potential to reduce turbidity, although the reaction with the coagulant takes some time at the beginning. Once the reactions that allow the generation of OH− have developed, leading to the formation of flocs, the H2 produced allows the lighter flocs to float and the heavier flocs to precipitate. This translated into the apparent preservation of turbidity, which subsequently decreased (Figure 10 and Figure 11).
The mechanism by which ozone decreases turbidity is that it increases the mass transfer coefficient. An increase in the gaseous ozone flow is expected to result in an increase in the ozone concentration, which improves ozone mass transfer, the main driving force of which is the concentration difference at the gas-liquid interphase []. Colloidal particles are responsible for turbidity, and negatively charged particles keep them in suspension. Since ozone destroys colloidal matter by oxidizing surrounding organic materials, this reduces the repulsion forces that exist among particles and keeps them suspended. The hydrodynamics of the system were favored by the ozone flow. The bubbles produced during ozonation increase contact with the contaminant, thus achieving their integration and, therefore, the disintegration of the emulsion. Electro-oxidation generates peroxides that enhance efficiency. As shown in Figure 10 and Figure 11, the results are highly reproducible since, in some cases, the standard deviation is smaller than the marker point.
The conductivity values did not change substantially with the different treatments. This is likely because of their relatively small initial values. Conductivity values remained almost constant during the treatment time, as shown in Figure 12 and Figure 13. These results, unlike those at higher concentrations of both the sunscreen and the supporting electrolyte (where the fluctuations were greater), remained practically constant, with minimal changes in their values and somewhat unstable. This can be explained by the low concentration of contaminants. The different chemical compositions of the two sunscreens offer an opportunity for comparison. Despite starting with similar conductivity values (i.e., 1.6 and 1.5 for Types A and B, respectively), their conductivity behaviors, although similar, displayed significant differences. While both sunscreens contain octocrylene, Type B–unlike Type A– contains homosalate, whose structure offers an extra barrier during removal and explains the resistance it offers in the first minutes, and later remains with a maximum variation of ± 0.2 mS/cm.
The use of BDD electrodes slightly reduced the conductivity. This may be because, while in electro-oxidation, anodic reactions occur that generate radicals and superphosphates, the cathodic reactions generate ⦁OH radicals and peroxides at the BDD electrodes. However, these reactions were not generated here significantly, and thus, the variations in conductivity did not reflect considerable differences.
The concentration of the supporting electrolyte played a fundamental role. When tests were performed with a higher concentration of the supporting electrolyte, no significant changes in turbidity were observed. A significant decrease in turbidity was observed using 0.1 M KP. At this concentration, the flocs need to acquire a certain size to settle. Turbidity changes with the number of suspended solids. In addition, during EC, the electrodes passivate, thus affecting the removal percentage.
pH is the most important physicochemical parameter for controlling the behavior of acid-base, solubility, and oxide-reduction reactions in aquatic systems that influence water quality. This is directly related to the presence of metals in water. According to the parameters established by the World Health Organization, water must have a pH value between 6.5 and 8.5 to be suitable for human consumption.
The following analysis compares the two sunscreens. Both samples had the same initial pH value ( 9.59). High pH values may favor ion precipitation during electrocoagulation since they start at around 9.5 and reach a maximum of 10.5, as shown in Figure 15 and Figure 16. Even though this is a modest change, such an increase may occur because carbonates are generated during electro-oxidation and ozonation [].
A peculiar phenomenon occurs with Type A sunscreen. All treatment methods decreased the electrical conductivity after 15 min, although in different proportions, and after this time, their behavior began to vary from one method to another. This can be attributed to the time required for floc precipitation. Only the methods that involve electro-oxidation conductivity continue to decrease, although the change is not statistically significant according to the calculation of the standard deviations shown in Figure 14 and Figure 15.
First-order, pseudo-first-order, second-order, pseudo-second-order, and third-order possible kinetics were evaluated. The best approximation turned out to be that for the first order, although the correlation coefficients are somewhat low. This difficulty in ascertaining the kinetics may be due to the complexity of the matrix, which results in the lack of a precise trend in the data. Other simultaneous reactions that were not considered in the model may have occurred simultaneously. The kinetic constants were calculated from the values of the UV-Vis spectra using the following first-order kinetic Equation (9):
Electrocoagulation showed satisfactory degradation of contaminants, which was evident even in the first 15 min of application. A few minutes after passing an electric current through the electrodes, a significant change in the appearance of the water was observed, which was clearly reflected in the COD tests, where after 15 min, it was no longer detectable within the sensitivity of the method. This indicates a major decrease in organic load. The absorption spectra support this, where a contamination remnant of 43.6% is observed in the case of the Type B sunscreen solutions at 15 min and only 25.2% at 30 min in the case of Type A sunscreen solutions.
Therefore, the EC method has proven to be an effective step to fit into treatment trains that would help degrade not only sunscreens but also other types of emerging contaminants and would require a second method to remove the remainder. The initial concentrations of Type A and Type B determined a suitable method of analysis to follow up on the removal of the contaminants. While both sunscreens could be effectively evaluated using the COD method at 100 ppm, Type A required a more sensitive method for its concentration to be detected and its removal monitoring at 10 ppm. Therefore, the reaction time was reduced to 30 min for both sunscreens at the same 10-ppm concentration. The subsequent results were obtained with a standard deviation of less than 2%. These results suggest that the last two methods are quite effective, and other factors must be considered to discern which of these would be ideal for treatment.
5. Conclusions
A laboratory model was assembled for the degradation of synthetic sunscreen solutions in aqueous media centered on the use of electrocoagulation, advanced oxidation processes, and ozonation. The results were analyzed based on the TOC and COD of the two selected organic sunscreens. The four treatment processes showed good responses in terms of degradation, with higher sunscreen concentrations yielding better removals. However, evaluation at lower concentrations is necessary since these are often found at the nanogram scale in real systems. Even at first sight, the changes were evident, but the evaluation of each treatment was performed based on changes in physicochemical parameters. The spectrophotometric results were more evident for some treatment technologies than for others. Toxicity studies demonstrated that the evaluated treatment methods did not result in increased toxicity.
Bioassays helped demonstrate the toxicity changes in the treated sunscreen-contaminated water. Synergy in the EO-O3 treatment was satisfactory from all points of view, also resulting in a lower toxicity index than those shown by the rest of the treatment methods. This provided a highly effective removal method for each evaluation. Close to 100% removal was achieved after 20 min for both sunscreen solutions. In view of these results, the EO-O3 treatment was applied to pool water, achieving a COD removal of 79.5% after 15 min. This percentage is an indicator of adequate removal in this complex system, although further tests are required to determine the possible degradation products of the same. The toxicities after the EO and O3 treatments for Type A sunscreen are similar to those of the sunscreen alone before treatment. This is likely due to the addition of dibasic phosphate to the problem water since it was added in the treatment methods but not in the evaluation of the isolated sunscreen. K2HPO4 is a possible major contributor to toxicity. In the case of Type B, there was a small decrease in toxicity according to the germination index.
All treatment methods displayed high efficiency for the degradation of Type B sunscreen solutions. Along with the increase in pH, the ability to degrade the complex system increased. For Type A treatment, the best method involved the use of ozone. Overall, the best treatment method was the combined EO-O3 (with a 99.1% removal for Type B and 88.8% for Type A), according to the analysis of COD and TOC. Further development concerns octocrylene, the main active ingredient in sunscreens, with the following aims: (a) to evaluate it in isolation with the same treatments, (b) to understand whether it exhibits the same behavior alone as commercial sunscreen presentations, and (c) to examine the nature of its degradation products.
Author Contributions
Conceptualization, S.A.B. and P.B.-H.; methodology, S.A.B.; validation, P.B.-H., G.R.-M. and J.G.I.; formal analysis, J.G.I.; investigation, P.B.-H.; resources, P.B.-H.; data curation, S.A.B.; writing—original draft preparation, S.A.B.; writing—review and editing, P.B.-H.; visualization, S.A.B.; supervision, J.G.I.; project administration, G.R.-M.; funding acquisition, P.B.-H. All authors have read and agreed to the published version of the manuscript.
Funding
This research was funded by CONAHCyT, grant number 798589, for the maintenance of the fellow, which allowed the research to be carried out. And UAEMéx (Project: 7267/2025CIB and 7158/2024ECON)
Data Availability Statement
The original contributions presented in this study are included in the article. Further inquiries can be directed to the corresponding authors.
Conflicts of Interest
The authors declare no conflicts of interest. The funders had no role in the design of the study; in the collection, analyses, or interpretation of data; in the writing of the manuscript; or in the decision to publish the results.
Abbreviations
The following abbreviations are used in this manuscript:
| AOPs | Advanced oxidation processes |
| BDD | Boron-doped diamond electrodes |
| COD | Chemical Oxygen Demand |
| DO | Dissolved oxygen |
| EC | Electrocoagulation |
| EO | Electrooxidation |
References
- Kumar, R.; Qureshi, M.; Vishwakarma, D.K.; Al-Ansari, N.; Kuriqi, A.; Elbeltagi, A.; Saraswat, A. A Review on Emerging Water Contaminants and the Application of Sustainable Removal Technologies. Case Stud. Chem. Environ. Eng. 2022, 6, 100219. [Google Scholar] [CrossRef]
- Medici, A.; Saviano, L.; Siciliano, A.; Libralato, G.; Guida, M.; Previtera, L.; Di Fabio, G.; Zarrelli, A. Octocrylene: From Sunscreens to the Degradation Pathway during Chlorination Processes: Formation of Byproducts and Their Ecotoxicity Assessment. Molecules 2022, 27, 5286. [Google Scholar] [CrossRef] [PubMed]
- Duis, K.; Junker, T.; Coors, A. Review of the Environmental Fate and Effects of Two UV Filter Substances Used in Cosmetic Products. Sci. Total Environ. 2022, 808, 151931. [Google Scholar] [CrossRef] [PubMed]
- Tran, H.-T.; Dang, B.-T.; Thuy, L.T.T.; Hoang, H.-G.; Bui, X.-T.; Le, V.-G.; Lin, C.; Nguyen, M.-K.; Nguyen, K.-Q.; Nguyen, P.-T.; et al. Advanced Treatment Technologies for the Removal of Organic Chemical Sunscreens from Wastewater: A Review. Curr. Pollut. Rep. 2022, 8, 288–302. [Google Scholar] [CrossRef]
- Pawlowski, S.; Petersen-Thiery, M. Sustainable Sunscreens: A Challenge Between Performance, Animal Testing Ban, and Human and Environmental Safety. In Sunscreens in Coastal Ecosystems: Occurrence, Behavior, Effect and Risk; Tovar-Sánchez, A., Sánchez-Quiles, D., Blasco, J., Eds.; Springer International Publishing: Cham, Switzerland, 2020; pp. 185–207. ISBN 978-3-030-56077-5. [Google Scholar]
- Thomas, T.; Fat, M.; Kearns, G. Sunscreens: Potential Hazards to Environmental and Human Health. Front. Mar. Sci. 2024, 11, 1471574. [Google Scholar] [CrossRef]
- Boyd, A.; Stewart, C.B.; Philibert, D.A.; How, Z.T.; El-Din, M.G.; Tierney, K.B.; Blewett, T.A. A Burning Issue: The Effect of Organic Ultraviolet Filter Exposure on the Behaviour and Physiology of Daphnia Magna. Sci. Total Environ. 2021, 750, 141707. [Google Scholar] [CrossRef]
- He, T.; Tsui, M.M.P.; Tan, C.J.; Ma, C.Y.; Yiu, S.K.F.; Wang, L.H.; Chen, T.H.; Fan, T.Y.; Lam, P.K.S.; Murphy, M.B. Toxicological Effects of Two Organic Ultraviolet Filters and a Related Commercial Sunscreen Product in Adult Corals. Environ. Pollut. 2019, 245, 462–471. [Google Scholar] [CrossRef]
- Kim, M.A.; Jung, Y.C.; Bae, J.; Ha, J.; Kim, E. Layering Sunscreen with Facial Makeup Enhances Its Sun Protection Factor under Real-Use Conditions. Skin Res. Technol. 2021, 27, 751–757. [Google Scholar] [CrossRef]
- Lebaron, P. UV Filters and Their Impact on Marine Life: State of the Science, Data Gaps, and next Steps. J. Eur. Acad. Dermatol. Venereol. 2022, 36, 22–28. [Google Scholar] [CrossRef]
- NOAA Skincare Chemicals and Coral Reefs. Available online: https://oceanservice.noaa.gov/news/sunscreen-corals.html (accessed on 20 December 2024).
- Miller, I.B.; Pawlowski, S.; Kellermann, M.Y.; Petersen-Thiery, M.; Moeller, M.; Nietzer, S.; Schupp, P.J. Toxic Effects of UV Filters from Sunscreens on Coral Reefs Revisited: Regulatory Aspects for “Reef Safe” Products. Environ. Sci. Eur. 2021, 33, 74. [Google Scholar] [CrossRef]
- Cadena-Aizaga, M.I.; Montesdeoca-Esponda, S.; Torres-Padrón, M.E.; Sosa-Ferrera, Z.; Santana-Rodríguez, J.J. Organic UV Filters in Marine Environments: An Update of Analytical Methodologies, Occurrence and Distribution. Trends Environ. Anal. Chem. 2020, 25, e00079. [Google Scholar] [CrossRef]
- Angrish, A.; Kumar, R.; Chauhan, R.; Sharma, V. On the IR Spectroscopy and Chemometric Based Rapid and Non-Destructive Method for the Investigation of Sunscreen Stains: Application in Forensic Science. Spectrochim. Acta A Mol. Biomol. Spectrosc. 2020, 242, 118708. [Google Scholar] [CrossRef]
- García-Márquez, M.G.; Rodríguez-Castañeda, J.C.; Agawin, N.S.R. Effects of the Sunscreen Ultraviolet Filter Oxybenzone (Benzophenone-3) on the Seagrass Posidonia Oceanica (L.) Delile and Its Associated N2 Fixers. Sci. Total Environ. 2024, 918, 170751. [Google Scholar] [CrossRef] [PubMed]
- Hernández-Pedraza, M.; Caballero-Vázquez, J.A.; Peniche-Pérez, J.C.; Pérez-Legaspi, I.A.; Casas-Beltran, D.A.; Alvarado-Flores, J. Toxicity and Hazards of Biodegradable and Non-Biodegradable Sunscreens to Aquatic Life of Quintana Roo, Mexico. Sustainability 2020, 12, 3270. [Google Scholar] [CrossRef]
- Labille, J.; Slomberg, D.; Catalano, R.; Robert, S.; Apers-Tremelo, M.L.; Boudenne, J.L.; Manasfi, T.; Radakovitch, O. Assessing UV Filter Inputs into Beach Waters during Recreational Activity: A Field Study of Three French Mediterranean Beaches from Consumer Survey to Water Analysis. Sci. Total Environ. 2020, 706, 136010. [Google Scholar] [CrossRef] [PubMed]
- Downs, C.A.; DiNardo, J.C.; Stien, D.; Rodrigues, A.M.S.; Lebaron, P. Benzophenone Accumulates over Time from the Degradation of Octocrylene in Commercial Sunscreen Products. Chem. Res. Toxicol. 2021, 34, 1046–1054. [Google Scholar] [CrossRef] [PubMed]
- Varrella, S.; Danovaro, R.; Corinaldesi, C. Assessing the Eco-Compatibility of New Generation Sunscreen Products through a Combined Microscopic-Molecular Approach. Environ. Pollut. 2022, 314, 120212. [Google Scholar] [CrossRef]
- Downs, C.A.; Diaz-Cruz, M.S.; White, W.T.; Rice, M.; Jim, L.; Punihaole, C.; Dant, M.; Gautam, K.; Woodley, C.M.; Walsh, K.O.; et al. Beach Showers as Sources of Contamination for Sunscreen Pollution in Marine Protected Areas and Areas of Intensive Beach Tourism in Hawaii, USA. J. Hazard. Mater. 2022, 438, 129546. [Google Scholar] [CrossRef]
- Downs, C.A.; Akerlof, K.L.; Stien, D.; Rodrigues, A.M.S.; Diaz-Cruz, M.S.; Quintana, G.; Fulton, D. Sunscreen Pollution Is Abated during the COVID-19 “Anthropause” of 2020 in Two U.S. National Parks: Cape Lookout National Seashore and Kaloko-Honokōhau National Historical Park. J. Sea Res. 2024, 200, 102510. [Google Scholar] [CrossRef]
- Fivenson, D.; Sabzevari, N.; Qiblawi, S.; Blitz, J.; Norton, B.B.; Norton, S.A. Sunscreens: UV Filters to Protect Us: Part 2-Increasing Awareness of UV Filters and Their Potential Toxicities to Us and Our Environment. Int. J. Womens Dermatol. 2021, 7, 45–69. [Google Scholar] [CrossRef]
- Labille, J.; Catalano, R.; Slomberg, D.; Motellier, S.; Pinsino, A.; Hennebert, P.; Santaella, C.; Bartolomei, V. Assessing Sunscreen Lifecycle to Minimize Environmental Risk Posed by Nanoparticulate UV-Filters—A Review for Safer-by-Design Products. Front. Env. Sci. 2020, 8, 101. [Google Scholar] [CrossRef]
- Vidal-Liñán, L.; Villaverde-de-Sáa, E.; Rodil, R.; Quintana, J.B.; Beiras, R. Bioaccumulation of UV Filters in Mytilus Galloprovincialis Mussel. Chemosphere 2018, 190, 267–271. [Google Scholar] [CrossRef]
- Yamada, M.; Mohammed, Y.; Prow, T.W. Advances and Controversies in Studying Sunscreen Delivery and Toxicity. Adv. Drug Deliv. Rev. 2020, 153, 72–86. [Google Scholar] [CrossRef]
- Rafeletou, A.; Niemi, J.V.L.; Lagunas-Rangel, F.A.; Liu, W.; Kudłak, B.; Schiöth, H.B. The Exposure to UV Filters: Prevalence, Effects, Possible Molecular Mechanisms of Action and Interactions within Mixtures. Sci. Total Environ. 2024, 928, 170999. [Google Scholar] [CrossRef] [PubMed]
- Wang, Y.; Li, B.; Cui, Y.; Du, Y.; Yu, Z.; Zhang, L.; Ning, Z.; Sun, X.; Li, J.; Tang, X.; et al. Catalytic Mechanism of Nanocrystalline and Amorphous Matrix in Fe-Based Microwires for Advanced Oxidation. Adv. Funct. Mater. 2025. [Google Scholar] [CrossRef]
- Li, B.; Wu, H.; Liu, X.; Zhu, T.; Liu, F.; Zhao, X. Simultaneous Removal of SO2 and NO Using a Novel Method with Red Mud as Absorbent Combined with O3 Oxidation. J. Hazard. Mater. 2020, 392, 122270. [Google Scholar] [CrossRef]
- Medvidović, N.V.; Vrsalović, L.; Svilović, S.; Bilušić, A.; Jozić, D. Electrocoagulation Treatment of Compost Leachate Using Aluminium Alloy, Carbon Steel and Zinc Anode. Appl. Surf. Sci. Adv. 2023, 15, 100404. [Google Scholar] [CrossRef]
- Syaichurrozi, I.; Sarto, S.; Sediawan, W.B.; Hidayat, M. Effect of Current and Initial PH on Electrocoagulation in Treating the Distillery Spent Wash with Very High Pollutant Content. Water 2021, 13, 11. [Google Scholar] [CrossRef]
- Vieira, C.; Marcon, C.; Droste, A. Phytotoxic and Cytogenotoxic Assessment of Glyphosate on Lactuca sativa L. Braz. J. Biol. 2024, 84, e257039. [Google Scholar] [CrossRef]
- Weiss, S.F.; Christensen, M.L.; Jørgensen, M.K. Mechanisms behind pH Changes during Electrocoagulation. AIChE J. 2021, 67, e17384. [Google Scholar] [CrossRef]
- Omoni, V.; Torjir, D.; Okekporo, S. Studies on the Physicochemical and Bacteriological Properties of Some Semi-Public Swimming Pools in Makurdi, Nigeria. Afr. J. Microbiol. Res. 2019, 13, 264–272. [Google Scholar] [CrossRef]
- Wang, B.; Zhang, H.; Meng, Q.; Ren, H.; Xiong, M.; Gao, C. The Enhancement of Ozone-Liquid Mass Transfer Performance in a PTFE Hollow Fiber Membrane Contactor Using Ultrasound as a Catalyzer. RSC Adv. 2021, 11, 14017–14028. [Google Scholar] [CrossRef] [PubMed]
- Du, X.; Mo, Z.; Li, Z.; Zhang, W.; Luo, Y.; Nie, J.; Wang, Z.; Liang, H. Boron-Doped Diamond (BDD) Electro-Oxidation Coupled with Nanofiltration for Secondary Wastewater Treatment: Antibiotics Degradation and Biofouling. Environ. Int. 2021, 146, 106291. [Google Scholar] [CrossRef] [PubMed]
Disclaimer/Publisher’s Note: The statements, opinions and data contained in all publications are solely those of the individual author(s) and contributor(s) and not of MDPI and/or the editor(s). MDPI and/or the editor(s) disclaim responsibility for any injury to people or property resulting from any ideas, methods, instructions or products referred to in the content. |
© 2025 by the authors. Licensee MDPI, Basel, Switzerland. This article is an open access article distributed under the terms and conditions of the Creative Commons Attribution (CC BY) license (https://creativecommons.org/licenses/by/4.0/).